supplementary appendix - the lancet€¦ · supplementary appendix ... intensive home-visitation...
TRANSCRIPT

Supplementary appendixThis appendix formed part of the original submission and has been peer reviewed. We post it as supplied by the authors.
Supplement to: Robling M, Bekkers M-J, Bell K, et al. Effectiveness of a nurse-led intensive home-visitation programme for first-time teenage mothers (Building Blocks): a pragmatic randomised controlled trial. Lancet 2015; published online Oct 14. http://dx.doi.org/10.1016/S0140-6736(15)00392-X.

1
Appendix: Supplementary materials to Building Blocks trial report Contents 1. Study investigators and contributors ..................................................................................... 2 2. Acknowledgements ............................................................................................................... 4 3. Description of intervention, adaptation, nurse recruitment and training, and site selection .. 5 4. Construction of primary outcome variables and selected secondary outcomes ..................... 7
(i) Prenatal tobacco use ....................................................................................................... 7 (ii) Subsequent pregnancy .................................................................................................... 9 (iii) Emergency attendances and admissions for children ................................................. 10 (iv) Cognitive Development ................................................................................................ 10 (v) Language Development ................................................................................................ 11 (vii) Use of routine data in this trial ................................................................................... 11 (viii) Maternal reported data in this trial ........................................................................... 13
5. Full listing of secondary trial outcomes and when assessed ................................................ 14 6. Sensitivity analyses for tobacco use and second pregnancy ................................................ 16 7. Narrative description of secondary outcomes results .......................................................... 17
Pregnancy and birth ........................................................................................................... 28 Child health and development ............................................................................................ 28 Parental life-course ............................................................................................................ 28
8. Representativeness of study sample .................................................................................... 30 9. Assessment of loss to follow-up – self-report at 24 months ................................................ 31 10. Attrition to primary smoking analysis ............................................................................... 34 11. Delivery of FNP against program fidelity goals ................................................................ 37 12. Withdrawals and adverse events ....................................................................................... 40 13. Bibliography for included outcome measures ................................................................... 41

2
1. Study investigators and contributors Lead researcher/Chief Investigator Dr Mike Robling Reader and Co-Director, South East Wales Trials Unit, Cardiff University. Trial methodologist and psychologist, overall lead for study design, funding, implementation, data analysis and reporting. Overall guarantor for study. Co-Investigators Professor Christopher C Butler, Professor of Primary Care, University of Oxford, Nuffield Department of Primary Care Health Sciences and Cardiff University, Institute of Primary Care and Public Health. Chair Management Group, contributed to study design, implementation, interpretation, and writing the report. Professor Alison Kemp, Clinical Professor in Child Health, Cardiff University. Contributed to child health aspects of the trial, and writing the report. Professor Joyce Kenkre, Professor of Primary Care, University of South Wales. Contributed to PPI aspect of the trial, and writing the report. Professor Alan A Montgomery, Professor of Medical Statistics and Clinical Trials, Nottingham Clinical Trials Unit, The University of Nottingham. Contributed to medical statistics and trial methods, funding, study design, data analysis and reporting. Professor Kate E Pickett, Professor of Epidemiology, University of York. Social epidemiologist, responsibility for measurement, in particular the measurement of smoking and social covariates and writing the report. Professor David Torgerson, Director of the York Trials Unit, Department of Health Sciences, University of York. Health Economics. Responsible for overseeing the economic analysis, and writing the report. Core Project Team members Katy Addison, Trial Administrator, South East Wales Trials Unit, MITI coding. Dr Marie-Jet Bekkers, Researcher, South East Wales Trials Unit. Contributed to all components of the Process Evaluation, and writing the report. Kerry Bell, Research Fellow, Department of Health Sciences, University of York, Health Economics. Responsible for the within trial analysis, all aspects of the secondary trial analysis and writing the final report. Dr Kristina Bennert, Researcher, University of Bristol, Contributed to the Process Evaluation, and writing the report. Dr Rebecca Cannings-John, Research Fellow in Statistics, South East Wales Trials Unit Cardiff University. Trial Statistician, and writing the report. Belen Corbacho Martin, Research Fellow, Department of Health Sciences, University of York, Health Economics. Within trial economic analysis and extrapolation work, including the systematic review, and writing the report. Dr Sue Channon, Consultant Clinical Psychologist, Cardiff and Vale University Health Board. Clinical Psychology, Process Evaluation lead including Parent-Child Interaction, and writing the report. Professor John W Gregory, Professor in Paediatric Endocrinology and Honorary Consultant Paediatrician, Cardiff University. Contributed to study design, interpretation of results (birth weight data and other paediatric outcomes), and writing the report. Professor Kerry Hood, Co-Director, South East Wales Trials Unit, Cardiff University. Senior trial management, and writing the report. Professor Lesley Lowes, Florence Nightingale Foundation Chair of Clinical Nursing Practice Research, School of Healthcare Sciences, Cardiff University. Member stakeholder involvement work package. Gwenllian Moody, Data Manager, South East Wales Trials Unit, Cardiff University, Trial data manager, and writing the report. Dr Eleri Owen-Jones, Trial Manager, South East Wales Trials Unit Cardiff University. Trial manager, and writing the report. Dr Gerry Richardson, Senior Research Fellow, Centre for Health Economics, University of York, Health Economics. Responsible for the design of the economic analysis/questionnaires, overseeing all aspects of the economic analysis, and writing the report. Dr Zoë E S Roberts, Lecturer in Medical Statistics, Cardiff University. Trial statistician, and writing the report. Sarah Ronaldson, Research Fellow, Department of Health Sciences, University of York, Health Economics. Responsible for the within trial economic analysis, extrapolation work, and writing the report. Dr Julia Sanders, Senior Clinical Research Fellow and Consultant Midwife, South East Wales Trials Unit, Cardiff University. Study implementation, management, interpretation and writing the report. Eugena Stamuli, Research Fellow, Department of Health Sciences, University of York. Responsible for the discrete choice experiment, and all aspects of the economic analysis and writing the report. Jackie Swain, Trial Administrator, South East Wales Trials Unit Cardiff University.

3
Collaborators Lily Bidmead, Involving People, Lay member stakeholder involvement work package Dr Kamila Hawthorne, Member stakeholder involvement work package Professor Alastair Hay, Primary care advice and input Roiyah Saltus, Lay member stakeholder involvement work package Dr Lesley Wye, Member Process Evaluation work package In addition, the following researchers made significant contributions to authoring the indicated chapter: Dr Kristina Bennert, Dr Nina Gobat Chapter 12: Stakeholders’ views on barriers and facilitators. Short-term research team members Process evaluation assistance: Dr Michelle Edwards, Cathy Lisles, Dr Sarah Morgan-Trimmer, Dr Claire O’Neill, Dr Ria Poole, Hayley Prout. Statistical assistance: Dr Chao Huang, David Gillespie, Mandy Lau, Laura Robinson. Maternal child interaction coding: Eugenia Baibazarova (trainer), Kali Barawi, Laura Dewar, Azmat Iqbal, Alice Spiby. Fidelity assessment: Dr Simon Braybrook. Administrative support: Kerry Fuery, Rhys Thomas. Chair data extraction task group: Dr Shantini Paranjothy. Telephone interviewers from the Participant Resource Centre, Cardiff University: Truda Bell, Carol O'Byrne, Hilary Campbell, Judith Colwill, Dena Evans, Sarah Evans, Hayley Gardiner, Maggie Gregory Jessica Gilbert, Harriett Hurford, Carly Johnson, Maggie Lynn, Rumana Malik, Emma Martin, Cathryn Pritchard, Laura Roach, Susan Thomas, Sara Watkin, Ann White, Andrea Whittle, Omar Yasseen. We acknowledge the contribution of SEWTU staff who provided invaluable support to the study, particularly the Information Systems team (Gareth Watson, Mike Buck, Vince Poile) and also from Neil Taylor, Department of Computer Science, Aberystwyth University. Trial Steering Committee Independent Members Professor Ann Louise Kinmonth, Professor of Primary Care, Cambridge University (Chair); Dr Silvia van den Heijkant, Youth Healthcare Physician, EMGO+ Institute for Health and Care Research, VU University Medical Center, Department of Public and Occupational Health, Amsterdam; Pamela Park, Parenting UK; Professor Stavros Petrou, Professor of Health Economics University of Warwick; Rachel Tonkin, Parenting UK. Data Monitoring Committee Independent Members Dr Gordon Taylor, University of Bath (Chair); Lucy Akhtar, Children in Wales; Dr Sara Kenyon, Senior Lecturer in Public Health, Epidemiology and Biostatistics, University of Birmingham. We would like to pay a special tribute to Professor Paul Wainwright (Kingston University and St George's, University of London) who was the initial Chair of the Data Monitoring Committee and who tragically died in 2010. Paul was an early and important friend to the research team. His personable and supportive leadership of the DMC was hugely appreciated and we feel fortunate to have had the benefit of his contribution during the critical early stages of setting up and opening the study. Principal investigators at study sites Barnsley: Sue Gibson, Anne Lewis; Berkshire East: Andrea Anderson, Melvyn Dunstall, Julia Love, Linda Saynor; Cornwall: Alison Cook, Helen Ross-McGill; Coventry: John Forde, Stephen Keay; Cumbria: Sarah Cooper, Sue Knowles, Anne Musgrave, Angela Oxley; Derby: Julia Savage, Chris Tully; Hull: Christine Davey, Stephen Lindow; Lambeth: Kate Brintworth, Yinglen Butt, Amanda Williams; Leeds: Jane Mischenko, Julie Scarfe; Liverpool: Jan McColgan, Helen Scholfield; Manchester: Trish Devey, Leroy Edozien, Gbemisola Okunoye, Eileen Stringer; Vanda Wellock; Northampton: Sharon Toyer; South Birmingham: Donna Darbyshire, Jenny Henry; South East Essex: Sarah St-Pierre, Liz Glenister; Southwark: Barbara Hills, Nina Khazaezadeh; Sunderland: Diane Jones, Kim Hinshaw; Tower Hamlets: Sonia Stewart, Deanne Gibbs, Karen Plumb; Walsall: Lin Gostling, David Shakespeare. Local researchers Barnsley: Jacqui Ford, Debbie Hardy; Berkshire East: Wendy Bishop-Suitters, Carrie Grainger, Barbara Williams; Cornwall: Kim Arnell, Anna Fouracres, Lynne Graves, Mary Kirkpatrick, Sue Mackay; Coventry: Angela Bradley, Sue Buswell, Joanne Duffy, Kate Field, Karen Hotchkiss, Deborah Kirkan; Cumbria: Margaret Brunton, Julie Butler, Nicci Kelsall, Jackie Purcell, Gillian Pilkington; Derby: Pauline Darbyshire, Jill

4
Smith; Hull: Helen Bexhell, Teresa Doto, Sarah Ford; Lambeth and Southwark: Nellie Daura, Yvonne Evans; Leeds: Jane Hayes; Liverpool: Kathryn Cobain, Kate Franks, Emma McCurry, Sue Thompson, Lorna Wood; Manchester: Nicola Bamford, Alex Hodges, Jane Roach, Cara Taylor, Kathy Unsworth; Northampton: Justine Hill,Anbar Nazir, Joanne Woodward; South Birmingham: Pauline Darbyshire, Chloe O'Hara; Sarah Hooper; South East Essex: Vicky Goater, Victoria Katsande, Teresa Smith; Sunderland: Dawn Edmundson, Trish Wake; Tower Hamlets: Tracy Lavelle, Clare Wilson; Walsall: Nona Giurici, Diane Mellers. 2. Acknowledgements The authors would like to thank: Members of the FNP National Unit for their support and advice throughout the study: Kate Billingham, Former FNP National Director; Sam Mason, FNP Research and Development Lead; Anne Rowe, FNP Implementation lead; Ailsa Swarbrick, FNP Policy and programme lead; Kim Williamson, FNP Principal Quality Improvement Analysis. Staff of the Department of Health Policy Research Programme Central Commissioning Facility for ongoing support: Zoltan Bozoky, Senior Principal Research Officer; Karla Duarte, Alison Elderfield, Simon Mitchell, Florence Therberge, Programme Managers. Stakeholder Input. We are grateful for the contribution of the lay and professional stakeholders to the study for their invaluable contribution
• Members of the Books and Babies group: Lyndsey Rodda, Lowry Cleaver, Samantha Loveridge, Georgia Jackson, Samantha Bevan, Kirsty Collinson, Joanne Nicholls, Amy George, Jade Noble, Angharad Phillips, Jolene Slattery, Rhian Buckley, Rhiannon Jones, Charmaine Jakeways, Melissa Evans, Sarah Howells and Joy Starling, who facilitated the group.
• Members of Young Mums, Crumlin: Young Mums Project Crumlin: Libby Akin, Kersty Fudge, Sophie Davies, Nia Davies and youth workers, Melanie Davies and Hannah Smith.
• Stakeholder reference group: Maggie Pledger, Alison Cherry, Nicola Jones, Carol Daniel
Colleagues from the Centre for Health Economics, University of York: Chris Bojke, Rita Santos, Andrew Street and Katja Grasic for their advice on HES data; Steve Palmer for his advice on extrapolation; Bernard van den Berg for his input on the discrete choice experiment; Lu Han (Dept of Health Sciences, University of York) for data extraction of the extrapolation systematic review and Lisa Stirk (Centre for Reviews and Dissemination, University of York) for designing and undertaking the systematic review search. The Primary Care Services of the NHS Wales Shared Services Partnership, for assistance with NHS number matching. John Illingworth and Sue MacKay, Clinical Development & Support Services Ltd, for research nurse support. Corinne Scott, NISCHR Research Ethics Service Operational Manager, for ongoing advice. We are grateful for the support received from various UK Clinical Research Networks and to the lead NHS organisation for the study, Birmingham & the Black Country Comprehensive Local Research Network. Funding and Institutional support: This is an independent report commissioned and funded by the Policy Research Programme in the Department of Health. The views expressed are not necessarily those of the Department. The South East Wales Trials Unit is funded by the Wales Assembly Government through Health and Care Research Wales and the authors gratefully acknowledge SEWTU’s contribution to study implementation. We thank all those not mentioned above who have contributed to the Building Blocks Study.

5
3. Description of intervention, adaptation, nurse recruitment and training, and site selection
Intervention description
Overview: The Nurse Family Partnership (NFP) program was developed in the US to address the problems of poor birth outcomes, social exclusion, child abuse and neglect, and diminished economic self-sufficiency of socially disadvantaged younger first time mothers. The NFP is a structured, intensive program of home visits delivered by specially trained nurses, provided from early pregnancy until the child is two years old.
Theoretical Model: The NFP draws upon theories of human ecology, self-efficacy and human attachment. Visits cover core content areas of personal and environmental health, life course development, maternal role, family and friends and access to health and social services. Time allocated to each content domain is prescribed by the program but also varies over the duration of the program. Maternal behaviour change is supported through the promotion of self-efficacy. Education and modelling activities are included in the program to promote sensitive and competent care giving via a strengths-based approach with the aim of reducing maltreatment.
Delivery structure: A scheduled maximum of 64 visits commence, ideally, early in the second trimester, and decrease in frequency over the first two years of the child’s life. Whilst actual number of visits received may vary by individual need, engagement, and gestational age at enrolment, minimum targets are specified to support desired program outcomes.
Goals: Program goals are to improve pregnancy outcomes, child health and development, including a reduction in child maltreatment, and an increase in maternal self-sufficiency.
Fidelity: Fidelity requirements on program recruitment and delivery are specified by the developers of the US program.
Staffing: Family Nurses are recruited from existing registrants on the Nursing Midwifery Council of the UK, mainly from Health Visiting but also from Nursing and Midwifery. Training in delivery of the program will be provided to the Family Nurses by the FNP central team
Programme adaptation
Adapting the programme for delivery in England as the Family Nurse Partnership involved adoption of young maternal age as a criterion for programme eligibility. This was selected as a proxy for low income and associated with long-term child outcomes that would be easily measurable in clinical practice. Programme materials were adapted to reflect a UK English speaking clientele. Three additional requirements for FNP as introduced in England were the provision of regular psychological support via specialist supervision to Family nurses, the provision of safeguarding supervision and systems and the incorporation of FNP into local clinical governance arrangements. Following a programme of model improvement particularly on client retention led by the Prevention Research Centre at the University of Colorado, Denver Motivational Interviewing was introduced as a core model element and a central part of the Family Nurse training when introduced in England. This aims for nurses to use a mainly guiding communication style with clients.
Nurse recruitment and training
Programme person specifications require Family nurses (Band 7) to have a nursing or midwifery qualification and be registered with the NMC and educated to degree level (or equivalent professional qualification). A master’s level education was desirable while the nurse was required to undertake specialist post graduate training and be assessed on competence following training. Supervisors (Band 8a) were similarly required to be nursing or midwifery qualified, NMC registered, be educated to degree level and also to be educated at master’s level. Licensing requires nurses to attend all elements of a core FNP learning programme, mostly in the first year of employment as a Family Nurse. Training modes included residential blocks (baseline, infancy and toddlerhood – a total of 12 days), team-based learning packs (e.g. for pregnancy, infancy, and specialist parenting and dyadic observational tools) and specialist master classes.

6
Site selection
The first wave of Family Nurse Partnership sites in England were asked to demonstrate strong partnership working and a high degree of NHS / Local Authority service integration, community engagement, commitment to progressive universalism, workforce capacity and capability, effective local leadership, a relevant demographic profile and capacity to identify families, IT capacity, a record of successful innovation, and a plan that demonstrated the capacity to deliver according to the proposed timetable. Successful sites were offered funding to deliver the FNP programme for one year provided the Primary Care Trusts (PCTs) / Local Authorities were committed to supporting the service until the clients’ children were 24 months old.
Potential sites formally applied to the Department of Health with a case summarising local clinical need, and the commitment to sustain FNP delivery by local consortia made up of local stakeholders, including Primary Care Trust (PCT), Acute Trust (AT) and Local Authority staff. Following 63 applications, ten were selected; two sites were established in London and one in each of the remaining Government Office regions. The first ten sites to offer FNP also undertook the implementation evaluation. During the second commissioning process to expand the number of FNP sites, sites were encouraged to express willingness to participate in the trial. Eight implementation evaluation sites took part in the trial and a further ten new sites were selected. At most cases FNP was delivered across the whole area covered by each PCT, but for some sites availability of the programme was restricted to particular areas within the PCT. NHS Trusts providing maternity services at each trial site were identified. Fourteen sites had one corresponding NHS Trust, three sites had two NHS Trusts, and one site had three NHS Trusts.

7
4. Construction of primary outcome variables and selected secondary outcomes
(i) Prenatal tobacco use A calibrated measure of number of cigarettes smoked per day at baseline and late pregnancy was calculated using a combination of urinary cotinine results and self-reported number of cigarettes smoked per day. The calibration method was developed by Dukic and colleagues1 and used self-reported smoking data (number of cigarettes smoked on the three days prior to interview, time of last cigarette, hours since last cigarette) and urine cotinine levels collected at baseline and the late pregnancy interview, and also variables such as time of interview. A modified version of the Dukic method was developed in discussion with the author and is presented below:
Main procedure of calibrating the self-reported numbers of cigarettes with the participant’s cotinine level
1. The first step is to calculate the self reported weighted number of cigarettes ( selfN) based on the
participant’s last 3-day self-reports. In general, we adopt the scenario 2 of Dukic’s approach. We assume the urine samples were taken at the interview facility during the interview. We also assume that each woman voids in the morning at 7 am and 12 noon on the day of interview. Furthermore, we assume no voiding between 7 A.M. and the time of interview if the interview was before noon, and one voiding at noon if the interview was in the afternoon. In this scenario, we calculate the weight of each cigarette as the difference between the fraction of the cotinine from the cigarette that would be in the urine sample had the woman not voided at all prior to the interview, and the fraction that was actually in her urine whenever she last voided prior to the interview (at 7 A.M. or at noon). Formulae (A.7) to (A.9) in Dukic appendix are used. Moreover, if the participant has provided the smoking time of the last cigarette on the interview day, we will implement this information to adjust smoking time interval on the day of interview.
2. The second step is to calculate the weighted numbers of cigarettes ( cotN ) based on the participant’s cotinine level. Here we use 150 ng/ml per weighted cigarette as the standard which was recommended in Dukic’s paper [1].
3. The third step is to classify the participants into 4 reporting groups: over-reporter, accurate reporter,
under-reporter and extreme under-reporter, by comparing their cotN and selfN values.
Classify the woman as an over-reporter if
15.01cot −<−selfNN
, i.e., 85.0cot <selfNN
, 7225.0cot <selfNN
;
Classify the woman as an accurate reporter if
15.01cot <−selfNN
, i.e., 15.185.0 cot <<selfNN
, 3225.17225.0 cot <<selfNN
;
Classify the woman as an under-reporter if
35.0115.0 cot <−<selfNN
, i.e., 35.115.1 cot <<selfNN
, 8225.13225.1 cot <<selfNN
;
Classify the woman as an extreme under-reporter if
35.01cot >−selfNN
, i.e., 35.1cot >selfNN
, 8225.1cot >selfNN
.

8
4. If the participant reports zero cigarettes, i.e., selfN is zero, we use an alternative rule to make the classification. We propose to classify these participants according to their cotinine level: if their
cotinine level cotN is <=100ng/ml, they are classified as accurate reporters; if their cotinine level
cotN is >100ng/ml and <1000ng/ml, they are under reporter; and if their cotinine level cotN is >=1000ng/ml, they are extreme under reporter.
For participants in each reporting group, we then calculate the averaged differences between their weighted self-report number of cigarettes and weighted cotinine number of cigarettes. Then, for each participant, we use the averaged weighted difference of her reporting group to calibrate her mean number of cigarettes, where the averaged weighted difference will be transformed back to the actual number of the cigarette in line with the participant’s last-3-day self -report pattern.
The primary analysis of pre-natal tobacco use comprised two parts:
Part 1 The first part of the analysis used a binary variable (smoker or not) and compared the odds of being a smoker at late pregnancy follow-up in the FNP arm versus the usual care arm. The definition of a non-smoker was as follows:
• For those with self-report and cotinine data at both baseline and follow-up: a participant with self-reported zero cigarettes in the 3 days prior to interview and a follow-up cotinine level of <100 ng/ml.
• For those with self-report at baseline and follow-up but cotinine only at baseline: a participant with self-reported zero cigarettes in the 3 days prior to interview and baseline reporting behaviour classified as either accurate or over-reporter.
All other participants in the primary analysis dataset were classified as smokers.
The calibration method used baseline cotinine-self-report relationship to calibrate end of pregnancy self-report for those women who only had cotinine at baseline. Therefore, the number of cases included in the main analysis for this outcome exceeds the number for whom we obtained cotinine at follow-up. We undertook a sensitivity analysis that verified consistency of this relationship for the proportion of our sample who provided cotinine samples at both baseline and follow-up and also found that there was little variation between study group.
Part 2 The second part of the analysis assessed smoking as a continuous variable among those who were classified as a smoker in part 1. It compared the mean number of calibrated cigarettes smoked at late pregnancy follow-up between the trial arms. This analysis was based on a subset of randomised participants. Baseline characteristics of smokers were examined at follow up by trial arm, and in a secondary analysis further adjusted for variables that exhibited marked differences between arms. A note about cessation and uptake of smoking: For the 590 women assessed as smokers at baseline, cessation rates were 16.7% (49/293, FNP) and 16.5% (49/297, usual care). However, of the 502 women categorised as non-smokers as baseline 118 were subsequently recorded as smokers at follow-up (60/254, 23.6% in FNP, 58/248, 23.4% in usual care). The latter group reflects the natural volatility of smoking behaviour in this population and cautions against focusing exclusively upon cessation rates as a marker of potential intervention effects.

9
(ii) Subsequent pregnancy The subsequent pregnancies primary outcome was constructed from four data sources: self-report (6, 12, 18, and 24 months), abortions, Health and Social Care Information Centre (HSCIC) (inpatients and outpatients), and GP data.
Self-report: From each post-birth interview participants were asked if they were pregnant or had been pregnant in the last six months (current pregnant, termination, miscarriage or had a baby) with response option: Yes, No or Not sure, Missing (did not answer the question) or non-response (interview had not been conducted). A variable was created to flag if they had ever been pregnant over any of the four time points where 1=Reported a subsequent pregnancy at any time point, 0=No report of a subsequent pregnancy across ALL time points, -8=Partial data (missing data at some or all time points / responses were 0).
Abortions: The dataset of 1618 women were linked to the Abortions dataset by Department of Health, Abortion Statistics Team. Registered medical practitioners are legally required under the Abortion Act 1967 to notify the Chief Medical Officer (CMO) of every therapeutic abortion performed. The Department of Health (DH) receives these notifications on form HSA4 and undertakes statistical processing and analysis. Approval was sought and granted by the CMO to access abortions data under the Abortions Act 1967. Due to the sensitive nature of the abortions data, records were obtained in a pseudonymised manner to lessen the risk of identifying individuals. This involved providing the Department of Health’s Abortions Statistics Manager with the women’s identifiable personal data (NHS number, date of birth and postcode) – this was provided to be used alongside other Building Blocks datasets to (self-report, HSCIC and GP data) in the ascertainment and analysis of second pregnancies. The abortions data was attached to this dataset, de-identified and returned for analysis. Outpatients: The data was restricted to participants with outpatient appointments after their first (Building Blocks) baby’s date of birth, with a main speciality of obstetrics or midwifery, and attendance type of a first appointment (either attended, did not attend, patient or hospital cancelled). The distribution of days after first baby indicated a natural cut off of 100 days where appointments were related to the first baby and more than 100 days related to a new subsequent pregnancy. Appointments before 100 days were excluded.
Inpatients: The data was restricted to participants with inpatient episodes (defined by their admission date) after their first (Building Blocks) baby’s date of birth and flagged for any pregnancy related codes (ICD102 chapter O and ICD10 codes Z321, Z33-Z39) or if an episode type was a delivery (with an associated maternity tail) with no associated pregnancy ICD10 codes. The distributions of days after 1st baby was examined and codes up to 100 days examined. Episodes less than 29 days after birth were not part of a new pregnancy, episodes between 29 and 100 days were related to post pregnancy diagnoses (such as post-partum haemorrhage) and were excluded. Episodes between 100 and 150 days all related to early pregnancy symptoms. Thus a cut off of 100 days after first birth was used and any episode occurring after this date was defined as a new subsequent pregnancy.
GP: The GP dataset was based on 951 records collected from the participants and pregnancy fields indicated if a pregnancy had occurred by the following categories: live births, terminations, miscarriage, stillbirth or currently pregnant. If any of the pregnancy fields were coded as missing then no subsequent pregnancy was assumed.
A final variable was constructed from all data sources where 1 = ANY of the data sources indicated an event, 0 = ALL of the data sources indicate no event. For the remainder of the participants where they had not yet been allocated a 1 or 0 (due to missing data), if the GP or self-report data sources indicated that no pregnancy was found then we assumed no subsequent pregnancy. If GP or self-report data was missing and no event was found in outpatients and inpatients data we could not assume that a pregnancy had not occurred. Based on these assumptions, a sample of 1,289 participants had an outcome with 329 missing due to incomplete follow-up (withdrawal or leaving the GP practice before 2 years and had no event from another source or missing self-report or GP data, and no event found in HSCIC sources or abortions).

10
(iii) Emergency attendances and admissions for children The primary data source for this outcome was data arising from HSCIC (Inpatients and A&E data). Inpatients: Emergency admissions to hospital were identified from Inpatient records where the basic counting unit for calculation is the Finished Consultant Episode (FCE), which is the total time a patient spends under the care of an individual consultant. Any one hospital admission might have associated with it a number of different episodes as a patient might pass between different hospital consultants. Hospital admissions occurring in the two years since the child’s birth were included. All elective admissions and any FCEs relating to the child’s birth were excluded to ensure that only episodes subject to external factors were included. Transfers between providers (e.g. birth transfers between hospitals, transfers between hospitals for any non-birth associated events) were also excluded to avoid double counting. Accidents and emergency: Attendances to A&E for the children were examined and linked to the inpatients data using a common identifier (HESID) and arrival date in A&E attendance data and episode start date in inpatient data. To enable linkage to the inpatients data (to identify attendances that subsequently result in an admission), ID and arrival date/episode start date needed to be unique in both datasets. True duplicates (same ID, arrival date and arrival time) were deleted but a number of attendances occurred on the same day but with different times of arrival and departure. In the majority of cases these attendances are related and are thus restricted to ‘first attendances’ to avoid duplicates. After linkage, the resulting dataset had 1,164 children with either an attendance at A&E and/or a hospital admission with 314 experiencing no event (22 could not be ascertained as they withdrew before an event).
(iv) Cognitive Development Table S4.1 Items used at each time point to measure cognitive development Item 12 month
interview 18 month interview
24 month interview
Is your baby sitting independently, that is without help, on their own?
! (delay grossmotor)
! (delay grossmotor)
Is your baby crawling or bottom shuffling? ! ! (delay grossmotor)
Is your baby walking around furniture? ! ! (delay grossmotor)
! (delay grossmotor)
Is your baby walking with one hand held? ! ! (delay grossmotor)
! (delay grossmotor)
Is your baby walking independently, that is without help, on their own?
! ! (delay grossmotor)
! (delay grossmotor)
Can your baby clap their hands? ! (delay finemotor)
Can your baby throw toys? ! Can your baby pick up small objects like raisins or small sweets?
! (delay finemotor)
! (delay finemotor)
Does your baby drink from a beaker? ! Does your baby wave bye-bye? ! (delay social) Does your baby show an interest in books?
!
Can your baby use a spoon to feed him/herself? ! ! (delay finemotor) Does your baby throw toys deliberately? ! (delay finemotor) Can your child run confidently stopping and starting without bumping into objects?
! (delay grossmotor)
Can your child pick up an object from floor when standing without falling over?
! (delay grossmotor)
Can child walk and turn corners and stop suddenly? ! (delay grossmotor)
Can your child turn pages of a book 1 at a time? ! (delay finemotor) Can your child turn pages of a book several at a time? ! (delay finemotor) How many bricks can your child build in a tower? ! Can your child do to and fro scribbling? ! Can your child do circular scribbling? ! Can your child copy straight lines? ! Note: If a child did not score positively on some items they were scored as being developmentally delayed.

11
(v) Language Development Table S4.2 Items used at each time point to measure language development Item
12 month interview 18 month interview
Is your baby chewing food yet? ! !
Is your baby making recognised sounds like ma ma, ba ba, dada? ! !
Does your baby have two or three recognised words with meaning? ! !
Does your baby put two words together? !
Does your baby name objects? !
Does your baby repeat words? !
(vi) Safeguarding
Safeguarding was counted as any record in GP notes indicating the initiation, progression or closure of a safeguarding process (e.g. initial assessment, being identified as a Child in need, child protection conference).
(vii) Use of routine data in this trial
Using routine data such as available from the Health and Social Care Information Centre (HSCIC) offers the potential to more comprehensively measure outcome without the subsequent need for direct participant contact. Successfully accessing data required (i) additional governance approval, including requiring using approved HSCIC wording for participant consent forms, (ii) availability, accuracy and verification of identifiers for linkage (such as NHS number and date of birth) and (iii) developing algorithms for utilising data arising from multiple sources (e.g. subsequent pregnancies).

12
The table below describes the availability of data accrued from different sources in the trial
Table S4.3 Routine data available for analysis: potential records and reasons for loss to follow-up
Maternity Mother and baby
Primary care Mother and baby
Secondary care Mother only
Secondary care Baby only
Immunisation Baby only
Abortion Mother only
FNP Usual care FNP Usual
care FNP Usual care FNP Usual
care FNP Usual care FNP Usual
care Potentially available 823 822 823 822 823 822 732* 761* 732* 761* 823 822
Ineligible 3 2 3 2 3 2 - - - - 3 2 Consent withdrawn 12 10 12 10 12 10 2 1 2 1 12 10
Ethics restriction 26 14 - - - - - - - - - - Matching failure - - - - 3 4 4 1 10 10 - - Not provided on request - - 332 324 - - - - 181 191 - -
Available for analysis 782 796 476 486 805 806 726† 759† 539‡ 559‡ 808 810 * Numbers exclude 5 stillborn babies, 3 in the FNP arm, 2 in the usual care arm. † Secondary care (HES) data were also collected on 11second twins, 6 in the FNP arm and 5 in the usual care arm. There was one failure to match on a second twin in the FNP arm. ‡ Immunisation data were also collected on 6 second twins, 4 in the FNP arm and 2 in the usual care arm. Data were not provided on 6 second twins, 3 in the FNP arm and 3 in the usual care arm
13
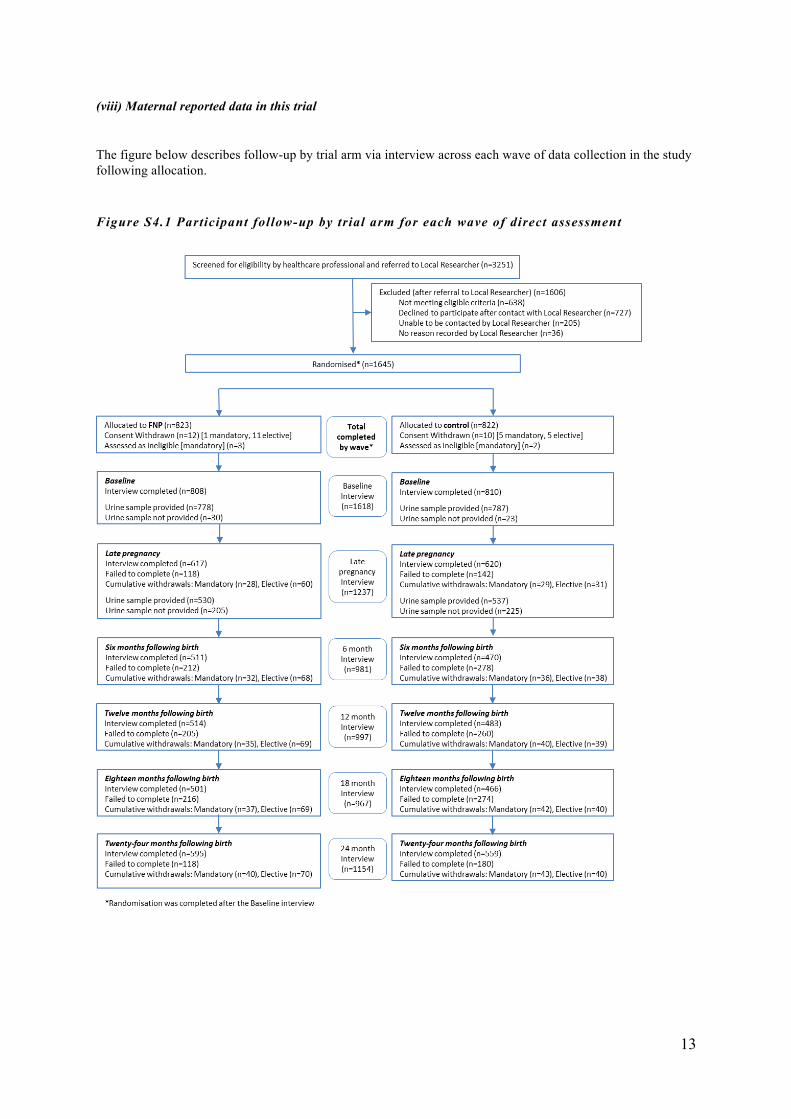
(viii) Maternal reported data in this trial
The figure below describes follow-up by trial arm via interview across each wave of data collection in the study following allocation.
Figure S4.1 Participant follow-up by trial arm for each wave of direct assessment

14
5. Full listing of secondary trial outcomes and when assessed Table S5.1 Secondary Outcomes: data source and assessment points (self-report apart from routine data for maternity and HES/GP) Outcome*
Bas
elin
e
Lat
e pr
egna
ncy
Mat
erni
ty
6 m
onth
s
12 m
onth
s
18 m
onth
s
24 m
onth
s †
HE
S/G
P‡
Ana
lysi
s
Pregnancy and birth outcomes Maternal outcomes Place of birth: planned, actual§ x NA Antenatal pre-eclampsia / hypertensionǁ‖ǁ‖ x LO-1 Parenting / child outcomes Live birth x LO-1 Gestation at delivery x LIN-1 Apgar score: 1 min, 5 mins x LO-1 Head circumference x LIN-1 Neonatal unit admission x LO-1
Child health and development outcomes Parenting / child outcomes Infant feeding intentions and duration x LO-1 Anticipatory parenting3, 4 x LIN-1 Prenatal attachment*, 5 x LIN-1 Parental role strain3,4 x x x x LIN-3 Maternal-child interaction*, 6 x LIN-1 Mother and child living apart x x x x LO-1 Initiation of breast or mixed feeding x LO-1 Breastfeeding cessation x SURV Introduction of solids x LO-1 Time to introduction to solids x SURV Baby diet: unhealthy food score x x LIN-3 Baby diet: healthy food every day x x LO-3 Cognitive development: 12 months, 18 months, 24 months*, 7
x x x LO-1
Language development: 12 months, 18 months (SOGS7)
x x LO-1
Language development: ELM8 x LIN-1 Child safety*, 9 x x x LO-3 Use of childcare x x x x LO-3 Immunisations x x x x LO-1 Primary care consultation for injuries & ingestions x x x x x LO-1 A&E attendance for injuries & ingestions x x x x x x LO-1 Hospital admissions for injuries & ingestions x x x x x x LO-1 Referral to a non-NHS service x LO-1 Referral to social services x x LO-1 Safeguarding procedures x x LO-1
Parental life course outcomes Maternal outcomes Not in education, employment or training (NEET)¶, 3,4 x x x x x LO-4 Hours in formal education*, 3,4 x x x x LIN-3 In paid employment*, 3,4 x x x x x LO-2 Type of employment*,§, 3,4 x x x x x NA In receipt of benefits*, **, 3,4 x x LO-2 Other financial support*, ††, 3,4 x x LO-2 Ever been homeless 3,4 x x x x x LO-2 General health status10 x x x x x x LO-4 Maternal weight 3,4 x x LIN-2 Psychological distress11 x x LIN-2 Depressive symptoms12 x x x x LO-3 Postnatally depressed13 x LO-1 General self-efficacy14 x x x x x LIN-4 Adaptive functioning*,15, 16 x x LO-2 Intimate partner violence17 x LO-1 Smoking reduction method18, 19 x x LO-1 Anyone smoking in home x x x x LO-1 Problem alcohol and drug use20 x x LIN-2 Contraceptive use and method§,3,4 x x x x LO-3 Social support and networks21,22 x x x x x LO-4 Family resources*, 23 x x x x x LIN-4 Partner-relationship quality24 x x x x x x LIN-4 Dental care x LO-1
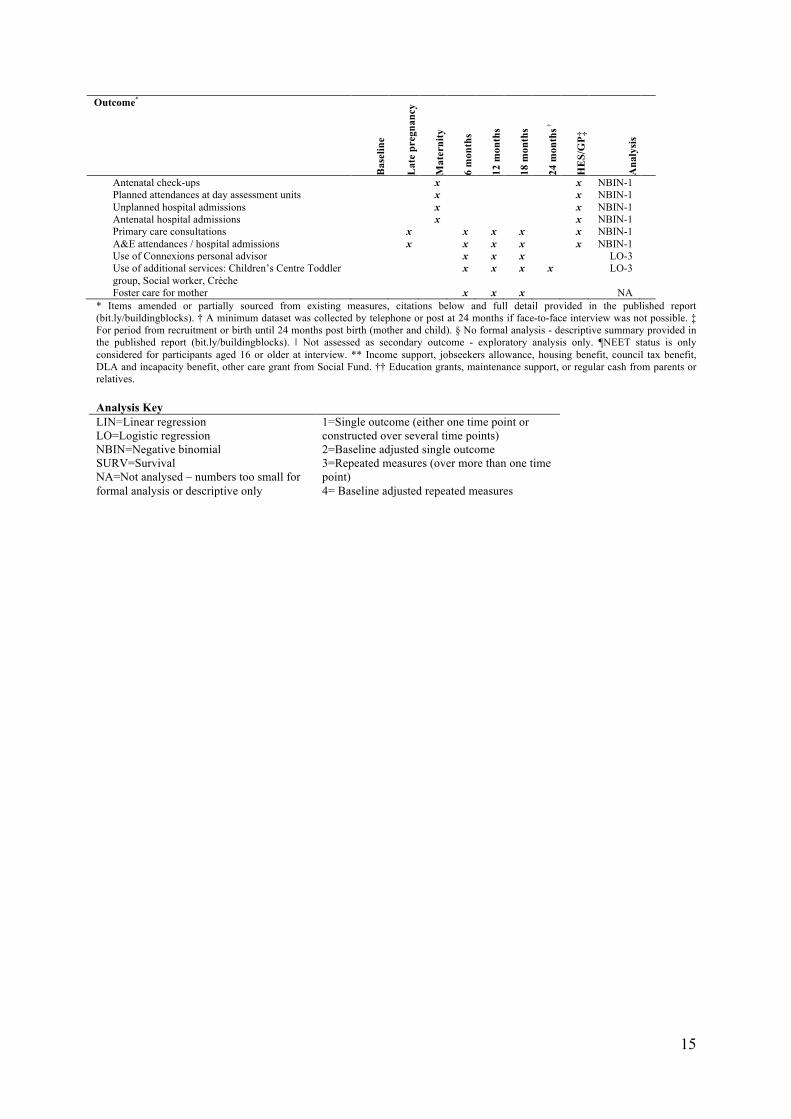
15
Outcome*
Bas
elin
e
Lat
e pr
egna
ncy
Mat
erni
ty
6 m
onth
s
12 m
onth
s
18 m
onth
s
24 m
onth
s †
HE
S/G
P‡
Ana
lysi
s
Antenatal check-ups x x NBIN-1 Planned attendances at day assessment units x x NBIN-1 Unplanned hospital admissions x x NBIN-1 Antenatal hospital admissions x x NBIN-1 Primary care consultations x x x x x NBIN-1 A&E attendances / hospital admissions x x x x x NBIN-1 Use of Connexions personal advisor x x x LO-3 Use of additional services: Children’s Centre Toddler group, Social worker, Crèche
x x x x LO-3
Foster care for mother x x x NA * Items amended or partially sourced from existing measures, citations below and full detail provided in the published report (bit.ly/buildingblocks). † A minimum dataset was collected by telephone or post at 24 months if face-to-face interview was not possible. ‡ For period from recruitment or birth until 24 months post birth (mother and child). § No formal analysis - descriptive summary provided in the published report (bit.ly/buildingblocks). ǁ‖ Not assessed as secondary outcome - exploratory analysis only. ¶NEET status is only considered for participants aged 16 or older at interview. ** Income support, jobseekers allowance, housing benefit, council tax benefit, DLA and incapacity benefit, other care grant from Social Fund. †† Education grants, maintenance support, or regular cash from parents or relatives. Analysis Key LIN=Linear regression LO=Logistic regression NBIN=Negative binomial SURV=Survival NA=Not analysed – numbers too small for formal analysis or descriptive only
1=Single outcome (either one time point or constructed over several time points) 2=Baseline adjusted single outcome 3=Repeated measures (over more than one time point) 4= Baseline adjusted repeated measures

16
6. Sensitivity analyses for tobacco use and second pregnancy (i) Tobacco use Analyses were repeated for those participants who had complete self-report data and urinary cotinine data at both baseline and late pregnancy (n=870) (Table S6.1). The effect and confidence intervals are unchanged by this analysis. Table S6.1 Percentage of smokers by trial arm, main analysis and complete case n % Adjusted OR*
(97.5% CI) Main analysis N=1092
FNP (N=547) 304 55.6 0.90 (0.64 to 1.28)
Usual care (N=545) 306 56.1
Complete case analysis N=870
FNP (N=439) 248 56.5 0.90 (0.62 to 1.31)
Usual care (N=431) 249 57.8
* FNP compared to usual care. Analysis adjusted for stratification (site) and minimisation variables (gestational age and smoking status at recruitment, and first or preferred language) (ii) Second pregnancy - Impact of data source Since several data sources could be used to detect a more accurate rate of second pregnancies, the impact of using these data sources was examined (Table S6.2). A much lower rate of pregnancies is detected by using just Health and Social Care Information Centre (HSCIC) data. Using only maternally self-reported second pregnancies or those detected through GP records a greater proportion is detected, although in the maternal report a greater proportion is reported from those randomised to the usual care arm and vice versa for the GP records. Table S6.2 Percentage of participants with a second pregnancy within twenty four months of first birth, by trial arm n % Adjusted OR*
(97.5% CI) HSCIC (Inpatients and Outpatients) N=1611
FNP (N=450) 194 24.1 0.85 (0.63 to 1.15)
Usual care (N=418) 211 26.1
Maternal Self report only N=868
FNP (N=450) 223 49.6 0.78 (0.58 to 1.07)
Usual care (N=418) 230 55.0
GP records only FNP (N=471) 257 54.6 1.17 (0.87 to 1.57) N=951 Usual care (N=480) 244 50.8
* FNP compared to usual care. Analysis adjusted for stratification (site) and minimisation variables (gestational age and smoking status at recruitment, and first or preferred language)

17
7. Narrative description of secondary outcomes results Tables S7.1 to S7.3 below present all the secondary outcomes for the Pregnancy and birth, Child health and development, and the Parental life course domains. Within each domain we present by maternal or parenting and /child outcomes. We highlight here all associations with a p value of less than 0.05 and selected others.

18
Table S7.1 Secondary pregnancy and birth outcomes Outcome* Arm† Maternal birth record
N=1578 (FNP=782, UC=796) Adjusted‡ intervention effect
(95% CI) P
Maternal outcomes
Antenatal pre-eclampsia/hypertension FNP 80/766 (10·4) 1·26§
(0·90 to 1·79) 0·18
UC 67/776 (8·6) Child outcomes Child birth record
N=1510 (FNP=742, UC=768)
Live birth FNP 739 (99·6) 0·65§ (0·11 to 3·88)
0·63 UC 766 (99·7)
Gestation at delivery FNP N=735
39·16 (2·33) -0·005**
(-0·24 to 0·23) 0·97
UC N=763 39·16 (2·31)
Normal Apgar score (≥7) at 1 minute FNP 614/682 (90·0) 1·14§
(0·81 to 1·61) 0·46
UC 621/699 (88·8)
Normal Apgar score (≥7) at 5 minutes FNP 666/681 (97·8) 0·91§ (0·44 to 1·88)
0·80
UC 686/700 (98·0)
Head circumference (cm) (at birth) FNP N=456
33·9 (2·1) -0·14**
(-0·41 to 0·14) 0·34
UC N=495 34·1 (1·8)
No neonatal unit admission (direct or subsequent) FNP 653/733 (89·1) 0·81§
(0·58 to 1·14) 0·23
UC 695/764 (91·0) Data are n (%), mean (SD), median (25th to 75th centile) or n/N(%) * Missing data varies by outcome. Full details are documented in the published report (bit.ly/buildingblocks). † FNP=Family Nurse Partnership Programme + Usual care, UC= Usual care. ‡ Adjusted for stratification (site) and minimisation variables (gestational age and smoking status at recruitment, and first or preferred language). §Adjusted odds ratio: FNP compared to usual care. ** Adjusted difference in means: FNP minus usual care.

19
Table S7.2 Secondary child health and development outcomes Outcome* Arm† Late
pregnancy N=1237
(FNP=617, UC=620)
Maternal birth record N=1578
(FNP=782, UC=796)
6 months N=981
(FNP=511, UC=470)
12 months N=997
(FNP=514, UC=483)
18 months N=967
FNP=501, UC=466)
24 months‡ N=1154
(FNP=595, UC=559)
Adjusted§
intervention effect (95% CI)
P
Parenting/child outcomes Breastfeeding or mixed Infant feeding intentions
FNP 344/589 (58·4) - - - - - 1·32** (1·02 to 1·70)
0·036 UC 298/591 (50·4) - - - - -
Intended breastfeeding duration 6 weeks or more
FNP 300/334 (89·8) - - - - - 1·22** (0·73 to 2·03)
0·45
UC 253/287 (88·2) - - - - -
Anticipatory parenting score††
FNP N=593 8·60 (2·03) - - - - - -0·20‡‡
(-0·43 to 0·02) 0·08
UC N=591 8·80 (1·97) - - - - -
Prenatal attachment score§§
FNP N=587 11·58 (3·17) - - - - - -0·09‡‡
(-2·10 to 1·92) 0·93
UC N=589 11·73 (3·15) - - - - -
Parental role strain score***
FNP - - N=477 9·10 (2·14)
N=496 9·43 (2·27)
N=481 9·62 (2·25)
N=535 10·52 (2·58)
-0·16‡‡ (-0·35 to 0·03)
0·11
UC - - N=471 9·27 (2·40)
N=471 9·58 (2·37)
N=451 9·74 (2·52)
N=536 10·56 (2·48)
Maternal-child interaction outcomes†††:
Maternal sensitivity score
FNP - - - - - N=256 11·05 (1·66)
-0·07‡‡ (-0·41 to 0·27)
0·67
UC - - - - - N=252 11·06 (1·62)
Maternal intrusiveness score
FNP - - - - - N=256 1·67 (1·85)
0·12‡‡ (-0·19 to 0·43)
0·44
UC - - - - - N=252 1·53 (1·60)
Child responsiveness score
FNP - - - - - N=256 18·43 (2·25)
-0·26‡‡ (-0·77 to 0·25)
0·31
UC - - - - - N=252 18·60 (2·82)
Child positive affect score
FNP - - - - - N=256 3·13 (1·92)
-0·23‡‡ (-0·59 to 0·13)
0·21
UC - - - - - N=251 3·35 (2·24)

20
Child negative affect score
FNP - - - - - N=256 0·89 (1·27)
0·09‡‡ (-0·12 to 0·30)
0·40
UC - - - - - N=252 0·79 (1·11)
Mother and child ever lived apart
FNP - - - - - 24/359 (6·7) 0·73** (0·41 to 1·32)
0·30
UC - - - - - 27/312 (8·7)
Child Outcomes Arm Child birth record
N=1510 (FNP=742,
UC=768)
6 months N=987
(FNP=514, C=473)
12 months N=1004
(FNP=519, C=485)
18 months N=975
(FNP=506, C=469)
24 months N=1164
(FNP=602, C=562)
Adjusted§ odds ratio/ difference in
means (95% CI)
P
Initiation of breast or mixed feeding
FNP - 317/723 (43·8) - - - - 1·10** (0·89 to 1·37)
0·37 UC - 312/753 (41·4) - - - -
Breastfeeding cessation time (days)
FNP - - N=254 7 (2 to 31) - - - 1.03‡‡‡
(0·86 to 1·24) 0·76
UC - - N=223 14 (2 to 42) - - -
Introduction of solids by 6 months
FNP - - 471/488 (96·5) - - - 1·24**
(0·63 to 2·45) 0·54
UC - - 435/455 (95·6) - - -
Time (weeks) to introduction of solids
FNP - - N=471 16 (16 to 20) - - - 0·92‡‡
(0·81 to 1·05) 0·22
UC - - N=435 16 (16 to 20) - - -
Unhealthy food score§§§ FNP - - - - N=491
7·94 (1·85) N=572
8·69 (1·69) -0·005‡‡
(-0·20 to 0·19) 0·96
UC - - - - N=455 8·13 (1·91)
N=518 8·63 (1·74)
Child received healthy food every day****
FNP - - - - 356/490 (72·7) 374/573 (65·3) 0·95** (0·7 to 1·28)
0·72 UC - - - - 330/456 (72·4) 348/523 (66·5)
Cognitive development concern
FNP - - - 44/504 (8·7) 17/491 (3·5) 46/569 (8·1) 12m: 0·91** (0·59 to 1·40)
18m: 0·59** (0·32 to 1·11)
24m: 0·61** (0·40 to 0·90)
0·66
0·10
0·013 UC - - - 45/472 (9·5) 26/455 (5·7) 66/522 (12·6)
Language development concern
FNP - - - 55/502 (11·0) 84/490 (17·1) - 12m: 0·50** (0·35 to 0·72)
18m: 0·66**
<0·001
0·009 UC - - - 94/472 (19·9) 110/455 (24·2) -

21
(0·48 to 0·90)
Early Language Milestone Scale score††††
FNP - - - - - N=480
60·8 (31·4) N=415
4·49‡‡ (0·52 to 8·45)
0.027
UC - - - - - 55·7 (31·4)
Child safety‡‡‡‡ FNP - - - 100/466 (21·5) 142/460 (30·9) 96/510 (18·8) 1·26** (0·97 to 1·62)
0·08 UC - - - 77/452 (17·0) 120/431 (27·8) 79/490 (16·1)
Use of childcare FNP - - 36/110 (32·7) 83/500 (16·6) 128/488 (26·2) 160/569 (28·1) 1·28** (0·90 to 1·83)
0·18 UC - - 33/105 (31·4) 64/472 (13·6) 100/453 (22·1) 136/522 (26·1)
Receipt of all 10 immunisations required by 24m
FNP - - - - - 421/529 (79·6) 0·94** (0·60 to 1·46)
0·77
UC - - - - - 432/534 (80·9)
Consultations for injuries and ingestions Primary care consultation at 6m
FNP - - - - - # UC - - - - - #
Primary care consultation at 24m
FNP - - - - - 48/461 (10·4) 0·87** (0·58 to 1·33)
0·53 UC - - - - - 55/471 (11·7)
A&E attendance at 6m
FNP - - - - - 30/731 (4·1) 1·52** (0·86 to 2·70)
0·15 UC - - - - - 21/755 (2·8)
A&E attendance at 24m
FNP - - - - - 222/721 (30·8) 1·16** (0·92 to 1·46)
0·20 UC - - - - - 207/744 (27·8)
Hospital admission at 6m
FNP - - - - - 14/731 (1·9) 0·79** (0·39 to 1·60)
0·51 UC - - - - - 18/756 (2·4)
Hospital admission at 24m
FNP - - - - - 35/722 (4·8) 0·72** (0·46 to 1·12)
0·15 UC - - - - - 49/745 (6·6)
Referral to non-NHS service
FNP - - - - - 122/583 (20·9) 1·23** (0·91 to 1·66)
0·19
UC - - - - - 96/542 (17·7)
Referral to social services FNP - - - - - 119/580 (20·5) 1·27** (0·93 to 1·73)
0·13 UC - - - - - 91/541 (16·8)
Safeguarding procedure§§§§
FNP - - - - - 64/469 (13·6) 1·85** (1·02 to 2·85)
0·005 UC - - - - - 38/476 (8·0)
Data are n (%), mean (SD), median (25th to 75th centile) or n/N(%), ‘#’ suppression of low cell count indicates a value between 1 and 5 * Missing data varies by outcome. Full details are documented in the published report (bit.ly/buildingblocks). † FNP=Family Nurse Partnership Programme + Usual care, UC=Usual care ‡ A minimum dataset was collected by telephone or post at 24 months if face-to-face interview was not possible (n=32) § Adjusted for stratification (site) and minimisation variables (gestational age and smoking status at recruitment, and first or preferred language) ** Adjusted odds ratio: FNP compared to usual care †† A 5 item scale with scores ranging from 5 to 25 where a low score indicates more structured parenting ‡‡ Adjusted difference in means: FNP minus usual care §§ An 8 item scale with scores ranging from 8 to 32 where a low score indicates lower attachment

22
*** A 6 item scale with scores ranging from 6 to 24 where a low score indicates lower parental strain ††† A low score indicates low level of each reported measure ‡‡‡ Adjusted hazard ratio (HR) with a HR>1 indicating that the FNP arm presented sooner than the usual care arm §§§ A 3 item scale with scores ranging from 3 to 12 where a low score indicates that unhealthy food was less frequently consumed **** A 2 item scale with scores ranging from 2 to 8 and a binary outcome was used where a score of 2 indicates that the participants gave their babies healthy food every day †††† Percentile scores where a low score indicates that language is less developed ‡‡‡‡ Positive response to all safety feature questions §§§§ Recorded in primary care notes

23
Table S7.3 Secondary parental life course outcomes
Outcome* Arm† Baseline N=1618
(FNP=808, UC=810)
Late pregnancy
N=1237 (FNP=617,
UC=620)
Birth record N=1578
(FNP=782, UC =796)
6 months N=981
(FNP=511, UC =470)
12 months N=997
(FNP=514, UC =483)
18 months N=967
FNP=501, UC =466)
24 months‡ N=1154
(FNP=595, UC=559)
Adjusted§ intervention effect
(95% CI)
P
Maternal outcomes Not in education, employment or training (NEET)**
FNP 333/695 (47·9) - - 369/468 (78·9) 336/496 (67·7) 306/493 (62·1) 368/593 (62·1) 0·86†† (0·60 to 1·23)
0·41
UC 330/685 (48·2)
- - 344/435 (79·1) 333/466 (71·5) 300/456 (65·8) 388/557 (69·7)
In formal education FNP - - - 62/476 (13·0) 84/495 (17·0) 99/485 (20·4) 101/572 (17·7) 1·09†† (0·75 to 1·60)
0·65 UC - - - 66/448 (14·7) 78/470 (16·6) 90/461 (19·5) 74/527 (14·0)
Hours per week in formal education
FNP - - - N=62
17·8 (8·9) N=84
17·5 (9·0) N=99
16·6 (7·4) N=101
18·4 (9·4) -0·98‡‡
(-3·01 to 1·06) 0·35
UC - - - N=66
19·0 (8·6) N=78
18·9 (8·1) N=90
18·5 (9·0) N=74
18·7 (10·0)
In paid employment FNP 174/808 (21·5) - - 31/483 (6·4) 65/504 (12·9) 75/496 (15·1) 111/594 (18·7) 1·15††
(0·76 to 1·74) 0·51
UC 164/810 (20·2) - - 25/452 (5·5) 57/478 (11·9) 64/462 (13·9) 88/559 (15·7)
In receipt of state benefits FNP 212/593 (35·8) - - - - - 517/593 (87·2) 1·17††
(0·81 to 1·68) 0·40
UC 196/557 (35·2) - - - - - 494/557 (88·7)
Other financial support received
FNP 290/584 (49·7) - - - - - 279/584 (47·8) 1·19†† (0·91 to 1·55)
0·21
UC 234/538 (43·5) - - - - - 273/538 (50·7)
Ever been homeless (from baseline until 24m)
FNP 144/808 (17·8) - - - - - 123/405 (30·4) 0·76†† (0·55 to 1·05)
0·09 UC 170/810 (21·0) - - - - - 136/375 (36·3)
In full health§§ FNP 518/808 (64·1) 268/614 (43·6) 378/507 (74·6) 393/510 (77·1) 397/499 (79·6) 428/594 (72·1) 1·07††
(0·86 to 1·32) 0·55
UC 512/807 (63·4) 252/616 (40·9) 346/469 (73·8) 364/480 (75·8) 358/465 (77·0) 414/558 (74·2)
Maternal weight (kg) FNP
N=334 59·9 (11·3)
- - - - - N=334
63·6 (13·4) 0·47‡‡
(-0·88 to 1·83) 0·49
UC N=337
60·6 (13·6) - - - - -
N=337 63·9 (14·3)
24
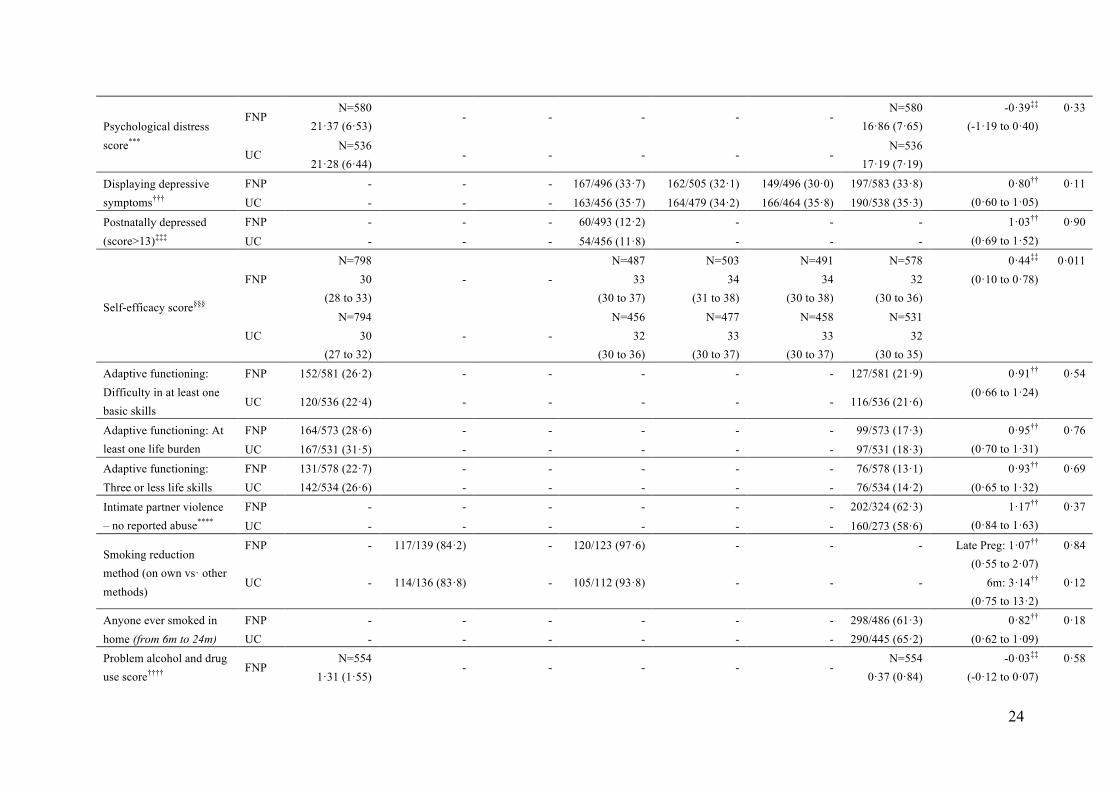
Psychological distress score***
FNP N=580
21·37 (6·53) - - - - -
N=580 16·86 (7·65)
-0·39‡‡ (-1·19 to 0·40)
0·33
UC N=536
21·28 (6·44) - - - - -
N=536 17·19 (7·19)
Displaying depressive symptoms†††
FNP - - - 167/496 (33·7) 162/505 (32·1) 149/496 (30·0) 197/583 (33·8) 0·80†† (0·60 to 1·05)
0·11 UC - - - 163/456 (35·7) 164/479 (34·2) 166/464 (35·8) 190/538 (35·3)
Postnatally depressed (score>13)‡‡‡
FNP - - - 60/493 (12·2) - - - 1·03†† (0·69 to 1·52)
0·90 UC - - - 54/456 (11·8) - - -
Self-efficacy score§§§
FNP N=798
30 (28 to 33)
- - N=487
33 (30 to 37)
N=503 34
(31 to 38)
N=491 34
(30 to 38)
N=578 32
(30 to 36)
0·44‡‡ (0·10 to 0·78)
0·011
UC N=794
30 (27 to 32)
- - N=456
32 (30 to 36)
N=477 33
(30 to 37)
N=458 33
(30 to 37)
N=531 32
(30 to 35) Adaptive functioning: Difficulty in at least one basic skills
FNP 152/581 (26·2) - - - - - 127/581 (21·9) 0·91†† (0·66 to 1·24)
0·54
UC 120/536 (22·4) - - - - - 116/536 (21·6)
Adaptive functioning: At least one life burden
FNP 164/573 (28·6) - - - - - 99/573 (17·3) 0·95†† (0·70 to 1·31)
0·76 UC 167/531 (31·5) - - - - - 97/531 (18·3)
Adaptive functioning: Three or less life skills
FNP 131/578 (22·7) - - - - - 76/578 (13·1) 0·93†† (0·65 to 1·32)
0·69 UC 142/534 (26·6) - - - - - 76/534 (14·2)
Intimate partner violence – no reported abuse****
FNP - - - - - - 202/324 (62·3) 1·17†† (0·84 to 1·63)
0·37 UC - - - - - - 160/273 (58·6)
Smoking reduction method (on own vs· other methods)
FNP - 117/139 (84·2) - 120/123 (97·6) - - - Late Preg: 1·07†† (0·55 to 2·07)
6m: 3·14†† (0·75 to 13·2)
0·84
0·12 UC - 114/136 (83·8) - 105/112 (93·8) - - -
Anyone ever smoked in home (from 6m to 24m)
FNP - - - - - - 298/486 (61·3) 0·82†† (0·62 to 1·09)
0·18 UC - - - - - - 290/445 (65·2)
Problem alcohol and drug use score††††
FNP N=554
1·31 (1·55) - - - - -
N=554 0·37 (0·84)
-0·03‡‡ (-0·12 to 0·07)
0·58

25
UC N=514
1·27 (1·47) - - - - -
N=514 0·37 (0·83)
Contraceptive use‡‡‡‡ FNP - - - 424/503 (84·3) 392/509 (77·0) 387/499 (77·6) 432/595 (72·6) 1·25††
(0·98 to 1·60) 0·08
UC - - - 373/465 (80·2) 370/479 (77·2) 349/465 (75·1) 379/558 (67·9)
Maximum social support§§§§
FNP 160/799 (20·0) - - 118/479 (24·6) 124/505 (24·6) 127/495 (25·7) 162/581 (27·9) 1·50†† (1·06 to 2·12)
0·023
UC 167/804 (20·8) - - 111/447 (24·8) 111/473 (23·5) 93/459 (20·3) 123/533 (23·1)
Family resources score*****
FNP N=775
13·4 (4·2) - -
N=452 14·4 (3·7)
N=492 13·8 (3·9)
N=490 14·1 (3·8)
N=567 13·6 (3·9)
-0·03‡‡
(-0·51 to 0·45) 0·89
UC N=776
13.4 (4.2) - -
N=425 14.3 (3.9)
N=467 13.8 (4.0)
N=453 13.7 (3.7)
N=529 13.4 (3.6)
Partner-relationship quality score†††††
FNP N=637
28·0 (4·8) N=45
29·6 (4·1) -
N=330 29·0 (4·5)
N=312 29·0 (4·3)
N=288 29·3 (3·8)
N=374 29·1 (4·4)
0·74‡‡ (0·28 to 1·20)
0·002 UC
N=640 28·2 (4·8)
N=34 29·4 (4·0)
- N=310
28·3 (4·7) N=267
28·4 (4·5) N=241
28·5 (4·6) N=340
28·4 (4·4) Routine dental check-up since child was born
FNP - - - - - - 393/595 (66·1) 0·96†† (0·75 to 1·22)
0·72 UC - - - - - - 373/557 (67·0)
Antenatal check-ups FNP - -
N=782 10·38 (3·69)
- - - - 1·02‡‡‡‡‡
(0·98 to 1·05)
0·32
UC - - N=796
10·22 (3·47) - - - -
Planned antenatal attendances at day assessment units
FNP - - N=757
1·45 (2·42) - - - -
0·95‡‡‡‡‡ (0·82 to 1·11)
0·55
UC - - N=768
1·59 (2·80) - - - -
Unplanned antenatal hospital admissions
FNP - - N=757
1·68 (1·99) - - - -
1·04‡‡‡‡‡ (0·93 to 1·17)
0·49
UC - - N=768
1·63 (2·00) - - - -
Antenatal hospital admissions
FNP - - N=757
0·71 (0·05) - - - -
0·96‡‡‡‡‡ (0·81 to 1·13)
0·61

26
UC - - N=768
0·76 (0·05) - - - -
Primary care consultations§§§§§
FNP - - - - - - N=461
12·00 (10·2) 1·09‡‡‡‡‡
(0·98 to 1·21)
0·13
UC - - - - - - N=468
10·91 (9·13)
Maternal emergency attendances and admissions******
FNP - - - - - - N=808
3·35 (4·17) 1·26‡‡‡‡‡
(0·98 to 1·62) 0·07
UC - - - - - - N=810
3·21 (3·96)
Contact with a Connexions personal advisor
FNP - - - 159/483 (32·9) 121/504 (24·0) 84/496 (16·9) - 1·15†† (0·85 to 1·53)
0·36
UC - - - 126/452 (27·9) 112/476 (23·5) 79/462 (17·1)
-
Use of Children’s Centre FNP - - - 187/483 (38·7) 184/460 (40·0) 142/432 (32·9) 206/584 (35·3) 1·18††
(0·94 to 1·48) 0·15
UC - - - 172/452 (38·1) 172/443 (38·8) 140/421 (33·3) 149/538 (27·7)
Use of Toddler group FNP - - - 40/483 (8·3) 64/498 (12·9) 81/472 (17·2) 114/584 (19·5) 1·01††
(0·78 to 1·30) 0·96
UC - - - 37/452 (8·2) 53/466 (11·4) 71/436 (16·3) 120/538 (22·3)
Use of Social worker FNP - - - 54/483 (11·2) 38/489 (7·8) 41/474 (8·6) 78/584 (13·4) 1·44††
(0·87 to 2·38) 0·16
UC - - - 47/452 (10·4) 36/464 (7·8) 29/449 (6·5) 54/537 (10·1) Use of Crèche/day nursery
FNP - - - 55/483 (11·4) 79/495 (16·0) - - 1·19†† (0·73 to 1·95)
0·49
UC - - - 47/452 (10·4) 71/469 (15·1)
- -
Ever needing to be in foster care
FNP - - - - - - #
UC - - - - - - # Data are n (%), mean (SD), median (25th to 75th centile) or n/N(%), ‘#’ suppression of low cell counts indicates a value between 1 and 5 * Missing data varies by outcome. Full details are documented in the published report (bit.ly/buildingblocks) † FNP=Family Nurse Partnership Programme + usual care, UC=Usual care ‡ A minimum dataset was collected by telephone or post at 24 months if face-to-face interview was not possible (n=32) § Adjusted for stratification (site) and minimisation variables (gestational age and smoking status at recruitment, and first or preferred language) ** NEET status applicable only to those whose age at end of previous academic year was >16 years †† Adjusted odds ratio: FNP compared to usual care ‡‡ Adjusted difference in means: FNP minus usual care §§ EQ5D score was dichotomised so that full health represents a score of 1 *** A 10 item scale with scores ranging from 10 to 50 where a low score indicates a low level of psychological distress

27
††† A positive response to both items on the Depression Screening tool indicates that the participant was displaying depressive symptoms ‡‡‡ A 10 item scale with scores ranging from 0 to 30 where a higher score indicates more depressive symptoms. A binary outcome was used with scores of greater than 13 categorising mothers likely to be suffering from a depressive illness of varying severity §§§ A 10 item scale with scores ranging from 10 to 40 where a higher score indicates higher self-efficacy **** CAS was only administered in face-to-face interviews and where the participant was alone. Scores ranged from 0 to 145 and dichotomised so that a score of 0 indicated no reported abuse †††† A 6 item scale with scores ranging from 0 to 6 where a higher score indicates a greater risk of problems ‡‡‡‡ Data at baseline not used in analysis as not equivalent for interpretation purposes §§§§ Scores ranged from 0 to 100 where higher scores indicate more support, and was dichotomised so that a score of 100 indicated maximum support ***** A 4 item scale with scores ranging from 4 to 20 where a higher score indicates more family resources ††††† A 7 item scale with scores ranging from 7 to 35 where a higher score indicates higher relationship quality ‡‡‡‡‡ Adjusted incidence rate ratio (IRR) where a IRR>1 indicating a higher rate in the FNP compared to the usual care §§§§§ Data extracted from primary care notes and cover the period since recruitment to the trial. Consultations are for GP and nurse visits and exclude antenatal visits ****** Data extracted from the HSCIC A&E and hospital inpatients records and cover the period since recruitment to the trial and excluded any events relating to the birth of the child

28
Pregnancy and birth See table S7.1 There was no evidence for differences between trial arms for either maternal or parenting and child outcomes. Child health and development See table S7.2
Breastfeeding More pregnant participants in the FNP arm expressed an intention to breast feed (n=344/589, (58.4%)) than in the usual care arm (n=298/591, (50.4%)), an adjusted odds ratio of 1.32 (95% CI: 1.02 to 1.70). However, there was no difference in the proportion of participants in the FNP arm initiating breast or mixed feeding (n=317/723, (43.8%)) compared to the usual care arm (n=312/753, (41.4%)), or in the median duration of breast feeding reported at six months by participants in the FNP arm (7 days) and usual care arm (14 days) where initiated and subsequently ceased. Developmental concern There was no difference between arms at 12 and at 18 months in terms of maternally reported developmental concerns (based on items drawn from the Schedule of Growing Skills). However, at 24 months the proportions of children with a concern were 8.1% (n=46/569) and 12.6% (n=66/522) in the FNP and usual care arms respectively (adjusted odds ratio: 0.61, 95% CI 0.40 to 0.90).
Language Maternally reported rate of developmental delay in language was lower for children in the FNP arm (n=55/512, (11.0%)) compared to the usual care arm (n=94/472, (19.9%)) at 12 months with an adjusted odds ratio of 0.50 (95% CI 0.35 to 0.72). At 18 months the pattern was similar with 17.1% (n=84/490) in the FNP arm compared to 24.2% (n=110/455) in the usual care arm an adjusted odds ratio of 0.66 (95% CI 0.48 to 0.90). At the end of the trial period, maternally reported language development was better in the FNP arm compared to the usual care arm with mean (SD) Early Language Milestone percentiles of 60.8 (31.4) and 55.7 (31.4) respectively (adjusted difference in means of 4.49, 95% CI: 0.52 to 8.45). Injuries / ingestions A greater proportion of children in the FNP arm than the usual care arm attended an Emergency Department (ED) for an injury or ingestion by six months (4.1% (n=30/731) and 2.8% (n=21/755) respectively; adjusted OR: 1.52, 95% CI: 0.86 to 2.70), and by 24 months of age (30.8% (n=222/721) and 27.8% (n=207/744) respectively; adjusted OR: 1.16, 95% CI: 0.92 to 1.46). However, a smaller proportion of children in the FNP arm were admitted to hospital with an injury or ingestion compared to the usual care arm by six months of age (1.9% (n=14/731) and 2.4% (n=18/756) respectively; adjusted odds ratio 0.79, 95% CI 0.39 to 1.60), and by 24 months (4.8% (n=35/722) and 6.6% (n=49/745) respectively; adjusted odds ratio: 0.72, 95% CI: 0.46 to 1.12). However, there was no statistical evidence of differences between trial arms for children with injuries and ingestions presenting to an ED or being admitted.
Social services referral At two years postpartum a greater proportion of participants in the FNP arm reported that their child had ever been referred to social services (n=119/580, 20.5%) compared to the usual care arm (n=91/541, 16.8%), an adjusted odds ratio of 1.27 (95% CI of 0.93 to 1.73).
Safeguarding Over the same time period, for the 945 children for whom data were available, a greater proportion of children in the FNP arm had a safeguarding event recorded in their GP record (n=64/469, 13.6%) compared to the usual care arm (n=38/476, 8.0%) an adjusted odds ratio of 1.85 (95% CI of 1.02 to 2.85).
Other outcomes There was no statistical evidence for differences between trial arms for any other maternal or parenting and child outcomes.
Parental life-course See Table S7.3 NEET / employment / education For the period from birth to two years postpartum, there was no overall difference between trial arms in reported rates of either employment or education. However, at two years postpartum participants in the FNP arm reported lower rates of not being in employment, education or training (n=368/593, 62.1%) than in the usual care arm (n=388/557, 69.7%). At the same point in time, participants in the FNP arm reported higher rates of being in paid employment (n= 111/594, 18.7%) than in the usual care arm (n=88/559, 15.7%) but there was no statistical evidence for a difference. However, for both outcomes there was no overall difference between arms across the full follow-up period.

29
Connexions At six months postpartum participants in the FNP arm reported higher rates of access to the Connexions (employment) advisory service (n=159/483, 32.9%) than in the usual care arm (n=126/452, 27.9%) but there was no statistical evidence for a difference across the reporting period.
Visiting Children’s Centre Although a larger proportion of participants in the FNP arm (n=206/584, 35.3%) reported at 24 months visiting a Children’s Centre than in the usual care arm (n=149/538, 27.7%), there was no overall difference across the full follow-up period.
Contraception Reported contraceptive use at 24 months postpartum was 72.6% (n=432/595) in the FNP arm and 67.9% (n=379/558) in the usual care arm. However, across the whole period up two years the odds of contraceptive use by participants in the FNP arm compared to the usual care arm was 1.25 (95% CI: 0.98 to 1.60).
Social support A larger proportion of participants in the FNP arm reported a maximum level of social support at 18 months postpartum (n=127/495, 25.7%) compared to those in the usual care arm (n=93/459, 20.3%) with a similar difference at 24 months (27.9% (n=162/581) v 23.1% (n=123/533)). Across the whole follow-up period there was a small difference between arms with an odds ratio of 1.50 (95% CI: 1.06 to 2.12). Similarly with relationship quality, a small difference was observed between arms in relationship quality score with an adjusted difference in means of 0.17 (95% CI: 0.28 to 1.20).
Homelessness 30.4% (n=123/405) of participants in the FNP arm reported ever being homeless in the period from study entry to 24 months postpartum compared to 36.3% (n=136/375) in the usual care arm (adjusted odds ratio of 0.76, 95% CI: 0.55 to 1.05).
Self-efficacy Across the full follow-up period there was a small difference between arms for self-efficacy score of 0.44 (95% CI: 0.10 to 0.78) with higher reported levels in the FNP arm.
Other outcomes There was no statistical evidence for differences between trial arms for any other maternal outcome.

30
8. Representativeness of study sample Scope and purpose: We assessed whether women allocated to the intervention were similar to women currently being enrolled into FNP across sites in England. We compared baseline demographic characteristics using summary data sourced from the FNP’s own clinical information system. Aggregate data for non-trial FNP clients enrolled to the program from the 1st January 2010 to the 31st of December 2013 were obtained for both non-trial sites (n=8755) and trial sites outside of the trial recruitment phase (n=3311). Note that the data reported are FNP management data, which is why we only compare Intervention arm trial participants to non-trial participants. These data are also therefore not directly comparable to data presented elsewhere (for example, smoking data at baseline).
Comparisons: The three groups are similar in terms of mean maternal age at enrolment (Table S8.1). Mean weeks gestation at enrolment was slightly higher for trial clients than for women enrolled at non-trial sites, but slightly lower than the mean gestation for non-trial clients enrolled at trial sites. The proportion of women enrolled by 16 weeks gestation was similar in both trial (39.7%) and non-trial (41.6%) clients at trial sites and in both cases lower than that achieved at non-trial sites (48.9%). Whilst the proportion of ethnically white women was slightly higher amongst trial clients than in non-trial site clients (85.5% and 82.9% respectively), it was lower amongst non-trial clients enrolled at trial sites (77.5%). The proportion of women not in education, employment or training (NEET) was higher amongst trial clients (68.1%) than non-trial clients at the same sites (60.5%), and also higher than that found for non-trial site clients (63.3%). Rates of recent smoking recorded at intake were also highest for trial clients (40.8%) compared to non-trial clients at the same sites (32.9%) and at non-trial sites (34.0%).
Conclusion: While there are some differences between women recruited to the trial (and enrolled in FNP) and women enrolled in FNP but not participating in the trial (either enrolled subsequent to the end of the trial period or at a non-trial site), the sample is broadly representative of women expected to receive the intervention.
Table S8.1 FNP client characteristics at enrolment: Building Blocks clients, non-trial clients (from trial sites) and non-trial clients (from non-trial sites) FNP Clients
RCT N=718*
FNP Programme non-RCT
(RCT sites only) N=3311
FNP Programme non-RCT (non
RCT sites only) N=8755
Mean age (years) 17.4 17.2 17.3 Mean gestation at enrolment (weeks) 17.9 18.2 17.4 Mean gestation at birth (weeks) 39.4 39.2 39.1 Premature infants (%) 7.5 7.8 7.4 Enrolled by 16 weeks gestation (%) 39.7 41.6 48.9 Ethnicity (%)
White background 85.5 77.5 82.9 Mixed background 5.7 5.0 5.0 Asian background 2.1 3.4 1.4 Black background 3.6 7.1 4.9 Other background 0.4 1.7 1.2 Missing 2.7 5.3 4.6
NEET (16+ only) (%) 68.1 60.5 63.3 Relationship status (%)
With a current partner 79.5 76.6 76.4 With biological father of child 100 95.0 95.9 Relationship status recorded 97.4 94.8 95.5
Living (%) Living with own mother not including husband/ partner 45.0 43.8 45.1 Living with own mother including husband/ partner 10.2 8.5 8.7 Living with other adults 9.5 9.3 9.6 Living with foster parents 1.4 1.5 1.2 Living with husband/partner only 11.0 10.4 10.5 Living with husband/partner and others (not own mother) 7.8 6.7 7.4 Living alone 6.8 7.3 6.5 Living in a group home/shelter 4.3 5.1 4.7 Homeless 1.8 2.1 1.7 Living arrangements recorded 97.8 94.8 95.4
Smoking at intake Smoked (in last 48 hours) (%) 40.8 32.9 34.0 Smoked (in last 48 hours) recorded (%) 96.1 93.3 92.8 Mean number of cigarettes/smoked in last 48 hrs 4.5 4.2 4.2
* 718 clients included, 3 could not be included in the dataset from the FNP IS as they did not have any recoded data

31
9. Assessment of loss to follow-up – self-report at 24 months Table S9.1 provides an overview of how the trial sample was affected by loss to follow-up by self-report interview at 24 months and how that differed by trial arm. Amongst those who were lost to follow up, there were no differences between trial arms by age or by ethnicity. However, the proportion of women closely involved / with a boyfriend was greater in the FNP arm compared to the usual care arm (75.6% vs 68.1%). Similarly, the proportion of women living with the father of their baby was greater in the FNP arm than the usual care arm (26.8% vs 20.7%). There was a small difference in the proportion of women either not employed, in education or training between FNP and usual care arms (56.8% vs 52.5%) and a similarly small difference for deprivation score (mean IMD scores of 41.4 vs 39.2). There was no difference between trials arms for baseline self-efficacy scores. There was a small difference between FNP and usual care arms for those reporting difficulty with basic skills (35.7% vs 29.5%) but no differences on life skills or having a life burden. Finally, the proportion reporting smoking was similar between FNP and usual care arms. Overall this may suggest that women who are in a significant relationship and who are more vulnerable are more likely to disengage from the trial if they are allocated to FNP.

32
Table S9.1 Assessment of attrition: participant baseline characteristics by follow-up at 24 month completion by trial arm
All participants (1618) Participants lost to follow-up (464) Remaining participants (1154) FNP (n=808) Usual Care (n=810) FNP (n=213) Usual Care (n=251) FNP (n=595) Usual Care (n=559) Age in years Median (25th to 75th centile)
17.8
(17.0 to 18.8)
17.8
(16.9 to 18.8)
17.7
(17.0 to 18.6)
17.7
(16.8 to 18.7)
17.9
(17.0 to 18.8)
17.9
(16.9 to 18.8) Ethnicity
White background 711 (88.0) 714 (88.1) 185 (86.9) 214 (85.3) 526 (88.4) 500 (89.4) Mixed background 47 (5.8) 42 (5.2) 11 (5.2) 16 (6.4) 36 (6.1) 26 (4.7) Asian background 16 (2.0) 11 (1.4) 2 (0.9) 4 (1.6) 14 (2.4) 7 (1.3) Black background 31 (3.8) 40 (4.9) 13 (6.1) 16 (6.4) 18 (3.0) 24 (4.3) Other background 3 (0.4) 3 (0.4) 2 (0.9) 1 (0.4) 1 (0.2) 2 (0.4)
Relationship status with baby’s father Married 9 (1.1) 11 (1.4) 4 (1.9) 4 (1.6) 5 (0.8) 7 (1.3) Separated 79 (9.8) 86 (10.6) 23 (10.8) 39 (15.5) 56 (9.4) 47 (8.4) Closely involved/boyfriend 613 (75.9) 609 (75.2) 161 (75.6) 171 (68.1) 452 (76.0) 438 (78.4) Just friends 107 (13.2) 104 (12.8) 25 (11.7) 37 (14.7) 82 (13.8) 67 (12.0)
Live with father of baby Yes 184 (22.8) 184 (22.7) 57 (26.8) 52 (20.7) 127 (21.3) 132 (23.6) No 552 (68.3) 560 (69.1) 134 (62.9) 169 (67.3) 418 (70.3) 391 (69.9) Missing 72 (8.9) 66 (8.1) 22 (10.3) 30 (12.0) 50 (8.4) 36 (6.4)
NEET status*: N=697 N=667 N=183 N=200 N=514 N=487 Yes 333 (47.8) 330 (49.5) 104 (56.8) 105 (52.5) 229 (44.6) 225 (46.2) No 362 (51.9) 335 (50.2) 79 (43.2) 93 (46.5) 283 (55.0) 262 (53.8) Missing 2 (0.3) 2 (0.3) 0 (0.0) 2 (1.0) 2 (0.4) 0
Index of Multiple Deprivation Score†
Median (25th to 75th centile)
N=802 39.1
(24.9 to 52.3)
N=804 39.2
(25.5 to 51.6)
N=213 41.3 (29.3 to 53.4)
N=250 39.2
(25.4 to 50.9)
N=589 38.3
(23.5 to 52.2)
N=554 39.2
(29.5 to 51.7) Generalized self-efficacy scale (score 10 to 40) §
Median (25th to 75th centile)
N=798 30.1
(28.0 to 33.0)
N=794 29.9
(27.0 to 32.0)
N=211 29.5
(27.0 to 32.0)
N=245 29.7
(28.0 to 32.0)
N=587 30.3
(28.0 to 33.0)
N=549 29.9
(27.0 to 33.0) Adaptive functioning Difficulty in at least one basic skill
Yes 230 (28.5) 200 (24.7) 76 (35.7) 74 (29.5) 154 (25.9) 126 (22.5) No 577 (71.4) 608 (75.1) 136 (63.8) 176 (70.1) 441 (74.1) 432 (77.3) Missing 1 (0.1) 2 (0.2) 1 (0.5) 1 (0.4) 0 (0.0) 1 (0.2)
Had 3 or less life skills (out of 5) Yes 205 (25.4) 229 (28.3)) 69 (32.4) 79 (31.5) 136 (22.9) 150 (26.8) No 599 (74.1) 579 (71.5 141 (66.2) 172 (68.5) 458 (76.9) 407 (72.8) Missing 4 (0.5) 2 (0.2) 3 (1.4) 0 (0.0) 1 (0.2) 2 (0.4)
At least one burden Yes 228 (28.2) 248 (30.6) 60 (28.2) 71 (28.3) 168 (28.2) 177 (31.7) No 573 (70.9) 558 (68.9) 152 (71.4) 179 (71.3) 421 (70.8) 379 (67.8) Missing 7 (0.9) 4 (0.5) 1 (0.4) 1 (0.4) 6 (1.0) 3 (0.5)
Smoking (Participant self-reported) Ever smoked 649 (80.3) 645 (79.6) 174 (81.7) 200 (79.7) 475 (79.8) 445 (79.6)

33
All participants (1618) Participants lost to follow-up (464) Remaining participants (1154) FNP (n=808) Usual Care (n=810) FNP (n=213) Usual Care (n=251) FNP (n=595) Usual Care (n=559)
Never smoked 159 (19.7) 165 (20.4) 39 (18.3) 51 (20.3) 120 (20.2) 114 (20.4) Missing 0 (0.0) 0 (0.0) 0 (0.0) 0 (0.0) 0 (0.0) 0 (0.0)
Values are N (%) unless otherwise stated * Definition of NEET status: Not in education employment or training (applicable only to those whose age at end of previous academic year at time of baseline interview was >16) † Higher IMD score indicated more deprivation § Higher score indicates higher level of self-efficacy

34
10. Attrition to primary smoking analysis Table S10.1 provides an overview of how the trial sample was affected by loss to follow-up for the main smoking analysis. There was no difference between trials arms in those not included in the analysis by age. There was a small difference in ethnicity, with more women from a white background not included in the FNP arm (90.4%) compared to the usual care arm (86.4%). More women at baseline who were closely involved / with a boyfriend were not included in analysis in the FNP (76.6%) compared to the usual care arm (67.5%). There was also a small difference in the proportion of women who at baseline lived with the father of their baby who were not included in analysis between FNP (26.4%) and usual care arm (22.6%). There was a small difference in the proportion of women either not employed, in education or training between FNP (57.5%) and usual care (53.1%) arms not included in analysis. There was a difference in the proportion of women reporting difficulty in at least one basic skill at baseline not included in the analysis between FNP (36%) and usual care (27.9%) arms. There were no other group differences observed. Similar to the assessment of attrition at 24 months, this may suggest that women who are in a significant relationship and who are more vulnerable are more likely to disengage from the trial if they are allocated to FNP.

35
Table S10.1 Assessment of attrition: participant baseline characteristics by inclusion in smoking analysis All participants (1618) Not in primary smoking analysis (526) In Primary Analysis (1092) FNP
(n=808) Usual Care
(n=810) FNP
(n=261) Usual Care
(n=265) FNP
(n=547) Usual Care
(n=545) Age in years Median (25th to 75th centile)
17.8
(17.0 to 18.8)
17.8
(16.9 to 18.8)
17.9
(17.0 to 18.6)
17.9
(17.0 to 18.7)
17.9
(17.0 to 18.8)
17.8
(16.9 to 18.8) Ethnicity
White background 711 (88.0) 714 (88.1) 236 (90.4) 229 (86.4) 475 (86.8) 485 (89.0) Mixed background 47 (5.8) 42 (5.2) 13 (5.0) 14 (5.3) 34 (6.2) 28 (5.1) Asian background 16 (2.0) 11 (1.4) 1 (0.4) 8 (3.0) 15 (2.7) 3 (0.6) Black background 31 (3.8) 40 (4.9) 10 (3.8) 14 (5.3) 21 (3.8) 26 (4.8) Other background 3 (0.4) 3 (0.4) 1 (0.4) 0 (0.0) 2 (0.4) 3 (0.6)
Relationship status with baby’s father Married 9 (1.1) 11 (1.4) 2 (0.8) 6 (2.3) 7 (1.3) 5 (0.9) Separated 79 (9.8) 86 (10.6) 34 (13.0) 31 (11.7) 45 (8.2) 55 (10.1) Closely involved/boyfriend 613 (75.9) 609 (75.2) 200 (76.6) 179 (67.5) 413 (75.5) 430 (78.9) Just friends 107 (13.2) 104 (12.8) 25 (9.6) 49 (18.5) 82 (15.0) 55 (10.1)
Live with father of baby Yes 184 (22.8) 184 (22.7) 69 (26.4) 60 (22.6) 115 (21.0) 124 (22.8) No 552 (68.3) 560 (69.1) 168 (64.4) 174 (65.7) 384 (70.2) 386 (70.8) Missing 72 (8.9) 66 (8.1) 24 (9.2) 31 (11.7) 48 (8.8) 35 (6.4)
NEET status*: N=697 N=667 N=219 N=224 N=478 N=463 Yes 333 (47.8) 330 (49.5) 126 (57.5) 119 (53.1) 207 (43.3) 211 (45.6) No 362 (51.9) 335 (50.2) 92 (42.0) 103 (46.0) 270 (56.5) 252 (54.4) Missing 2 (0.3) 2 (0.3) 1 (0.5) 2 (0.9) 1 (0.2) 0 (0.0)
Socio-economic status: Overall Index of Multiple Deprivation Score†
Median (25th to 75th centile)
N=802
39.1 (24.9 to 52.3)
N=804
39.2 (25.5 to 51.6)
N=260
39.8 (27.6 to 53.7)
N=263
41.3 (26.4 to 52.6)
N=542
37.0 (23.5 to 51.8)
N=541
37.6 (25.3 to 51.3)
Generalized self-efficacy scale§ (score 10 to 40)
Median (25th to 75th centile)
N=798 30.1
(28.0 to 33.0)
N=794 29.9
(27.0 to 32.0)
N=258 30
(28 to 33)
N=255 30
(28 to 33)
N=540 30
(28 to 33)
N=539 30
(27 to 32) Difficulty in at least one basic skill
Yes 230 (28.5) 200 (24.7) 94 (36.0) 74 (27.9) 136 (24.9) 126 (23.1) No 577 (71.4 608 (75.1) 166 (63.6) 190 (71.7) 411 (75.1) 418 (76.7) Missing 1 (0.1) 2 (0.2) 1 (0.4) 1 (0.4) 0 (0) 1 (0.2)
Had 3 or less life skills (of 5) Yes 205 (25.4) 229 (28.3) 86 (33.0) 87 (32.8) 119 (21.8) 142 (26.1) No 599 (74.1) 579 (71.5) 171 (65.5) 177 (66.8) 428 (78.2) 402 (73.8)

36
Table S10.1 Assessment of attrition: participant baseline characteristics by inclusion in smoking analysis All participants (1618) Not in primary smoking analysis (526) In Primary Analysis (1092) FNP
(n=808) Usual Care
(n=810) FNP
(n=261) Usual Care
(n=265) FNP
(n=547) Usual Care
(n=545) Missing 4 (0.5) 2 (0.2) 4 (1.5) 1 (0.4) 0 (0) 1 (0.2)
At least one burden Yes 228 (28.2) 248 (30.6) 77 (29.5) 83 (31.3) 151 (27.6) 165 (30.3) No 573 (70.9) 558 (68.9) 182 (69.7) 180 (67.9) 391 (71.5) 378 (69.4) Missing 7 (0.9) 4 (0.5) 2 (0.8) 2 (0.8) 5 (0.9) 2 (0.4)
Smoking Ever smoked 649 (80.3) 645 (79.6) 215 (82.4) 220 (82.6) 433 (79.2) 424 (77.8) Never smoked 159 (19.7) 165 (20.4) 46 (17.6) 46 (17.4) 114 (20.8) 121 (22.2) Missing 0 (0.0) 0 (0.0) 0 (0.0) 0 (0.0) 0 (0.0) 0 (0.0)
Values are N (%) unless otherwise stated * Definition of NEET status: Not in education employment or training (applicable only to those whose age at end of previous academic year at time of baseline interview was >16) † Higher IMD score indicated more deprivation § Higher score indicates higher level of self-efficacy

37
11. Delivery of FNP against program fidelity goals Note: Family Nurse Partnership Management Manual (2012) clarifies fidelity targets for (i) Recruitment and enrolment (ii) Attrition (iii) Dosage and (iv) Programme Content. We assessed intervention implementation against FNP Core Model Elements and Fidelity goals using programme monitoring data and trial recruitment records. FNP clients met programme eligibility criteria and a high proportion of women (75%) offered FNP enrolled. The proportion of participants enrolled onto the programme by 16 weeks gestation (39.7%) was lower than targeted (60%) but similar to that observed at the same trial sites in the two and a half year period subsequent to the end of trial recruitment (41.6%). The mean number of valid visits received by phase (9.71, 18.63 and 13.22) was lower than targeted (14, 28 and 22) but greater than observed in the English implementation evaluation, and the first two US NFP trials. The proportion of participants who completed the programme meeting or exceeding target rates of expected visits (Pregnancy: 80%, Infancy: 65% and Toddlerhood: 60%) were 57.7%, 53.0% and 43.6% respectively. Rates of programme attrition by phase were 3.6%, 10.1% and 7.9% respectively with a cumulative attrition rate of 21.2%, well within the maximum acceptable rates (by phase:10%, 20%, 10%, overall: 40%). On average, visits were 79.14 minutes in duration, approximately 30% longer than the target minimum of 60 minutes. Nurse-reported programme content was broadly in line with prescribed targets although with a greater emphasis upon Environmental health in each phase and with less variability in overall domain coverage than indicated by independent rating of consultation recordings. Table S11.1 Fidelity goal: Enrolment into FNP program
Fidelity goal Available evidence At least 60% of clients enrolled into FNP by 16th week pregnancy, 100% no later than 28 weeks
Of the 718 trial participants allocated to FNP who could be linked to enrolment data from the FNP IS, 285 (39.7%) were enrolled by 16 weeks gestation. We also reviewed aggregate data for all FNP clients enrolled at the same trial sites (n=3311) and FNP clients at non-trial sites in England (n=8755) enrolled outside of the trial recruitment window (1st January 2010 to 31st December 2013). The proportions of women enrolled by the 16th week of pregnancy in these two groups were 41.6% and 48.6% respectively.
100% clients are first-time mothers, within specified site age bracket
Ensured by trial eligibility criteria
75% of eligible clients offered program enrolled 710 of 808 women randomised to FNP enrolled on the program (89%)
Each nurse enrols 25 families (or pro rata adjusted) within 12 months of recruitment commencing
No evidence available to trial team

38
Fidelity goal: Cumulative attrition is 40% or less through to child’s second birthday (and 10% / 20% / 10% or less during pregnancy, infancy, toddlerhood phases respectively).
Table S11.2 Fidelity goal: Attrition from FNP by phase

39
Dosage
Fidelity goal: Average home visit with participants is 60 minutes or longer in duration. Evidence: The average nurse-reported duration of valid visits was 79 minutes.
Fidelity goal: Clients receive 80% / 65% / 60% or more of expected visits during pregnancy, infancy, toddlerhood phase respectively.
Table S11.3 Fidelity goal: program dosage - valid visits per phase for n=719 women Phase Pregnancy Infancy Toddlerhood N (%) women receiving at least one valid visit
713 (99.2%) 669 (93.0%) 606 (84.3%)
Median (25th to 75th centile) valid visits received
10 (8 to12) 19 (14.5 to 22) 13 (8 to 16)
Mean (sd) valid visits received 9.71 (3.45) 18.63 (6.04) 13.22 (1.49) Range valid visits received 1 to 20 1 to 44 1 to 37
N (%) women not receiving a single valid visit N (%)
6* (0.8%) 28 (3.9%) 81 (11.3%)
N (%) withdrew in previous phase NA 22 (3.1%) 32 (4.5%) * Reasons for the total of 9,504 non-valid visits: i) Visit encounter form not completed (n=12, 0.1%), ii) visit not completed (n=8,887, 93.5%), visit <15 minutes duration (n=62, 0.7%), iii) visit without client present (n=284, 3.0%), iv) visit scheduled and subsequent to another scheduled visit (n=259, 2.7%). Visits excluded using hierarchy of reasons ordered above (i-iv), in some cases visit may have been excluded due to more than one reason.

40
Programme content Fidelity goal: Home visit content reflects variation in developmental needs by programme phase (within specific ranges).
Table S11.4 Fidelity goal: program content - nurse-reported visit domain coverage during pregnancy, infancy and toddlerhood
Delivery phase
Personal Health
Maternal Role Friends and Family
Life Course Environmental Health
Pregnancy Target 35-40% 23-25% 10-15% 10-15% 7-10% N=713i Median
(25th to 75th centiles) 34.7
(27.6 to 39.5) 25.8
(22.9 to 29.1) 15.0
(12.9 to 18.5) 12.7
(10.0 to 15.2) 12.3
(9.5 to 16.0) Mean (SD) 33.7 (7.8) 26.0 (5.6) 15.7 (4.4) 13.0 (4.3) 12.9 (4.7)
Infancy Target 14-20% 45-50% 10-15% 10-15% 7-10%
N=669ii Median (25th to 75th centiles)
20.9 (18.6 to 24.3)
40.5 (35.0 to 46.0)
14.1 (11.7 to 16.7)
12.3 (10.0 to 15.0)
12.3 (10.1 to 15.7)
Mean (SD) 21.8 (5.1) 40.3 (8.2) 14.5 (3.8) 12.4 (3.7) 13.1 (4.1)
T’hood Target 10-15% 40-45% 10-15% 18-20% 7-10%
N=606iii Median (25th to 75th centiles)
17.1 (14.1 to 20.8)
40.5 (35.7 to 44.5)
14.7 (12.8 to 17.4)
15.0 (12.2 to 18.0)
13.0 (10.5 to 16.4)
Mean (SD) 17.8 (5.8) 40.2 (8.0) 15.2 (3.8) 15.0 (4.7) 13.7 (5.2)
(i) N=3 participants did not receive a valid visit in the pregnancy phase, (ii) N=21 withdrawals in the pregnancy phase, N=26 participants did not receive a valid visit in the infancy phase, (iii) N=30 withdrawals in the pregnancy or infancy phase, N=80 participants did not receive a valid visit in the toddler phase 12. Withdrawals and adverse events Table S12.1 Summary of withdrawals by treatment allocation and reported Serious Adverse Events (SAEs) Reason for withdrawal FNP Usual Care Total Mandatory*
Ineligible 3 2 5 Miscarriage / Termination of pregnancy 24 27 51† Stillbirth / neonatal / infant death 5 7 12 Death of mother infant pair 1 0 1 Adoption of child 7 7 14
Elective No longer wished to take part in the trial 46 36‡ 82 Did not wish to commit to FNP programme 15 0 15 Moved outside FNP area 0 1 1 Adoption planned following birth 0 1 1 No reason given 9 2 11
Total 110 83 193 * Due to the nature of antenatal and infancy care, including frequent hospitalisations, during the trial many trial participants or their child incurred a Good Clinical Practice defined Serious Adverse Event (SAE). A total of 1315 SAEs (primarily clinical events associated with pregnancy and infancy period) were reported with 667 (41.2%) of participants (mother or child) having at least one event, 310 in the usual care arm, and 357 in the FNP arm. Throughout the trial period none of the SAEs were considered by the trial management group to have been FNP related. † Includes miscarriages, terminations and termination of molar pregnancy ‡Includes one woman who did not wish to continue as not allocated FNP

41
13. Bibliography for included outcome measures 1. Dukic VM, Niessner M, Benowitz N, Hans S, Wakschlag L. Modeling the relationship of cotinine and self-reported measures of maternal smoking during pregnancy: A deterministic approach. Nicotine & Tobacco Research 2007; 9 (4): 453-65. 2. International statistical classification of diseases and related health problems. - 10th revision, edition 2010. Geneva, World Health Organization. 3. Calderwood L, Ward K, other members of the Millennium Cohort Team: Millennium Cohort Study First Survey: Derived Variables. London: Centre for Longitudinal Studies, Bedford Group for Lifecourse & Statistical Studies, Institute of Education, University of London; 2004. [Millennium Cohort Study] 4. NatCen: Millennium Cohort Study First Survey: CAPI Questionnaire Documentation. London: Institute of Education, University of London; 2003. [Millennium cohort study] 5. Muller ME: A questionnaire to measure mother-to-infant attachment. J Nurs Meas 1994, 2(2):129–141. 6. Fish M, Stifter CA: Patterns of mother-infant interaction and attachment: A cluster-analytic approach. Infant Behavior & Development 1995, 18(4): 435-446. 7. Bellman M, Lingam S, Aukett A: Schedule of Growing Skills II (SOGS II). 2nd edition. London: GL Assessment Limited; 1996. 8. Coplan J, Gleason JR, Ryan R, Burke MG, Williams ML: Validation of an early language milestone scale in a high-risk population. Pediatrics 1982, 70(5):677–683. [Early Language Milestone Scale] 9. Holtby S, Zahnd E, Lordi N, McCain C, Chia YJ, Kurata J: Health of California’s Adults, Adolescents and Children: Findings from CHIS 2003 and CHIS 2001. Los Angeles, CA: UCLA Center for Health Policy Research; 2006. 10. EQ-5D Website: [http://www.euroqol.org/] [EQ-5D] 11. Kessler RC, Andrews G, Colpe LJ, Hiripi E, Mroczek DK, Normand SLT, Walters EE, Zaslavsky AM: Short screening scales to monitor population prevalences and trends in non-specific psychological distress. Psychol Med 2002, 32(6):959–976. [Kessler scale] 12. Whooley MA, Avins AL, Miranda J, Browner WS: Case-finding instruments for depression – two questions are as good as many. J Gen Intern Med 1997, 12(7):439–445. [Whooley scale] 13. Cox JL, Holden JM, Sagovsky R: Detection of postnatal depression - development of the 10 item Edinburgh postnatal depression scale. Br J Psychiatry 1987, 150:782–786. [Edinburgh Postnatal Depression Scale] 14. The General Self-Efficacy Scale: [http://userpage.fu-berlin.de/~health/selfscal.htm]. [General Self-efficacy Scale] 15. Booth CL, Mitchell SK, Barnard KE, Sieker SJ: Development of Maternal Social Skills in Multiproblem Families: Effects on the Mother-Child Relationship. Dev Psychol 1989, 25(3): 403–412. 16. Barnard K, Hilsinger G, Patteson D, Snyder C, Solchany J, Shangle M: Washington State Public Health Training Plan: Improving Child-Family Health. Parent Protective Factors Project (1995-1999) Final Report July, 1999. Washington: US Department of Health; 1999. 17. Hegarty K: Composite Abuse Scale Manual. Melbourne: Department of General Practice, University of Melbourne; 2007. [Composite Abuse Scale] 18. Wakschlag LS, Pickett KE, Middlecamp MK, Walton LL, Tenzer P, Leventhal BL: Pregnant smokers who quit, pregnant smokers who don’t: does history of problem behavior make a difference? Soc Sci Med 2003, 56(12): 2449–2460. 19. Heatherton TF, Kozlowski LT, Frecker RC, Fagerstrom KO: The Fagerstrom test for nicotine dependence - a revision of the Fagerstrom tolerance questionnaire. Br J Addict 1991, 86(9):1119-1127. 20. Knight JR, Sherritt L, Shrier LA, Harris SK, Chang G: Validity of the CRAFFT substance abuse screening test among adolescent clinic patients. Arch Pediatr Adolesc Med 2002, 156(6):607–614. [CRAFFT] 21. Hays RD, Sherbourne CD, Mazel RM: User’s Manual for the Medical Outcomes Study (MOS) Core Measures of Health-Related Quality of Life. Santa Monica, CA: Rand; 1995. [MOS Survey] 22. Sherbourne CD, Stewart AL: The MOS social support survey. Soc Sci Med 1991, 32(6):705 714. [MOS Survey] 23. Dunst CJ, Leet HE: Measuring the adequacy of resources in households with young children. Child Care Health Dev 1987, 13(2):111–125. 24. Rust J, Bennun I, Crowe M, Golombok S: The GRIMS. A psychometric instrument for the assessment of marital discord. J Fam Ther 1990, 12(1):45–57. [Golombok Rust Inventory of Marital State]