supplementary appendix accompanying the manuscript: … · (franceschi 2005). the percentages of...
TRANSCRIPT

Diaz et al. Supplementary Appendix
SUPPLEMENTARY APPENDIX
Accompanying the manuscript: HEALTH AND ECONOMIC IMPACT OF HPV 16 AND 18 VACCINATION AND CERVICAL CANCER SCREENING IN INDIA Mireia Diaz, Jane J. Kim, Ginesa Albero, Silvia de Sanjosé, Gary Clifford, F. Xavier Bosch, and Sue J. Goldie
1 of 36

Diaz et al. Supplementary Appendix
This Technical Appendix provides selected assumptions and methods for our model of human papillomavirus and cervical cancer, including the model parameterization process, screening strategies, cost estimates, and results not available in the main paper.
Part I: Model parameterization Overview
Because many of the processes of HPV infection, progression, and clearance are uncertain, the model was calibrated to accurately match observed epidemiologic data of the natural history of HPV infection and cervical cancer. Model calibration determined combinations of model inputs (i.e., “input parameter sets”) that produce model outcomes simultaneously consistent with epidemiological data from multiple sources (i.e., “calibration targets”). Multiple input parameter sets were randomly generated, used in the model to produce model output, and evaluated in terms of how well the model outputs simultaneously fit the calibration targets (Kim 2007). Model input parameters: prior distributions and searching
Our calibration methods have been documented elsewhere (Kim 2007), but briefly, a comprehensive literature review on epidemiologic data was conducted to define baseline age-specific natural history model inputs and plausible ranges around model parameters. We assumed the basic relationship between infection with high-risk types of HPV and cervical carcinogenesis does not fundamentally differ between countries and therefore our initial plausible ranges were based on the best available data regardless of setting. However, given that the epidemiology, risk factors, and burden of disease vary considerably between countries, we calibrated the model to India-specific epidemiological data, which included age- and type-specific HPV prevalence, age-specific prevalence of cervical intraepithelial lesions, HPV type distribution within different grades of cervical cancer, and age-specific cancer incidence. We elected to adapt the model to Southeastern India based on the availability of data for nearly all epidemiological targets required for our calibration procedure (Franceschi 2003, 2005, Parkin 2005). We searched over ranges of multipliers that were applied to these baseline inputs. The baseline inputs and multipliers together encompassed a uniform joint prior distribution on model input parameters.
Input parameter sets were drawn from the joint prior distribution. Multiple simulations of the natural history model were conducted for populations of 100,000 individuals. For a single simulation, one value for each parameter was randomly selected from a uniform distribution over the identified range. In total, simulations were conducted with 555,000 uniquely sampled parameter sets. Model outcomes (e.g., age-specific prevalence of CIN1 or HPV type-distribution in invasive cervical cancer) using each parameter set were compared with multiple epidemiologic targets using a likelihood-based approach. Defining calibration targets
In total, 64 calibrations targets were defined. Calibration targets included type- and age-specific prevalence of HPV, age-specific prevalence of CIN categories, type distribution within CIN categories, age-specific cancer incidence, cumulative cancer incidence, and type- and age-
2 of 36

Diaz et al. Supplementary Appendix
specific duration of HPV infections and CIN. For each calibration target, we determined a point estimate and confidence interval, using population-based data sources. Calibration target data were not used directly in the initial model parameterization; instead they informed multipliers of these initial model inputs. All prevalence and HPV type distribution targets were calculated using 95% confidence intervals of the binomial distribution in STATA/SE 9.0 (Reiczigel 2003, Tobi 2005). Cancer incidence targets were determined using the lower limit of the 95% confidence interval of the minimum rates from Bangalore registries as the lower bound, and the upper limit of the 95% confidence interval of the maximum rates from Chennai registries as the upper bound. The 95% confidence interval was calculated using the standard error for a rate (NY State Dept of Health). Goodness-of-fit The model outputs from each input parameter set were compared to the calibration targets. Model fit to the targets was evaluated by constructing a goodness-of-fit score. A composite goodness-of-fit score for each parameter set was computed by summing the log likelihood of each model outcome (Kim 2007). Goodness-of-fit scores followed a chi square distribution with the number of degrees of freedom equal to the number of targets. Input parameter acceptance criterion Our acceptance criterion had two parts: 1) overall goodness-of-fit; and 2) emphasis of population targets of greatest importance for policy questions relating to HPV vaccination and testing. First, we determined our best-fitting parameter set as the one with the lowest goodness-of-fit score – the model-generated input parameter whose simulated model outputs were simultaneously closest to all calibration targets. We identified parameter sets that were statistically indistinguishable from the best-fitting set. To do so, we calculated a critical goodness-of-fit value. We used a likelihood ratio test with the null hypothesis being that the critical goodness-of-fit score is equal to our best goodness-of-fit score. The alternative hypothesis is that they are not equal. We fixed our significance level at p=0.05 and then identified the lowest goodness-of-fit score for which we could reject the null hypothesis at this significance level. All parameter sets with goodness-of-fit scores greater than this critical value were discarded, and all others (for which we could not reject the null hypothesis of having goodness-of-fit scores equal to the best fitting parameter set’s goodness-of-fit score) were retained and considered “good fitting”. Good-fitting input parameter set selection for cost-effectiveness analyses Because of the potentially large number of parameter sets retained through this acceptance rule, we sampled from the accepted input parameter sets to generate a representative subset of the best parameter sets for use in our cost-effectiveness analysis. To incorporate the effect of parameter uncertainty, cost-effectiveness analyses were conducted with a selected sample of
3 of 36

Diaz et al. Supplementary Appendix
good-fitting parameter sets, and results were reported as the mean and range of outcomes, while incremental cost-effectiveness ratios were reported as the ratio of the mean costs divided by the mean effects of a sample of good-fitting parameter sets (Stinnett 1997). Calibration target data sources Age-specific prevalence of high-risk and low-risk HPV types Population-based epidemiologic data in India show variation in HPV prevalence. Based on data from 17,365 women with normal cytology, HPV prevalence ranged from 4.8% in Trivandrum to 7.8% in Kolkata (Sankaranarayanan 2004). An HPV survey conducted by the International Agency for Research (IARC) in a rural area of Tamil Nadu, a southern India state, reported an HPV prevalence of 14% using a PCR-based HPV assay, based on 1,799 women with normal cytology (Franceschi 2005). HPV prevalence of women attending screening programs in three states of northeast India ranged from 6.7% in Manipur to over 11% in Sikkim and West Bengal (Laikangbam 2007). Although the two most common types detected in invasive cervical cancer are HPV 16 (55%) and HPV 18 (15%) (Smith 2007), studies in India have reported HPV 16 in 53.5% to 73.6% of cases, and HPV 18 in 9.3% to 17.1% (Bhatla 2006, Franceschi 2003, Munirajan 1998, Peedicayil 2006, Sowjanya 2005). IARC survey data from women enrolled in a study in the Dindigul District of Tamil Nadu were used to inform the age-specific prevalence of high-risk and low-risk HPV types, CIN 1 and CIN 2,3 (Franceschi 2005). The survey was conducted between February and October 2003 in 109 panchayats (local administrative structures consisting of 4-23 villages) and invited a total of 2,000 married, non-pregnant women aged 16-59 years. Data collected from women with adequate HPV test results and normal cytology were used to inform our HPV type prevalence estimates. The HPV prevalence in women with normal cytology was 14.0 (252 out of 1,799) and the prevalence of cervical lesions was 5.0% (94 out of 1,983). No cases of cancer were observed.
Table 1. Age-specific prevalence of HR and LR HPV types in women with normal cytology and 95% confidence intervals.
HPV-HR HPV-LR Age Group N Total a
N Prevalence 95% CI N Prevalence 95% CI 12-14 - - - - 15-19 24 3 0.125 0.0266 0.3236 2 0.083 0.0103 0.2700 20-24 297 25 0.084 0.0552 0.1218 15 0.051 0.0285 0.0819 25-29 566 50 0.088 0.0663 0.1148 22 0.039 0.0245 0.0583 30-34 238 22 0.092 0.0588 0.1366 10 0.042 0.0203 0.0759 35-39 256 28 0.109 0.0739 0.1542 10 0.039 0.0391 0.0707 40-44 168 21 0.125 0.0791 0.1847 5 0.03 0.0097 0.0681 45-49 141 12 0.085 0.0448 0.1439 6 0.043 0.0158 0.0903 50-54 74 8 0.108 0.0478 0.2020 3 0.041 0.0084 0.1139 55-59 35 3 0.086 0.0180 0.2306 1 0.029 0.0007 0.1492 60-64 - - - 65-69 - - -
4 of 36

Diaz et al. Supplementary Appendix
70-74 - - - >74 - - -
1,799 172 0.096 74 0.041 a Total number includes those women with normal cytology and adequate HPV test result Age-specific prevalence of CIN 1 and CIN 2,3 Table 2. Age-specific prevalence of CIN1 and CIN2-3 and 95% confidence intervals.
CIN 1 CIN 2-3 Age Group N Total a
N Prevalence 95% CI N Prevalence 95% CI
12-14 - - - 15-19 24 0 0.0000 0.0000 0.1425 0 0.0000 0.0000 0.1425 20-24 311 14 0.0450 0.0248 0.0976 0 0.0000 0.0000 0.0118 25-29 593 22 0.0371 0.0234 0.0734 5 0.0084 0.0027 0.0242 30-34 254 13 0.0512 0.0275 0.1097 3 0.0118 0.0024 0.0398 35-39 268 9 0.0336 0.0155 0.0815 3 0.0112 0.0023 0.0378 40-44 178 7 0.0393 0.0160 0.1009 3 0.0169 0.0035 0.0565 45-49 151 6 0.0397 0.0147 0.1017 4 0.0265 0.0073 0.0845 50-54 78 1 0.0128 0.0003 0.0694 3 0.0385 0.0080 0.1261 55-59 36 1 0.0278 0.0007 0.1453 0 0.0000 0.0000 0.0974 60-64 - - - 65-69 - - - 70-74 - - - >74 - - -
1,893 73 0.0386 21 0.0111
a Total number includes those women who did not have an adequate HPV test result, but did have adequate cytology.
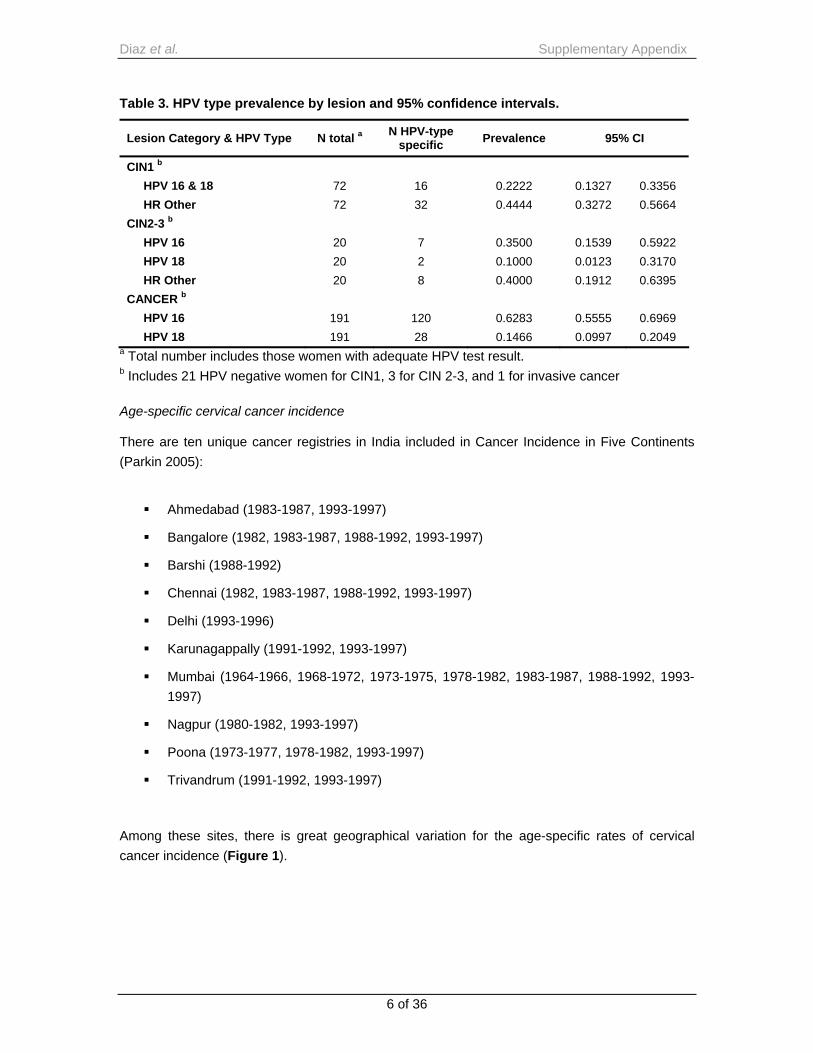
HPV type prevalence by lesion status We estimated the percentages of HPV 16, HPV 18, or high risk other in CIN 2,3 and the percentage of HPV16/18 or high risk other in CIN 1 based on the IARC HPV prevalence survey (Franceschi 2005). The percentages of HPV 16 and HPV 18 in invasive cervical cancer cases were estimated from an international multicenter case-control study of invasive cervical cancer (Franceschi 2003). This study was conducted in the Cancer Institute in Chennai from June 1998 to May 1999 with 222 women diagnosed with invasive cervical cancer; control women were other inpatients or visitors at the Cancer Institute.
5 of 36
Diaz et al. Supplementary Appendix
Table 3. HPV type prevalence by lesion and 95% confidence intervals.
Lesion Category & HPV Type N total a N HPV-type specific Prevalence 95% CI
CIN1 b HPV 16 & 18 72 16 0.2222 0.1327 0.3356 HR Other 72 32 0.4444 0.3272 0.5664
CIN2-3 b HPV 16 20 7 0.3500 0.1539 0.5922 HPV 18 20 2 0.1000 0.0123 0.3170 HR Other 20 8 0.4000 0.1912 0.6395
CANCER b HPV 16 191 120 0.6283 0.5555 0.6969 HPV 18 191 28 0.1466 0.0997 0.2049
a Total number includes those women with adequate HPV test result. b Includes 21 HPV negative women for CIN1, 3 for CIN 2-3, and 1 for invasive cancer Age-specific cervical cancer incidence There are ten unique cancer registries in India included in Cancer Incidence in Five Continents (Parkin 2005):
Ahmedabad (1983-1987, 1993-1997)
Bangalore (1982, 1983-1987, 1988-1992, 1993-1997)
Barshi (1988-1992)
Chennai (1982, 1983-1987, 1988-1992, 1993-1997)
Delhi (1993-1996)
Karunagappally (1991-1992, 1993-1997)
Mumbai (1964-1966, 1968-1972, 1973-1975, 1978-1982, 1983-1987, 1988-1992, 1993-1997)
Nagpur (1980-1982, 1993-1997)
Poona (1973-1977, 1978-1982, 1993-1997)
Trivandrum (1991-1992, 1993-1997)
Among these sites, there is great geographical variation for the age-specific rates of cervical cancer incidence (Figure 1).
6 of 36

Diaz et al. Supplementary Appendix
7 of 36
Figure 1. Age-specific cervical cancer incidence rates, India, 1964-1997, various sites.
0
20
40
60
80
0- 5- 10- 15- 20- 25- 30- 35- 40- 45- 50- 55- 60-
100
120
140
160
180
65- 70- 75- 80+
Ahmedabad 1983-1987
Ahmedabad 1993-1997
Bangalore 1982Bangalore 1983-1987
Bangalore 1988-1992
Bangalore 1993-1997
Barshi 1988-1992Chennai (Madras) 1982
Chennai (Madras) 1983-1987
Chennai (Madras) 1988-1992
Chennai (Madras) 1993-1997Delhi 1993-1997
Karunagappally 1991-1992
Karunagappally 1993-1997
Mumbai (Bombay) 1964-1966Mumbai (Bombay) 1968-1972
Mumbai (Bombay) 1973-1975
Mumbai (Bombay) 1978-1982
Mumbai (Bombay) 1983-1987Mumbai (Bombay) 1988-1992
Mumbai (Bombay) 1993-1997
Nagpur 1980-1982
Nagpur 1993-1997Poona 1973-1977
Poona 1978-1982
Poona 1993-1997
Trivandrum 1991-1992Trivandrum 1993-1997
As the studies on HPV prevalence and cervical lesions were from Southeastern India, the Bangalore and Chennai registries were selected to calculate the targets (Tables 4 and 5). These data, with a total of 13,646 cancer cases from 1982 to 1997, provided estimates of the number of incident cases for five-year age ranges (20 to 75+) and the size of population at risk of developing invasive cervical cancer.

Diaz et al. Supplementary Appendix
Table 4. Cervical cancer incidence data from Bangalore cancer registries (1982-1997).
Period 1982 1983 - 1987 1988 - 1992 1993 - 1997
Age Group Population Cases Rate Population Cases Rate Population Cases Rate Population Cases Rate
0-4 197,311 0 0.00 943,540 0 0.00 946,330 0 0.00 1,031,988 0 0.005-9 204,881 0 0.00 1,059,800 0 0.00 1,166,318 0 0.00 1,247,303 0 0.0010-14 172,381 0 0.00 947,865 0 0.00 1,111,729 0 0.00 1,269,704 0 0.0015-19 152,523 0 0.00 861,655 2 0.23 1,018,904 3 0.29 1,188,322 1 0.0820-24 152,127 2 1.31 892,765 10 1.12 1,079,333 9 0.83 1,272,736 4 0.3125-29 130,519 9 6.90 799,765 30 3.75 1,006,913 40 3.97 1,271,339 31 2.4430-34 92,303 16 17.33 553,050 87 15.73 689,444 79 11.46 927,807 79 8.5135-39 84,031 38 45.22 476,730 140 29.37 564,958 181 32.04 852,930 154 18.0640-44 60,338 36 59.66 330,270 220 66.61 380,657 216 56.74 563,546 185 32.8345-49 47,178 49 103.86 292,840 247 84.35 378,350 263 69.51 463,092 293 63.2750-54 42,046 51 121.30 244,085 268 109.80 300,618 251 83.49 359,511 259 72.0455-59 23,582 34 144.18 156,800 182 116.07 214,506 206 96.03 248,899 224 90.0060-64 27,053 47 173.73 175,610 142 80.86 237,487 230 96.85 269,394 234 86.8665-69 13,338 16 119.96 97,560 107 109.68 142,906 122 85.37 155,612 165 106.0370-74 12,242 14 114.36 80,130 51 63.65 109,130 66 60.48 113,658 68 59.8375+ 13,038 8 61.36 83,555 40 47.87 139,210 64 45.97 152,579 64 41.95TOTAL 1,424,891 321 22.53 7,996,020 1,527 19.10 9,486,793 1,732 18.26 11,388,420 1,765 15.50
8 of 36

z et al. Supplementary Appendix
9 of 36
Period 1982 1983 - 1987 1988 - 1992 1993 - 1997
Age Group Population Cases Rate Population Cases Rate Population Cases Rate Population Cases Rate
0-4 197,783 0 0.00 865,040 0 0.00 942,683 0 0.00 761,425 0 0.005-9 205,026 0 0.00 980,050 0 0.00 1,068,013 0 0.00 908,665 0 0.0010-14 180,664 0 0.00 964,330 0 0.00 1,050,881 0 0.00 935,775 0 0.0015-19 163,840 0 0.00 925,720 0 0.00 1,008,808 0 0.00 1,000,595 0 0.0020-24 173,024 2 1.16 926,585 14 1.51 1,009,755 9 0.89 1,119,190 7 0.6325-29 147,730 7 4.74 819,640 55 6.71 893,213 34 3.81 1,042,140 27 2.5930-34 105,957 27 25.48 582,385 127 21.81 634,651 112 17.65 785,175 92 11.7235-39 105,141 80 76.09 552,065 287 51.99 601,616 244 40.56 738,905 212 28.6940-44 76,098 65 85.42 409,655 420 102.53 446,421 322 72.13 547,920 279 50.9245-49 62,680 88 140.40 373,610 534 142.93 407,142 403 98.98 460,230 403 87.5650-54 56,655 84 148.27 302,225 500 165.44 329,363 441 133.89 374,205 347 92.7355-59 37,527 62 165.21 213,625 369 172.73 232,800 384 164.95 306,975 321 104.5760-64 39,292 62 157.79 209,100 299 142.99 227,870 303 132.97 272,640 317 116.2765-69 19,274 17 88.20 122,315 145 118.55 133,294 141 105.78 179,590 162 90.2170-74 15,004 6 39.99 92,955 80 86.06 101,298 100 98.72 122,335 109 89.1075+ 12,429 8 64.37 84,740 48 56.64 92,334 47 50.90 139,685 82 58.70TOTAL 1,598,201 518 32.41 8,424,040 2,885 34.25 9,180,142 2,540 27.67 9,695,450 2,358 24.32
Table 5. Cervical cancer incidence data from Chennai cancer registries (1982-1997).
Dia

Diaz et al. Supplementary Appendix
10 of 36
LB Min Bangalore registries
UB Max Chenai registries
0
20
40
60
80
100
120
140
160
180
200
220
240
0- 5- 10- 15- 20- 25- 30- 35- 40- 45- 50- 55- 60- 65- 70- 75+
Age-group
Age-
spec
ific
inci
denc
e ra
tes Bangalore 1982-1997
Chennai 1982-1997
Table 6 shows the minimum rates and lower bound from Bangalore, and the maximum rates and upper bound from Chennai.
Table 6. Cervical cancer incidence targets and 95% confidence intervals.
Age Group Minimum rates a LB b Maximum rates c UB d 15-19 0,00 0,00 0,00 0,37 20-24 0,31 0,09 1,51 2,54 25-29 2,44 1,66 6,71 8,73 30-34 8,51 6,74 25,48 37,07 35-39 18,06 15,32 76,09 94,69 40-44 32,83 28,27 102,53 112,81 45-49 63,27 56,23 142,93 155,57 50-54 72,04 63,54 165,44 180,58 55-59 90,00 78,60 172,73 191,27 60-64 80,86 68,11 157,79 202,24 65-69 85,37 70,90 118,55 139,47 70-74 59,83 46,46 98,72 120,06 75+ 41,95 32,30 64,37 126,79
a Minimum rates for Bangalore registries b Lower Bound (LB): 95% lower confidence limit of the normal distribution for the minimum rates of the Bangalore registries c Maximum rates for Chennai registries d Upper Bound (UB): 95% upper confidence limit of the normal distribution for the maximum rates of the Chennai registries Figure 2. Age-specific cervical cancer incidence rates and 95% confidence intervals.

Diaz et al. Supplementary Appendix
11 of 36
Prevalence of HPV-LR
0.00
0.05
0.10
0.15
0.20
0.25
0.30
0.35
12-14 15_19 20_24 25_29 30_34 35_39 40_44 45_49 50_54 55_59 60_64 65-69 70_74 75_79
LBUBPrevalence
Top 5
Prevalence of HPV-HR
0.00
0.05
0.10
0.15
0.20
0.25
0.30
0.35
12_14 15_19 20_24 25_29 30_34 35_39 40_44 45_49 50_54 55_59 60_64 65-69 70_74 75_79
LBUBPrevalence
Top 5
Additional calibration results
The blue line represents the prevalence target, the black heavy solid lines the confidence intervals of the target data at each age group, and the thin lines, the model output for a sample of good-fitting sets. The red lines indicate the 5 best-fitting sets. Figure 3. Calibration results.

Diaz et al. Supplementary Appendix
12 of 36
Prevalence of CIN2
0.00
0.02
0.04
0.06
0.08
0.10
0.12
0.14
0.16
13-14 15_19 20_24 25_29 30_34 35_39 40_44 45_49
3
50_54 55_59 60_64 65_69 70_74 75_79
LBUBPrevalence
Top 5 parameter
Prevalence of CIN1
0.04
0.06
0.08
0.10
0.12
0.14
0.16
_54 55_59 60_640.00
0.02
13_14 15_19 20_24 25_29 30_34 35_39 40_44 45_49 50
LB
UB
Prevalence
Top 5 parameter

Diaz et al. Supplementary Appendix
Part II: Best-Fitting Parameter Sets Table 7. Posterior input parameters: ‘best set’ ranges found during calibration. PROGRESSION VARIABLES.
Normal to HPV DNA
Low-risk (LR) HPV High-risk 16 (HR-16) HPV High-risk 18 (HR-18) HPV High-risk other (HR-other) HPV
Best Set 2.88104 1.76466 2.91775 4.36633 2nd Best Set 1.78528 4.25022 0.354163 1.48357 3rd Best Set 2.36704 4.66536 4.21737 3.8061 4th Best Set 1.20746 4.6053 7.43338 2.64334 5th Best Set 2.68925 6.33997 4.83463 1.45116 6th Best Set 1.95603 2.62449 2.65843 1.93805 7th Best Set 2.45119 1.4405 7.05544 3.17799 8th Best Set 2.69637 7.29893 1.48026 5.96425 9th Best Set 2.23571 2.69119 0.758845 3.15561 10th Best Set 2.9742 3.34726 5.1054 3.28143
HPV DNA to CIN 1
Low-risk (LR) HPV High-risk 16 (HR-16) HPV High-risk 18 (HR-18) HPV High-risk other (HR-other) HPV
Best Set 4.65077 1.93784 2.70367 4.15621 2nd Best Set 4.57916 1.92775 4.18929 5.3997 3rd Best Set 1.79759 5.33342 4.22548 4.89646 4th Best Set 2.2752 4.85993 0.652774 5.56885 5th Best Set 2.9678 5.67532 0.563926 5.59714 6th Best Set 3.86646 3.24198 1.65435 5.82736 7th Best Set 5.08197 5.38797 2.37197 5.06321 8th Best Set 3.17133 3.42559 2.51259 5.74408 9th Best Set 3.22213 1.72352 5.59651 5.04381 10th Best Set 2.67431 2.21278 0.536397 4.33308
13 of 36

Diaz et al. Supplementary Appendix
Table 7. Posterior input parameters: ‘best set’ ranges found during calibration. PROGRESSION VARIABLES (cont.).
HPV DNA to CIN 2,3
Low-risk (LR) HPV High-risk 16 (HR-16) HPV High-risk 18 (HR-18) HPV High-risk other (HR-other) HPV
Best Set 0.024441 0.653378 0.086182 0.008826 2nd Best Set 0.045072 0.319945 0.089672 0.091393 3rd Best Set 0.039071 0.722776 0.094414 0.07469 4th Best Set 0.023463 0.601447 0.064133 0.080354 5th Best Set 0.05886 0.825145 0.050316 0.076024 6th Best Set 0.090318 0.667323 0.067981 0.094215 7th Best Set 0.034071 0.934279 0.03928 0.039152 8th Best Set 0.022712 0.198932 0.009288 0.032766 9th Best Set 0.066522 0.422575 0.07503 0.037474 10th Best Set 0.056169 0.19577 0.051175 0.058701
CIN1 to CIN 2,3
Low-risk (LR) HPV High-risk 16 (HR-16) HPV High-risk 18 (HR-18) HPV High-risk other (HR-other) HPV
Best Set 2.46514 5.08882 0.388289 2.88836 2nd Best Set 5.36158 0.612957 5.76637 1.43401 3rd Best Set 4.43231 2.69082 1.03837 2.06579 4th Best Set 0.13277 3.22272 5.91198 0.79442 5th Best Set 5.46802 5.55014 4.06091 0.910731 6th Best Set 0.19343 0.720444 1.44359 1.96269 7th Best Set 0.773888 5.10265 4.78752 1.49257 8th Best Set 2.57864 2.61822 5.21795 1.09856 9th Best Set 1.92802 4.07692 5.33466 0.794285 10th Best Set 5.07268 3.55781 4.70189 1.71291
14 of 36

Diaz et al. Supplementary Appendix
Table 7. Posterior input parameters: ‘best set’ ranges found during calibration. PROGRESSION VARIABLES (cont.).
CIN 2,3 to local cancer
High-risk 16 (HR-16) HPV High-risk 18 (HR-18) HPV High-risk other (HR-other) HPV
Best Set 2.15534 5.26901 0.561629 2nd Best Set 1.72232 5.48933 1.33691 3rd Best Set 1.76517 3.29319 0.682181 4th Best Set 0.913269 1.81384 1.1494 5th Best Set 0.869327 1.19567 0.572581 6th Best Set 4.13772 0.83092 0.882593 7th Best Set 0.906496 2.89204 2.55669 8th Best Set 1.23329 0.812196 0.921124 9th Best Set 1.14653 1.7763 2.5914 10th Best Set 3.59796 3.89682 0.89399
15 of 36

Diaz et al. Supplementary Appendix
Table 8. Posterior input parameters: ‘best set’ ranges found during calibration. REGRESSION VARIABLES.
Normal to HPV DNA
Low-risk (LR) HPV High-risk 16 (HR-16) HPV High-risk 18 (HR-18) HPV High-risk other (HR-other) HPV
Best Set 7.14689 4.17272 5.1117 6.10475 2nd Best Set 5.56901 2.86947 6.46357 2.8967 3rd Best Set 6.41645 7.62985 4.151 5.77961 4th Best Set 5.15918 7.07055 6.8038 6.17582 5th Best Set 7.54983 7.11569 6.07369 3.26525 6th Best Set 5.22428 4.6352 6.27671 3.02299 7th Best Set 7.20411 6.35292 5.86792 4.18585 8th Best Set 5.68798 4.84015 3.28093 6.17032 9th Best Set 5.77713 3.80677 5.10114 2.61446 10th Best Set 7.14689 4.17272 5.1117 6.10475
CIN 1 to Normal
Low-risk (LR) HPV High-risk 16 (HR-16) HPV High-risk 18 (HR-18) HPV High-risk other (HR-other) HPV
Best Set 1.8224 1.68284 4.45645 3.18357 2nd Best Set 2.93868 3.18721 2.45042 4.69422 3rd Best Set 5.58689 2.38326 3.07091 3.17222 4th Best Set 1.43916 5.69735 4.88292 1.24502 5th Best Set 2.00412 4.54546 2.74471 3.57842 6th Best Set 3.34265 0.988405 5.60681 5.38509 7th Best Set 2.56712 3.51813 4.51758 5.12954 8th Best Set 5.56624 0.719508 2.13906 2.51471 9th Best Set 5.18214 4.13439 3.88044 2.33313 10th Best Set 1.8224 1.68284 4.45645 3.18357
16 of 36

Diaz et al. Supplementary Appendix
Table 8. Posterior input parameters: ‘best set’ ranges found during calibration. REGRESSION VARIABLES (cont.).
CIN 2,3 to Normal (70% of women)
Low-risk (LR) HPV High-risk 16 (HR-16) HPV High-risk 18 (HR-18) HPV High-risk other (HR-other) HPV
Best Set 1.89927 5.09447 1.3789 1.58686 2nd Best Set 1.85223 0.523885 4.62389 5.48724 3rd Best Set 0.536962 3.17252 3.42388 5.73758 4th Best Set 2.88272 2.03862 2.70929 3.96023 5th Best Set 2.60786 1.3153 1.6977 1.53637 6th Best Set 3.90506 4.62244 0.506662 3.12399 7th Best Set 4.47858 2.10466 4.5745 5.62927 8th Best Set 3.6631 5.84419 3.83378 3.12419 9th Best Set 3.20424 0.534472 3.1771 3.92625 10th Best Set 1.89927 5.09447 1.3789 1.58686
CIN 2,3 to HPV DNA (15% of women)
Low-risk (LR) HPV High-risk 16 (HR-16) HPV High-risk 18 (HR-18) HPV High-risk other (HR-other) HPV
Best Set 1.89927 5.09447 1.3789 1.58686 2nd Best Set 1.85223 0.523885 4.62389 5.48724 3rd Best Set 0.536962 3.17252 3.42388 5.73758 4th Best Set 2.88272 2.03862 2.70929 3.96023 5th Best Set 2.60786 1.3153 1.6977 1.53637 6th Best Set 3.90506 4.62244 0.506662 3.12399 7th Best Set 4.47858 2.10466 4.5745 5.62927 8th Best Set 3.6631 5.84419 3.83378 3.12419 9th Best Set 3.20424 0.534472 3.1771 3.92625 10th Best Set 1.89927 5.09447 1.3789 1.58686
17 of 36

Natural Immunity
High-risk 16 (HR-16) HPV High-risk 18 (HR-18) HPV High-risk other (HR-other) HPV
Best Set 0.991219 0.991219 0.991219 2nd Best Set 0.979688 0.979688 0.979688 3rd Best Set 0.954624 0.954624 0.954624 4th Best Set 0.971936 0.971936 0.971936 5th Best Set 0.997792 0.997792 0.997792 6th Best Set 0.965925 0.965925 0.965925 7th Best Set 0.969257 0.969257 0.969257 8th Best Set 0.999137 0.999137 0.999137 9th Best Set 0.983026 0.983026 0.983026 10th Best Set 0.991219 0.991219 0.991219
z et al. Supplementary Appendix
18 of 36
Table 9. Posterior input parameters: ‘best set’ ranges found during calibration. OTHER VARIABLES.
Dia
Diaz et al. Supplementary Appendix
Part III: Cervical cancer prevention strategies
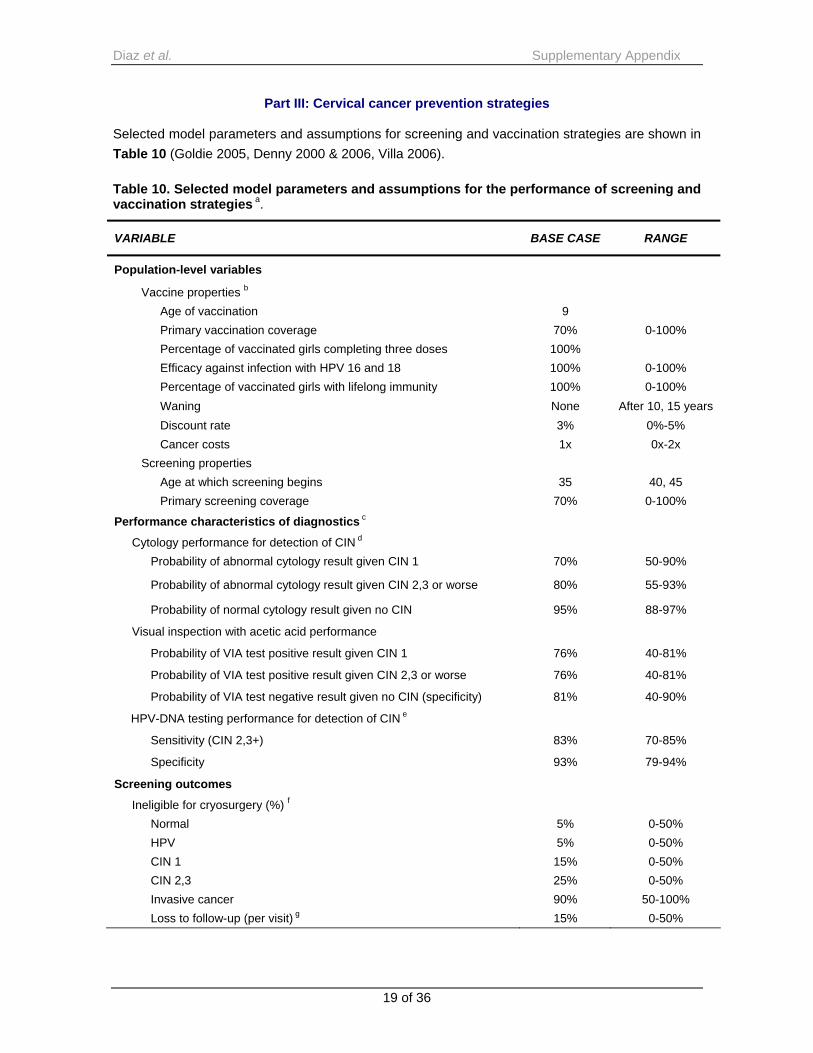
Selected model parameters and assumptions for screening and vaccination strategies are shown in Table 10 (Goldie 2005, Denny 2000 & 2006, Villa 2006). Table 10. Selected model parameters and assumptions for the performance of screening and vaccination strategies a.
VARIABLE BASE CASE RANGE
Population-level variables
Vaccine properties b Age of vaccination 9 Primary vaccination coverage 70% 0-100% Percentage of vaccinated girls completing three doses 100% Efficacy against infection with HPV 16 and 18 100% 0-100% Percentage of vaccinated girls with lifelong immunity 100% 0-100% Waning None After 10, 15 years Discount rate 3% 0%-5% Cancer costs 1x 0x-2x
Screening properties Age at which screening begins 35 40, 45 Primary screening coverage 70% 0-100%
Performance characteristics of diagnostics c
Cytology performance for detection of CIN d Probability of abnormal cytology result given CIN 1 70% 50-90%
Probability of abnormal cytology result given CIN 2,3 or worse 80% 55-93%
Probability of normal cytology result given no CIN 95% 88-97%
Visual inspection with acetic acid performance
Probability of VIA test positive result given CIN 1 76% 40-81%
Probability of VIA test positive result given CIN 2,3 or worse 76% 40-81%
Probability of VIA test negative result given no CIN (specificity) 81% 40-90%
HPV-DNA testing performance for detection of CIN e
Sensitivity (CIN 2,3+) 83% 70-85%
Specificity 93% 79-94%
Screening outcomes
Ineligible for cryosurgery (%) f Normal 5% 0-50% HPV 5% 0-50% CIN 1 15% 0-50% CIN 2,3 25% 0-50% Invasive cancer 90% 50-100% Loss to follow-up (per visit) g 15% 0-50%
19 of 36

Diaz et al. Supplementary Appendix
Table 10. Selected model parameters and assumptions for the performance of screening and vaccination strategies a (cont.).
VARIABLE BASE CASE RANGE
Distribution of treatment methods h CIN1
LEEP 33% Cryosurgery 67%
CIN2/3 LEEP 50% Cold knife conization 30% Hysterectomy 20%
Treatment outcomes and complications i Efficacy of treatment
Short-term efficacy for CIN 100% 50-100% Persistent HPV infection after treatment 30% 0-100% Major complications 1% 0-3% Minor complications 5% 0-15%
HR: High Risk; HPV: human papillomavirus; DNA: deoxyribonucleic acid; CIN: cervical intraepithelial neoplasia; VIA: visual inspection with acetic acid; LEEP: loop electrosurgical excision procedure
a Parameters shown represent the values used in the base case. Sensitivity analyses were conducted by varying each parameter over the range of values shown. b Vaccine strategies assumed that three doses are given to girls before age 12, and the vaccination series is completed before sexual debut; in sensitivity analyses vaccine efficacy and coverage were varied widely, and alternative assumptions regarding lifelong immunity were assessed. c Tests for diagnosis included DNA testing for HPV in cervical cell samples with the use of the hybrid-capture method (Hybrid Capture II HPV DNA test, HCII) or rapid HPV test, cytologic examination of cervical cells on a Papanicolaou smear, and visual inspection of the cervix with acetic acid (hereafter referred to as visual inspection). We assumed that screening was performed at a primary-level facility, and included the following strategies in the base case:
Three-visit strategies included an initial screening test in the first visit, colposcopy and biopsy in the case of positive results in a second visit, and treatment of CIN in a third visit. Two-visit strategies consisted of initial screening followed by treatment, without colposcopic evaluation, of all women with positive screening results. One-visit strategies incorporated same-day screening and treatment for women with positive screening results.
A single lifetime screen was targeted to 35- or 40-year-old women. The first screening test for 2- and 3-times in a lifetime strategies was targeted to 35-year-old women, with additional screenings conducted at five-year intervals. d Abnormal cytology was defined as low-grade or high-grade squamous intraepithelial lesions (LSIL or HSIL) for the base case analysis. In sensitivity analyses we assessed the implications of using a more stringent definition, such as HSIL and above.
20 of 36

Diaz et al. Supplementary Appendix
e Probability of high-risk HPV-DNA positivity on an HPV-DNA test given the presence of high-risk HPV-DNA is assumed to be 100%, however we define the clinically relevant sensitivity of HPV-DNA testing to be the probability of high-risk HPV DNA positivity given CIN 1 and CIN 2, 3+. f One-visit and two-visit strategies involved the use of visual inspection to determine whether women with positive results at screening were eligible for cryosurgery; those with lesions that covered more than 75% of the cervix or that extended to the vaginal wall or 2 mm beyond the tip of the probe used for cryosurgery, and those with anatomical abnormalities of the cervix, were ineligible (Goldie 2005). The value shown is the proportion of women in each underlying disease category who would be ineligible for cryosurgery on the basis of visual inspection of the cervix and would be referred to a secondary-level facility (e.g., a district or regional hospital) for diagnostic testing (e.g., colposcopy and biopsy) and, if necessary, treatment of precancerous lesions with a loop electrosurgical excision procedure, cold-knife conization, or simple hysterectomy, depending on the size and type of lesion. For three-visit strategies, women with positive screening results were referred for diagnostic testing, with those who required treatment returning for a third visit. Women in whom cancer was detected were referred to secondary or tertiary care hospitals. g Loss to follow-up was assumed to occur at each clinical contact. For example, within any particular strategy, a woman who requires three clinical contacts due to an abnormal test result, requirement for further diagnostic testing, and/or any necessary treatment will have approximately a 45% chance of never receiving that care. We defined loss to follow-up as a woman’s compliance to return for her screening test results (applicable only to women in two- or three-visit strategies), a woman’s compliance to return for diagnostic work-up (applicable only to women ineligible for cryotherapy, and to all women in three-visit strategies), and a woman’s compliance to return for treatment (for women ineligible for cryotherapy, and for all women in three-visit strategies). h For women who were ineligible for cryosurgery, among those with CIN 1, one third would undergo LEEP, and two thirds would undergo cryosurgery; among those with CIN 2 or 3, 50% would undergo LEEP, 30% cold-knife conization and 20% simple hysterectomy. i Following treatment, women with true CIN have lesions removed with 100% probability. Of the women with true HPV or true CIN that were treated, 30% retain their HPV infection even though lesions had been removed.
21 of 36

Diaz et al. Supplementary Appendix
Part IV: Additional information about costs Overview Since the HPV vaccine price in India is not yet known, nor are the country-specific programmatic costs to deliver a vaccine to a young adolescent age group, we use a composite value defined as the ‘cost per vaccinated girl’, which we assume includes the vaccine cost per dose multiplied by the three required doses, wastage, freight and supplies, administration, immunization support and programmatic costs (Acharya 2002, Kou 2002, Walker 2004, Wolfson 2008, WHO CHOICE). As described later in this section, we distinguish costs dependent on vaccine price (e.g., vaccine wastage, insurance and security fees associated with freight into the country) from those that would be less dependent (e.g., supplies, administration, vaccine support and monitoring/programmatic expenses). We do not include the incremental costs of scaling up vaccination that might be expected after certain thresholds of coverage are attained (e.g., 70%), although we explore a wide range of incremental costs associated with initiating a new program. We include costs associated with screening, diagnosis and treatment, and categorize these into direct medical costs (e.g., staff, supplies, equipment, and specimen transport), women’s time costs (time spent travelling, waiting, and receiving care), transportation costs, and programmatic costs. Time estimates for various clinical services, for the number and type of follow-up visits, and for hospitalization days are based on previously-published assumptions (Goldie 2005, Goldie 2007); the reader may find additional details in the technical appendices to those previously published analyses. Selected screening and treatment cost estimates are based on data from a previously published analysis of screening in India (Goldie 2005). Costs were originally reported in 2000 International dollars to facilitate cross-country comparisons. These costs were originally derived in local currency units and costs from other years were converted to local currency units using year-specific exchange rates, adjusted for inflation using country-specific inflation rates, and then converted from local currency units to 2005 International dollars using PPP exchange rates for this analysis (World Bank WDI). Screening, diagnostic, treatment and cancer costs
Screening, diagnosis and treatment costs are categorized into direct medical costs (e.g., staff, disposable supplies, equipment, specimen transport, facilities, laboratory, hospitalization, and follow-up visits as appropriate for the service), women’s time costs (time spent traveling, waiting, and receiving care), transportation costs, and programmatic costs.
Costs for screening, diagnosis, and pre-cancer treatment, total costs for invasive cervical cancer and patient time and transportation costs are presented in Table 1 of the article. Screening costs include the cost of the office visit, the cost of the test and laboratory processing of the screening sample, and the cost of patient’s transport and time traveling, waiting, and receiving care. Diagnostic costs include the office visit cost, the cost of performing colposcopy, the cost of biopsy and laboratory processing, and the cost of the patient’s time and transport. Costs of pre-cancer
22 of 36

Diaz et al. Supplementary Appendix
treatment include the facility visit, the cost of the procedure, which include pharmaceuticals and supplies, complications, and hospitalization, as well as the cost of transport and time of the patient. Invasive cancer costs include both direct medical and direct non-medical costs. Direct medical costs of cancer care include staging of cancer severity, hospitalization, stage-appropriate treatment, follow-up visits, as well as patient time and transport costs, which account for approximately 20% of the cancer care.
Direct non-medical costs and time costs associated with cancer care include all patient time in transport, waiting, receiving treatment, and in hospitalization as well as actual transport costs. Time estimates for waiting to receive clinical services include follow-up visits, and hospitalization days, and the costs of two-way transportation from home to the site of care.
Invasive cervical cancer stages 1a1, 1a2, 1b1, 1b2, and 2a are classified as local cancer, stages 2b, 3a, and 3b as regional cancer, and stages 4a and 4b as distant cancer, based on the Federation Internationale de Gynecologie et Obstetriques (FIGO) staging system.
Further details about these methods are provided by Goldie et al. (2005) and Goldie et al. (2007).
Vaccine costs
The composite value, ‘cost per vaccinated girl’, contains the following components:
Table 11. Components of the 'cost per vaccinated girl'
Component Directly depends on vaccine price
Vaccine dose (three doses) yes
Vaccine wastage yes
Immunization supplies (syringes etc.) no
Supplies wastage no
Freight into the country yes (security fees)
Administration charges no
Vaccine support (cold chain, injection safety and operational costs such as delivery within the country) no
Monitoring and programmatic services (incremental costs for implementing a young adolescent vaccination program) no
Categories directly dependent on vaccine price include vaccine wastage and freight into the country (since this component also included insurance and security, which tend to increase as costs of items shipped increase). These costs are considered tradable goods and carry an international dollar price independent of the country setting. These costs are converted to and from Local
23 of 36

Diaz et al. Supplementary Appendix
Currency Units (LCU) using U.S. dollar direct exchange rates, since by definition, for tradable goods, 1 International Dollar equals 1 U.S. dollar. Categories less dependent on vaccine price include supplies and supplies wastage (although supply wastage does depend on the supply price), administration, vaccine support and monitoring/programmatic expenses. Categories such as administration, support and programmatic components, considered non-tradable inputs (mostly salaries), tend to vary with the level of development (i.e., GDP) of a country and, as relative salaries increased, so do the costs for these inputs when expressed in International dollars. These costs are converted to and from Local Currency Units using Purchasing Power Parity (PPP) conversion rates. Vaccine wastage
Wastage rate in different countries, and within countries, is variable, and for this vaccine is uncertain. Wastage rates depend on the specific setting, mode of delivery, and whether the HPV vaccine will continue to be available only in single-dose vials. Even low wastage rates may represent a substantial cost at higher prices (WHO Immunization Financing). Although wastage is reported to be lower with single-dose vials, these are generally more expensive than multi-dose vials. Vials with 10 or more doses tend to be cheaper, but are substantially more troublesome for managing wastage in routine delivery settings. Based on primary data from the Bavi district in rural North Vietnam, wastage rates were found to vary from 10.6% to 32.3% depending on the vaccine (Minh 2008). For the base case, we assume an average of 10-15% wastage, calculated as [(vaccine doses supplied – vaccine doses used)/ vaccine doses supplied]. As there are no data for a new adolescent vaccine in single-dose vials, we vary wastage rates from 5% to 25%. Vaccine supplies and supply wastage
Costs for disposable items (e.g. syringes, safety boxes) are based on international prices. The primary cost driver in this category is single-use auto-disable (AD) syringes. We use the UNICEF negotiated price of $0.057 per syringe (UNICEF) assuming wastage of 10%. Freight into country
Our estimates of freight into a country, including insurance, are approximated based on WHO estimates of 6% of the price for vaccines and 15% for vaccine supplies (Kou 2002, WHO Immunization Financing). Administrative charges
Administrative costs are often reported as a percentage of total immunization program costs, or percentage of costs of a particular program studied. In absence of high quality country-specific data for India, for the purposes of these analyses, administration for vaccination program is divided into 3 costs, low, medium and high, at $0.50, $1.50, and $3. In the base case, we assign categories based on the per dose cost of the vaccine; however, we also vary this assumption in sensitivity analysis to allow for the potential for high administration costs with low vaccine prices and low
24 of 36

Diaz et al. Supplementary Appendix
administration costs with high vaccine prices. Of note, the potential additional costs associated with a new adolescent vaccine schedule are explored by varying the category of costs, vaccine support. Vaccine support
These costs are also highly variable within countries, and are typically reported as a percentage of total vaccination/immunization program costs. Cold chain, injection safety and operational costs such as delivery within the country
For our analyses, for all costs per fully-immunized girl (FIG) over $10, we assume that cold chain, injection safety and operational costs together as a category would account for $2.94. As a percentage of total cost, this ranges from almost 30% ($10/FIG) to less than 10% ($300/FIG). For costs below $10/FIG, we assume that this value is reduced to $2/FIG, which accounts for roughly the same percentage range (10%-30%). Monitoring and programmatic services
These included an exploration of the additional incremental costs for implementing a young adolescent vaccination program. While there have been studies to assess costs associated with childhood immunization programs (Khan 1998, Kaddar 1999, Levin 2001; Miller 2000, Walker 2004, Waters 2004), the financial requirements necessary for social mobilization and an education campaign for a new vaccine, particularly one that targets young adolescent girls, are not known. Wolfson et al. (2008) estimated that the per person targeted (between ages nine months and 29 years) costs for meningococcal vaccines ranged between US$0.17-1.53 and campaigns targeting women of childbearing age to reduce maternal and neonatal tetanus ranged from US$0.19-1.51. As such, for per dose costs (US$) of $0.55, $2, and $5 (corresponding to a cost per immunized girl of I$5, I$10 and I$25), we assign values ranging from $0 to $2 for the incremental per person targeted costs of a new program. The costs associated with social outreach reported for selected childhood programs ranged from 3.4% (Morocco) to 15% (Ghana) (Khan 1998, Kaddar 1999, Levin 2001). Assuming an additional outreach cost of $2/FIG, this translates to 20% at $10/FIG and 2% at $100/FIG. A stylized example of the components of the composite value, as it varied from I$10 to I$75, is shown in the figure below. For example, for a composite cost of I$50 per vaccinated girl, we assume three doses of vaccine at (US$) $12.25 each; wastage of $5.51; freight and supplies of $1.30; administration of $1.50; immunization support costs of $2.94; and the incremental costs of a new adolescent program, $2. Of note, we vary the total composite cost in the model, and therefore, by providing results on such a wide range of total composite values, we permit the reader to elucidate two kinds of insights from the results: the effect of the total cost per immunized girl on the cost-effectiveness of HPV 16,18 vaccination, and the effect of varying a specific component of the total cost.
25 of 36

Diaz et al. Supplementary Appendix
Figure 4. Cost per vaccinated girl
Estimating financial costs to facilitate face validity exercises and to assess affordability
For the main cost-effectiveness analysis, costs are presented in 2005 international dollars, a currency that provides a means of translating and comparing costs among countries, taking into account differences in purchasing power. The choice of using international dollars for the cost-effectiveness analysis allows for broad comparison across regions. In contrast, projections of financial resources to assess local and regional affordability are presented also in U.S. dollars. Often financial costs associated with short-term payments required for a program are of interest to local payers as they assess their immediate budgets and fiscal space. For the latter objective, we translated selected results that rely on international dollars to local currency units or U.S. dollars in a particular country setting. An example of the conversion process used to present these costs in additional currencies for local and regional decision makers is shown below. Figure 5. Currency conversions
26 of 36

Diaz et al. Supplementary Appendix
Example of a cost conversion
For India, we use an exchange rate (Local Currency Units per U.S. Dollar) of 44.10 and a Purchasing Power Parity exchange rate (Local Currency Units per International Dollar) of 9.44 (World Bank WDI).
Table 12. Stylized example of conversion from international dollars to local currency
International $ Tradable/ Non-Tradable
Local Currency Unit
U.S. $ equivalent
$25 879.29 18.71
Vaccine cost 15 Tradable 661.50 15.00
Vaccine wastage 2.25 Tradable 99.22 2.25 Vaccine supplies (including wastage & freight) 1.31 Tradable 57.77 1.31
Administration 1.5 Non-Tradable 14.16 0.03 Vaccine Support
Monitoring & Programmatic services 2 Non-Tradable 18.88 0.05
Cold chain, injection safety, operational costs 2.94 Non-Tradable 27.75 0.07
The U.S. dollar equivalent can be calculated in two ways. The method demonstrated above expresses the international dollar price as U.S. dollars in a country setting, where tradable goods were converted using the assumption that 1 U.S.$ = 1 I$, and non-tradable goods are converted using the LCU to U.S. dollar exchange rate. Alternatively, conversion to local currency units can be
27 of 36

Diaz et al. Supplementary Appendix
28 of 36
accomplished first and then exchanged directly to U.S. dollars using only exchange rates. For India, that results in an equivalent price of US$19.94. Further sources of information and discussion on the issues of valuing costs in developing countries, of traded versus non-traded goods and how to handle each of them, how to transfer costs across time and location as well as how and when to present results in International dollars can be found in Hutton and Baltussen (2005), Johns et al. (2003) and Tan-Torres Edejer et al. (2003). Face validity exercises Three studies that reported expenditures for childhood vaccination programs in developing countries (Khan 1998, Kaddar 1999, Levin 2001), showed costs per fully-immunized child to range from $11.76 (Bangladesh) to $21.00 (Morocco). All 3 of these countries had a per dose price for the EPI vaccine of less than $1, which translated to per immunized child costs of over $10. More recently, the WHO reported cost per DPT-3 immunized child ranging from $4.10 in Ghana to $9.60 in Mozambique, again with vaccines with a per dose price less than $1. Using the stylized methods outlined above, we would assume a cost per vaccinated girl of I$6.51 when the vaccine cost per dose is at US$1 (or I$8.51 if social outreach is included).

Diaz et al. Supplementary Appendix
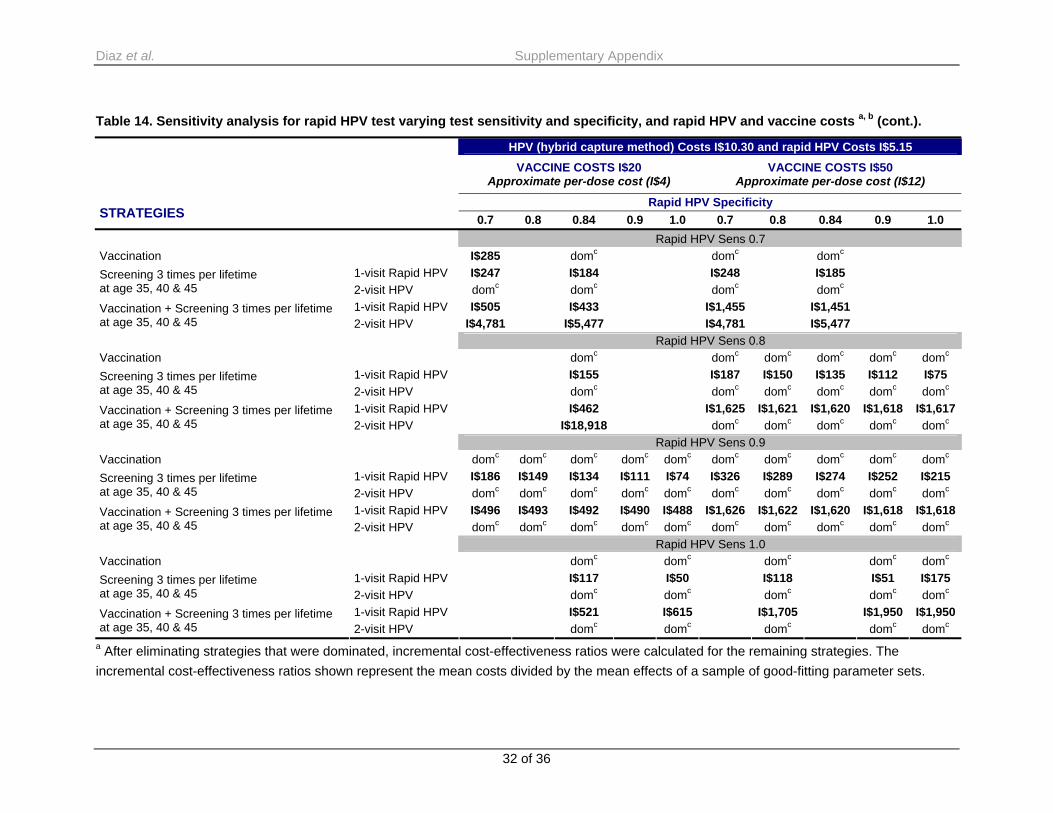
Part V: Additional results Additional results are shown for strategies utilizing VIA and Rapid HPV test. We varied the following variables: vaccination cost, I$20 and I$50; VIA sensitivity, 40%-70%, HPV DNA test cost, I$1.30-I$10 (with hybrid capture method), and Rapid HPV test sensitivity and specificity, 70%-100%. In the base case for VIA and Rapid HPV, we assumed VIA sensitivity of 76% and specificity of 81% with a cost of I$1.30, and a sensitivity of 90% and specificity of 84% for Rapid HPV test. Table 13. Sensitivity analysis for VIA varying VIA sensitivity, and VIA and vaccine costs a, b.
VACCINE COSTS I$20 Approximate per-dose cost (I$4)
VACCINE COSTS I$50 Approximate per-dose cost (I$12)
VIA Sensitivity STRATEGIES 0.4 0.5 0.6 0.7 0.81 0.4 0.5 0.6 0.7 0.81
VIA Costs I$1.30 Vaccination I$255 I$285 I$355 domc domc domc domc domc
1-visit VIA domc I$210 I$140 I$95 I$345 I$210 I$145 I$100 Screening 3 times per lifetime at age 35, 40 & 45 2-visit HPV domc domc domc domc I$710 I$860 I$1,065 I$1,360
1-visit VIA domc I$825 I$535 I$430 domc domc domc I$1,485 Vaccination + Screening 3 times per lifetime at age 35, 40 & 45 2-visit HPV I$1,090 I$1,175 I$1,390 I$1,680 I$1,575 I$1,575 I$1,575 I$1,680 VIA Costs I$2.00 Vaccination I$255 I$255 I$316 I$405 domc domc domc domc domc domc
1-visit VIA domc domc I$181 I$130 I$110 I$420 I$265 I$185 I$135 I$115 Screening 3 times per lifetime at age 35, 40 & 45 2-visit HPV domc domc domc domc domc I$680 I$825 I$1,020 I$1,310 domc
1-visit VIA domc I$980 I$635 I$470 I$445 domc domc domc I$1,545 I$1,465 Vaccination + Screening 3 times per lifetime at age 35, 40 & 45 2-visit HPV I$1,090 I$1,125 I$1,335 I$1,620 I$1,815 I$1,575 I$1,575 I$1,575 I$1,615 I$1,815
29 of 36

Diaz et al. Supplementary Appendix
Table 13. Sensitivity analysis for VIA varying VIA sensitivity, and VIA and vaccine costs a, b. (cont.).
VACCINE COSTS I$20 Approximate per-dose cost (I$4)
VACCINE COSTS I$50 Approximate per-dose cost (I$12)
VIA Sensitivity STRATEGIES 0.4 0.5 0.6 0.7 0.81 0.4 0.5 0.6 0.7 0.81
VIA Costs I$5.00 Vaccination I$255 I$255 I$255 domc I$280 domc domc domc domc domc
1-visit VIA domc domc domc domc I$240 domc I$480 I$355 I$275 I$240 Screening 3 times per lifetime at age 35, 40 & 45 2-visit HPV domc domc domc domc domc I$605 I$685 I$850 I$1,095 I$1,290
1-visit VIA domc domc I$1,040 I$780 I$680 domc domc domc domc domc Vaccination + Screening 3 times per lifetime at age 35, 40 & 45 2-visit HPV I$1,090 I$1,090 I$1,115 I$1,355 I$1,520 I$1,575 I$1,575 I$1,575 I$1,575 I$1,575 VIA Costs I$7.00 Vaccination I$255 I$255 I$255 I$255 I$255 domc domc domc domc domc
1-visit VIA domc domc domc domc domc domc domc I$470 I$370 I$330 Screening 3 times per lifetime at age 35, 40 & 45 2-visit HPV domc domc domc domc domc I$605 I$605 I$740 I$955 I$1,125
1-visit VIA domc domc domc I$980 I$864 domc domc domc domc domc Vaccination + Screening 3 times per lifetime at age 35, 40 & 45 2-visit HPV I$1,090 I$1,090 I$1,090 I$1,180 I$1,325 I$1,575 I$1,575 I$1,575 I$1,575 I$1,575 VIA Costs I$10.00 Vaccination I$255 I$255 I$255 I$255 I$255 domc domc domc domc domc
1-visit VIA domc domc domc domc domc domc domc domc I$511 I$458 Screening 3 times per lifetime at age 35, 40 & 45 2-visit HPV domc domc domc domc domc I$603 I$603 I$603 I$741 I$877
1-visit VIA domc domc domc domc domc domc domc domc domc domc Vaccination + Screening 3 times per lifetime at age 35, 40 & 45 2-visit HPV I$1,088 I$1,088 I$1,088 I$1,088 I$1,088 I$1,575 I$1,575 I$1,575 I$1,575 I$1,575
a After eliminating strategies that were dominated, incremental cost-effectiveness ratios were calculated for the remaining strategies. The incremental cost-effectiveness ratios shown represent the mean costs divided by the mean effects of a sample of good-fitting parameter sets. b The cost per vaccinated girl included three doses of vaccine, wastage, freight and supplies, administration, and immunization support and programmatic costs. c dom: These strategies were either more costly and less effective, or more costly and less cost-effective, than alternative options, and were thus considered dominated. HPV: Human Papillomavirus VIA: Visual Inspection with Acetic Acid
30 of 36

Diaz et al. Supplementary Appendix
Table 14. Sensitivity analysis for rapid HPV test varying test sensitivity and specificity, and rapid HPV and vaccine costs a, b.
HPV (hybrid capture method) and rapid HPV Cost I$10.30
VACCINE COSTS I$20 Approximate per-dose cost (I$4)
VACCINE COSTS I$50 Approximate per-dose cost (I$12)
Rapid HPV Specificity STRATEGIES 0.7 0.8 0.84 0.9 1.0 0.7 0.8 0.84 0.9 1.0 Rapid HPV Sensitivity 0.7 Vaccination I$255 I$255 domc domc
1-visit Rapid HPV domc domc I$418 I$355 Screening 3 times per lifetime at age 35, 40 & 45 2-visit HPV domc domc domc domc
1-visit Rapid HPV I$788 I$678 I$1,455 I$1,452 Vaccination + Screening 3 times per lifetime at age 35, 40 & 45 2-visit HPV I$2,990 I$3,685 I$2,990 I$3,685 Rapid HPV Sensitivity 0.8 Vaccination I$255 domc
1-visit Rapid HPV domc I$309 Screening 3 times per lifetime at age 35, 40 & 45 2-visit HPV domc domc
1-visit Rapid HPV I$601 I$1,535 Vaccination + Screening 3 times per lifetime at age 35, 40 & 45 2-visit HPV I$12,803 I$12,803 Rapid HPV Sensitivity 0.9 Vaccination I$255 I$255 I$255 I$347 domc domc domc domc domc domc
1-visit Rapid HPV domc domc domc I$251 I$214 I$326 I$289 I$274 I$252 I$215 Screening 3 times per lifetime at age 35, 40 & 45 2-visit HPV domc domc domc domc domc domc domc domc domc domc
1-visit Rapid HPV I$633 I$568 I$542 I$502 I$489 I$1,626 I$1,622 I$1,620 I$1,618 I$1,618Vaccination + Screening 3 times per lifetime at age 35, 40 & 45 2-visit HPV domc domc domc domc domc domc domc domc domc domc Rapid HPV Sensitivity 1.0 Vaccination domc domc domc domc
1-visit Rapid HPV I$246 I$174 I$247 I$175 Screening 3 times per lifetime at age 35, 40 & 45 2-visit HPV domc domc domc domc
1-visit Rapid HPV I$521 I$615 I$1,705 I$1,950Vaccination + Screening 3 times per lifetime at age 35, 40 & 45 2-visit HPV domc domc domc domc
31 of 36
Diaz et al. Supplementary Appendix
Table 14. Sensitivity analysis for rapid HPV test varying test sensitivity and specificity, and rapid HPV and vaccine costs a, b (cont.).
HPV (hybrid capture method) Costs I$10.30 and rapid HPV Costs I$5.15
VACCINE COSTS I$20 Approximate per-dose cost (I$4)
VACCINE COSTS I$50 Approximate per-dose cost (I$12)
Rapid HPV Specificity STRATEGIES 0.7 0.8 0.84 0.9 1.0 0.7 0.8 0.84 0.9 1.0 Rapid HPV Sens 0.7 Vaccination I$285 domc domc domc
1-visit Rapid HPV I$247 I$184 I$248 I$185 Screening 3 times per lifetime at age 35, 40 & 45 2-visit HPV domc domc domc domc
1-visit Rapid HPV I$505 I$433 I$1,455 I$1,451 Vaccination + Screening 3 times per lifetime at age 35, 40 & 45 2-visit HPV I$4,781 I$5,477 I$4,781 I$5,477 Rapid HPV Sens 0.8 Vaccination domc domc domc domc domc domc
1-visit Rapid HPV I$155 I$187 I$150 I$135 I$112 I$75 Screening 3 times per lifetime at age 35, 40 & 45 2-visit HPV domc domc domc domc domc domc
1-visit Rapid HPV I$462 I$1,625 I$1,621 I$1,620 I$1,618 I$1,617Vaccination + Screening 3 times per lifetime at age 35, 40 & 45 2-visit HPV I$18,918 domc domc domc domc domc Rapid HPV Sens 0.9 Vaccination domc domc domc domc domc domc domc domc domc domc
1-visit Rapid HPV I$186 I$149 I$134 I$111 I$74 I$326 I$289 I$274 I$252 I$215 Screening 3 times per lifetime at age 35, 40 & 45 2-visit HPV domc domc domc domc domc domc domc domc domc domc
1-visit Rapid HPV I$496 I$493 I$492 I$490 I$488 I$1,626 I$1,622 I$1,620 I$1,618 I$1,618Vaccination + Screening 3 times per lifetime at age 35, 40 & 45 2-visit HPV domc domc domc domc domc domc domc domc domc domc Rapid HPV Sens 1.0 Vaccination domc domc domc domc domc
1-visit Rapid HPV I$117 I$50 I$118 I$51 I$175 Screening 3 times per lifetime at age 35, 40 & 45 2-visit HPV domc domc domc domc domc
1-visit Rapid HPV I$521 I$615 I$1,705 I$1,950 I$1,950Vaccination + Screening 3 times per lifetime at age 35, 40 & 45 2-visit HPV domc domc domc domc domc
a After eliminating strategies that were dominated, incremental cost-effectiveness ratios were calculated for the remaining strategies. The incremental cost-effectiveness ratios shown represent the mean costs divided by the mean effects of a sample of good-fitting parameter sets.
32 of 36

z et al. Supplementary Appendix
33 of 36
c dom: These strategies were either more costly and less effective, or more costly and less cost-effective, than alternative options, and were thus considered dominated.
b The cost per vaccinated girl included three doses of vaccine, wastage, freight and supplies, administration, and immunization support and programmatic costs.
Dia

Diaz et al. Supplementary Appendix
References
Acharya A, Diaz-Ortega JL, Tambini G, de Quadros C, Arita I. Cost-effectiveness of measles elimination in Latin America and the Caribbean: a prospective analysis. Vaccine. 2002 Sep 10;20(27-28):3332-41.
Bhatla N, Dar L, Patro AR, Kriplani A, Gulati A, Verma K, Broor S, Shah KV, Gravitt PE. Human papillomavirus type distribution in cervical cancer in Delhi, India. Int J Gynecol Pathol 2006;25(4):398-402
Denny L, Kuhn L, Pollack A, Wainwright H, Wright TC Jr. Evaluation of alternative methods of cervical cancer screening for resource-poor settings. Cancer 2000;89: 826-33.
Denny L, Quinn M, Sankaranarayanan R. Chapter 8: Screening for cervical cancer in developing countries. Vaccine. 2006;24 (Suppl 3):S71-S77.
Franceschi S, Rajkumar T, Vaccarella S, Gajalakshmi V, Sharmila A, Snijders PJ, Munoz N, Meijer CJ, Herrero R. Human papillomavirus and risk factors for cervical cancer in Chennai, India: a case-control study. Int J Cancer 2003;107(1):127-33
Franceschi S, Rajkumar R, Snijders PJ, Arslan A, Mahe C, Plummer M, Sankaranarayanan R, Cherian J, Meijer CJ, Weiderpass E. Papillomavirus infection in rural women in southern India. Br J Cancer 2005;92(3):601-6.
Goldie SJ, Gaffikin L, Goldhaber-Fiebert JD, Gordillo-Tobar A, Levin C, Mahe C, Wright TC; Alliance for Cervical Cancer Prevention Cost Working Group. Cost-effectiveness of cervical cancer screening in five developing countries. N Engl J Med 2005;353(20):2158-68.
Goldie SJ, Kim JJ, Kobus K, Goldhaber-Fiebert JD, Salomon J, O’Shea MKH, Bosch FX, de Sanjose S, Franco EL. Cost-effectiveness of HPV 16, 18 vaccination in Brazil. Vaccine 2007;25:6257-6270.
Hutton G, Baltussen R. Cost valuation in resource-poor settings. Health Policy and Planning. 2005. 20:252-259.
Johns B, Baltussen R, Hutubessy R. Programme costs in the economic evaluation of health interventions. Cost Effectiveness and Resource Allocation 2003; 1 (1).
Kaddar M, Mookherji S, DeRoeck D, Antona D. September 1999. Case Study on the Costs and Financing of Immunization Services in Morocco. Special Initiatives Report No. 18. Bethesda, MD: Partnerships for Health Reform Project, Abt Associates Inc.
Khan MM and Yoder RA. September 1998. Expanded Program on Immunization in Bangladesh: Cost, Cost-Effectiveness, and Financing Estimates. Technical Report No. 24. Bethesda, MD: Partnerships for Health Reform Project, Abt Associates Inc.
Kim JJ, Kuntz KM, Stout NK, Mahmud S, Villa LL, Franco EL, et al. Multi-parameter calibration of a natural history model of cervical cancer. Am J Epidemiol 2007;166(2):137-50
Kou U. Guidelines for estimating costs of introducing vaccines into the national immunization system. Department of Vaccines and Biologicals. Geneva: World Health Organization; 2002.
34 of 36

Diaz et al. Supplementary Appendix
Available online at http://whqlibdoc.who.int/hq/2002/WHO_V&B_02.11.pdf (Last accessed April 1, 2008)
Laikangbam P, Sengupta S, Bhattacharya P, Duttagupta C, Dhabali Singh T, Verma Y, Roy S, Das R, Mukhopadhyay S. A comparative profile of the prevalence and age distribution of human papillomavirus type 16/18 infections among three states of India with focus on northeast India. Int J Gynecol Cancer 2007;17(1):107-17
Levin A, England S, Jorissen J, Garshong B, Teprey J. September 2001. Case Study on the Costs and Financing of Immunization Services in Ghana. Bethesda, MD: The Partners for Health Reformplus Project, Abt Associates Inc.
Miller MA, McCann L. Policy analysis of the use of hepatitis b, haemophilus influenzae type b, streptococcus pneumoniae-conjugate and rotavirus vaccines in national immunization schedules. Health Economics 2000;9:19-35
Minh HV, Yen NTB, Giang KB, Huong DL, Huong NT, Wright P. Cost of providing the expanded program on immunization: findings from a facility-based study in Viet Nam, 2005. Bull WHO 2008;86(6):417-496.
Munirajan AK, Kannan K, Bhuvarahamurthy V, Ishida I, Fujinaga K, Tsuchida N, Shanmugam G. The status of human papillomavirus and tumor suppressor genes p53 and p16 in carcinomas of uterine cervix from India. Gynecol Oncol 1998;69(3):205-9
New York State Department of Health. About age adjusted rates, 95% confidence intervals and unstable rates. Available online at http://www.health.state.ny.us/statistics/cancer/registry/age.htm. (Last accessed October 2, 2007)
Parkin, D.M., Whelan, S.L., Ferlay, J., and Storm, H. Cancer Incidence in Five Continents, Vol. I to VIII. IARC CancerBase No. 7, Lyon, 2005.
Peedicayil A, Abraham P, Sathish N, John S, Shah K, Sridharan G, Gravitt P. Human papillomavirus genotypes associated with cervical neoplasia in India. Int J Gynecol Cancer 2006;16(4):1591-5
Reiczigel J. Confidence intervals for the binomial parameter: some new considerations. Stat Med 2003;22:611-621.
Sankaranarayanan R, Chatterji R, Shastri SS, Wesley RS, Basu P, Mahe C, Muwonge R, Seigneurin D, Somanathan T, Roy C, Kelkar R, Chinoy R, Dinshaw K, Mandal R, Amin G, Goswami S, Pal S, Patil S, Dhakad N, Frappart L, Fontaniere B. Accuracy of human papillomavirus testing in primary screening of cervical neoplasia: results from a multicenter study in India. Int J Cancer 2004;112(2):341-7
Smith JS, Lindsay L, Hoots B, Keys J, Franceschi S, Winer R, Clifford GM. Human papillomavirus type distribution in invasive cervical cancer and high-grade cervical lesions: a meta-analysis update. Int J Cancer 2007;121,621–632.
Sowjanya AP, Jain M, Poli UR, Padma S, Das M, Shah KV, Rao BN, Devi RR, Gravitt PE, Ramakrishna G. Prevalence and distribution of high-risk human papilloma virus (HPV) types in
35 of 36

Diaz et al. Supplementary Appendix
invasive squamous cell carcinoma of the cervix and in normal women in Andhra Pradesh, India. BMC Infect Dis 2005;5:116
Stinnett AA, Paltiel DA. Estimating CE ratios under second-order uncertainty: the mean ratio versus the ratio of the means. Med Decis Making 1997;17:483–9.
Tan-Torres Edejer T, Baltussen R, Adam T, Hutubessy R, Acharya A, Evans DB, and Murray CJL, eds. Making Choices in Health: WHO Guide to Cost-Effectiveness Analysis. Geneva, Switzerland: World Health Organization, 2003.
Tobi H, van den Berg PB, de Jong-van den Berg LT. Small proportions: what to report for confidence intervals? Pharmacoepidemiol Drug Saf 2005;14:239-247.
UNICEF Procuring supplies for children. Available online at http://www.unicef.org/supply/ (Last accessed September 2, 2007)
Villa LL, Denny L. Methods for detection of HPV infection and its clinical utility. Int J Gynecol Obstet. 2006;94:S71-80,
Walker D, Mosqueira NR, Penny ME, Lanata CF, Clark AD, Sanderson CF, Fox-Rushby JA. Variation in the costs of delivering routine immunization services in Peru. Bull World Health Organ, 2004;82(9):676-82
Waters HR, Dougherty L, Simon-Pierce T, Tran N, Wysonge CS, Long K, Wolfe ND, Burke DS. Coverage and costs of childhood immunizations in Cameroon. Bulletin of the World Health Organization 2004;82(9):668-75
Wolfson LJ, Gasse F, Lee-Martin SP, Lydon P, Magan A, Tibouti A, Johns B, Hutubessy R, Salama P, Okwo-Bele JM. Estimating the costs of achieving the WHO–UNICEF Global Immunization Vision and Strategy, 2006–2015. Bull World Health Organ 2008;86:27–39.
World Bank World Development Indicators, WDI Online. Available online at http://www.worldbank.org/ (Last accessed January 24, 2008).
World Health Organization (WHO). WHO Immunization Financing. Available online at http://www.who.int/immunization_financing/en/ (Last accessed March 16, 2008)
World Health Organization Statistical Information System: CHOICE (CHOosing Interventions that are Cost Effective). Available online at http://www.who.int/choice/en/. (Last accessed October 17, 2007)
36 of 36