supplemental payment to free-standing nursing facilities
TRANSCRIPT

Supplemental Payment to Free-Standing Nursing Facilities SFY 2014
QTR2
Table of Contents
ACUITY AND TOTAL …………………………..………………………………..………….…………………………………………… 1
EQUIVALENT DAILY RATE ..………………………………………………………………………………..………………………… 3
FACILITY OCCUPANCY …………………………………………………………………………………………………………………. 4
OCC MDS QUAL ………………………………..………………………………..………….…………………………………………… 5
QUALITY POINTS …………………………………………………………………………………………………………………………. 6
PROVIDER TAX RATE .………………………………………………………………………………………..………………………… 8
TAX CALCULATION ……………………………………………………………………………………………………………………… 9

Division of Health Care Financing and Policy
Nevada Medicaid - Long Term Care Provider Tax
NF Supplemental Payment Distribution Based on Facility Per Diem Rate Compared to Weighted Average Per Diem Rate
Calculation of Facility Monthly Supplemental Payment Base Quarter 4/1/2013 through 6/30/2013
Distribution Quarter 10/1/2013 through 12/31/2013
Facility Name Provider # Owner
Total Case Mix
Adjusted Per
Diem Rate
SNF LTC
Hospice
Medicaid Bed
Days
Full Rate Total
Amount
Per Diem +
Supplemental
Payment per
Bed Day
Budget
Neutral Per
Diem Rate
Per Bed Day
Supplemental
Payment for
Acuity
Quarterly
Supplemental
Payment for
Acuity
Quarterly
Supplemental
Payment OCC
MDS Q
Total Quarterly
Supplemental
Payment
Monthly
Supplemental
Payment
Advanced Health Care of Las Vegas N/A
CareMeridian LLC 100510503 CareMeridian Negotiated Rate/Ineligible for Supplemental payments
Carson Nursing & Rehab 001913842 Convenant 218.74 2,117 463,072.58 155.36 114.73 40.63 86,006.81 91,056.20 177,063.01 59,021.00
Clearview Health & Rehabilitation (Henderson) 001902200 Fundamental Health Care 222.97 15,359 3,424,596.23 158.36 116.95 41.41 636,052.77 708,681.39 1,344,734.17 448,244.72
College Park Rehab Ctr 001902230 Fundamental Health Care 229.50 5,293 1,214,743.50 163.00 120.37 42.63 225,615.20 197,750.03 423,365.23 141,121.74
Delmar Gardens 001902623 Delmar Gardens Enterprises 213.94 11,904 2,546,741.76 151.95 112.21 39.74 473,008.22 440,823.56 913,831.78 304,610.59
El Jen Convalescent 001902849 James Toomey 218.04 7,986 1,741,267.44 154.86 114.36 40.50 323,406.88 294,416.69 617,823.57 205,941.19
Gardnerville 100503498 EmpRes 232.85 2,140 498,299.00 165.38 122.13 43.25 92,549.44 83,667.26 176,216.70 58,738.90
Mountain View 001913700 EmpRes 212.03 10,900 2,311,127.00 150.59 111.21 39.38 429,247.32 514,303.67 943,550.98 314,516.99
Pahrump 001912881 EmpRes 220.02 3,533 777,330.66 156.26 115.40 40.86 144,374.19 185,314.08 329,688.27 109,896.09
Gaye Haven ICF 001902778 Sandra Manetas 190.42 1,395 265,635.90 135.24 99.87 35.37 49,336.75 146,804.03 196,140.78 65,380.26
Harmon Medical & Rehab 001902900 Fundamental Health Care - - - - - - - - - -
Hearthstone 001916850 Fundamental Health Care 234.72 6,169 1,447,987.68 166.70 123.11 43.59 268,935.82 239,468.90 508,404.72 169,468.24
Highland Manor Elko 001904100 RFMS, Inc 219.22 4,481 982,324.82 155.70 114.98 40.72 182,447.91 111,842.10 294,290.01 98,096.67
Highland Manor Fallon 100506408 RFMS, Inc 224.92 4,477 1,006,966.84 159.74 117.97 41.77 187,024.69 137,840.45 324,865.14 108,288.38
Highland Manor Mesquite 001902250 RFMS, Inc 205.44 2,797 574,615.68 145.91 107.75 38.16 106,723.79 154,950.48 261,674.27 87,224.76
Horizon Health Care (Desert Lane) 001902838 Fundamental Health Care 215.72 9,054 1,953,128.88 153.21 113.14 40.07 362,756.06 382,326.72 745,082.78 248,360.93
Las Vegas Flamingo N/A Kindred Healthcare - - - - - - - - - -
Las Vegas Healthcare 001902856 Kindred Healthcare 214.98 2,574 553,358.52 152.68 112.76 39.93 102,775.68 119,675.60 222,451.28 74,150.43
Las Ventanas N/A ABHOW - - - - - - - - - -
Life Care Center Las Vegas 001902780 Life Care Centers of America 224.85 12,823 2,883,251.55 159.69 117.93 41.76 535,508.43 525,690.46 1,061,198.89 353,732.96
Life Care Center Paradise Valley 001902011 Life Care Centers of America 221.64 1,537 340,660.68 157.41 116.25 41.17 63,271.16 42,832.12 106,103.28 35,367.76
Life Care Center Reno 001916860 Life Care Centers of America 222.55 2,902 645,840.10 158.06 116.73 41.33 119,952.36 74,636.17 194,588.52 64,862.84
Royal Springs Healthcare & Rehab (Manor LV) 001902324 HCR ManorCare 224.64 13,921 3,127,213.44 159.55 117.82 41.72 580,819.65 615,968.08 1,196,787.73 398,929.24
Manor Care Reno 001916915 HCR ManorCare 217.93 6,611 1,440,735.23 154.78 114.30 40.48 267,588.81 235,740.31 503,329.12 167,776.37
Manor Care Wingfield Hills 100519895 HCR ManorCare 222.21 2,865 636,631.65 157.82 116.55 41.27 118,242.06 88,971.53 207,213.60 69,071.20
Marquis Care Centennial Hills 100521441 Marquis Care 233.59 6,521 1,523,240.39 165.90 122.52 43.38 282,912.56 252,346.38 535,258.94 178,419.65
Marquis Care Plaza Regency 001902602 Marquis Care 237.24 10,236 2,428,388.64 168.49 124.43 44.06 451,026.41 387,054.98 838,081.39 279,360.46
Mission Pines 001902100 Preferred Care West 222.64 12,464 2,774,984.96 158.13 116.77 41.35 515,400.00 796,239.60 1,311,639.60 437,213.20
Mountain View Boulder City 001902431 Preferred Care West 211.49 4,256 900,101.44 150.21 110.93 39.28 167,176.50 146,657.58 313,834.08 104,611.36
North Las Vegas Care Center 001902340 Fundamental Health Care 214.89 12,981 2,789,487.09 152.62 112.71 39.91 518,093.49 629,828.49 1,147,921.98 382,640.66
Ormsby Post Acute Rehab 001913305 Evergreen 229.93 4,617 1,061,586.81 163.30 120.60 42.71 197,169.30 123,326.81 320,496.11 106,832.04
Regent Care Center Reno 001916865 Regent Management Services 221.26 7,676 1,698,391.76 157.14 116.05 41.09 315,443.55 286,779.39 602,222.94 200,740.98
Renown Skilled Nursing 001916900 Renown Health System 218.52 4,692 1,025,295.84 155.20 114.61 40.59 190,428.95 179,839.47 370,268.42 123,422.81
Rosewood Rehabilitation Center 001916870 The Ensign Group Inc 223.27 2,498 557,728.46 158.57 117.10 41.47 103,587.32 118,032.28 221,619.60 73,873.20
Silver Hills Health Care 001902525 Convenant 232.96 3,779 880,355.84 165.45 122.19 43.27 163,509.14 94,660.05 258,169.18 86,056.39
Silver Ridge Health Care 001902151 Convenant 235.03 6,570 1,544,147.10 166.92 123.27 43.65 286,795.58 236,062.20 522,857.78 174,285.93
Southern NV Medical & Rehab 001902876 Fundamental Health Care 244.80 294 71,971.20 173.86 128.40 45.47 13,367.26 8,463.66 21,830.93 7,276.98
St. Joseph's Transitional Rehab 001902545 Skilled Healthcare 236.76 6,065 1,435,949.40 168.15 124.18 43.97 266,699.94 269,501.97 536,201.90 178,733.97
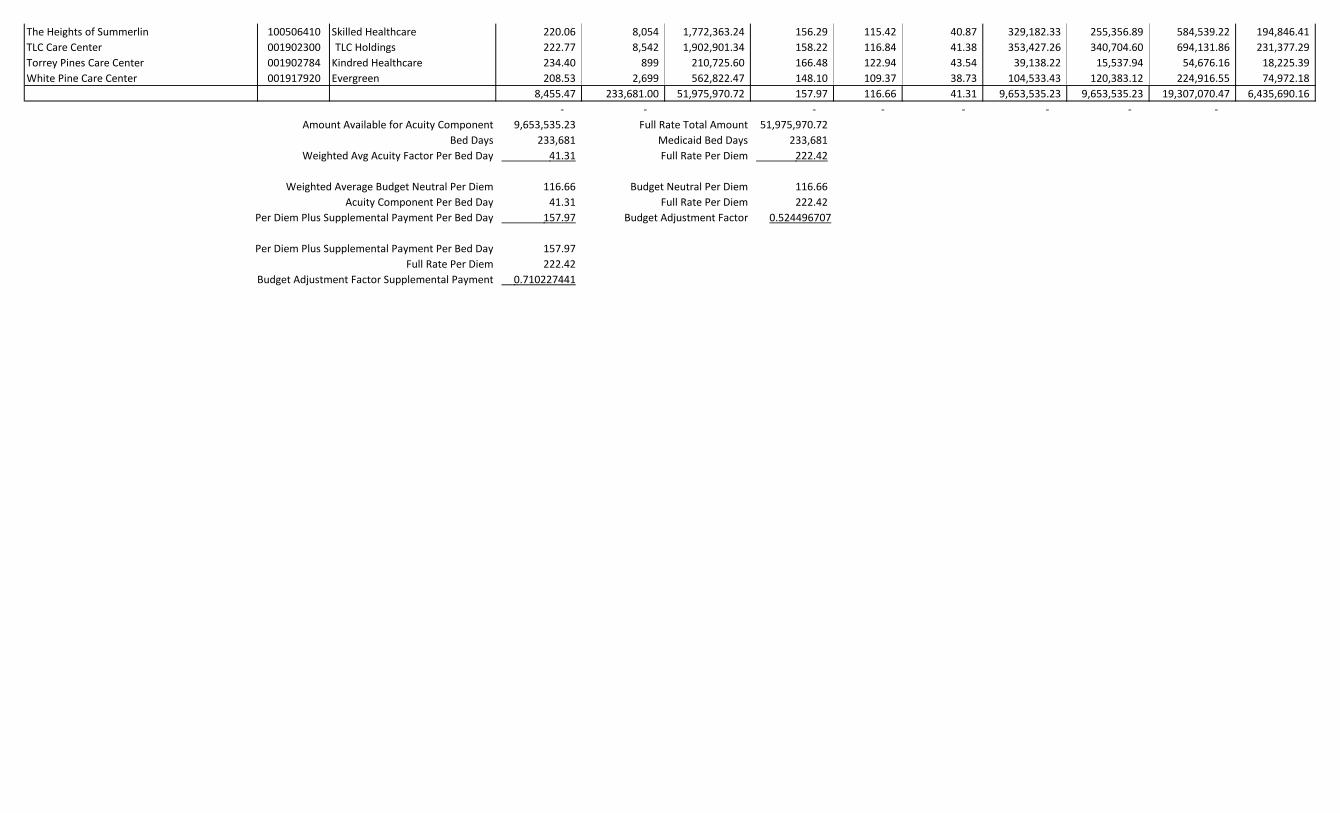
The Heights of Summerlin 100506410 Skilled Healthcare 220.06 8,054 1,772,363.24 156.29 115.42 40.87 329,182.33 255,356.89 584,539.22 194,846.41
TLC Care Center 001902300 TLC Holdings 222.77 8,542 1,902,901.34 158.22 116.84 41.38 353,427.26 340,704.60 694,131.86 231,377.29
Torrey Pines Care Center 001902784 Kindred Healthcare 234.40 899 210,725.60 166.48 122.94 43.54 39,138.22 15,537.94 54,676.16 18,225.39
White Pine Care Center 001917920 Evergreen 208.53 2,699 562,822.47 148.10 109.37 38.73 104,533.43 120,383.12 224,916.55 74,972.18
8,455.47 233,681.00 51,975,970.72 157.97 116.66 41.31 9,653,535.23 9,653,535.23 19,307,070.47 6,435,690.16
- - - - - - - -
Amount Available for Acuity Component 9,653,535.23 Full Rate Total Amount 51,975,970.72
Bed Days 233,681 Medicaid Bed Days 233,681
Weighted Avg Acuity Factor Per Bed Day 41.31 Full Rate Per Diem 222.42
Weighted Average Budget Neutral Per Diem 116.66 Budget Neutral Per Diem 116.66
Acuity Component Per Bed Day 41.31 Full Rate Per Diem 222.42
Per Diem Plus Supplemental Payment Per Bed Day 157.97 Budget Adjustment Factor 0.524496707
Per Diem Plus Supplemental Payment Per Bed Day 157.97
Full Rate Per Diem 222.42
Budget Adjustment Factor Supplemental Payment 0.710227441

Nursing Facility Rates
Equivalent Daily Rate Calculation
Provider Per Diem Total Sup Medicaid SP Per Equivalent
Facility Number Rate Payments Bed Days Day Daily Rate
Advanced Health Care of Las Vegas N/A
CareMeridian LLC 100510503
Carson Nursing & Rehab 001913842 114.73 177,063.01 2,117 83.64 198.37
Clearview Health & Rehabilitation (Henderson) 001902200 116.95 1,344,734.17 15,359 87.55 204.50
College Park Rehab Ctr 001902230 120.37 423,365.23 5,293 79.99 200.36
Delmar Gardens 001902623 112.21 913,831.78 11,904 76.77 188.98
El Jen Convalescent 001902849 114.36 617,823.57 7,986 77.36 191.72
Gardnerville 100503498 122.13 176,216.70 2,140 82.34 204.47
Mountain View 001913700 111.21 943,550.98 10,900 86.56 197.77
Pahrump 001912881 115.40 329,688.27 3,533 93.32 208.72
Gaye Haven ICF 001902778 99.87 196,140.78 1,395 140.60 240.48
Harmon Medical & Rehab 001902900
Hearthstone 001916850 123.11 508,404.72 6,169 82.41 205.52
Highland Manor Elko 001904100 114.98 294,290.01 4,481 65.68 180.66
Highland Manor Fallon 100506408 117.97 324,865.14 4,477 72.56 190.53
Highland Manor Mesquite 001902250 107.75 261,674.27 2,797 93.56 201.31
Horizon Health Care (Desert Lane) 001902838 113.14 745,082.78 9,054 82.29 195.44
Las Vegas Flamingo N/A
Las Vegas Healthcare 001902856 112.76 222,451.28 2,574 86.42 199.18
Las Ventanas N/A
Life Care Center Las Vegas 001902780 117.93 1,061,198.89 12,823 82.76 200.69
Life Care Center Paradise Valley 001902011 116.25 106,103.28 1,537 69.03 185.28
Life Care Center Reno 001916860 116.73 194,588.52 2,902 67.05 183.78
Royal Springs Healthcare & Rehab (Manor LV) 001902324 117.82 1,196,787.73 13,921 85.97 203.79
Manor Care Reno 001916915 114.30 503,329.12 6,611 76.14 190.44
Manor Care Wingfield Hills 100519895 116.55 207,213.60 2,865 72.33 188.87
Marquis Care Centennial Hills 100521441 122.52 535,258.94 6,521 82.08 204.60
Marquis Care Plaza Regency 001902602 124.43 838,081.39 10,236 81.88 206.31
Mission Pines 001902100 116.77 1,311,639.60 12,464 105.23 222.01
Mountain View Boulder City 001902431 110.93 313,834.08 4,256 73.74 184.67
North Las Vegas Care Center 001902340 112.71 1,147,921.98 12,981 88.43 201.14
Ormsby Post Acute Rehab 001913305 120.60 320,496.11 4,617 69.42 190.01
Regent Care Center Reno 001916865 116.05 602,222.94 7,676 78.46 194.51
Renown Skilled Nursing 001916900 114.61 370,268.42 4,692 78.91 193.53
Rosewood Rehabilitation Center 001916870 117.10 221,619.60 2,498 88.72 205.82
Silver Hills Health Care 001902525 122.19 258,169.18 3,779 68.32 190.50
Silver Ridge Health Care 001902151 123.27 522,857.78 6,570 79.58 202.86
Southern NV Medical & Rehab 001902876 128.40 21,830.93 294 74.25 202.65
St. Joseph's Transitional Rehab 001902545 124.18 536,201.90 6,065 88.41 212.59
The Heights of Summerlin 100506410 115.42 584,539.22 8,054 72.58 188.00
TLC Care Center 001902300 116.84 694,131.86 8,542 81.26 198.10
Torrey Pines Care Center 001902784 122.94 54,676.16 899 60.82 183.76
White Pine Care Center 001917920 109.37 224,916.55 2,699 83.33 192.71

Provider Name% Medicaid
OccupancyProvider Name
% Medicaid
Occupancy
Clearview Health & Rehab (Henderson) 76.07% Advanced Health Care of Las Vegas 0.00%
Delmar Gardens 71.25% CareMeridian LLC 49.06%
El Jen Convalescent 69.78% Carson Nursing & Rehab 42.31%
Empres Mountain View 92.30% College Park Rehab Ctr 62.05%
Empres Pahrump 79.50% Empres Gardnerville 54.90%
Gaye Haven ICF 89.65% Harmon Medical & Rehab 0.00%
Horizon Health Care (Desert Lane) 78.13% Hearthstone 59.83%
Life Care Center Las Vegas 68.37% Highland Manor Elko 49.90%
Royal Springs (Manor Care Las Vegas) 76.77% Highland Manor Fallon 57.08%
Marquis Care Centennial Hills 65.96% Highland Manor Mesquite 53.58%
Marquis Care Plaza Regency 71.28% Las Vegas Flamingo 0.00%
Mission Pines 100.00% Las Vegas Healthcare 43.52%
Mountain View Boulder City 66.29% Las Ventanas 0.00%
North Las Vegas Care Center 84.74% Life Care Center Paradise Valley 17.21%
St. Joseph's Transitional Rehab 73.66% Life Care Center Reno 28.37%
TLC Care Center 65.50% Manor Care Reno 56.34%
White Pine Care Center 81.84% Manor Care Wingfield Hills 33.75%
Ormsby Post Acute Rehab 52.20%
Regent Care Center Reno 55.63%
Renown Skilled Nursing 52.20%
Rosewood Rehabilitation 38.25%
Silver Hills Health Care 35.98%
Silver Ridge Health Care 52.86%
Southern NV Medical & Rehab 3.74%
The Heights of Summerlin 55.15%
Torrey Pines Care Center 12.54%
Below 65% Occupancy ($32.87)65% or More Occupancy ($18.22)
Medicaid Occupancy - SFY 2014 Q2 Provider Tax Supplemental Payment Program

Division of Health Care Financing and Policy
Nevada Medicaid - Long Term Care Provider Tax Base Quarter 4/1/2013 through 6/30/2013
NF Supplemental Payment Distribution Based on Occupancy, MDS Accuracy, and Quality Distribution Quarter 10/1/2013 through 12/31/2013
Total Amount Available 7,915,898.89 868,818.17 868,818.17 9,653,535.23
%
MDS
Accuracy
Modifier Facility Name Provider # Owner
Waiver
Facility
Total Occupied
Bed Days
SNF LTC Hospice
Medicaid Bed
Days
Medicare
Bed Days
Other Bed
Days
Medicaid
Occupancy
Modifier
Medicaid
Occupancy Points
Case Mix
Accuracy %
Case Mix
Accuracy
Modifier
Case Mix Points
(Modifier X
Medicaid Bed
Days)
Quality
Points
Medicaid
Occupancy
Spplmnt
Case Mix
Accuracy
Spplmnt
Quality
Spplmnt
Estimated
Quarterly Payment
70% 1 Advanced Health Care of Las Vegas N/A 0 No 3,447 0 - - NMP 0 0 - - - -
71% 1 CareMeridian LLC 100510503 CareMeridian No 2,509 1,231 Negotiated Rate / Does Not Get Supplemental Payment
72% 1 Carson Nursing & Rehab 001913842 Convenant No 5,003 2,117 2,017 869 42.31 89,580.03 87% 3 6,351 13 44,806.70 10,279.31 35,970.18 91,056.20
82% 3 Clearview Health & Rehabilitation (Henderson) 001902200 Fundamental Health Care Yes 20,191 15,359 3,019 1,813 76.07 1,168,336.79 90% 5 76,795 0 584,386.01 124,295.38 - 708,681.39
73% 1 College Park Rehab Ctr 001902230 Fundamental Health Care No 8,530 5,293 2,768 469 62.05 328,439.03 76% 1 5,293 9 164,280.69 8,566.90 24,902.43 197,750.03
74% 1 Delmar Gardens 001902623 Delmar Gardens Enterprises Yes 16,708 11,904 2,378 2,426 71.25 848,127.94 68% 0 0 6 424,221.94 - 16,601.62 440,823.56
75% 1 El Jen Convalescent 001902849 James Toomey Yes 11,445 7,986 1,484 1,975 69.78 557,240.68 76% 1 7,986 1 278,724.13 12,925.62 2,766.94 294,416.69
76% 1 Gardnerville 100503498 EmpRes No 3,898 2,140 1,157 601 54.90 117,485.89 63% 0 0 9 58,764.83 - 24,902.43 83,667.26
77% 1 Mountain View 001913700 EmpRes Yes 11,809 10,900 317 592 92.30 1,006,097.04 66% 0 0 4 503,235.92 - 11,067.75 514,303.67
78% 1 Pahrump 001912881 EmpRes Yes 4,444 3,533 738 173 79.50 280,875.09 85% 3 10,599 10 140,489.86 17,154.85 27,669.37 185,314.08
79% 1 Gaye Haven ICF 001902778 Sandra Manetas Yes 1,556 1,395 0 161 89.65 125,065.87 84% 3 4,185 28 62,556.23 6,773.57 77,474.23 146,804.03
80% 3 Harmon Medical & Rehab 001902900 Fundamental Health Care No 160 - NMP 0 0 - - - -
81% 3 Hearthstone 001916850 Fundamental Health Care No 10,311 6,169 1,893 2,249 59.83 369,087.00 85% 3 18,507 9 184,612.25 29,954.22 24,902.43 239,468.90
83% 3 Highland Manor Elko 001904100 RFMS, Inc No 8,980 4,481 1,482 3,017 49.90 223,600.90 60% 0 0 0 111,842.10 - - 111,842.10
84% 3 Highland Manor Fallon 100506408 RFMS, Inc No 7,843 4,477 1,437 1,929 57.08 255,559.47 73% 1 4,477 1 127,827.33 7,246.18 2,766.94 137,840.45
85% 3 Highland Manor Mesquite 001902250 RFMS, Inc No 5,220 2,797 807 1,616 53.58 149,869.90 80% 3 8,391 24 74,962.87 13,581.13 66,406.48 154,950.48
86% 3 Horizon Health Care (Desert Lane) 001902838 Fundamental Health Care Yes 11,588 9,054 1,879 655 78.13 707,412.12 75% 1 9,054 5 353,837.82 14,654.21 13,834.68 382,326.72 87% 3 Las Vegas Flamingo N/A Kindred Healthcare No 4,442 0 NMP 0 0 - - - - 88% 3 Las Vegas Healthcare 001902856 Kindred Healthcare No 5,914 2,574 1,328 2,012 43.52 112,030.37 65% 0 0 23 56,036.05 - 63,639.55 119,675.60 89% 3 Las Ventanas N/A ABHOW No 5,174 0 NMP 0 0 - - - -
90% 5 Life Care Center Las Vegas 001902780 Life Care Centers of America Yes 18,755 12,823 4,060 1,872 68.37 876,722.63 89% 3 38,469 9 438,524.61 62,263.42 24,902.43 525,690.46
91% 5 Life Care Center Paradise Valley 001902011 Life Care Centers of America No 8,929 1,537 6,309 1,083 17.21 26,457.26 84% 3 4,611 8 13,233.56 7,463.06 22,135.49 42,832.12
92% 5 Life Care Center Reno 001916860 Life Care Centers of America No 10,230 2,902 5,690 1,638 28.37 82,322.62 83% 3 8,706 7 41,176.64 14,090.96 19,368.56 74,636.17
93% 5 Royal Springs Healthcare & Rehab (Manor LV) 001902324 HCR ManorCare Yes 18,134 13,921 1,587 2,626 76.77 1,068,678.95 88% 3 41,763 5 534,538.53 67,594.87 13,834.68 615,968.08
94% 5 Manor Care Reno 001916915 HCR ManorCare No 11,734 6,611 4,068 1,055 56.34 372,467.37 79% 1 6,611 14 186,303.06 10,700.13 38,737.12 235,740.31
95% 5 Manor Care Wingfield Hills 100519895 HCR ManorCare No 8,489 2,865 3,864 1,760 33.75 96,692.48 78% 1 2,865 13 48,364.25 4,637.10 35,970.18 88,971.53
96% 5 Marquis Care Centennial Hills 100521441 Marquis Care Yes 9,886 6,521 2,399 966 65.96 430,137.98 87% 3 19,563 2 215,149.11 31,663.40 5,533.87 252,346.38
97% 5 Marquis Care Plaza Regency 001902602 Marquis Care Yes 14,360 10,236 1,095 3,029 71.28 729,635.77 76% 1 10,236 2 364,953.79 16,567.32 5,533.87 387,054.98
98% 5 Mission Pines 001902100 Preferred Care West Yes 12,464 12,464 - 0 100.00 1,246,400.00 92% 5 62,320 26 623,432.16 100,867.09 71,940.36 796,239.60
99% 5 Mountain View Boulder City 001902431 Preferred Care West Yes 6,420 4,256 888 1,276 66.29 282,142.31 69% 0 0 2 141,123.70 - 5,533.87 146,657.58
100% 5 North Las Vegas Care Center 001902340 Fundamental Health Care Yes 15,319 12,981 1,431 907 84.74 1,099,982.77 83% 3 38,943 6 550,196.27 63,030.60 16,601.62 629,828.49
Ormsby Post Acute Rehab 001913305 Evergreen No 8,844 4,617 3,880 347 52.20 241,029.95 69% 0 0 1 120,559.87 - 2,766.94 123,326.81
Regent Care Center Reno 001916865 Regent Management Services No 13,798 7,676 1,446 4,676 55.63 427,025.48 92% 5 38,380 4 213,592.28 62,119.37 11,067.75 286,779.39
Renown Skilled Nursing 001916900 Renown Health System No 8,989 4,692 2,436 1,861 52.20 244,908.93 91% 5 23,460 7 122,500.08 37,970.83 19,368.56 179,839.47
Rosewood Rehabilitation Center 001916870 The Ensign Group Inc No 6,530 2,498 3,321 711 38.25 95,559.02 82% 3 7,494 21 47,797.31 12,129.30 58,105.67 118,032.28
Silver Hills Health Care 001902525 Convenant No 10,503 3,779 4,988 1,736 35.98 135,969.16 84% 3 11,337 3 68,009.91 18,349.33 8,300.81 94,660.05
Silver Ridge Health Care 001902151 Convenant No 12,428 6,570 3,699 2,159 52.86 347,319.76 85% 3 19,710 11 173,724.57 31,901.32 30,436.31 236,062.20
Southern NV Medical & Rehab 001902876 Fundamental Health Care No 7,853 294 6,168 1,391 3.74 1,100.67 90% 5 1,470 2 550.54 2,379.25 5,533.87 8,463.66
St. Joseph's Transitional Rehab 001902545 Skilled Healthcare Yes 8,234 6,065 1,318 851 73.66 446,735.79 83% 3 18,195 6 223,451.10 29,449.24 16,601.62 269,501.97
The Heights of Summerlin 100506410 Skilled Healthcare No 14,605 8,054 4,721 1,830 55.15 444,141.84 69% 0 0 12 222,153.65 - 33,203.24 255,356.89
TLC Care Center 001902300 TLC Holdings Yes 13,041 8,542 2,509 1,990 65.50 559,510.50 82% 3 25,626 7 279,859.46 41,476.57 19,368.56 340,704.60
Torrey Pines Care Center 001902784 Kindred Healthcare No 7,169 899 4,858 1,412 12.54 11,273.55 85% 3 2,697 2 5,638.88 4,365.19 5,533.87 15,537.94
White Pine Care Center 001917920 Evergreen Yes 3,298 2,699 239 360 81.84 220,879.35 75% 1 2,699 2 110,480.82 4,368.43 5,533.87 120,383.12
399,184 234,912 93,678 56,093 2,228.51 15,825,902.29 536,793 314 7,915,898.89 868,818 868,818 9,653,535
233,681 - - - - -
-
Modifier Lookup

Nevada Division of Health Care Financing and Policy
Nevada Medicaid
Provider Tax Quality Measures
High-Risk
Pressure
Ulcers
Falls with
Major
Injury
Urinary Tract
Infection
Need for Help
with ADLs has
Increased SFF
CMI All
Residents
High-Risk
Pressure
Ulcers
Falls with
Major
Injury
Urinary Tract
Infection
Need for Help
with ADLs has
Increased
Total
Quality
Points
Nevada Average 9% 2% 7% 16% 1.1937
National Average 7% 3% 7% 16%
Advanced Health Care of Las Vegas NMP NMP NMP NMP 0.0000 0
CareMeridian LLC IE IE IE IE 0.0000 0
Carson Nursing & Rehab 6% 3% 8% 6% 1.2849 3 10 13
Clearview Health & Rehabilitation (Henderson) 5% 1% 1% 28% Y 1.1938 0
College Park Rehab Ctr 11% 3% 6% 8% 1.2599 1 8 9
Delmar Gardens 3% 5% 17% 19% 1.0173 6 6
El Jen Convalescent 12% 1% 9% 35% 1.1242 1 1
Gardnerville 0% 3% 9% 37% 1.2506 9 9
Mountain View 6% 4% 6% 17% 1.0277 3 1 4
Pahrump 11% 7% 2% 11% 1.0974 5 5 10
Gaye Haven ICF 0% 0% 0% 6% 0.7922 9 2 7 10 28
Harmon Medical & Rehab NMP NMP NMP NMP 0.0000 0
Hearthstone 0% 4% 7% 18% 1.3584 9 9
Highland Manor Elko 11% 4% 19% 19% 1.0262 0
Highland Manor Fallon 9% 2% 17% 15% 1.1535 1 1
Highland Manor Mesquite 6% 0% 2% 2% 0.9709 3 2 5 14 24
Horizon Health Care (Desert Lane) 8% 2% 3% 27% 1.1409 1 4 5
Las Vegas Flamingo NMP NMP NMP NMP 0.0000 0
Las Vegas Healthcare 3% 0% 0% 8% 1.2577 6 2 7 8 23
Las Ventanas NMP NMP NMP NMP 0.0000 0
Life Care Center Las Vegas 3% 1% 5% 17% 1.1238 6 1 2 9
Life Care Center Paradise Valley 7% 0% 14% 12% 1.3949 2 2 4 8
Life Care Center Reno 7% 2% 8% 11% 1.3706 2 5 7
Royal Springs Healthcare & Rehab (Manor LV) 6% 2% 7% 14% 1.1251 3 2 5
Manor Care Reno 3% 1% 5% 11% 1.1626 6 1 2 5 14
Manor Care Wingfield Hills 6% 0% 11% 8% 1.2027 3 2 8 13
Marquis Care Centennial Hills 9% 6% 5% 17% 1.2232 2 2
Marquis Care Plaza Regency 16% 3% 5% 22% 1.3109 2 2
Mission Pines 1% 2% 0% 5% 1.1104 8 7 11 26
Mountain View Boulder City 7% 4% 15% 31% 1.1092 2 2
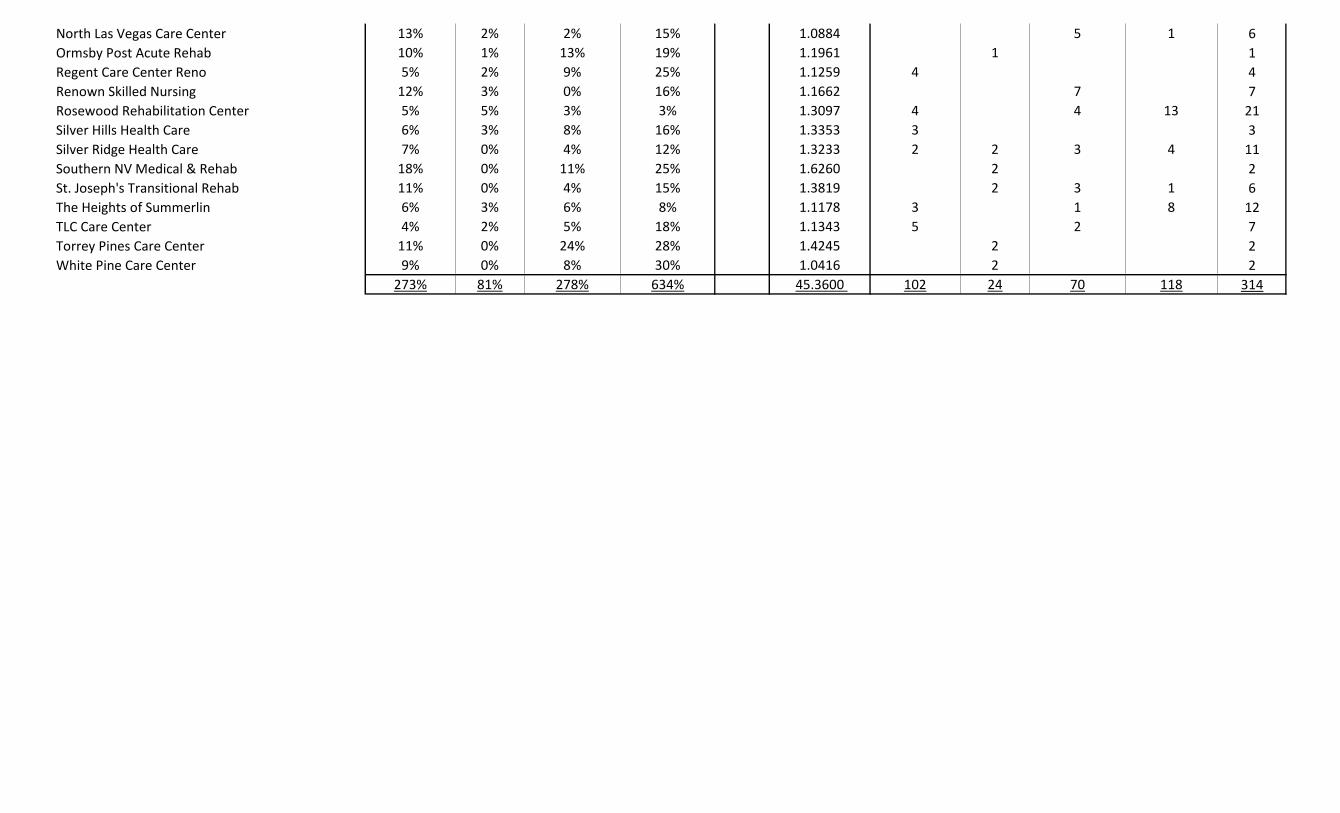
North Las Vegas Care Center 13% 2% 2% 15% 1.0884 5 1 6
Ormsby Post Acute Rehab 10% 1% 13% 19% 1.1961 1 1
Regent Care Center Reno 5% 2% 9% 25% 1.1259 4 4
Renown Skilled Nursing 12% 3% 0% 16% 1.1662 7 7
Rosewood Rehabilitation Center 5% 5% 3% 3% 1.3097 4 4 13 21
Silver Hills Health Care 6% 3% 8% 16% 1.3353 3 3
Silver Ridge Health Care 7% 0% 4% 12% 1.3233 2 2 3 4 11
Southern NV Medical & Rehab 18% 0% 11% 25% 1.6260 2 2
St. Joseph's Transitional Rehab 11% 0% 4% 15% 1.3819 2 3 1 6
The Heights of Summerlin 6% 3% 6% 8% 1.1178 3 1 8 12
TLC Care Center 4% 2% 5% 18% 1.1343 5 2 7
Torrey Pines Care Center 11% 0% 24% 28% 1.4245 2 2
White Pine Care Center 9% 0% 8% 30% 1.0416 2 2
273% 81% 278% 634% 45.3600 102 24 70 118 314
Medicaid
Occupancy of
65% or higher
Medicaid
Occupancy of
lower than 65%
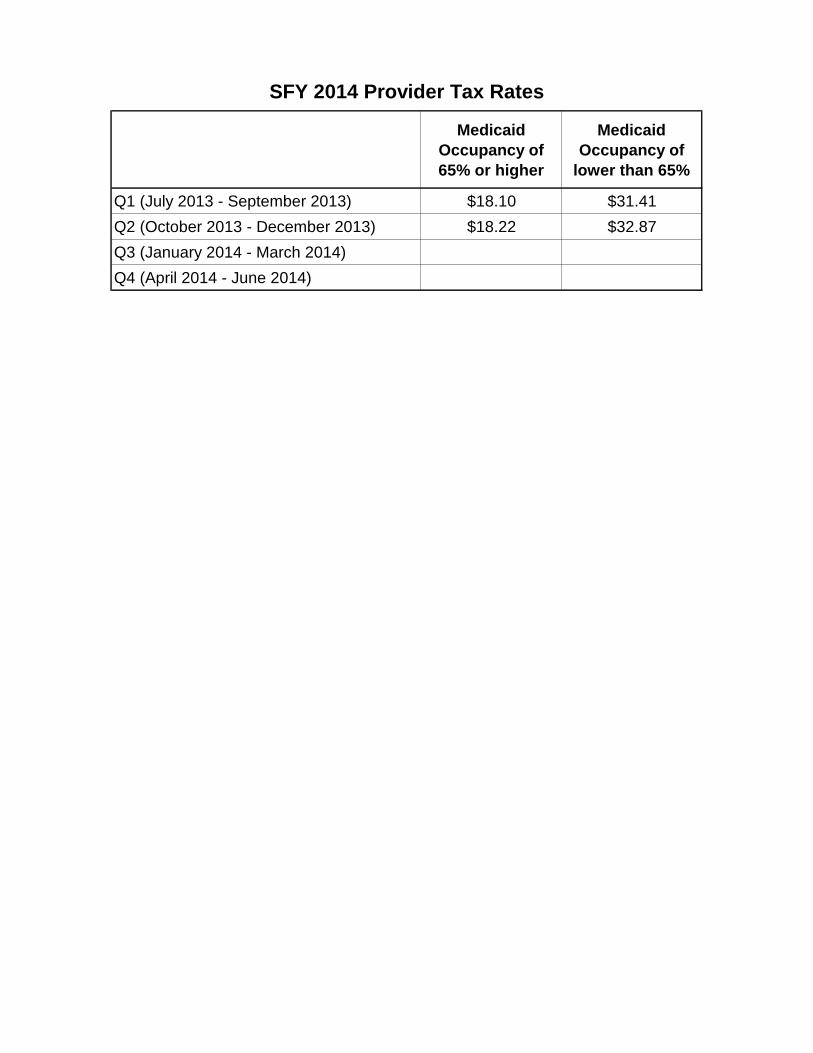
Q1 (July 2013 - September 2013) $18.10 $31.41
Q2 (October 2013 - December 2013) $18.22 $32.87
Q3 (January 2014 - March 2014)
Q4 (April 2014 - June 2014)
SFY 2014 Provider Tax Rates
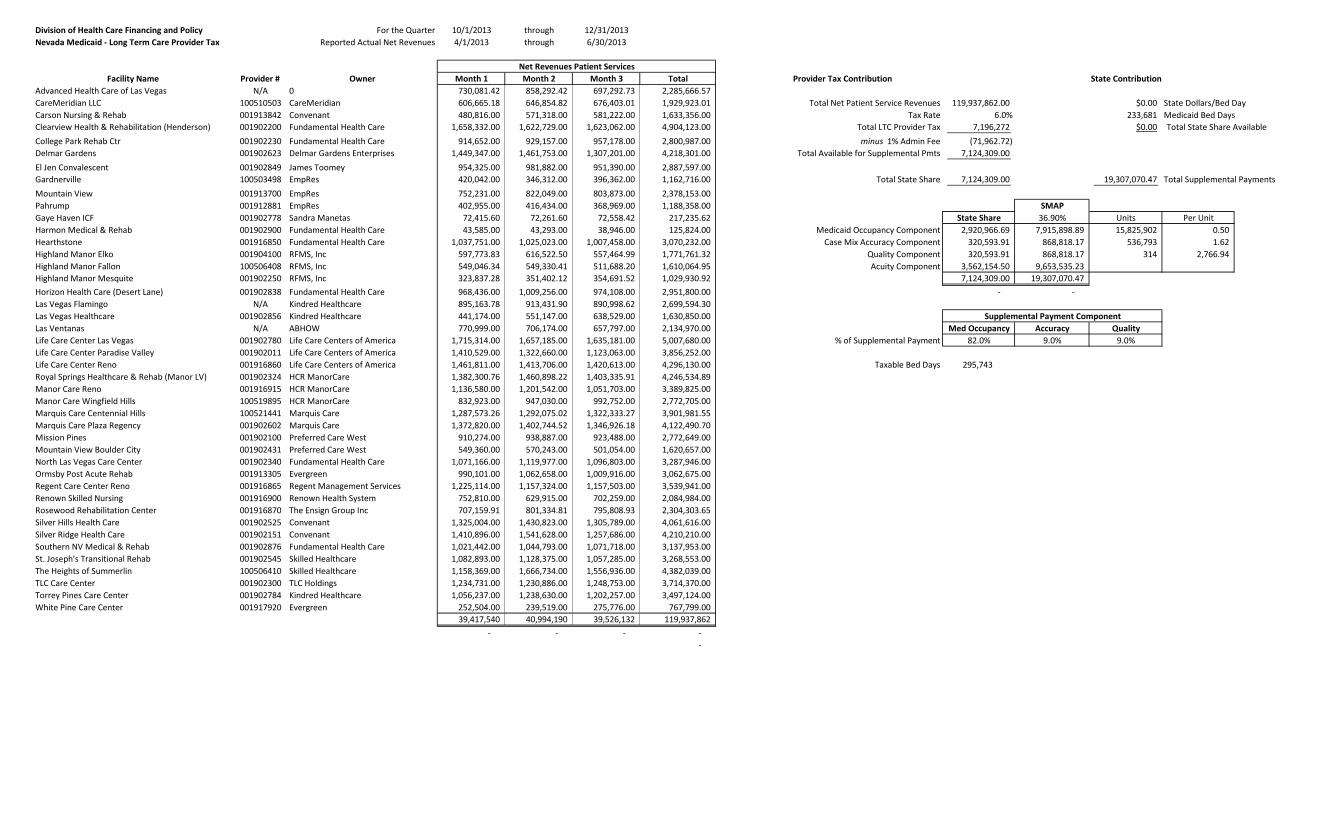
Division of Health Care Financing and Policy For the Quarter 10/1/2013 through 12/31/2013
Nevada Medicaid - Long Term Care Provider Tax Reported Actual Net Revenues 4/1/2013 through 6/30/2013
Facility Name Provider # Owner Month 1 Month 2 Month 3 Total Provider Tax Contribution State Contribution
Advanced Health Care of Las Vegas N/A 0 730,081.42 858,292.42 697,292.73 2,285,666.57
CareMeridian LLC 100510503 CareMeridian 606,665.18 646,854.82 676,403.01 1,929,923.01 Total Net Patient Service Revenues 119,937,862.00 $0.00 State Dollars/Bed Day
Carson Nursing & Rehab 001913842 Convenant 480,816.00 571,318.00 581,222.00 1,633,356.00 Tax Rate 6.0% 233,681 Medicaid Bed Days
Clearview Health & Rehabilitation (Henderson) 001902200 Fundamental Health Care 1,658,332.00 1,622,729.00 1,623,062.00 4,904,123.00 Total LTC Provider Tax 7,196,272 $0.00 Total State Share Available
College Park Rehab Ctr 001902230 Fundamental Health Care 914,652.00 929,157.00 957,178.00 2,800,987.00 minus 1% Admin Fee (71,962.72)
Delmar Gardens 001902623 Delmar Gardens Enterprises 1,449,347.00 1,461,753.00 1,307,201.00 4,218,301.00 Total Available for Supplemental Pmts 7,124,309.00
El Jen Convalescent 001902849 James Toomey 954,325.00 981,882.00 951,390.00 2,887,597.00
Gardnerville 100503498 EmpRes 420,042.00 346,312.00 396,362.00 1,162,716.00 Total State Share 7,124,309.00 19,307,070.47 Total Supplemental Payments
Mountain View 001913700 EmpRes 752,231.00 822,049.00 803,873.00 2,378,153.00
Pahrump 001912881 EmpRes 402,955.00 416,434.00 368,969.00 1,188,358.00 SMAP
Gaye Haven ICF 001902778 Sandra Manetas 72,415.60 72,261.60 72,558.42 217,235.62 State Share 36.90% Units Per Unit
Harmon Medical & Rehab 001902900 Fundamental Health Care 43,585.00 43,293.00 38,946.00 125,824.00 Medicaid Occupancy Component 2,920,966.69 7,915,898.89 15,825,902 0.50
Hearthstone 001916850 Fundamental Health Care 1,037,751.00 1,025,023.00 1,007,458.00 3,070,232.00 Case Mix Accuracy Component 320,593.91 868,818.17 536,793 1.62
Highland Manor Elko 001904100 RFMS, Inc 597,773.83 616,522.50 557,464.99 1,771,761.32 Quality Component 320,593.91 868,818.17 314 2,766.94
Highland Manor Fallon 100506408 RFMS, Inc 549,046.34 549,330.41 511,688.20 1,610,064.95 Acuity Component 3,562,154.50 9,653,535.23
Highland Manor Mesquite 001902250 RFMS, Inc 323,837.28 351,402.12 354,691.52 1,029,930.92 7,124,309.00 19,307,070.47
Horizon Health Care (Desert Lane) 001902838 Fundamental Health Care 968,436.00 1,009,256.00 974,108.00 2,951,800.00 - -
Las Vegas Flamingo N/A Kindred Healthcare 895,163.78 913,431.90 890,998.62 2,699,594.30
Las Vegas Healthcare 001902856 Kindred Healthcare 441,174.00 551,147.00 638,529.00 1,630,850.00
Las Ventanas N/A ABHOW 770,999.00 706,174.00 657,797.00 2,134,970.00 Med Occupancy Accuracy Quality
Life Care Center Las Vegas 001902780 Life Care Centers of America 1,715,314.00 1,657,185.00 1,635,181.00 5,007,680.00 % of Supplemental Payment 82.0% 9.0% 9.0%
Life Care Center Paradise Valley 001902011 Life Care Centers of America 1,410,529.00 1,322,660.00 1,123,063.00 3,856,252.00
Life Care Center Reno 001916860 Life Care Centers of America 1,461,811.00 1,413,706.00 1,420,613.00 4,296,130.00 Taxable Bed Days 295,743
Royal Springs Healthcare & Rehab (Manor LV) 001902324 HCR ManorCare 1,382,300.76 1,460,898.22 1,403,335.91 4,246,534.89
Manor Care Reno 001916915 HCR ManorCare 1,136,580.00 1,201,542.00 1,051,703.00 3,389,825.00
Manor Care Wingfield Hills 100519895 HCR ManorCare 832,923.00 947,030.00 992,752.00 2,772,705.00
Marquis Care Centennial Hills 100521441 Marquis Care 1,287,573.26 1,292,075.02 1,322,333.27 3,901,981.55
Marquis Care Plaza Regency 001902602 Marquis Care 1,372,820.00 1,402,744.52 1,346,926.18 4,122,490.70
Mission Pines 001902100 Preferred Care West 910,274.00 938,887.00 923,488.00 2,772,649.00
Mountain View Boulder City 001902431 Preferred Care West 549,360.00 570,243.00 501,054.00 1,620,657.00
North Las Vegas Care Center 001902340 Fundamental Health Care 1,071,166.00 1,119,977.00 1,096,803.00 3,287,946.00
Ormsby Post Acute Rehab 001913305 Evergreen 990,101.00 1,062,658.00 1,009,916.00 3,062,675.00
Regent Care Center Reno 001916865 Regent Management Services 1,225,114.00 1,157,324.00 1,157,503.00 3,539,941.00
Renown Skilled Nursing 001916900 Renown Health System 752,810.00 629,915.00 702,259.00 2,084,984.00
Rosewood Rehabilitation Center 001916870 The Ensign Group Inc 707,159.91 801,334.81 795,808.93 2,304,303.65
Silver Hills Health Care 001902525 Convenant 1,325,004.00 1,430,823.00 1,305,789.00 4,061,616.00
Silver Ridge Health Care 001902151 Convenant 1,410,896.00 1,541,628.00 1,257,686.00 4,210,210.00
Southern NV Medical & Rehab 001902876 Fundamental Health Care 1,021,442.00 1,044,793.00 1,071,718.00 3,137,953.00
St. Joseph's Transitional Rehab 001902545 Skilled Healthcare 1,082,893.00 1,128,375.00 1,057,285.00 3,268,553.00
The Heights of Summerlin 100506410 Skilled Healthcare 1,158,369.00 1,666,734.00 1,556,936.00 4,382,039.00
TLC Care Center 001902300 TLC Holdings 1,234,731.00 1,230,886.00 1,248,753.00 3,714,370.00
Torrey Pines Care Center 001902784 Kindred Healthcare 1,056,237.00 1,238,630.00 1,202,257.00 3,497,124.00
White Pine Care Center 001917920 Evergreen 252,504.00 239,519.00 275,776.00 767,799.00
39,417,540 40,994,190 39,526,132 119,937,862
- - - -
-
Net Revenues Patient Services
Supplemental Payment Component