supplemental information hts by nmr of combinatorial ... & biology, volume 20 supplemental...
TRANSCRIPT

Chemistry & Biology, Volume 20
Supplemental Information
HTS by NMR of Combinatorial Libraries:
A Fragment-Based Approach to Ligand Discovery
Bainan Wu, Ziming Zhang, Roberta Noberini, Elisa Barile, Marc Giulianotti, Clemencia Pinilla, Richard A. Houghten, Elena B. Pasquale, and Maurizio Pellecchia Inventory of Supplemental Information Figure S1. Superposition of 2D [15N, 1H]-HSQC spectra of BIR3 in the absence and presence of the mixtures from tetra- and tri-peptide positional scanning library. Data associated related to those reported in Figure 2 of the manuscript. Figure S2. Chemical shift mapping studies with compound 1. These data relates to the compounds and chemical shifts data listed in Figure 3. Figure S3. 2D [15N, 1H]-HSQC spectra of EphA4 LBD with 3-methylindole, 4-cholorotulene, G-f16-G and G-G-f51. These data are associated with the data reported in Figure 4. Figure S4. 2D [15N, 1H]-HSQC spectra of EphA4 LBD with compound 12 and 15. These data are supporting some of the data in Table 1 of the manuscript. Figure S5. Superposition of 2D [15N,1H]-HSQC spectra of 50 µM EphA4 LBD in the absence (red) and presence (green) of 50 µM compound 22. These data are supporting the data reported in Table 1 of the manuscript. Figure S6. ITC data for KYL, compounds 12, 15 and 22. These data are supporting the data reported in Table 1 of the manuscript. Figure S7. Stability of compounds 15, 16, 22 and KYL in mouse serum or cell conditioned medium. These data support the statements in the manuscript that the compounds 15, 16 and 22 are much more stable than the reference peptide KYL. Figure S8. Chemical shift mapping for two individual side chains of compound 6. These data support the binding of compound 6 side chains in different pockets of the EphA4 LBD. Table S1. Summary of the nine mixtures applied in BIR3 studies. It supports the data reported in Figure 2.

Table S2. Summary of the components for the XXX library used against EphA4 LBD. It supports the data reported in Figure 4. Table S3. Summary of the initial EphA4 LBD binding compounds resulting from the HTS by NMR approach. It supports the data reported in Figure 4. Table S4. EphA4 LBD binding studies via ITC measurements. It supports the data reported in Table 1.

Figure S1. Superposition of 2D [15N, 1H]-HSQC spectra of BIR3 in the absence and presence of the mixtures from tetra- and tri-peptide positional scanning library. The spectra of apo BIR3 are colored in red. The spectra are colored in green for the presence of AXX (A) and AXXX (B), orange for the presence of XXP (C) and XXPX (D), cyan for the presence of GXX (E) and GXXX (F). X represents the mixture of all fragments, while A, P and G represent alanine, proline and glycine respectively.
A B
C D
E F

Figure S2. A) Superposition of 2D [15N,1H]-HSQC spectra of 50 µM EphA4 LBD in the absence (red) and presence (blue) of 100 µM compound 1. B) Summary of chemical shift perturbations resulting from the binding of 100 µM compound 1 to the EphA4 LBD. The average chemical shift changes of each residue are calculated based on equation (1) in “MATERIALS AND METHODS”. C) Chemical shift mapping for the binding of compound 6 on the ribbon representation of the EphA4 LBD. Residues with averaged Δδ above 0.025 ppm are colored in red and those with Δδ btween 0.015 and 0.025 ppm are colored in yellow.
A
B C

Figure S3. A) Superposition of 2D [15N,1H]-HSQC spectra of 50 µM EphA4 LBD in the absence (red) and presence of 3 mM 3-methylindole (cyan) and 4-chlorotoluene (orange). B) and C) Superposition of 2D [15N,1H]-HSQC spectra of 50 µM EphA4 LBD in the absence (red) and presence of 2 mM G-f16-G (green) and G-G-f51 (cyan). f16 and f51 are fragments listed in Table S2. The characteristic movements of site chain amide from Gln-43 have been circled in black.
A
B
C
1H (ppm)
15N
(p
pm
)

Figure S4. Superposition of 2D [15N,1H]-HSQC spectra of 50 µM EphA4 LBD in the absence (red) and presence (green) of 100 µM compound 12 or presence (cyan) of 100 µM compound 15.

Figure S5. Superposition of 2D [15N,1H]-HSQC spectra of 50 µM EphA4 LBD in the absence (red) and presence (green) of 50 µM compound 22.

Figure S6. ITC data for interaction between EphA4 LBD and KYL peptide (top left), compound 12 (top right), compound 15 (bottom left) and compound 22 (bottom right).

Figure S7. Stability of compounds 15, 16, 22 and KYL peptide in mouse serum or cell conditioned medium. The compounds were incubated in mouse serum or PC3 prostate cancer cell conditioned medium for the indicated times at 37ºC and then tested for inhibition of ephrin-A5 AP binding to immobilized EphA4 Fc. In the absence of proteolytic degradation, the compounds at the concentration used (150 mM) inhibit ephrin-A5 AP-EphA4 Fc interaction by ~80%. Efficacy represents the relative ability of the compounds to inhibit EphA4-ephrin-A5 interaction, with efficacy = 1 for the inhibition observed with the intact peptides.

Figure S8
A B
C
D E
15N
(ppm)
120
119
118
117
116
1H (ppm)
9.4 9.3 9.2 9.1 9.0 8.9
15N
(ppm)
116
115
114
113
120
1H (ppm)
9.5 9.4 9.3 9.2 9.1 9.0
E32
E27
E32 E27

Figure S8. Chemical shift mapping studies for two individual side chains of compound 6. A) and B) report close-up views of superposition of 2D [15N,1H]-HSQC spectra for 50 µM EphA4 LBD in the absence (red) and presence of 3 mM 3-methylindole (cyan) or 4-chlorotoluene (yellow), respectively. C) Chemical shift perturbations caused by 3 mM 3-methylindole and 4-chlorotoluene to the EphA4 LBD. D) Chemical shift mapping relative to the binding of 3-methylindole on the surface of the EphA4 LBD. Residues with averaged above 0.03 ppm are colored in cyan and residue E34 experiencing intermediate exchange is colored in blue. E) Chemical shift mapping relative to the binding of 4-chlorotoluene on the surface of the EphA4 LBD. Residues with averaged above 0.03 ppm are colored in orange; residues exhibiting differential perturbations when comparing the spectra of bound receptor in presence of each ligand are colored in yellow.

Table S1. Summary of the nine mixtures applied in BIR3 inhibition studies.
Sequence Mixture
composition #compounds/mix
DMSO stock conc. for overall mixture (mM)
DMSO stock conc. for individual
compound (µM)
AXX X=58 (L, D, unnatural) 3,384 141 4.2
GXX X=58 (L, D, unnatural) 3,384 164 4.8
XXP X=58 (L, D, unnatural) 3,384 141 4.1
AXXX X=52 (L, D, unnatural) 140,608 155 1.1
GXXX X=52 (L, D, unnatural) 140,608 172 1.2
XXPX X=52 (L, D, unnatural) 140,608 146 1.0
AXXXXX X=19 (L amino acids,
no Cys) 2.5E+06 158 0.063
GXXXXX X=19 (L amino acids,
no Cys) 2.5E+06 139 0.056
XXPXXX X=19 (L amino acids,
no Cys) 2.5E+06 139 0.056

Table S2. List of components used to build the library.
Components position Components position Components position
L‐Ala 1 D‐Phe 21 N‐CBZ‐L‐Ornithine(Boc)
40
L‐Asp(Bzl) 2 D‐Ile 22 L‐Phenylglycine 41
L‐Glu(Bzl) 3 D‐Lys(CBZ) 23 D‐Phenylglycine 42
L‐Phe 4 D‐Leu 24 L‐Naphthylalanine 43
Gly 5 D‐Asn 25 D‐Naphthylalanine 44
L‐Ile 6 D‐Pro 26 ‐Alanine 45
L‐Lys(CBZ) 7 D‐Gln 27 L‐Hydroxyproline(Bzl)
46
L‐Leu 8 D‐Arg(Tos) 28 L‐cyclohexylAlanine 47
L‐Asn 9 D‐Ser(Bzl) 29 D‐cyclohexylAlanine 48
L‐Pro 10 D‐Thr(Bzl) 30 L‐Aspartic acid(aBzl) 49
L‐Gln 11 D‐Val 31 L‐Glutamic acid(aBzl)
50
L‐Arg(Tos) 12 D‐Trp(CHO) 32 L‐4‐Chlorophenylalanine
51
L‐Ser(Bzl) 13 D‐Tyr(BrZ) 33 D‐4‐Chlorophenylalanine
52
L‐Thr(Bzl) 14 L‐Norvaline 34 L‐4‐Fluorophenylalanine
53
L‐Val 15 D‐Norvaline 35 D‐4‐Fluorophenylalanine
54
L‐Trp(CHO) 16 L‐Norleucine 36 L‐‐tButylglycine 55
L‐Tyr(BrZ) 17 D‐Norleucine 37 L‐Homoproline 56
D‐Ala 18 N‐CBZ‐L‐Lysine(Boc)
38 O‐ethyl‐L‐Tyrosine 57
D‐Asp(Bzl) 19 L‐Ornithine(CBZ) 39 O‐ethyl‐D‐Tyrosine 58
D‐Glu(Bzl) 20
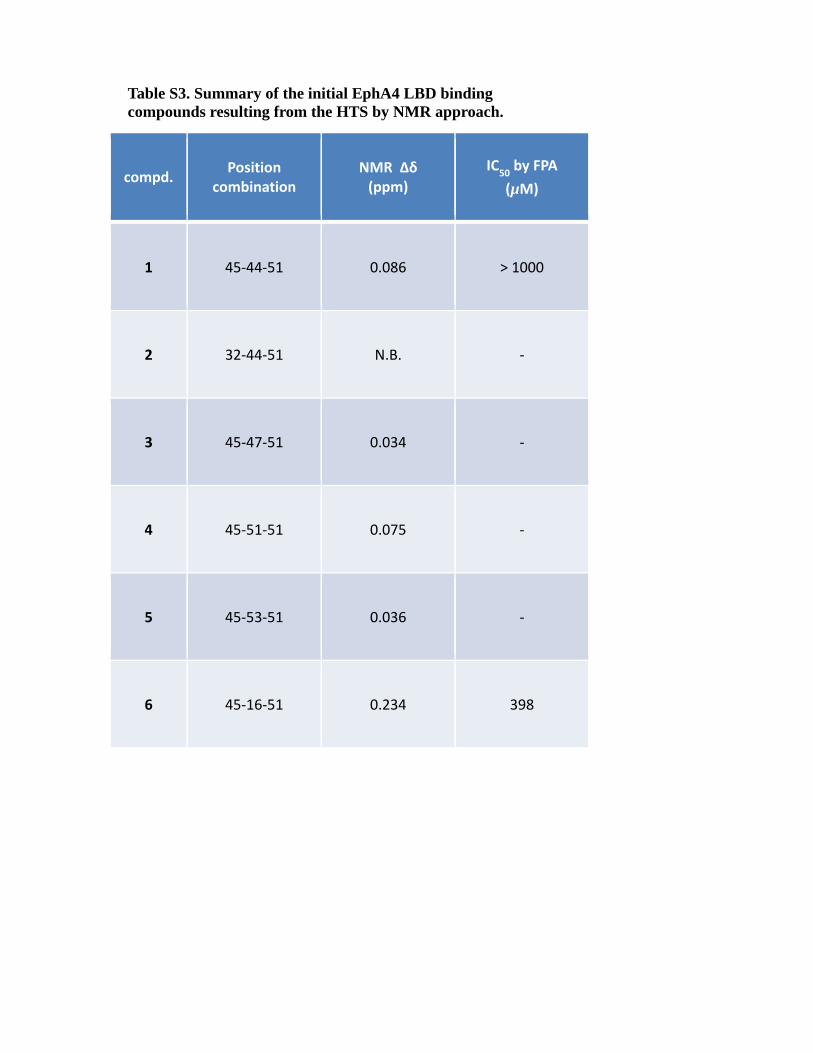
compd. Position combination
NMR Δδ (ppm)
IC50 by FPA (µM)
1 45‐44‐51 0.086 > 1000
2 32‐44‐51 N.B. ‐
3 45‐47‐51 0.034 ‐
4 45‐51‐51 0.075 ‐
5 45‐53‐51 0.036 ‐
6 45‐16‐51 0.234 398
Table S3. Summary of the initial EphA4 LBD binding compounds resulting from the HTS by NMR approach.

Table S4. EphA4 LBD binding studies via ITC measurements.
* ITC experiment was performed by titrating compound into protein solution.