supplemental figure 1 gene expression in zos and...
TRANSCRIPT

36
1
Supplemental Figure 1 2
Gene expression in ZOS and ZOSM cells. (A) The mRNA expression levels of the indicated genes 3
were determined in ZOS and ZOSM cells using real-time PCR. The values shown are the mean ± 4
SD of 3 separate determinations. (B) IRX1 protein expression in primary and commercially 5
available osteosarcoma cell lines was detected by immunofluorescence (×400 magnification). 6
7

37
1
Supplemental Figure 2 2
IRX1 expression was associated with promoter hypomethylation. (A) Schematic map of CpG sites 3
within the CpG islands in the IRX1 promoter by methylation analysis. (B) The methylation status 4
of the IRX1 promoter region (-521 to -679) in ZOS and ZOSM cells was analyzed by bisulfite 5
sequencing PCR. (C) Representative sequencing results of PCR products amplified from bisulfite 6
converted DNA from osteosarcoma cells. The arrows indicate the CpG sites. (D) IRX1 mRNA 7
expression was determined by real-time PCR after treatment with varying concentrations (0.5, 1, 2, 8
5, 10μM) of DAC. (E) IRX1 mRNA expression was determined by real-time PCR after treatment 9
with varying concentrations (50, 100, 200, 500μM) of AdoMet for 6 days. Results shown in D and 10
E are the mean ± SD (n=3). *P<0.05. 11
12
13
14
15
16

38
1 Supplemental Figure 3 2
IRX1 did not affect osteosarcoma cell growth. (A) A Cell Counting Kit-8 assay was performed on 3
control and IRX1-knockdown ZOSM and 143B cells. (B) A Cell Counting Kit-8 assay was 4
performed on control and IRX1-overexpressing ZOS and MNNG/HOS cells. The values shown 5
are the mean ± SD of 3 separate determinations. 6
7
8
9
10
11
12
13
14
15
16
17
18
19
20
21
22
23
24
25
26

39
1 Supplemental Figure 4 2
IRX1 overexpression had no influence on tumor growth in an orthotopic model of osteosarcoma. 3
The indicated 143B and MNNG/HOS cells were injected into the proximal tibia of NOD/SCID 4
mice (n = 10), and the tumor volume was measured every 3 days. (A) A representative image of an 5
orthotopic tumor (yellow arrow) in the right proximal tibia of NOD/SCID mice 5 weeks after 6
injection. Bone destruction (white arrow) caused by the tumor growth was observed using a 7
microPET-CT system. (B) Immunofluorescence analysis of IRX1 expression in tumors from mice 8
bearing the indicated 143B cells. (C) IRX1 knockdown in 143B cells did not affect in vivo tumor 9
growth. (D) Immunofluorescence analysis of IRX1 expression in tumors from mice bearing the 10
indicated MNNG/HOS cells. (E) IRX1 overexpression in MNNG/HOS cells did not affect tumor 11
growth. Scale bars: 100 µm. 12
13
14

40
1 Supplemental Figure 5 2
CXCL14 expression was correlated with IRX1 expression in ZOS and ZOSM cells. CXCL14 3
mRNA (A), cellular protein (B), and secreted protein (C) levels in ZOS-IRX1 and ZOSM-shIRX1 4
cells were determined by real-time PCR, western blot and ELISA, respectively. Results shown in 5
A and C are the mean ± SD (n=3). *P<0.05. 6
7
8
9
10
11
12
13
14
15
16
17
18
19
20
21
22
23
24
25
26
27
28
29
30
31

41
1
Supplemental Figure 6 2
CXCL14 promotes the metastatic ability of osteosarcoma cells in an autocrine manner. (A) The 3
effect of CXCL14 overexpression and knockdown in ZOS and ZOSM cells was determined by 4
western blot analysis. (B) The effect of CXCL14 overexpression and knockdown in MNNG/HOS 5
and 143B cells was determined by western blot analysis. (C) Transwell and FACS assays were 6
performed on control and CXCL14-overexpressing MNNG/HOS cells. A CXCL14-neutralizing 7
antibody (20 μg/ml) was used to block the secreted CXCL14 in the culture medium of 8
MNNG/HOS-CXCL14 cells. (D) Transwell and FACS assays were performed in control and 9
CXCL14-knockdown 143B cells. Recombinant human CXCL14 (rhCXCL14, 200 ng/ml) was 10
added to the culture medium of 143B-siCXCL14 cells. (E) Transwell and FACS assays were 11
performed on MNNG/HOS cells cultured in conditioned medium (CM) from 143B-Control or 12
143B-siCXCL14 cells. The values shown are the mean ± SD of 3 separate determinations. 13
*P<0.05. 14
15
16
17
18
19
20
21
22
23

42
1 Supplemental Figure 7 2
CXCL14 did not affect the cell growth of IRX1-overexpressing or IRK1-knockdown 3
osteosarcoma cells. (A) A Cell Counting Kit-8 assay was performed on control and 4
CXCL14-knockdown ZOS-IRX1 and MNNG/HOS-IRX1 cells. (B) A Cell Counting Kit-8 assay 5
was performed on control and CXCL14-overexpressing ZOSM-shIRX1 and 143B-shIRX1 cells. 6
The values shown are the mean ± SD of 3 separate determinations. 7
8
9
10
11
12
13
14
15
16
17
18
19

43
1
Supplemental Figure 8 2
CXCL14 blockade inhibited the migration, invasion and anoikis resistance in ZOS-IRX1 and 3
MNNG/HOS-IRX1 cells. (A and B) The migration and invasion abilities of ZOS-IRX1 (A) and 4
MNNG/HOS-IRX1 (B) cells after treatment with 20 μg/ml CXCL14-neutralizing antibody (R&D) 5
or normal rat IgG (control, R&D) were tested in a Transwell assay. (C) FACS analysis showed that 6
CXCL14 blockade by an anti-CXCL14 antibody (20 μg/ml) significantly increased the apoptotic 7
rates of ZOS-IRX1 and MNNG/HOS-IRX1 cells in suspension culture conditions. The results 8
shown in A-C represent the mean ± SD (n=3). *P<0.05. 9
10
11
12
13
14
15
16
17
18
19
20
21
22
23
24
25

44
1
Supplemental Figure 9 2
BAY 11-7085 inhibited the migration, invasion and anoikis resistance of ZOS-IRX1 and 3
MNNG/HOS-IRX1 cells. (A and B) Transwell assays were performed to determine the migration 4
and invasion abilities of ZOS-IRX1 (A) and MNNG/HOS-IRX1 (B) cells after treatment with 5
DMSO (control) or BAY 11-7085 (2.5 μM). (C) FACS analysis showed that BAY 11-7085 (2.5 6
μM) significantly increased the apoptotic rates of ZOS-IRX1 and MNNG/HOS-IRX1 cells in 7
suspension culture. The results shown in A-C represent the mean ± SD (n=3). *P<0.05. 8
9
10
11
12
13
14
15
16
17
18
19
20
21
22
23

45
1
Supplemental Figure 10 2
The effect of AdoMet and DAC on osteosarcoma cells. (A) The apoptotic rates of ZOSM and 3
143B cells treated with AdoMet (500 μM) were determined by FACS under attached and 4
suspension conditions. (B and C) Transwell assays were used to determine the migration and 5
invasion abilities of ZOS (B) and MNNG/HOS (C) cells after treatment with DMSO (control) or 6
DAC (2 μM) for 3 days. (D) The apoptotic rates of ZOS and MNNG/HOS cells treated with DAC 7
(2 μM) for 3 days were determined by FACS. The results shown in A and D represent the mean ± 8
SD (n=3). Scale bars: 100 µm.*P<0.05.9
46
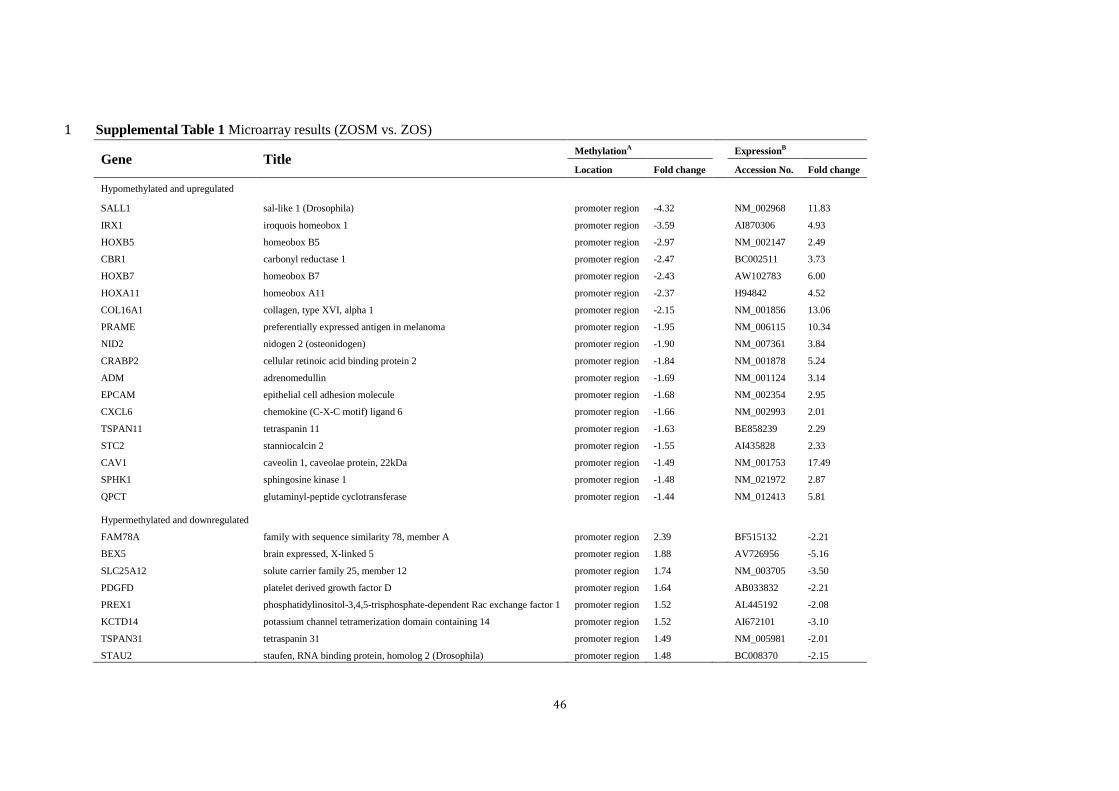
Supplemental Table 1 Microarray results (ZOSM vs. ZOS) 1
Gene Title Methylation
A
ExpressionB
Location Fold change Accession No. Fold change
Hypomethylated and upregulated
SALL1 sal-like 1 (Drosophila) promoter region -4.32 NM_002968 11.83
IRX1 iroquois homeobox 1 promoter region -3.59 AI870306 4.93
HOXB5 homeobox B5 promoter region -2.97 NM_002147 2.49
CBR1 carbonyl reductase 1 promoter region -2.47 BC002511 3.73
HOXB7 homeobox B7 promoter region -2.43 AW102783 6.00
HOXA11 homeobox A11 promoter region -2.37 H94842 4.52
COL16A1 collagen, type XVI, alpha 1 promoter region -2.15 NM_001856 13.06
PRAME preferentially expressed antigen in melanoma promoter region -1.95 NM_006115 10.34
NID2 nidogen 2 (osteonidogen) promoter region -1.90 NM_007361 3.84
CRABP2 cellular retinoic acid binding protein 2 promoter region -1.84 NM_001878 5.24
ADM adrenomedullin promoter region -1.69 NM_001124 3.14
EPCAM epithelial cell adhesion molecule promoter region -1.68 NM_002354 2.95
CXCL6 chemokine (C-X-C motif) ligand 6 promoter region -1.66 NM_002993 2.01
TSPAN11 tetraspanin 11 promoter region -1.63 BE858239 2.29
STC2 stanniocalcin 2 promoter region -1.55 AI435828 2.33
CAV1 caveolin 1, caveolae protein, 22kDa promoter region -1.49 NM_001753 17.49
SPHK1 sphingosine kinase 1 promoter region -1.48 NM_021972 2.87
QPCT glutaminyl-peptide cyclotransferase promoter region -1.44 NM_012413 5.81
Hypermethylated and downregulated
FAM78A family with sequence similarity 78, member A promoter region 2.39 BF515132 -2.21
BEX5 brain expressed, X-linked 5 promoter region 1.88 AV726956 -5.16
SLC25A12 solute carrier family 25, member 12 promoter region 1.74 NM_003705 -3.50
PDGFD platelet derived growth factor D promoter region 1.64 AB033832 -2.21
PREX1 phosphatidylinositol-3,4,5-trisphosphate-dependent Rac exchange factor 1 promoter region 1.52 AL445192 -2.08
KCTD14 potassium channel tetramerization domain containing 14 promoter region 1.52 AI672101 -3.10
TSPAN31 tetraspanin 31 promoter region 1.49 NM_005981 -2.01
STAU2 staufen, RNA binding protein, homolog 2 (Drosophila) promoter region 1.48 BC008370 -2.15

47
AMeDIP-chip data using a NimbleGen Human DNA Methylation 3x720K CpG Island Plus RefSeq Promoter Array. Data were stratified by a 1.4-fold change.
BGene 1
expression microarray data using an Affymetrix Human Genome U133 Plus 2.0 Array. Candidate genes were considered significantly differentially expressed with a 2
selection threshold of a 2-fold change. 3
4
5
6
7
8
9
10
11
12
13
14
15
16
17
18
19
20
21
22
23
24
25
26

48
Supplemental Table 2 1
Gene expression microarray results (143B-shIRX1 vs. 143B-shCtr) 2
3
4
5
6
7
8
9
10
Gene Name Accession no. Locus Fold change
Upregulated
PASD1 PAS domain containing 1 BC040301 chrX 197.6
PADI2 peptidyl arginine deiminase, type II BC009701 chr1 17.5
EREG epiregulin NM_001432 chr4 16.0
MIA melanoma inhibitory activity NM_006533 chr19 14.1
CCL20 chemokine (C-C motif) ligand 20 BC020698 chr2 13.4
MYEOV myeloma overexpressed gene NM_138768 chr11 11.6
MALL mal, T-cell differentiation protein-like BC003179 chr2 10.5
SLCO2A1 solute carrier organic anion transporter family, member 2A1 BC041140 chr3 8.6
KLRC1 killer cell lectin-like receptor subfamily C, member 1 NM_007328 chr12 8.2
MMP7 matrix metallopeptidase 7 NM_002423 chr11 8.2
CLDN1 claudin 1 NM_021101 chr3 7.2
KLRC2 killer cell lectin-like receptor subfamily C, member 2 NM_002260 chr12 6.9
KLRC3 killer cell lectin-like receptor subfamily C, member 3 AF461157 chr12 6.8
LIF leukemia inhibitory factor NM_002309 chr22 6.7
KLRC4 killer cell lectin-like receptor subfamily C, member 4 NM_013431 chr12 6.0
Downregulated
LCE2A late cornified envelope 2A NM_178428 chr1 -12.2
GALC galactosylceramidase NM_000153 chr14 -11.4
IL1A interleukin 1, alpha NM_000575 chr2 -9.7
TSPYL5 TSPY-like 5 NM_033512 chr8 -8.9
EFS embryonal Fyn-associated substrate NM_005864 chr14 -5.9
C20orf39 chromosome 20 open reading frame 39 NM_024893 chr20 -5.6
MAFB v-maf musculoaponeurotic fibrosarcoma oncogene homolog B NM_005461 chr20 -5.6
CXCL14 chemokine (C-X-C motif) ligand 14 BC003513 chr5 -5.0
EDIL3 EGF-like repeats and discoidin I-like domains 3 BX648583 chr5 -4.9
CD3D CD3d molecule, delta NM_000732 chr11 -4.7
TXNIP thioredoxin interacting protein NM_006472 chr1 -4.4
HES5 hairy and enhancer of split 5 (Drosophila) NM_001010926 chr1 -4.2
SPP1 secreted phosphoprotein 1 AK075463 chr4 -4.0
WDR66 WD repeat domain 66 NM_144668 chr12 -3.9
NPPB natriuretic peptide precursor B NM_002521 chr1 -3.9

49
Supplemental Table 3 1
Clinical characteristics of 113 osteosarcoma patients 2
3
4
5
6
7
8
9
10
11
12
13
14
15
16
17
18
19
20
21
22
23
24
25
26
27
28
29
30
31
32
33
34
35
36
37
38
39
40
41
42
43
44
Total=113 Percentage (%)
Age (years)
Average 18
Range 5-49
Gender
Male 77 68.1
Female 36 31.9
Location
Distal femur 64 56.6
Proximal tibia 29 25.7
Proximal humerus 10 8.9
Proximal femur 4 3.5
Other 6 5.3
Enneking
IIB 85 75.2
III 28 24.8
Relapse
Yes 7 6.2
No 106 93.8
Lung metastasis
Yes 37 32.7
No 76 67.3
Death
Yes 44 38.9
No 69 61.1

50
Supplemental Table 4 1
The association of IRX1 expression with patient clinicopathological characteristics in 113 2
osteosarcoma tissues 3
4
5
6
7
8
9
10
11
12
13
14
15
16
Number IRX1 expression level
P value* high low
Age 0.961
≤20 83 39 44
21-40 28 14 14
>40 2 1 1
Gender 0.258
Male 77 34 43
Female 36 20 16
Location 0.682
Distal femur 64 34 30
Proximal tibia 29 12 17
Proximal humerus 10 4 6
Proximal femur 4 1 3
Other 6 3 3
Enneking 0.480
IIB 85 39 46
III 28 15 13
Relapse 0.708
Yes 7 4 3
No 106 50 56
Lung metastasis 0.033
Yes 37 23 14
No 76 31 45
Death 0.007
Yes 44 28 16
No 69 26 43
*Chi-square test

51
Supplemental Table 5 1
Multivariate analysis* of overall survival and metastasis in 113 osteosarcoma patients 2
3
4
5
6
7
8
9
10
11
12
13
14
15
16
17
18
19
20
21
22
23
24
25
26
27
28
29
30
Variable RR 95% CI P value
Overall survival
Age 0.657 0.336-1.284 0.219
Gender 0.590 0.293-1.189 0.140
Location 0.983 0.741-1.303 0.904
Enneking stage 1.328 0.687-2.570 0.399
IRX1 2.252 1.204-4.212 0.011
Lung metastasis
Age 0.696 0.344-1.409 0.314
Gender 0.966 0.481-1.940 0.922
Location 0.957 0.700-1.307 0.781
Enneking stage 4.407 2.256-8.606 0.000
IRX1 2.482 1.252-4.918 0.009
*Cox proportional hazards regression
52
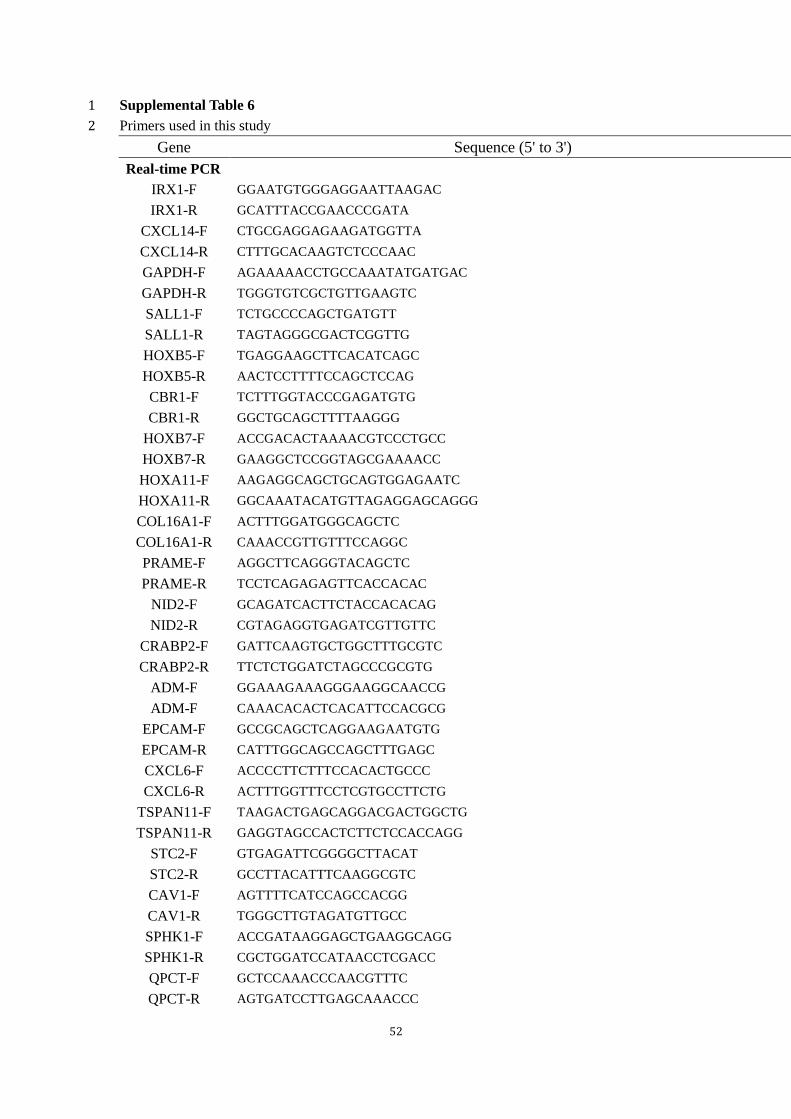
Supplemental Table 6 1
Primers used in this study 2
Gene Sequence (5' to 3')
Real-time PCR
IRX1-F GGAATGTGGGAGGAATTAAGAC
IRX1-R GCATTTACCGAACCCGATA
CXCL14-F CTGCGAGGAGAAGATGGTTA
CXCL14-R CTTTGCACAAGTCTCCCAAC
GAPDH-F AGAAAAACCTGCCAAATATGATGAC
GAPDH-R TGGGTGTCGCTGTTGAAGTC
SALL1-F TCTGCCCCAGCTGATGTT
SALL1-R TAGTAGGGCGACTCGGTTG
HOXB5-F TGAGGAAGCTTCACATCAGC
HOXB5-R AACTCCTTTTCCAGCTCCAG
CBR1-F TCTTTGGTACCCGAGATGTG
CBR1-R GGCTGCAGCTTTTAAGGG
HOXB7-F ACCGACACTAAAACGTCCCTGCC
HOXB7-R GAAGGCTCCGGTAGCGAAAACC
HOXA11-F AAGAGGCAGCTGCAGTGGAGAATC
HOXA11-R GGCAAATACATGTTAGAGGAGCAGGG
COL16A1-F ACTTTGGATGGGCAGCTC
COL16A1-R CAAACCGTTGTTTCCAGGC
PRAME-F AGGCTTCAGGGTACAGCTC
PRAME-R TCCTCAGAGAGTTCACCACAC
NID2-F GCAGATCACTTCTACCACACAG
NID2-R CGTAGAGGTGAGATCGTTGTTC
CRABP2-F GATTCAAGTGCTGGCTTTGCGTC
CRABP2-R TTCTCTGGATCTAGCCCGCGTG
ADM-F GGAAAGAAAGGGAAGGCAACCG
ADM-F CAAACACACTCACATTCCACGCG
EPCAM-F GCCGCAGCTCAGGAAGAATGTG
EPCAM-R CATTTGGCAGCCAGCTTTGAGC
CXCL6-F ACCCCTTCTTTCCACACTGCCC
CXCL6-R ACTTTGGTTTCCTCGTGCCTTCTG
TSPAN11-F TAAGACTGAGCAGGACGACTGGCTG
TSPAN11-R GAGGTAGCCACTCTTCTCCACCAGG
STC2-F GTGAGATTCGGGGCTTACAT
STC2-R GCCTTACATTTCAAGGCGTC
CAV1-F AGTTTTCATCCAGCCACGG
CAV1-R TGGGCTTGTAGATGTTGCC
SPHK1-F ACCGATAAGGAGCTGAAGGCAGG
SPHK1-R CGCTGGATCCATAACCTCGACC
QPCT-F GCTCCAAACCCAACGTTTC
QPCT-R AGTGATCCTTGAGCAAACCC

53
FAM78A-F TGAGGCACAGAAGGGCTGGATG
FAM78A-R CCCTGGGCTCTCTCTTCTTCTCCTC
BEX5-F GGGCAATGTCTGATGGAGTC
BEX5-R GAGGCAGTCTTTCTCTCTTAGC
SLC25A12-F GAGTGGAAATGGAGAGGTGAC
SLC25A12-R ATGCTTCTTCCGGTTATGCC
PDGFD-F TCTTCTTTCCACGTTGCCTC
PDGFD-R GGCCAGGCTCAAACTGTAAT
PREX1-F CTTCGCAACGACTTCAAGC
PREX1-R GTCAAAGCCATAGTCCTCCTC
KCTD14-F GGCCCAAGTGATCTGCATGTGG
KCTD14-R CCGACGTTCAGCTCCACAACAGTAG
TSPAN31-F CGCTCTCAACGTGGTCTAC
TSPAN31-R AAGACTCCCACAGCAATGAC
STAU2-F CCCGTTTCAATAGAGTCCAACC
STAU2-R GATTCCCATGTCTGCTCACC
Methylation
BSP-F TGTTAAAGATGTTTTTTGGAGGTTT
BSP-R AATATATCCCCTTTTTAACAAAAACAAC
MSP (M)-F GTTAAAGATGTTTTTTGGAGGTTTC
MSP (M)-R ATCTAACACCGAATTTACAATTTCG
MSP (U)-F TTAAAGATGTTTTTTGGAGGTTTTG
MSP (U)-R CTATCTAACACCAAATTTACAATTTCAC
MassARRAY
IRX1-F TTGTTAAAGATGTTTTTTGGAGGTT
IRX1-R AAATATATCCCCTTTTTAACAAAAACAA
shRNA
shIRX1-A-F TTCTCAGCCTCTTCTCGCAGATCTCGAGATCTGCGAGAAGAGGCTGAGATTTTTC
shIRX1-A-R TCGAGAAAAATCTCAGCCTCTTCTCGCAGATCTCGAGATCTGCGAGAAGAGGCTGAGAA
shIRX1-B-F TCATTGACAAGATCGACGAGCACTCGAGTGCTCGTCGATCTTGTCAATGTTTTTC
shIRX1-B-R TCGAGAAAAACATTGACAAGATCGACGAGCACTCGAGTGCTCGTCGATCTTGTCAATGA
shCXCL14-A-F TGCTTCATCAAGTGGTACAACTCGAGTTGTACCACTTGATGAAGCTTTTTC
shCXCL14-A-R TCGAGAAAAAGCTTCATCAAGTGGTACAACTCGAGTTGTACCACTTGATGAAGCA
shCXCL14-B-F TGACGTGAAGAAGCTGGAAACTCGAGTTTCCAGCTTCTTCACGTCTTTTTC
shCXCL14-B-R TCGAGAAAAAGACGTGAAGAAGCTGGAAACTCGAGTTTCCAGCTTCTTCACGTCA
siRNA
siCXCL14-A-F GCGAGGAGAAGAUGGUUAUTT
siCXCL14-A-R AUAACCAUCUUCUCCUCGCTT
siCXCL14-B-F GGGUCCAAAUGCAAGUGCUTT
siCXCL14-B-R AGCACUUGCAUUUGGACCCTT

54
ChIP
site A-F AGACAGGCCTCAAAGCAA
site A-R ATTGGCACCATCGTTTTATGTC
site B-F TATTTCTGAGGGCTGATCCAATG
site B-R GTGCTGACCATTGCGGTT
HEBP1-F AGGGATGGTAGGAAAGAGTGG
HEBP1-R TGTCTTGGTAGCTGTCCCTC
BDKRB2-F TGGGGCTTCCCAGGCCACTT
BDKRB2-R GCCACCTTCGCTCTCCGCTC
1
2
3
4
5
6
7
8
9
10
11
12
13
14
15
16
17
18
19
20
21
22
23
24
25
26
27
28
29
30
31
32
33

55
Supplemental Methods 1
Cell lines 2
The MNNG/HOS and 143B cell lines were purchased from the American Type Culture 3
Collection (ATCC) and were cultured according to the instructions provided by the ATCC. The 4
syngeneic human osteosarcoma cell lines ZOS and ZOSM, which were derived from primary 5
tumor and skip metastases in the same patient, were established at our institution (1). The primary 6
cell cultures were grown in DMEM (Gibco) supplemented with 10% FBS (Gibco) at 37°C with 5% 7
CO2. 8
9
Reagents 10
5-Aza-2'-deoxycytidine (Sigma-Aldrich), S-adenosyl-L-methionine (Sigma-Aldrich), recombinant 11
human CXCL14 (R&D, #866-CX-025), human CXCL14 affinity-purified polyclonal antibody 12
(R&D, #AF866), normal rat IgG control (R&D, #6-001-A), and BAY 11-7085 (Selleck, 10 μM 13
stock in DMSO, #S2913). 14
15
Patients and tissue samples 16
The medical charts of the osteosarcoma patients included in this study were reviewed. All patients 17
received standard neoadjuvant chemotherapy that was followed by surgical resection and 18
postoperative chemotherapy. The primary osteosarcoma tissues were collected when surgical 19
resection of the primary tumor was performed, and metastatic tissues were obtained when 20
pulmonary metastasectomy was performed after the primary tumor was under control. The 21
formalin-fixed, paraffin-embedded surgical specimens were stored in the tissue bank of the 22
Department of Pathology. Fresh tumor specimens were snap-frozen in liquid nitrogen immediately 23
after surgical resection and stored at –80°C in our department. Osteosarcoma was confirmed 24
histopathologically, and only tumor samples that were composed of >80% tumor cells were used 25
for the real-time PCR study. Serum samples were obtained on the date of diagnosis before any 26
initial treatment. 27
28
Methylated DNA immunoprecipitation (MeDIP) assay 29
The MeDIP assay was performed as previously described with some modifications (2). Briefly, 30
genomic DNA extracted from ZOS and ZOSM cell lines was digested into 200–1000-bp 31
fragments using MseI. The digested fragments were then denatured and incubated with a 32
monoclonal antibody against 5-methylcytidine. Subsequently, MeDIP samples were amplified and 33
labeled with Cy5 (IP DNA) or Cy3 (Input DNA) dyes. A hybridization system (NimbleGen) was 34
then used to co-hybridize the labeled samples to the Human DNA Methylation 3×720K CpG 35
Island Plus RefSeq Promoter Array, which contains 50-75 monomer oligonucleotide probes 36
covering the region from −2440 bp to +610 bp relative to the potential transcription start sites for 37
22532 annotated human genes. The arrays were then washed and scanned with the MS200 scanner 38
(NimbleGen). Data were collected and normalized for comparisons of fold enrichment. The 39
methylation level was found to be significantly different between ZOS and ZOSM cells; a 1.4-fold 40
change was considered to be the selection threshold. The data set has been uploaded to the Gene 41
Expression Omnibus under accession number GSE55961. 42
43
Gene expression profiling 44

56
Microarray analysis was performed using the Affymetrix Human Genome U133 Plus 2.0 Array 1
(ZOS vs. ZOSM) and NimbleGen Human Gene Expression 12×135K Array (143B-shCtrl vs. 2
143B-shIRX1), as described previously (3, 4). The selection threshold used to determine 3
significantly differentially expressed genes was a false discovery rate (FDR) <5% and a fold 4
change >2.0 in the SAM output result. The microarray data sets have been submitted to the Gene 5
Expression Omnibus with the accession numbers GSE55957 and GSE55958. 6
7
Real-time RT-PCR 8
Total RNA from osteosarcoma cell lines and tissue samples was purified using the RNeasy Mini 9
Kit (Qiagen), and first strand cDNA was synthesized using the First Strand cDNA Synthesis Kit 10
(Fermentas) according to the manufacturer’s instructions. Real-time RT-PCR was carried out using 11
SYBR® qPCR Mix (Toyobo) according to the manufacturer’s protocol with a Bio-Rad iQ5 12
Real-Time PCR Detection System. The sequences of the primers used for PCR are shown in 13
Supplemental Table 6. The experiments were performed in triplicate. 14
15
Western blot analysis 16
Western blot analysis was performed using standard procedures. Briefly, 60 μg of protein extracted 17
from cultured cells was separated by 12-15% SDS-PAGE and transferred to PVDF membranes. 18
The membranes were blocked in 5% nonfat dry milk and then incubated with the antibodies as 19
follow: IRX1 (1:500, Bioworld, #BS2291), CXCL14 (1:1000, Abcam, #ab46010), NF-κB p65 20
(1:5000, Abcam, #ab32536), IκBα (1:5000, Abcam, #ab32518), MMP9 (1:500, Bioworld, 21
#BS6893), c-FLIP (1:1000, Abcam, #ab167409), H2AX (1:1000, Abcam, #ab124781), GAPDH 22
(1:5000, Bioworld, #AP0066). Subsequently, the membranes were incubated with horseradish 23
peroxidase-conjugated secondary antibody for 1 hour at room temperature. The protein bands 24
were visualized with the enhanced chemiluminescence detection system using a GE ImageQuant 25
LAS4000 mini. 26
27
5-Aza-2'-deoxycytidine (DAC) and S-adenosyl-L-methionine (AdoMet) treatment 28
Cultured cells were treated with varying concentrations of DAC (0.5, 1, 2, 5, or 10 μM) or 29
AdoMet (50, 100, 200, or 500 μM) as previously described (5, 6). Briefly, cells were seeded at a 30
density of 3×10⁵ in 100-mm dishes with 10 ml of growth medium, cultured overnight, and treated 31
with different concentrations of freshly prepared DAC (Sigma-Aldrich) for 3 days without 32
changing the medium or treated with AdoMet (Sigma-Aldrich) for 6 days with the medium 33
changes every other day. The cells were harvested by trypsinization for RNA, DNA and protein 34
extraction. 35
36
Bisulfite sequencing PCR (BSP) and methylation-specific PCR (MSP) 37
Bisulfite sequencing PCR and methylation-specific PCR were performed to analyze the 38
methylation status of the IRX1 promoter as previously described (7, 8). Briefly, genomic DNA 39
was isolated from cultured cells using a DNeasy Blood & Tissue Kit (Qiagen), and the cell-free 40
DNA from serum samples was extracted using a QIAamp DNA Blood Mini Kit (Qiagen). The 41
isolated DNA was then bisulfite converted and purified using EpiTect Bisulfite Kits (Qiagen) 42
according to the manufacturer’s instructions. For BSP, PCR primers (Supplemental Table 6) were 43
designed to amplify the modified IRX1 promoter (-521 to -679). The amplified PCR products 44

57
were purified with a QIAquick Gel Extraction Kit (Qiagen) and cloned into the pMD19-T vector 1
(Takara) followed by sequencing analysis. 2
Methylation-specific PCR was performed with the EpiTect MSP kit (Qiagen) according to the 3
manufacturer’s instructions. The PCR primers are shown in Supplemental Table 6. The PCR 4
products were separated on a 2% agarose gel with DuRed and directly visualized under UV 5
illumination. Completely methylated and unmethylated DNA fragments (from the EpiTect PCR 6
control DNA set (Qiagen)) were used as positive and negative controls, respectively. 7
8
MassARRAY 9
Quantitative analysis of IRX1 promoter methylation (-520 to -680) was performed using the 10
MassARRAY Compact System (Sequenom) as described previously (9). Briefly, genomic DNA 11
was prepared from osteosarcoma tissues using the DNeasy Blood & Tissue Kit (Qiagen). The 12
DNA was then bisulfite converted and amplified by PCR. The primers for PCR amplification are 13
listed in Supplemental Table 6. After treatment with shrimp alkaline phosphatase, the PCR 14
products were transcribed in vitro, cleaved with RNase A and then subjected to MALDI-TOF-MS 15
(Sequenom). The results were analyzed using EpiTyper software v1.0 (Sequenom), and the 16
methylation level was calculated as the average values of the CpG units (units 1, 2, 4 and 6). 17
18
In vitro methylation 19
A 159-bp fragment of the IRX1 promoter region (-521 to -679) was obtained via whole gene 20
synthesis (BGI, Beijing, China) and subsequently methylated in vitro with SssI, HpaII and HhaI 21
methylases (New England Biolabs) according to the manufacturer’s instructions. SssI methylates 22
all cytosine residues within the 5'-CpG-3' sequence, HpaII methylates cytosine residues within 23
5'-CCGG-3', and HhaI methylates cytosine residues within 5'-GCGC-3'. Complete methylation 24
was confirmed by digestion with HhaI, HpaII, and McrBC (New England Biolabs). Methylated or 25
mock-methylated fragments were ligated into the pGL3-basic vector (Promega) for luciferase 26
reporter assays. 27
28
Lentiviral transduction studies 29
Lentivirus packing expression vectors (pLenti.neo-shIRX1/shCXCL14-eGFP and 30
pLV.EX3d.P/neo-EF1A>IRX1/CXCL14>IRES/eGFP) were obtained from Cyagen Biosciences 31
(Guangzhou, China). To generate the stable knockdown and overexpression lines, osteosarcoma 32
cells were transduced with the indicated lentiviruses (MOI=10~20). The transduction efficiency 33
was assayed by imaging with an inverted fluorescence microscope (Leica), and the stable clones 34
were selected with 1 mg/ml G418 (Sigma Aldrich). Real-time RT-PCR and immunoblotting for 35
IRX1 and CXCL14 were performed to determine the knockdown and overexpression efficiency. 36
The shRNA sequences are shown in Supplemental Table 6. 37
38
Transient transfection 39
Small interfering RNA (siRNA) targeted against CXCL14 was synthesized by GenePharma 40
(Suzhou, China). The target sequences are listed in Supplemental Table 6. Plasmids encoding 41
human CXCL14 were obtained from Cyagen Biosciences (Guangzhou, China). The cells were 42
transfected with targeting siRNA or expression plasmids using Lipofectamine 2000 (Invitrogen) 43
according to the manufacturer’s instructions. 44

58
Cell Counting Kit-8 assay (CCK8) 1
Cell suspensions (100 μl) were plated at a density of 2000 cells per well in 96-well plates. After 2
incubation for the indicated time periods (24 h, 48 h, 72 h and 96 h), 10 μl of CCK-8 solution 3
(Beyotime) was added to each well of the plate. The plate was incubated for an additional 4 h, and 4
the absorbance was measured at 450 nm using a SUNRISE Absorbance Reader (TECAN). The 5
experiments were performed in triplicate. 6
7
Wound healing assays 8
Cells were plated in 6-well plates (3 × 10⁵ cells/well). When the cells reached 90% confluence, a 9
scratch was made using a sterile 200-μl pipette tip, and the detached cells were removed by 10
washing with culture medium. Phase contrast images were obtained in the same field at 0 h, 24 h, 11
36 h and 48 h using an inverted microscope (Leica). The experiments were performed in triplicate. 12
13
Boyden chamber migration and invasion assays 14
Cell migration and invasion assays were performed using 24-well transwells (8.0-μm pore size) 15
with or without Matrigel coating (Becton Dickinson). In total, 2.0 × 10⁴ cultured cells in 0.2 ml of 16
serum-free DMEM were seeded in the upper chamber, and 0.6 ml of DMEM containing 10% fetal 17
bovine serum was added to the lower chamber. After 12 or 24 h of incubation, the cells remaining 18
in the upper chamber were removed with cotton swabs, and the filters were fixed with 4% 19
paraformaldehyde for 15 min followed by crystal violet staining and microscopic examination. 20
The migrating or invading cells in five random optical fields (× 100 magnification) from triplicate 21
filters were counted and averaged. 22
23
Anoikis assay 24
To prevent cell adhesion, cells were seeded at a density of 2 × 10⁵ cells per well in 6-well 25
ultra-low-attachment culture plates (Corning). After incubation for 48 h, the cells were harvested 26
and stained with the Annexin V Apoptosis Detection Kit APC (eBioscience). The apoptosis rate 27
was determined by fluorescence-activated cell sorting (FACS) analysis. The experiments were 28
performed in triplicate. 29
30
Luciferase reporter assays and chromatin immunoprecipitation (ChIP) 31
For luciferase reporter assays, cells were seeded at a density of 4 × 10⁴ cells/well in 24-well 32
plates and co-transfected with pGL3-basic, the methylated plasmid pGL3-IRX1 (-521 to -679) or 33
pGL3-CXCL14 (–2000 to +515), a NF-κB p65 luciferase reporter (Beyotime) or the pRL-TK 34
plasmid (Promega) using Lipofectamine 2000 (Invitrogen). After 48 hours, the cells were 35
harvested in Passive Lysis Buffer (Promega). Luciferase activity was measured using the Dual 36
Luciferase Reporter Assay System (Promega) with a GloMax Luminometer (Promega). The 37
results were quantified as the ratio of firefly luciferase/Renilla luciferase activity. 38
ChIP was performed using the PierceTM
Agarose ChIP Kit (Thermo) as described by the 39
manufacturer. Briefly, 143B cells in a 10-cm dish were cross-linked with 1% formaldehyde, and 40
fixation was terminated with a glycine solution. The cells were harvested and incubated in lysis 41
buffer with micrococcal nuclease for digestion. The samples were immunoprecipitated overnight 42
at 4°C with 5 μg anti-IRX1 antibody (Abnova, #H00079192-A01) and 2 μg of normal rabbit IgG 43
(R&D, #6-001-A). Protein A/G Plus Agarose was added and incubated at 4°C for 1 hour. The 44
59
immune complexes were then washed and eluted. DNA was recovered and purified using the 1
DNA Clean-Up Column supplied in the ChIP Kit. The immunoprecipitated DNA was analyzed by 2
real-time RT-PCR. BDKRB2, which has been demonstrated to be a direct target of IRX1 (10), was 3
used as a positive control; HEBP1, whose promoter has no potential IRX1 binding sites, was used 4
as a negative control. The primers are shown in Supplemental Table 6. 5
6
Enzyme-linked immunosorbent assay (ELISA) 7
The levels of CXCL14 in the cell culture supernatants were determined using the Human 8
CXCL14/BRAK DuoSet (R&D, #DY866) according to the manufacturer’s recommendations. 9
Briefly, 100 μl aliquots of the samples or standards (recombinant human CXCL14, R&D) were 10
incubated for 2 hours at room temperature in 96-well plates (Corning) precoated with a capture 11
antibody. After washing three times with phosphate-buffered saline containing 0.05% Tween-20, 12
biotinylated mouse anti-human CXCL14 (R&D) was added to each well and incubated for 2 hours 13
at room temperature. After three washes, streptavidin conjugated to horseradish peroxidase was 14
added, followed by incubation with the substrate solution for 20 minutes. The optical density of 15
each well was determined immediately after adding the stop solution using a microplate reader 16
(TECAN) at 450 nm with a wavelength correction of 540 nm. The concentration of CXCL14 in 17
the samples was estimated by referring to the standard curve using Sigmaplot 11.0 software 18
(Systat Software Inc., San Jose, CA). 19
20
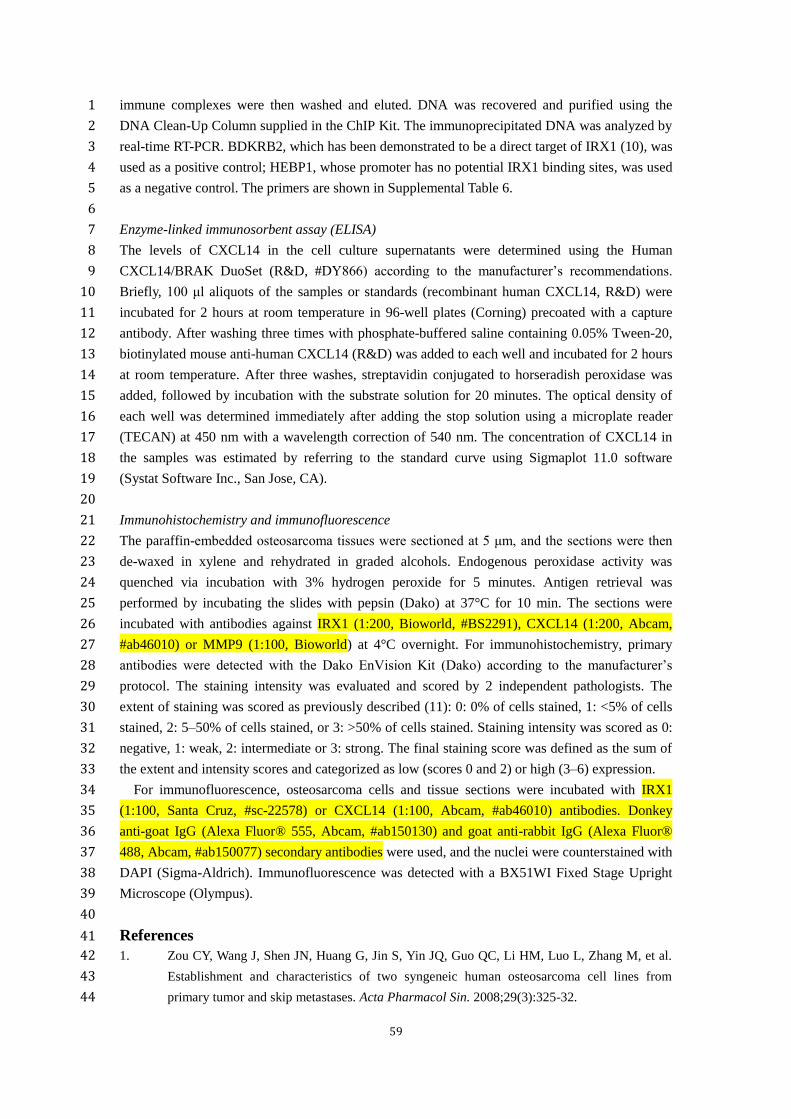
Immunohistochemistry and immunofluorescence 21
The paraffin-embedded osteosarcoma tissues were sectioned at 5 μm, and the sections were then 22
de-waxed in xylene and rehydrated in graded alcohols. Endogenous peroxidase activity was 23
quenched via incubation with 3% hydrogen peroxide for 5 minutes. Antigen retrieval was 24
performed by incubating the slides with pepsin (Dako) at 37°C for 10 min. The sections were 25
incubated with antibodies against IRX1 (1:200, Bioworld, #BS2291), CXCL14 (1:200, Abcam, 26
#ab46010) or MMP9 (1:100, Bioworld) at 4°C overnight. For immunohistochemistry, primary 27
antibodies were detected with the Dako EnVision Kit (Dako) according to the manufacturer’s 28
protocol. The staining intensity was evaluated and scored by 2 independent pathologists. The 29
extent of staining was scored as previously described (11): 0: 0% of cells stained, 1: <5% of cells 30
stained, 2: 5–50% of cells stained, or 3: >50% of cells stained. Staining intensity was scored as 0: 31
negative, 1: weak, 2: intermediate or 3: strong. The final staining score was defined as the sum of 32
the extent and intensity scores and categorized as low (scores 0 and 2) or high (3–6) expression. 33
For immunofluorescence, osteosarcoma cells and tissue sections were incubated with IRX1 34
(1:100, Santa Cruz, #sc-22578) or CXCL14 (1:100, Abcam, #ab46010) antibodies. Donkey 35
anti-goat IgG (Alexa Fluor® 555, Abcam, #ab150130) and goat anti-rabbit IgG (Alexa Fluor® 36
488, Abcam, #ab150077) secondary antibodies were used, and the nuclei were counterstained with 37
DAPI (Sigma-Aldrich). Immunofluorescence was detected with a BX51WI Fixed Stage Upright 38
Microscope (Olympus). 39
40
References 41
1. Zou CY, Wang J, Shen JN, Huang G, Jin S, Yin JQ, Guo QC, Li HM, Luo L, Zhang M, et al. 42
Establishment and characteristics of two syngeneic human osteosarcoma cell lines from 43
primary tumor and skip metastases. Acta Pharmacol Sin. 2008;29(3):325-32. 44

60
2. Weng YI, Huang TH, and Yan PS. Methylated DNA immunoprecipitation and 1
microarray-based analysis: detection of DNA methylation in breast cancer cell lines. Methods 2
Mol Biol. 2009;590:165-76. 3
3. Bauer M, Su G, Casper C, He R, Rehrauer W, and Friedl A. Heterogeneity of gene expression 4
in stromal fibroblasts of human breast carcinomas and normal breast. Oncogene. 5
2010;29(12):1732-40. 6
4. Xu PB, Lou JS, Ren Y, Miao CH, and Deng XM. Gene expression profiling reveals the 7
defining features of monocytes from septic patients with compensatory anti-inflammatory 8
response syndrome. J Infect. 2012;65(5):380-91. 9
5. Al-Romaih K, Somers GR, Bayani J, Hughes S, Prasad M, Cutz J-C, Xue H, Zielenska M, 10
Wang Y, and Squire JA. Modulation by decitabine of gene expression and growth of 11
osteosarcoma U2OS cells in vitro and in xenografts: Identification of apoptotic genes as 12
targets for demethylation. Cancer Cell Int. 2007;7(1):14. 13
6. Pakneshan P, Szyf M, Farias-Eisner R, and Rabbani SA. Reversal of the hypomethylation 14
status of urokinase (uPA) promoter blocks breast cancer growth and metastasis. J Biol Chem. 15
2004;279(30):31735-44. 16
7. Wu H, Chen Y, Liang J, Shi B, Wu G, Zhang Y, Wang D, Li R, Yi X, Zhang H, et al. 17
Hypomethylation-linked activation of PAX2 mediates tamoxifen-stimulated endometrial 18
carcinogenesis. Nature. 2005;438(7070):981-7. 19
8. Nakayama H, Hibi K, Takase T, Yamazaki T, Kasai Y, Ito K, Akiyama S, and Nakao A. 20
Molecular detection of p16 promoter methylation in the serum of recurrent colorectal cancer 21
patients. Int J Cancer. 2003;105(4):491-3. 22
9. Ehrich M, Nelson MR, Stanssens P, Zabeau M, Liloglou T, Xinarianos G, Cantor CR, Field JK, 23
and van den Boom D. Quantitative high-throughput analysis of DNA methylation patterns by 24
base-specific cleavage and mass spectrometry. Proc Natl Acad Sci U S A. 25
2005;102(44):15785-90. 26
10. Jiang J, Liu W, Guo X, Zhang R, Zhi Q, Ji J, Zhang J, Chen X, Li J, Zhang J, et al. IRX1 27
influences peritoneal spreading and metastasis via inhibiting BDKRB2-dependent 28
neovascularization on gastric cancer. Oncogene. 2011;30(44):4498-508. 29
11. Zhao Z, Wu MS, Zou C, Tang Q, Lu J, Liu D, Wu Y, Yin J, Xie X, Shen J, et al. 30
Downregulation of MCT1 inhibits tumor growth, metastasis and enhances chemotherapeutic 31
efficacy in osteosarcoma through regulation of the NF-kappaB pathway. Cancer Lett. 32
2014;342(1):150-8. 33
34
35
36
37
38
39