supplemental evaluation report: 2003-04 survey …€¦ · project co-seed (community-based school...
TRANSCRIPT

Project CO-SEED (Community-based School Environmental Education) Supplemental Evaluation Report: 2003-04 Survey Results
Young Achievers
Prepared for: CO-SEED Young Achievers Dudley Street Neighborhood Initiative
Prepared by: Michael Duffin, Rob Beranek, & PEER Associates
May 15, 2005
CO-SEED is part of the Place-based Education Evaluation Collaborative (PEEC), a unique partnership of organizations whose aim is to strengthen and deepen the practice and evaluation
of place-based education initiatives. PEEC programs (and organizations) include the CO-SEED Project (Antioch New England
Institute); the Community Mapping Program (the Orton Family Foundation, and the Vermont Institute of Natural Science); the Sustainable Schools Project (Shelburne Farms, and the Vermont Education for Sustainability Project); and A Forest for Every Classroom Project
(Shelburne Farms, The Northeast Natural Resource Center of the National Wildlife Federation, The Marsh Billings Rockefeller National Historical Park, The Conservation Study
Institute, and Green Mountain National Forest). In addition, the Upper Valley Community Foundation provides funding and support for
several of these programs through its Wellborn Ecology Fund, as well as financial, administrative and staff support for collaborative evaluation and research efforts.
www.PEECworks.org
ACKNOWLEDGEMENTS
We wish to extend a particular thanks to the individual educators, students, and community members who so graciously participated in this evaluation. Michael Duffin’s work on this evaluation report was partially funded through a fellowship from the National Network for Environmental Management Studies (NNEMS) program of the U.S. Environmental Protection Agency. Thank you.
NOTE
This report was authored by PEER Associates, Inc. A more complete description of the evaluation personnel involved in this project can be found in the Introduction of this report. Evaluation Co-Directors for PEER Associates Amy Powers and Michael Duffin can be contacted at [email protected] or [email protected].

Young Achievers Survey Results, 2003-04 CO-SEED Evaluation page 1
Introduction Young Achievers became a CO-SEED site in the fall of 2003. As part of the 2003-04 CO-SEED evaluation, surveys were administered to students, educators, and community members to establish baseline data on thoughts and attitudes about school and community activities. This report presents analysis and complete data for the subset of Young Achievers data only. The intent is to support reflection on the program by CO-SEED, Young Achievers, and Dudley Street Neighborhood Initiative staff, hopefully resulting in refinement of program implementation. For presentation and analysis of 2003-04 survey results aggregated across all CO-SEED sites, for more detail about the survey design and administration process, and for discussion of qualitative Young Achievers data, please refer to the 2003-04 Project CO-SEED Final Report, available at http://www.peecworks.org/PEEC/PEEC_Reports/S001F605E. This report was produced by PEER Associates under the direction of Principal Investigator Michael Duffin and with technical guidance from Senior Research Associate Dr. George Tremblay. Much of the data management, analysis, and formatting of this work was done by Research Associate Rob Beranek. Rob’s work on this project was also completed in partial fulfillment of a Masters in Environmental Education from Antioch New England Graduate School.
Interpreting These Results The results from each of three groups of Young Achievers survey respondents (i.e. 28 educators, 92 fourth through eighth grade students, and 25 community members) are presented separately in this report. For all surveys, respondents were asked how much they agreed with various statements or else how often they performed or witnessed certain activities. All items (i.e. individual survey questions) were standardized with a four point response scale (Figure 1). A complete summary of all the survey results at the individual item level is provided in the Appendix of this report. Program staff are encouraged to explore this item level data further via our web-based survey administration and data access system. In order to make the analysis more coherent and to reduce certain types of statistical error, the discussion below combines individual survey items into groups of items that address similar ideas. “Indices” are groups of one to six different survey items that each address a different aspect of a fairly narrow concept. Indices are combined into “modules” which are groups of two to six indices that all relate to a single broad concept. In some instances, several modules were grouped together to form an “overall module.” Results are presented for all indices and modules for which data exists, and discussion highlights the few that were most unique, typical, or otherwise interesting.

Young Achievers Survey Results, 2003-04 CO-SEED Evaluation page 2
Figure 1. Interval Points, Measurements, and Modules
Interval Point Measure of Agreement Measure of Frequency
1 Strongly Disagree Twice per year or less 2 Tend to Disagree Three to six times per year 3 Tend to Agree About once a month 4 Strongly Agree Once a week or more
Modules Measured
C Student engagement: civic & learning
P Improving educator craft W Reports of whole school
improvement X Reports of student
performance Y Perceptions of community
improvement
L Use of local resources N Student attachment
to place
The surveys used for CO-SEED evaluation during 2003-04 were part of a larger cross-program investigation by the Place-based Education Evaluation Collaborative (PEEC). Over the course of the year, the content and format of CO-SEED surveys were integrated with those of other PEEC programs, eventually resulting in a coherent system of survey instruments that can be administered and analyzed across many different place-based education contexts. As it turns out, the surveys filled out by Young Achievers educators represent “older” versions because they were administered at the beginning of the school year, whereas the surveys filled out by Young Achievers students and community members represent “newer” versions because they were administered near the end of the school year. All 2003-04 CO-SEED evaluation reports present the survey analysis in terms of the newer system of items, indices, and modules in order to provide more consistent comparison to future results. Items from older surveys that do not map cleanly onto newer items, indices, or modules are not presented in this report unless they yielded results of particular interest. Old and new versions of actual survey instruments, as well as a template for mapping older versions onto the new system, can be found in the 2004-04 Project CO-SEED Final Report.

Young Achievers Survey Results, 2003-04 CO-SEED Evaluation page 3
Results and Discussion of Educator Surveys Young Achievers educator’s results (Table 1) provide a solid foundation for tracking future success on several CO-SEED-related outcomes. Educators reported a moderate frequency of practicing place-based education, and tended to believe that increased place-based practices could positively influence their students’ performance in multiple realms. The surveys were administered to educators in late August 2003, as Project CO-SEED was beginning at Young Achievers. Thus, all educator results presented here can be clearly interpreted as baseline levels and should not reflect effects of CO-SEED.
Table 1. Summary of Data for 2003-2004 CO-SEED Young Achievers Educator/Staff Surveys
Variable (items included)
# of items incl.
N _ X SD
Overall educator practice (overall module=p1,p6,l1,l2,l3,l4,l5) 15 28 2.5 .53
Use of local resources (L module = l1,l2,l3,l4,l5)
13 28 2.5 .53
Use of local places (llp index = l1,l4) 6 27 2.2 .62 Use of local people (llpeop index = l2,l5) 6 27 2.6 .50
Service learning (lsl index = l3) 1 23 2.5 .59
Improving educator craft (P module = p1,p6)
2 5 2.4 1.1
Meeting curricular goals (pcg index = p1) 1 3 1.7 .58 Educator engagement/growth (pteg index =
p6)1 5 2.6 1.1
Reports of student performance (X module = x1,x2,x3,x4,x6,x7)
10 27 2.8 .40
Student engagement in learning (xsel index=x1) 1 25 2.6 .50 Student academic achievement (xsaa index=x2) 2 27 2.8 .43 Student civic engagement (xsce index = x3,x7) 3 23 2.7 .66
Student stewardship behavior (xssb index = x4) 1 22 3.5 .74 Satisfied with quality of school (item = x6) 3 24 2.2 .49
NOTE: Table row shading represents the level of data reduction, i.e. modules are light gray, overall module is darker gray. N = sample size; X = mean;
SD = standard deviation Because of the unique consequences of mapping older survey versions onto the newer versions of analysis categories, the Overall educator practice module is almost entirely determined by items about Use of local resources. The mean (i.e. average) for Use of local resources ( X = 2.5) suggests that three to six times per year may be a typical baseline frequency for place-based activities at Young Achievers before CO-SEED. This is an area to watch for increased frequency in subsequent years. The Use of local places and Use of local people indices within this module suggest that local people ( X = 2.6) were utilized more often than local places ( X = 2.2).

Young Achievers Survey Results, 2003-04 CO-SEED Evaluation page 4
At first glance, educators reported moderately ( X = 2.4) for the Improving educator craft module. This module is designed to measure if educators believe CO-SEED is aiding in meeting curricular goals and engaging educators in professional/ personal growth. For instance, item p1 ( X = 1.7) reads “As a result of CO-SEED involvement, I am more able to align my teaching to state frameworks,” and item p6 ( X = 2.6) reads “I have gained new content understanding and/or new skills as a result of CO-SEED involvement.” What the means do not show is that most educators felt it more appropriate to report “Not Sure” to these items. Only three educators answered item p1 and five answered item p6 out of the twenty-eight educators who responded to the survey. It makes common sense that almost all educators thought their minimal exposure to CO-SEED at the time of filling out the survey was insufficient to answer these items. Figure 2 could be interpreted to suggest that most Young Achiever educators have moderate baseline levels of agreement with the idea that place-based education could have a positive effect on student outcomes. All the results in this section refer to adult perceptions of student characteristics as opposed to direct measures of student performance itself. The Reports of student performance module ( X = 2.8) combines ten items about student academic achievement, student engagement in learning, student civic engagement, and student environmental stewardship behavior. Within this module, educators agreed most strongly with item x4 ( X = 3.5), which read “There are many things my students can do to protect the local environment, including the school grounds.” Also within this module, educators tended to slightly disagree with item x6 ( X = 2.2), which had three items mapped onto it from the older version of the survey measuring educator’s satisfaction with the quality of the school. The lowest reported mean of the three older items ( X = 1.7, not shown in Table 1) mapped onto item x6 read “I am satisfied with our students’ performance on state assessment tests.” Taken together, these results suggest that CO-SEED may be well-positioned to make a positive contribution to multiple aspects of student performance at Young Achievers.
From the Young Achievers CO-SEED educator surveys, 2003-04
Figure 2. Reports of student performance (module)
1.0 2.0 3.0 4.0
Reports of student performance module consistsof ten items measuring adult perceptions ofstudent engagement in learning, academic
achievement, civic engagement, stewardshipbehavior, and satisfaction with school.
Scale: Strongly disagree = 1, to strongly agree = 4
0
4
8
12
Freq
uenc
yS
cale
: Num
ber o
f edu
cato
rsre
spon
ding
at e
ach
leve
l of a
gree
men
t

Young Achievers Survey Results, 2003-04 CO-SEED Evaluation page 5
Results and Discussion of Student Surveys The Young Achievers students’ survey modules (Table 2) covered three main areas. Students tended to agree with statements about their own engagement (with their community and with learning). They also reported experiencing a minor attachment to place. Student reports of use of local resources are suggestive (but not definitive) of early positive effects of CO-SEED on this outcome. The surveys were administered to students in early June 2004, eight months after CO-SEED began at Young Achievers. Therefore, the results do not strictly reflect baseline student responses, but rather are more likely to illustrate very early effects of CO-SEED.
Table 2. Summary of Data for 2003-2004 CO-SEED Young Achievers Student Surveys
Variable (items included)
# of items incl.
N _ X SD
Use of local resources (L module = l1,l2,l4,l5)
4 85 2.9 .74
Use of local places (llp index = l1,l4) 2 79 2.7 1.0 Use of local people (llpeop index = l2,l5) 2 82 3.1 .79
Student engagement: civic & learning (C module=c1,c2.c3,c4,c5,c6,c7,c8,c9,c10,c11,c12,c13,c14,c15)
15 91 2.9 .49
Connection to community (ccc index = c1,c2,c7) 3 90 3.0 .67 Self-efficacy (cse index = c5,c8) 2 88 2.9 .75
Social responsibility (csr index = c3,c4,c6,c9) 4 91 3.3 .61 Enthusiasm for learning (cel index=c10,c11,c12,c15) 4 91 2.7 .65
Stewardship behavior (csb index = c13,c14) 2 88 2.6 .91
Student attachment to place (N module=n1,n2,n3,n4,n5,n6,n7,n8,l1,l2,l4,l5,c1,c2,c7)
15 91 2.8 .54
Learning through local resources (nlr index=l1,l2,l4,l5) 4 85 2.9 .74 Time spent outdoors (nto index = n1,n2,n6) 3 84 2.5 .78
Understanding of place (nup index = n3,n5,n7) 3 81 2.7 .88 Overall affect about place (noa index=n4,n8,c1,c2,c7) 5 91 2.9 .68
Items not included in student indices or modules — — — — CO-SEED helps me get better grades (item=x10) 1 60 2.7 1.1
Satisfied with quality of school (item = x6) 1 84 3.0 .91 School is environmentally healthy (item = w2) 1 81 2.7 .91 Community is environmentally healthy (item=y4) 1 78 2.8 .83
NOTE: Table row shading loosely represents the level of data reduction, i.e. modules are light gray. N = sample size; X = mean; SD = standard deviation

Young Achievers Survey Results, 2003-04 CO-SEED Evaluation page 6
While precise mathematical comparison between student and educator data is not technically possible in this situation, students did report noticeably higher frequency of educators’ Use of local resources ( X = 2.9) than educators had earlier in the 2003-04 academic year ( X = 2.5). Students reported higher for both indices in this module as well. Students’ Use of local places and Use of local people ( X = 2.7 & X = 3.1, respectively) are higher than what educators had reported ( X = 2.2 & X = 2.6, respectively). The student results may show early effects of CO-SEED, but will be the most meaningful when they are considered in the context of subsequent CO-SEED student survey administrations. As CO-SEED continues at Young Achievers, watch the Use of local resources module as an indicator of place-based education practices. Student engagement: civic & learning (Figure 3) suggested that students were feeling generally engaged ( X = 2.9) toward the end of CO-SEED’s first year at Young Achievers. The Young Achievers data by itself is not sufficient to definitively attribute this effect to CO-SEED, but the 2003-04 CO-SEED Final Evaluation Report
does show statistical evidence that students do tend to report higher engagement if their educators have reported more participation in CO-SEED-related activities. The five indices and fifteen items of this module measured students’ attitudes towards their community, the community members, their role in the community, and learning. The Social responsibility index showed the highest mean ( X = 3.3, see Figure 4), and the Connection to community and index was also rather high ( X =3.0). Stewardship behavior showed the lowest mean ( X = 2.6) in this module. Its items measured if students had recently done something to take care of their neighborhood or community.
Figure 3. Student engagement: civic & learning (module)From the Young Achievers CO-SEED student surveys, 2003-04
1.0 2.0 3.0 4.0
Student engagement: civic & learning moduleconsists of five indices that measure connectionto community, self-efficacy, social responsibility,
enthusiasm for learning, and stewardship behavior.Scale: Strongly disagree = 1, to strongly agree = 4
0
10
20
30
Freq
uenc
yS
cale
: Num
ber o
f stu
dent
sre
spon
ding
to e
ach
leve
l of a
gree
men
t
Figure 4. Student social responsibility (index)From Young Achievers CO-SEED student surveys, 2003-04
1.0 2.0 3.0 4.0
Social responsibility index consistsof four items that measure students
attitudes on helping others.Scale: Strongly disagree = 1, to strongly agree = 4
0
10
20
30
Freq
uenc
yS
cale
: Num
ber o
f stu
dent
sre
spon
ding
at e
ach
leve
l of a
gree
men
t

Young Achievers Survey Results, 2003-04 CO-SEED Evaluation page 7
1 2 3 4
Satisfied with quality of school is themeasure of item x6.
Scale: Strongly disagree = 1, to strongly agree = 4
0
10
20
30
Freq
uenc
yS
cale
: Num
ber o
f stu
dent
sre
spon
ding
at e
ach
leve
l of a
gree
men
t
Figure 5. Satisfied with quality of school (item)From Young Achievers CO-SEED student surveys, 2003-04
As CO-SEED continues at Young Achievers, the Student attachment to place module and its four indices will also be measures to watch for potential increases. For this current survey administration, students’ Overall affect about place and Learning through local resources were the highest of the indices ( X = 2.9). As their dose of CO-SEED and place-based education increases, the goal is that students would report higher values for the Time spent outdoors and Understanding of place indices. In Table 2 above, four items are reported by themselves, not folded into indices or modules. The highest of these items, item x6 ( X = 3.0, see Figure 5), saw students reporting being Satisfied with the quality of school. This item read “My school is good at academics (literacy, math, science, social studies).” Item x6 does not, however, carry as much statistical weight as an index or module because it is the measure of only a single item and there is an increased chance of statistical error. Although precise mathematical comparison between student and educator data is not technically possible, students’ satisfaction with the quality of school was noticeably higher than what the educators reported ( X = 2.2).

Young Achievers Survey Results, 2003-04 CO-SEED Evaluation page 8
Results and Discussion of Community Member Surveys The community member results (Table 3) suggest satisfaction with the quality of Young Achievers student performance and school improvement. The results also show fairly positive perceptions of the community and the use of local resources at Young Achievers. The surveys were administered to community members in June and July of 2004, nine months after Project CO-SEED began at Young Achievers. Therefore, the results do not strictly reflect baseline community member responses, but rather are more likely to illustrate very early effects of CO-SEED.
Table 3. Summary of Data for 2003-2004 CO-SEED Young Achievers Community Member Surveys
Variable (items included)
#of items incl.
N _ X SD
Use of local resources (L module = l1,l2,l3,l4,l5,l6)
6 22 3.1 .68
Use of local places (llp index = l1,l4) 2 20 3.2 .63 Use of local people (llpeop index = l2,l5) 2 21 3.2 .72
Service learning (lsl index = l3,l6) 2 16 2.6 1.0
Reports of student performance (X module = x1,x2,x3,x4,x5,x6,x7x8,,x9,x10,x11,x12)
12 24 2.9 .38
Student engagement in learning (xsel index=x1,x5,x12) 3 24 3.3 .47 Student academic achievement (xsaa index=x2,x10,x11) 3 23 2.8 .71
Student civic engagement (xsce index = x3,x7) 2 23 3.0 .45 Student stewardship behavior (xssb index = x4,x8) 2 20 2.7 .80
Reports of whole school improvement (W module = w1,w2,w3,w4)
4 24 3.0 .45
School culture, people (wpeop index = w1,w3) 2 24 3.3 .53 Environmental quality (wenv index = w2,w4) 2 23 2.8 .78
Perceptions of community improvement (Y module = y3,y4,y5,y6,y7,y8,y9,y10)
8 25 3.0 .45
Community civic engagement (yce index = y3,y6) 2 24 3.1 .54 Community environmental quality (yeq index= y4,y7) 2 24 2.6 .63
Com. planning/decision process (ypdm index= y5,y8) 2 24 2.7 .64 General community quality (ygen index = y3,y4,y5) 3 25 2.9 .48 Program adds value to com.(ypav index=y6,y7,y8,y9) 4 25 2.8 .48
Personal efficacy/involvement in com. (item = y10) 1 21 3.1 .85 NOTE: Table row shading loosely represents the level of data reduction, i.e. modules
are light gray. N = sample size; X = mean; SD = standard deviation

Young Achievers Survey Results, 2003-04 CO-SEED Evaluation page 9
The community member survey at Young Achievers was mailed in pre-paid envelopes to several hundred parents from the Friends of Young Achievers mailing list. Since the response rate is relatively low (25 respondents returned surveys) by most survey research standards, the descriptive statistics reported in Table 3 cannot be considered representative of the Young Achievers community as a whole, and so should be interpreted with caution, mostly for exploratory or speculative purposes or to raise (as opposed to answer) questions. Given that caveat, the high means found in Table 3 (compared to the Young Achievers educator results, for example) may be due to the fact that community members sampled happen to be the more involved and/or supportive parents or to some other characteristic of the respondent sample. The Use of local resources module suggests that this sample of community members tends to believe ( X = 3.1) that students use local resources for learning. This establishes a relatively high baseline for future comparison. The highest indices of this module were Use of local places ( X = 3.2) and Use of local people ( X = 3.2). The lowest index of this module is Service learning ( X = 2.6). Although precise direct mathematical comparison is not possible between community member, educator, and student respondent groups, community members reported the highest frequency for both Use of local places and Use of local people. This might be marking an early effect of CO-SEED, but further investigation into community member perceptions would be required to make that assertion with confidence.
The Reports of student performance module ( X = 2.9) and its indices show moderately high satisfaction with students’ engagement and achievement. The highest reported indices were Student engagement in learning ( X = 3.3) and Student civic engagement ( X = 3.0). The Student engagement in learning index was designed to measure community members’ perceptions of student engagement in learning and CO-SEED’s ability to influence student engagement and is displayed in Figure 6.
Figure 6. Student engagement in learning (index)From Young Achievers CO-SEED community member surveys, 2003-04
1.0 2.0 3.0 4.0
Student engagement in learning index consistsof three items that measure perceptions of
student engagement in learning and CO-SEED'sablity to influence it.
Scale: Strongly disagree = 1, to strongly agree = 4
0
4
8
12
Freq
uenc
yS
cale
: Num
ber o
f com
mun
ity m
embe
rsre
spon
ding
at e
ach
leve
l of a
gree
men
t

Young Achievers Survey Results, 2003-04 CO-SEED Evaluation page 10
The Reports of whole school improvement module showed moderately high agreement ( X = 3.0). This module measures perceptions of the school’s sense of community, environmental health, and level of involvement in resource conservation. The School culture, people index ( X = 3.3) suggests community members believe Young Achievers has a strong sense of community and the educators share a common vision for education about the community and environment. The Perceptions of community improvement module ( X = 3.0) and its indices showed moderately high results. The Community civic engagement index and Personal efficacy/involvement in community item have the same means ( X = 3.1). These suggest an active community. Community members reported the lowest for Community environmental quality ( X = 2.6). If significant increases in this index were to occur over the several years of CO-SEED’s presence at Young Achievers, this would be powerfully suggestive of CO-SEED’s impact diffusing into longer term effects and harder to reach audiences. Given the caveat mentioned at the beginning of this section, it could well be that the most useful data emerging from community member surveys is their responses to the open-ended questions. An informal perusal of these responses shows that the most commonly appreciated element of Young Achievers is the school staff. This observation is supported by the School Culture, People index ( X = 3.3) in Table 3. Increased family involvement and funding were mentioned frequently as areas that need the most improvement. Six of the twenty-five respondents commented on having little to no knowledge of CO-SEED. The complete set of responses to open-ended questions is provided in the Appendix.

Young Achievers Survey Results, 2003-04 CO-SEED Evaluation page 11
Concluding Remarks There are two contexts within which all three sets of results (educator, student, and community members) should be considered. First, the results should be considered in terms of when surveys were administered. Educator results were from surveys administered as Project CO-SEED began at the Young Achievers. As such, they are results that should provide a good baseline for future comparison and should also show no to minimal effects of CO-SEED. Student and community member results, however, were calculated from surveys administered almost a whole school year after CO-SEED began, and thus may be indicators of very early effects of CO-SEED. The second context is how the group of people who filled out the surveys (the sample) compares to the larger group that we are trying to learn about (the population). Educator and student results were compiled from a nearly complete census of the total population. Community member results, contrastingly, were compiled from a relatively small portion of the total population of community members. This means that we need to be more careful about drawing conclusions from the community member survey results. Most importantly, there are appropriate and inappropriate ways to use these results. These descriptive survey results of a single site at the beginning of its work with CO-SEED should not be used to verify or disprove CO-SEED’s effects. Drawing conclusions about the effects of CO-SEED from survey data like this requires comparison to other sample groups, whether that be comparable groups from other schools, or these same Young Achievers groups after some time has passed. The correct use of these results is to search for areas in which the Young Achievers may be commended, for areas in which it can improve, and to stimulate questions and curiosity about what is really happening with CO-SEED at the Young Achievers site.
Young Achievers Survey Results, 2003-04 CO-SEED Evaluation page 12
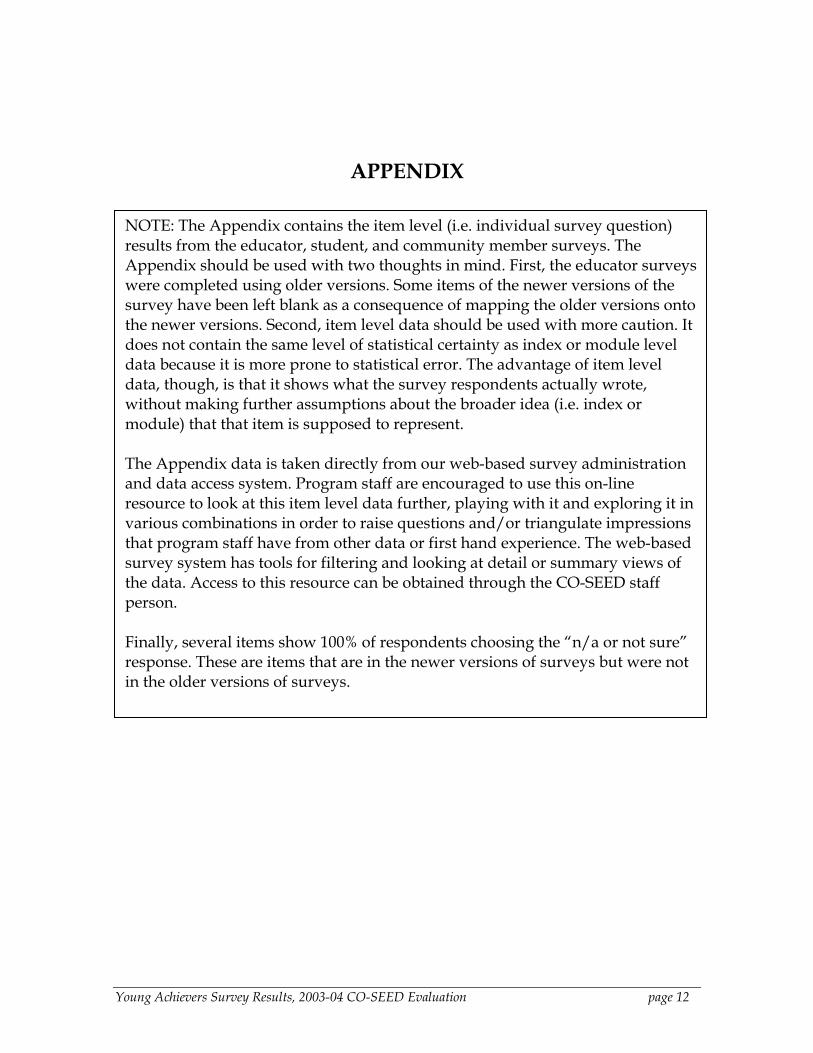
APPENDIX NOTE: The Appendix contains the item level (i.e. individual survey question)
results from the educator, student, and community member surveys. The Appendix should be used with two thoughts in mind. First, the educator surveys were completed using older versions. Some items of the newer versions of the survey have been left blank as a consequence of mapping the older versions onto the newer versions. Second, item level data should be used with more caution. It does not contain the same level of statistical certainty as index or module level data because it is more prone to statistical error. The advantage of item level data, though, is that it shows what the survey respondents actually wrote, without making further assumptions about the broader idea (i.e. index or module) that that item is supposed to represent. The Appendix data is taken directly from our web-based survey administration and data access system. Program staff are encouraged to use this on-line resource to look at this item level data further, playing with it and exploring it in various combinations in order to raise questions and/or triangulate impressions that program staff have from other data or first hand experience. The web-based survey system has tools for filtering and looking at detail or summary views of the data. Access to this resource can be obtained through the CO-SEED staff person. Finally, several items show 100% of respondents choosing the “n/a or not sure” response. These are items that are in the newer versions of surveys but were not in the older versions of surveys.

Young Achievers Survey Results, 2003-04 CO-SEED Evaluation page 13
Educator Survey Results (from Web-based Access System) How much do you disagree or agree? For each of the following items, please check only the ONE box that BEST matches your opinion. For items P.1-P.6, if you are not a classroom teacher, think of replacing the words “I” or “me” with “the teachers I work most closely with.”
Strongly
DISAGREE Tend to
Disagree Tend
to Agree
Strongly AGREE
Not sure or
N/A Response Average
P.1 CO-SEED helps me meet local,district and/or state learning standards. 4% (1) 7% (2) 0% (0) 0% (0) 89%
(25) 1.67 P.2 I collaborate with other teachers for
curriculum planning. 0% (0) 0% (0) 0% (0) 0% (0) 100% (28) 0.00
P.3 I feel energized and confident whileteaching about the local environment
and/or community. 0% (0) 0% (0) 0% (0) 0% (0) 100%
(28) 0.00
P.4 It is difficult to cover traditionalsubjects through CO-SEED. 0% (0) 0% (0) 0% (0) 0% (0) 100%
(28) 0.00 P.5 The curriculum in our school is
well-coordinated throughout the gradelevels.
0% (0) 0% (0) 0% (0) 0% (0) 100% (28) 0.00
P.6 CO-SEED has helped me become abetter teacher. 4% (1) 4% (1) 7% (2) 4% (1) 82%
(23) 2.60 Y.3 In general, people in our
community are actively involved intrying to make the community a better
place to live. 0% (0) 0% (0) 0% (0) 0% (0) 100%
(28) 0.00
Y.4 Our community is environmentallyhealthy. 0% (0) 0% (0) 0% (0) 0% (0) 100%
(28) 0.00 Y.5 The key decision makers in our
community have a good plan foraddressing the important needs in our
community. 0% (0) 4% (1) 21%
(6) 4% (1) 71% (20) 3.00
Y.6 CO-SEED gets people (young andold) more involved in solving real life
problems in our community. 0% (0) 0% (0) 0% (0) 0% (0) 100%
(28) 0.00
Y.7 The quality of the environment inour community is improving as a result
of CO-SEED. 0% (0) 0% (0) 0% (0) 0% (0) 100%
(28) 0.00
Y.8 Through CO-SEED, students arecollaborating with important decision
makers in our community. 0% (0) 0% (0) 0% (0) 0% (0) 100%
(28) 0.00
Y.9 CO-SEED may be nice, but itdoesn't address real needs in our
community. 0% (0) 0% (0) 0% (0) 0% (0) 100%
(28) 0.00
Y.10 I am (or plan to become) activelyinvolved in projects to improve the
social and/or environmental quality ofour community.
0% (0) 0% (0) 0% (0) 0% (0) 100% (28) 0.00
Total Respondents 28

Young Achievers Survey Results, 2003-04 CO-SEED Evaluation page 14
How much do you disagree or agree? For each of the following items, please check only the ONE box that BEST matches your opinion. Items X.1-X.12 refer to the group of students that you know best or work most closely with in your school or project
Strongly
DISAGREE Tend to
Disagree Tend to Agree
Strongly AGREE
Not sure or
N/A Response Average
X.1 Our students are enthusiasticabout learning. 0% (0) 36% (10) 54%
(15) 0% (0) 11% (3) 2.60 X.2 CO-SEED may be nice, but it
doesn't really improve studentacademic achievement.
50% (14) 36% (10) 0% (0) 4% (1) 11% (3) 1.52
X.3 Through their schoolwork,students gain a sense of responsibilityfor improving the local community and
environment. 0% (0) 14% (4) 43%
(12) 25% (7) 18% (5) 3.13
X.4 Through their schoolwork,students regularly take action to
protect and improve the environment. 0% (0) 11% (3) 21% (6) 46% (13) 21% (6) 3.45
X.5 Students prefer CO-SEED-styleactivities to more traditional-style
school activities. 0% (0) 0% (0) 0% (0) 0% (0) 100%
(28) 0.00
X.6 I am satisfied with the quality ofeducation in our school. 0% (0) 50% (14) 39%
(11) 0% (0) 11% (3) 2.44 X.7 Students have a strong
connection to the community whereour school is located.
18% (5) 21% (6) 29% (8) 4% (1) 29%
(8) 2.25
X.8 At home or outside of school,students regularly take action to
protect and improve the environment. 0% (0) 0% (0) 0% (0) 0% (0) 100%
(28) 0.00
X.9 Standardized test scores are anaccurate indicator of student academic
achievement. 0% (0) 0% (0) 0% (0) 0% (0) 100%
(28) 0.00
X.10 CO-SEED helps studentsincrease their scores on standardized
tests. 0% (0) 0% (0) 0% (0) 0% (0) 100%
(28) 0.00
X.11 CO-SEED is particularlybeneficial for students with learning
challenges. 0% (0) 0% (0) 0% (0) 0% (0) 100%
(28) 0.00
X.12 Students are self-directed intheir work on the CO-SEED project. 0% (0) 0% (0) 0% (0) 0% (0) 100%
(28) 0.00 W.1 Our school staff shares a
common vision for education aboutthe environment and community.
0% (0) 0% (0) 0% (0) 0% (0) 100% (28) 0.00
W.2 Our school is environmentallyhealthy. 0% (0) 0% (0) 0% (0) 0% (0) 100%
(28) 0.00 W.3 The sense of community within
our school is fairly weak or non-existent.
0% (0) 0% (0) 0% (0) 0% (0) 100% (28) 0.00
W.4 Our school is active in naturalresource conservation (water, energy,
soil, air, solid waste). 0% (0) 0% (0) 0% (0) 0% (0) 100%
(28) 0.00
Total Respondents 28

Young Achievers Survey Results, 2003-04 CO-SEED Evaluation page 15
How often do these things happen? For each of the following items, please check only the ONE box that BEST matches your opinion. Items L.1-L.6 refer to the classrooms that you know best or work most closely with
Two days
per year or less
Three to six days per year
About one day a month
One day a week or
more Not
sure or N/A
Response Average
L.1 The school building andgrounds (places outside of the
classrooms) are used as placesfor learning.
0% (0) 46% (13) 43% (12) 4% (1) 7% (2) 2.54
L.2 Parents and/or othercommunity members work
directly with students onschool-related projects.
0% (0) 7% (2) 39% (11) 50% (14) 4% (1) 3.44
L.3 As part of school, studentswork on real-world problems in
their community, schoolbuildings and/or school yard.
4% (1) 36% (10) 43% (12) 0% (0) 18% (5) 2.48
L.4 The content of classroomassignments and homework isdirectly connected to the local
natural and/or urbanenvironment.
7% (2) 32% (9) 29% (8) 7% (2) 25% (7) 2.48
L.5 Students learn about and/orinteract with local cultural
heritage, history and peoplethrough their schoolwork.
0% (0) 25% (7) 50% (14) 14% (4) 11% (3) 2.88
L.6 Students do communityvolunteering and/or service-learning work to satisfy their
educational requirements. 0% (0) 0% (0) 0% (0) 0% (0) 100%
(28) 0.00
Total Respondents 28 What subject do you teach:
Response Percent
Response Total
a. not a teacher/ doesn’t apply tome 17.9% 5
b. elementary classroom, integrated 32.1% 9
c. math 3.6% 1
d. science 0% 0
e. social studies/ history 0% 0
f. English 0% 0
g. foreign language 0% 0
h. physical education or health 0% 0
i. art or music technology 3.6% 1
k. After school or other non-formaleducation project leader 0% 0
j. other (please specify in thebox below) 42.9% 12
Total Respondents 28

Young Achievers Survey Results, 2003-04 CO-SEED Evaluation page 16
My role in the school is:
Response Percent
Response Total
a. specialist 14.3% 4
b. student aide or paraprofessional 10.7% 3
c. administrator 7.1% 2
d. classroom teacher: elementary 25% 7
e. classroom teacher: middle school 3.6% 1
f. classroom teacher: high school 0% 0
g. other (please specify in thebox below) 39.3% 11
Total Respondents 28 For how many school years have you been working in this school? (count the current school year as one)
Response Percent
Response Total
a. first year here 39.3% 11
b. 2-3 years 28.6% 8
c. 4-5 years 17.9% 5
d. 6 or more years 14.3% 4
Total Respondents 28

Young Achievers Survey Results, 2003-04 CO-SEED Evaluation page 17
Student Survey Results (from Web-based Access System) How much do you disagree or agree? For each of the following items, please check only the ONE box that BEST matches your opinion.
Strongly
DISAGREE Tend to
Disagree Tend to Agree
Strongly AGREE
Not sure or N/A
Response Average
W.2 Our school is environmentallyhealthy. 10% (9) 25% (23) 37%
(34) 16% (15) 12% (11) 2.68 Y.4 Our community is environmentally
healthy. 5% (5) 24% (22) 39% (36) 16% (15) 15% (14) 2.78
C.1 I feel like I am part of acommunity. 8% (7) 10% (9) 35%
(32) 32% (29) 16% (15) 3.08 C.2 I pay attention to news events
that affect the community. 14% (13) 21% (19) 29% (27) 24% (22) 12% (11) 2.72
C.3 Doing something that helps othersis important to me. 2% (2) 9% (8) 33% (30) 50%
(46) 7% (6) 3.40 C.4 I like to help other people, even if
it is hard work. 4% (4) 11% (10) 41% (38) 38% (35) 5% (5) 3.20
C.5 I know what I can do to help makethe community a better place. 7% (6) 18% (17) 40%
(37) 23% (21) 12% (11) 2.90 C.6 Helping other people is somethingeveryone should do, including myself. 3% (3) 8% (7) 27% (25) 58%
(53) 4% (4) 3.45 C.7 I know a lot of people in thecommunity, and they know me. 7% (6) 12% (11) 26% (24) 49%
(45) 7% (6) 3.26 C.8 I feel like I can make a difference
in the community. 4% (4) 21% (19) 43% (40) 18% (17) 13% (12) 2.88
C.9 I try to think of ways to help otherpeople. 4% (4) 15% (14) 38%
(35) 28% (26) 14% (13) 3.05 C.11 I like it when I get to be absent
on a regular school day. 29% (27) 25% (23) 12% (11) 22% (20) 12% (11) 2.30 C.12 On my own time, I often study or
read extra about the topics we’reworking on at school.
15% (14) 33% (30) 21% (19) 16% (15) 15% (14) 2.45
C.13 In the last two months I havedone something WITH MY
CLASSMATES to take care of myneighborhood or community.
17% (16) 27% (25) 17% (16) 23% (21) 15% (14) 2.54
C.14 In the last two months I havedone something ON MY OWN TIME to
take care of my neighborhood orcommunity.
17% (16) 26% (24) 26% (24) 22% (20) 9% (8) 2.57
C.15 I enjoy learning about theenvironment and my community. 8% (7) 28% (26) 28%
(26) 28% (26) 8% (7) 2.84
X.6 My school is good at academics(literacy, math, science, social
studies). 8% (7) 14% (13) 40%
(37) 29% (27) 9% (8) 3.00
X.10 Community mapping projectshelp me do better on tests and get
better grades. 12% (11) 13% (12) 23% (21) 17% (16) 35%
(32) 2.70
Total Respondents 92

Young Achievers Survey Results, 2003-04 CO-SEED Evaluation page 18
How often do these things happen? For each of the following items, please check only the ONE box that BEST matches you do or see the things described.
Two days per year or less
Three to six days per year
About one day a month
One day a week or
more Not sure or N/A
Response Average
L.1 The school building and grounds(places outside of the classrooms)
are used as places for learning. 11% (10) 17% (16) 20% (18) 25% (23) 27% (25) 2.81
L.2 Parents and/or other communitymembers work directly with students
on school-related projects. 5% (5) 20% (18) 29% (27) 18% (17) 27% (25) 2.84
L.4 Our classroom assignments andhomework are about nearby nature
and/or the city where we live. 15% (14) 18% (17) 17% (16) 17% (16) 32% (29) 2.54
L.5 In my school, we learn aboutlocal people, culture and history. 10% (9) 8% (7) 22% (20) 45% (41) 16% (15) 3.21
L.6 Students in our school docommunity volunteering and/or
service-learning work to satisfy oureducational requirements.
0% (0) 0% (0) 2% (2) 0% (0) 98% (90) 3.00
N.1 I visit parks, playgrounds,forests, creeks, ponds or other
natural areas BY MYSELF. 24% (22) 10% (9) 22% (20) 23% (21) 22% (20) 2.56
N.2 I visit parks, playgrounds,forests, creeks, ponds or other
natural areas WITH MY FRIENDS,FAMILY, OR AS PART OF A GROUP.
11% (10) 14% (13) 30% (28) 32% (29) 13% (12) 2.95
N.3 As I go about my day, I noticeplants and animals that I know a lot
about. 15% (14) 15% (14) 26% (24) 23% (21) 21% (19) 2.71
N.4 I think to myself that I am gladto live in this community. 15% (14) 15% (14) 23% (21) 24% (22) 23% (21) 2.72
N.5 I stop and think about howthings that I do are going to affectnature and the people around me.
15% (14) 10% (9) 28% (26) 18% (17) 28% (26) 2.70
N.6 I spend almost the whole dayinside buildings, cars or buses. 38% (35) 15% (14) 10% (9) 9% (8) 28% (26) 1.85
N.7 I share my opinions about whatshould be done to take care of the
community where I live. 12% (11) 23% (21) 14% (13) 16% (15) 35% (32) 2.53
N.8 I feel good about what thiscommunity will be like in the future
when I am grown up. 12% (11) 16% (15) 21% (19) 22% (20) 29% (27) 2.74
Total Respondents 92

Young Achievers Survey Results, 2003-04 CO-SEED Evaluation page 19
Response Percent
Response Total
a. I do not enjoy school and what I’mlearning is not important to me. 2.2% 2
b. Sometimes I learn useful things inschool, but usually what I learn is not
that important. 6.5% 6
c. I learn something important onmost days. I can usually see how
most of what I learn at school will beuseful in my life.
47.8% 44
d. Almost everything I learn is important
and useful. I enjoy learning at schoolevery day. 27.2% 25
e. I’m not sure 16.3% 15 Total Respondents 92
C.10 This is how I feel about school:
Your grade:
Response Percent
Response Total
4 22.8% 21 5 13% 12 6 27.2% 25 7 17.4% 16 8 18.5% 17 9 0% 0
10 0% 0 11 0% 0 12 1.1% 1
Total Respondents 92 Your gender:
Response Percent
Response Total
Male 59.8% 55
Female 40.2% 37 Total Respondents 92

Young Achievers Survey Results, 2003-04 CO-SEED Evaluation page 20
Community Member Survey Results (from Web-based Access System) How much do you disagree or agree? For each of the following items, please check only the ONE box that BEST matches your opinion.
Strongly
DISAGREE Tend to
Disagree Tend to Agree
Strongly AGREE
Not sure or
N/A Response Average
Y.3 In general, people in ourcommunity are actively involved in
trying to make the community abetter place to live.
4% (1) 4% (1) 52% (13) 36% (9) 4% (1) 3.25
Y.4 Our community isenvironmentally healthy. 12% (3) 32% (8) 40% (10) 12% (3) 4% (1) 2.54
Y.5 The key decision makers in ourcommunity have a good plan for
addressing the important needs inour community.
4% (1) 16% (4) 56% (14) 12% (3) 12% (3) 2.86
Y.6 CO-SEED gets people (youngand old) more involved in solving
real life problems in our community. 0% (0) 24% (6) 48% (12) 20% (5) 8% (2) 2.96
Y.7 The quality of the environmentin our community is improving as a
result of CO-SEED. 0% (0) 24% (6) 48% (12) 8% (2) 20% (5) 2.80
Y.8 Through CO-SEED, students arecollaborating with important
decision makers in our community. 8% (2) 32% (8) 40% (10) 8% (2) 12% (3) 2.55
Y.9 CO-SEED may be nice, but itdoesn't address real needs in our
community. 12% (3) 60% (15) 4% (1) 0% (0) 24% (6) 1.89
Y.10 I am (or plan to become)actively involved in projects to
improve the social and/orenvironmental quality of our
community. 4% (1) 12% (3) 36% (9) 32% (8) 16% (4) 3.14
Total Respondents 25

Young Achievers Survey Results, 2003-04 CO-SEED Evaluation page 21
How much do you disagree or agree? For each of the following items, please check only the
ONE box that BEST matches your opinion. Items X.1-X.12 refer to the group of students that you know best or work most closely with in your school or project
Strongly
DISAGREE Tend to
Disagree Tend
to Agree
Strongly AGREE
Not sure or
N/A Response Average
X.1 Our students are enthusiastic aboutlearning. 0% (0) 4% (1) 56%
(14) 36% (9) 4% (1) 3.33 X.2 CO-SEED may be nice, but it
doesn't really improve student academicachievement.
16% (4) 28% (7) 4% (1) 0% (0) 52% (13) 1.75
X.3 Through their schoolwork, studentsgain a sense of responsibility for
improving the local community andenvironment.
0% (0) 12% (3) 44% (11) 36% (9) 8% (2) 3.26
X.4 Through their schoolwork, studentsregularly take action to protect and
improve the environment. 4% (1) 12% (3) 36%
(9) 12% (3) 36% (9) 2.88
X.5 Students prefer CO-SEED-styleactivities to more traditional-style
school activities. 0% (0) 0% (0) 32%
(8) 8% (2) 60% (15) 3.20
X.6 I am satisfied with the quality ofeducation in our school. 4% (1) 28% (7) 40%
(10) 16% (4) 12% (3) 2.77 X.7 Students have a strong connectionto the community where our school is
located. 4% (1) 20% (5) 52%
(13) 4% (1) 20% (5) 2.70
X.8 At home or outside of school,students regularly take action to protect
and improve the environment. 12% (3) 24% (6) 20%
(5) 12% (3) 32% (8) 2.47
X.9 Standardized test scores are anaccurate indicator of student academic
achievement. 32% (8) 44% (11) 12%
(3) 8% (2) 4% (1) 1.96
X.10 CO-SEED helps students increasetheir scores on standardized tests. 0% (0) 4% (1) 8% (2) 0% (0) 88%
(22) 2.67 X.11 CO-SEED is particularly beneficialfor students with learning challenges. 4% (1) 0% (0) 16%
(4) 4% (1) 76% (19) 2.83
X.12 Students are self-directed in theirwork on the CO-SEED project. 4% (1) 4% (1) 16%
(4) 0% (0) 76% (19) 2.50
W.1 Our school staff shares a commonvision for education about theenvironment and community.
4% (1) 4% (1) 48% (12) 32% (8) 12% (3) 3.23
W.2 Our school is environmentallyhealthy. 4% (1) 12% (3) 52%
(13) 20% (5) 12% (3) 3.00 W.3 The sense of community within our
school is fairly weak or non-existent. 40% (10) 48% (12) 4% (1) 4% (1) 4% (1) 1.71 W.4 Our school is active in natural
resource conservation (water, energy,soil, air, solid waste).
12% (3) 12% (3) 40% (10) 8% (2) 28% (7) 2.61
Total Respondents 25
Young Achievers Survey Results, 2003-04 CO-SEED Evaluation page 22
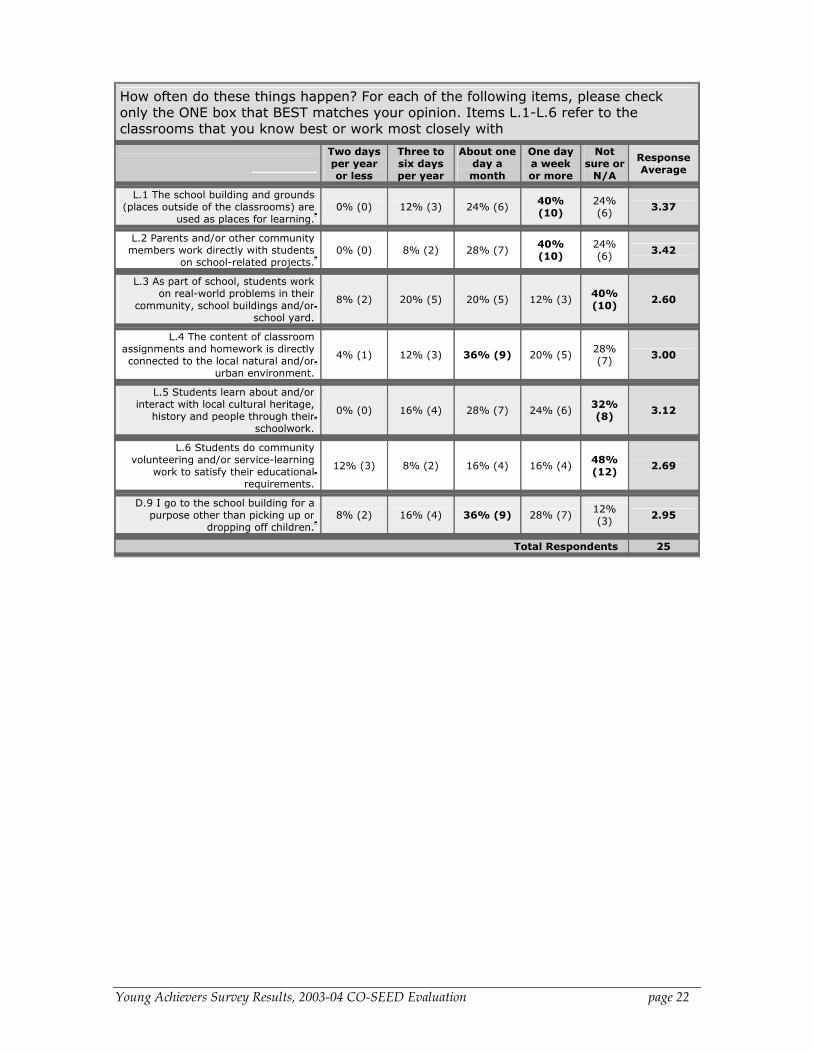
How often do these things happen? For each of the following items, please check only the ONE box that BEST matches your opinion. Items L.1-L.6 refer to the classrooms that you know best or work most closely with
Two days per year or less
Three to six days per year
About one day a month
One day a week or more
Not sure or
N/A Response Average
L.1 The school building and grounds(places outside of the classrooms) are
used as places for learning. 0% (0) 12% (3) 24% (6) 40%
(10) 24% (6) 3.37
L.2 Parents and/or other communitymembers work directly with students
on school-related projects. 0% (0) 8% (2) 28% (7) 40%
(10) 24% (6) 3.42
L.3 As part of school, students workon real-world problems in their
community, school buildings and/orschool yard.
8% (2) 20% (5) 20% (5) 12% (3) 40% (10) 2.60
L.4 The content of classroomassignments and homework is directlyconnected to the local natural and/or
urban environment. 4% (1) 12% (3) 36% (9) 20% (5) 28%
(7) 3.00
L.5 Students learn about and/orinteract with local cultural heritage,
history and people through theirschoolwork.
0% (0) 16% (4) 28% (7) 24% (6) 32% (8) 3.12
L.6 Students do communityvolunteering and/or service-learning
work to satisfy their educationalrequirements.
12% (3) 8% (2) 16% (4) 16% (4) 48% (12) 2.69
D.9 I go to the school building for apurpose other than picking up or
dropping off children. 8% (2) 16% (4) 36% (9) 28% (7) 12%
(3) 2.95
Total Respondents 25
Young Achievers Survey Results, 2003-04 CO-SEED Evaluation page 23
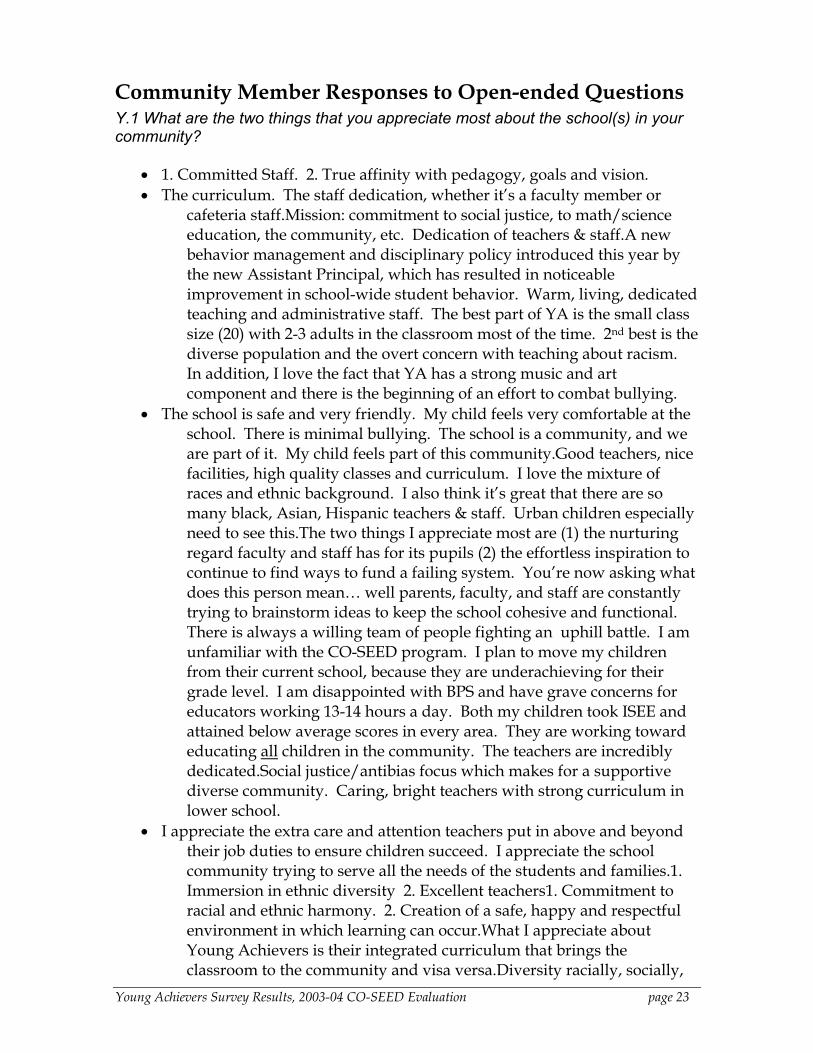
Community Member Responses to Open-ended Questions Y.1 What are the two things that you appreciate most about the school(s) in your community?
• 1. Committed Staff. 2. True affinity with pedagogy, goals and vision. • The curriculum. The staff dedication, whether it’s a faculty member or
cafeteria staff.Mission: commitment to social justice, to math/science education, the community, etc. Dedication of teachers & staff.A new behavior management and disciplinary policy introduced this year by the new Assistant Principal, which has resulted in noticeable improvement in school-wide student behavior. Warm, living, dedicated teaching and administrative staff. The best part of YA is the small class size (20) with 2-3 adults in the classroom most of the time. 2nd best is the diverse population and the overt concern with teaching about racism. In addition, I love the fact that YA has a strong music and art component and there is the beginning of an effort to combat bullying.
• The school is safe and very friendly. My child feels very comfortable at the school. There is minimal bullying. The school is a community, and we are part of it. My child feels part of this community.Good teachers, nice facilities, high quality classes and curriculum. I love the mixture of races and ethnic background. I also think it’s great that there are so many black, Asian, Hispanic teachers & staff. Urban children especially need to see this.The two things I appreciate most are (1) the nurturing regard faculty and staff has for its pupils (2) the effortless inspiration to continue to find ways to fund a failing system. You’re now asking what does this person mean… well parents, faculty, and staff are constantly trying to brainstorm ideas to keep the school cohesive and functional. There is always a willing team of people fighting an uphill battle. I am unfamiliar with the CO-SEED program. I plan to move my children from their current school, because they are underachieving for their grade level. I am disappointed with BPS and have grave concerns for educators working 13-14 hours a day. Both my children took ISEE and attained below average scores in every area. They are working toward educating all children in the community. The teachers are incredibly dedicated.Social justice/antibias focus which makes for a supportive diverse community. Caring, bright teachers with strong curriculum in lower school.
• I appreciate the extra care and attention teachers put in above and beyond their job duties to ensure children succeed. I appreciate the school community trying to serve all the needs of the students and families.1. Immersion in ethnic diversity 2. Excellent teachers1. Commitment to racial and ethnic harmony. 2. Creation of a safe, happy and respectful environment in which learning can occur.What I appreciate about Young Achievers is their integrated curriculum that brings the classroom to the community and visa versa.Diversity racially, socially,

Young Achievers Survey Results, 2003-04 CO-SEED Evaluation page 24
and economically. Commitment to languages including ESL.The teachers are devoted to the kids, working long hours, never having enough tools. For the most part they work very hard. This Young Achievers is unique in that way.I love YA. I appreciate the patience, the devotion and the importance of education.1) Diversity 2) EnergyThe school teaches all the children clearly on political topics. The school is actively involved in sewing seeds in the community. The school is clearly a representation of diversity.That is a difficult question as we live in South Boston but our sons attend Young Achievers in Jamaica Plain. I appreciate the fact that teachers bring the children out into the community of JP and take advantage of the wonderful nature in that area. I also like the diversity of the school and the work all the employees do with social justice.1) The commitment to social justice. 2) The community’s cohesiveness about the school’s mission.I appreciate the effort the k1 and k2 teachers and staff made to create and maintain a successful partnership with the MTA, Boston. I appreciate the amazing hard-working children of Young Achievers.That I live within walking distance from the school. And the group of families that started or came into kindergarten has been a very committed and involved group of families. For the last 4 yrs. this group has participated in most of if not all of the various committees, organizations of the school.

Young Achievers Survey Results, 2003-04 CO-SEED Evaluation page 25
Y.2 What two things about the school(s) in your community do you think need the most improvement?
• We desperately need to increase family involvement and leadership. The group that has been carrying the “torch” so to speak is tired and getting burnt out. I’m very worried of what’s going to happen if new family members don’t get involved soon, real soon! Secure funding for our extended day program. We cannot afford to continue to lose great educators!
• I think there could be greater parent/family involvement overall. • 1) A sustainable environment for teachers i.e. burnout – This would include
having more staff and people working less hours without it being detrimental to students. More guidance for teachers who are new is also needed. 2) A more engaging curriculum- A curriculum more guided by student interest rather than standards. I would also say the curriculum must also foster teamwork, community, and collective action.
• Since my sons have an hour bus ride to and from school I would like to see better bus drivers and bus monitors. Secondly, I would like to see an increase in responsiveness to parents needs for those children that do not live in the immediate area of YA.
• They are unable to service children who are not on the mainstreem to education. Children that are in need of extra help get left behind, then put in (sped), kept back to the extreme of being kept back more than once in the same grade.
• 1) Philosophy of Discipline- lesbian administrators do not understand male energy. Boys are too often punished for just being boys. 2) The food- I’m tired of the administration’s excuses re: food. Take charge! We are what we eat!!!
• 1) funding- city schools need more funding 2) parental support- more parents (including me) need to support the schools.Funding to do the things they need to do to reach their goals. They need to diversify their class population in order to keep exceptionally smart kids there. They need to “teach” to the smart kids as well as help the “slower learner.”Addition supports to keeping children in school (particularly between 7-9 grades) through flexible learning approaches. Continual focus in making reading and math approachable/engaging for all learning styles of children.1. Immediate goals and vision misaligned with financial picture. 2. More planning time for teachers so that staff turnover is reduced and school operates smoothly.More funding, more money in order for the school to run more smoothly. More staff to keep the teacher/student ratio down. Need to improve academic achievement (by any definition). Need more space, very difficult for the adults to do their jobs properly with the cramped space (more resources in general… need the state to stop cutting the budget every year).Training of teachers and administrators, and corresponding salary

Young Achievers Survey Results, 2003-04 CO-SEED Evaluation page 26
compensation for teachers. More parent involvement in all aspects of their children’s education. I am very unhappy about the lack of language education as in Spanish. I think the academic rigor has noticeably slipped for our 2nd grade. I dislike the mandatory extended day and the heavy handed effort to label opponents as racists and classists. I think more needs to be done to stop bullying and support the rights of girls. Academic achievement- i.e. the ability to score well on academic tests, needs to be developed in kids, and taught. Providing academic challenges to kids who need more advanced curriculums. The pace of curriculum is too slow for some kids, and as a result, when it comes time to take standardized tests, the kids haven’t covered all the materialI think there should be better parent outreach & possibly trainings for parents. They need to know their kids need the parent’s help with learning as well as social adjustments. Some teachers focus on behavior, instead of teaching, not realizing they are sometimes a part of the problem. The two things I feel need the most supports are academic achievement and faculty and staff scheduling. Overworked and underpaid faculty and staff equals burn-out which results in lowered standards and poor achievements by the students. 1. Improve on upper grade academics. 2. More academics, activities etc in the area of math and science. I not familiar with the CO-SEED program so I don’t know exactly what’s it’s purpose, goal, etc.More financial resources - (major cuts in last 2 years have weakened schools).Staff attrition by their being provided good supervision by supervisor and peers. Resources to allow appropriate staffing to support a wide range of learners.Schools need more resources to do their basic job and to be able to serve the whole student. Without more resources they can’t improve.Need more $ to hire more coverage- teachers are burning out and we do not have enough $ for enrichment programs- music, swimming, etc. -$- for more janitor time. More teacher support – main teacher is alone too much and kids are acting up and things get to rowdy and out of hand with behavior and I don’t like the exposure my daughter is getting to kids giving the “Finger” and using swears and the teachers are missing it.1. Student achievement outcomes. 2. Adequate resources to support [illegible] day and full-range of learners objectives1. MCAS scores 2. Money to support student services

Young Achievers Survey Results, 2003-04 CO-SEED Evaluation page 27
E.1 Please feel free to comment on your responses on this survey or other interests/concerns about CO-SEED.
• I don’t feel I have enough knowledge or information about the CO-SEED project and its direct involvement with YA. I also don’t know who, when, and how my community leaders/activist meet, plan, or get involved in projects, discussions etc. about my community. I know there is a group but that’s it. NEED more info.I do not understand exactly how CO-SEED operates and its impact. I was as helpful as possible in my filling out the form.Not sure at all how much you will get from the responses. Young Achievers is a group of diverse learners, so a question like x12 is hard to answer. Also, if you are trying to attribute change to CO-SEED over the next 3 years, it’s best to administer survey in Sept/Oct or ask about this year only so that you are measuring effects of COSEED and not what’s been happening over past many years in a given school. I don’t know much about CO-SEED, as reflected in my answers.
• We live a few miles from the school, and we don’t feel connected to the community for that reason. [i.e. the businesses and people living around the school]
• I am unfamiliar with the CO-SEED program. I plan to move my children from their current school, because they are underachieving for their grade level. I am disappointed with BPS and have grave concerns for educators working 13-14 hours a day. Both my children took ISEE and attained below average scores in every area.
• It’s hard to keep one definition of “community” for the whole survey. There’s the school community, JP community and then Boston.
• I think the school and CO-SEED are a great team! Although I don’t know much about the program I like the concept.
• 1) Too much fuzzy thinking here. 2) Young Achievers does not draw students directly form the surrounding neighborhood, so there is a strong disconnect. 3) My son went to Young Achievers 1st – 6th grades, yet I have not been aware of CO-SEED until now. I am a parent very actively involved in my child’s education, yet do not like to attend meetings.
• Academically the school needs to move forward. While it does great in social and political arena’s. It is failing the children academically..