supplemental disclosures · the league of fortune 500. the aditya birla group is a conglomerate...
TRANSCRIPT

Quarterly Report Dec’19 Page 2 of 17
Supplemental Disclosures
Unless stated otherwise, the financial data in this report is derived from our un-audited / audited financial
statements prepared in accordance with Ind AS adopted in Q1FY17, with transition date of April 01, 2015. Our
financial year ends on 31st March of each year, so all references to a particular financial year are to the twelve
months ending March 31 of that year. In this report, any discrepancies in any table between the total and the sums
of the amounts listed are due to rounding-off. There are significant differences between Indian GAAP, IFRS, Ind AS
and U.S. GAAP; accordingly, the degree to which the Ind AS financial statements will provide meaningful
information is dependent on the reader’s familiarity with Indian accounting practices. Any reliance by persons not
familiar with Indian accounting practices on the financial information presented in this report should accordingly
be limited. We have not attempted to explain such differences or quantify their impact on the financial data
included herein.
Unless stated otherwise, industry data used throughout this report has been obtained from industry publications.
Industry publications generally state that the information contained in those publications has been obtained from
sources believed to be reliable but that their accuracy and completeness are not guaranteed and their reliability
cannot be assured. Although we believe that industry data used in this report is reliable, it has not been
independently verified.
Actual results may differ materially from those suggested by the forward-looking statements due to risks or
uncertainties associated with our expectations with respect to, but not limited to, our ability to successfully
implement our strategy, our growth and expansion, technological changes, our exposure to market risks, general
economic and political conditions in India which have an impact on our business activities or investments, the
monetary and interest policies of India, inflation, deflation, unanticipated turbulence in interest rates, foreign
exchange rates, equity prices or other rates or prices, the performance of the financial markets in India and
globally, changes in domestic and foreign laws, regulations and taxes and changes in competition in the industry.
Report Structure Page No.
1. An Overview 3
2. Our Strengths 5
3. Financial Highlights 8
4. Key Performance Indicators 10
5. Management Discussion & Analysis 11
6. Stock Market Highlights 14
7. Shareholding Pattern 14
8. Glossary 15

Quarterly Report Dec’19 Page 3 of 17
1. Vodafone Idea Limited (formerly Idea Cellular Limited) – An Overview
Vodafone India Limited has merged into Idea Cellular Limited (ICL) on August 31, 2018. Consequently,
the name of the company has been changed from ICL to Vodafone Idea Limited. Vodafone Idea Limited
is an Aditya Birla Group and Vodafone Group partnership. It is India’s leading telecom service provider.
The company provides Voice and Data services on 2G, 3G and 4G technologies across 22 service areas.
With its large spectrum portfolio to support the growing demand for data and voice, the company is
committed to deliver delightful customer experiences and contribute towards creating a truly ‘Digital
India’ by enabling millions of citizens to connect and build a better tomorrow. The company is developing
world-class infrastructure to introduce newer and smarter technologies, making both retail and
enterprise customers future ready with innovative offerings, conveniently accessible through an
ecosystem of digital channels as well as extensive on the ground presence. The company is listed on the
National Stock Exchange (NSE) and the BSE in India.
Promoter Groups
Vodafone Group is one of the world’s leading telecoms and technology service providers. We have
extensive experience in connectivity, convergence and the Internet of Things, as well as championing
mobile financial services and digital transformation in emerging markets. Vodafone Group has mobile
operations in 24 countries, partnerships with mobile networks in 42 more, and fixed broadband
operations in 19 countries. As of December 31, 2019, Vodafone Group had approximately 625 million
mobile customers, 27 million fixed broadband customers and 22 million TV customers, including all of
the customers in Vodafone’s joint ventures and associates.
Aditya Birla Group, a US$48 billion corporation, is one of the largest business groups in India, and is in
the league of Fortune 500. The Aditya Birla Group is a conglomerate with operations in 36 countries
having business interest, among others, in mobile telecommunications, metals and mining, fashion
retail, cement, carbon black, textiles, garments, chemicals, fertilizer and financial services industries etc.
Over 50% of Group revenues flow from overseas operations across North and South America, Africa and
Asia.

Quarterly Report Dec’19 Page 4 of 17
Corporate Structure
Other subsidiaries (Insignificant business / non-operating)
Vodafone India Digital Limited
Vodafone Idea Technology Solutions Limited
You System Integration Private Limited
Connect India Mobile Technologies Private Limited
Vodafone M-Pesa Limited
Aditya Birla Idea Payment Bank Limited (in the process of winding up)
Business Segments
a. Mobility
Voice Business – Vodafone Idea offers Voice services coverage in all 22 service areas on the
Vodafone and Idea brands. The company covers more than a billion Indians in over 487,000
Census towns and villages with its Voice services. The company has also introduced 4G VoLTE
across all 22 circles to provide enhanced voice experience to its 4G subscribers.
Broadband Services – The broadband services of Vodafone Idea on 3G and 4G platforms are
available in all 22 service areas of India for both brands – Vodafone and Idea. The company’s
broadband coverage is available in over 318,000 Census towns and villages with population
coverage of nearly a billion Indians. The population coverage on 4G now is 974 million.
Content Offerings – To provide best in class content to its customers though the applications
Vodafone Play and Ideas Movies & TV, the company has tied up with various content creators and
OTT apps like Eros, Sony Liv, Zee5, Sun NXT, Shemaroo Me, Hoichoi, Lionsgate Play, Hungama, TV
Today, Discovery and others. Both these apps provide a range of content including Movies, Live
TV, TV shows, latest originals and short formats in 16+ languages. Additionally, the company has
tie ups with leading content providers like Amazon Prime and Netflix for its premium customers.
Vodafone
Idea
Manpower
Services
Limited
Idea
Telesystems
Limited
Vodafone Idea
Business
Services
Limited
Vodafone Idea
Communicatio
n Systems
Limited
Vodafone Idea
Shared
Services
Limited
You
Broadband
India Limited
Vodafone
Foundation
Vodafone Idea
Telecom
Infrastructure
Limited
Firefly
Networks
Limited
Indus Towers
Limited
Manpower
Services
Trading of
communication
devices
Data Centre,
OSP Services
Trading of
communication
devices
Shared
service center
Fixed line
Broadband
Section 8
Company -
CSR
activities
Fibre assets
Wi-Fi Site
Acquisitions,
Installation,
Maintenance
Passive
infrastructure
Joint Venture100% Subsidiaries
Vodafone Idea Limited

Quarterly Report Dec’19 Page 5 of 17
b. Enterprise Services
Vodafone Idea Business Services provides total communications solutions to empower global and
Indian corporations, public sector & government bodies, small & medium enterprises and start-ups.
With market-leading enterprise mobility, robust fixed line connectivity, world-class IoT solutions
and insightful business analytics & enabling solutions, the company brings the smartest and newest
technologies to serve businesses in the digital era. With the advantage of its global expertise and
knowledge of local markets, Vodafone Idea Business Services endeavours to be a trusted and valued
partner for businesses in a digital world.
2. Our Strengths
Spectrum Portfolio
Vodafone Idea has a total of 1,846 MHz of spectrum across difference frequency bands out of which
1,723.6 MHz spectrum is liberalised and can be used towards deployment of any technology (2G,
3G, 4G or 5G). Further, 1,316.8 MHz of spectrum acquired through auction between year 2014 and
2016 is having the validity until 2034 to 2036. This large spectrum portfolio across 22 circles allows
the company to create enormous broadband capacity.
900 1800 900 1800 2100 2300 2500
Andhra Pradesh - - 5.0 11.0 5.0 - 10.0 52.0
Assam - - - 25.0 5.0 - 20.0 80.0
Bihar - 4.4 - 13.4 5.0 - 10.0 55.6
Delhi - 8.0 10.0 10.6 5.0 - 20.0 87.2
Gujarat - - 11.0 20.8 10.0 - 30.0 113.6
Haryana - - 12.2 15.8 15.0 - 20.0 106.0
Himachal Pradesh - 4.4 - 11.2 5.0 - 10.0 51.2
Jammu & Kashmir - - - 17.0 5.0 - 10.0 54.0
Karnataka - 8.0 5.0 11.0 5.0 - - 58.0
Kerala - - 12.4 20.0 10.0 10.0 20.0 114.8
Kolkata - - 7.0 15.0 10.0 - 20.0 84.0
Madhya Pradesh - - 7.4 18.6 5.0 10.0 20.0 92.0
Maharashtra - - 14.0 12.4 15.0 10.0 30.0 122.8
Mumbai - 4.4 11.0 10.2 10.0 - 20.0 91.2
North East - - - 25.8 5.0 - 20.0 81.6
Orissa - - 5.0 17.0 5.0 - 20.0 74.0
Punjab - 6.2 5.6 15.0 10.0 - 10.0 83.6
Rajasthan - 6.2 6.4 10.0 15.0 - 20.0 95.2
Tamil Nadu 6.2 1.0 - 11.4 15.0 - - 67.2
Uttar Pradesh (East) - 6.2 5.6 8.6 20.0 - 20.0 100.8
Uttar Pradesh (West) 6.2 - 5.0 14.4 10.0 - 20.0 91.2
West Bengal - - 6.6 23.4 5.0 - 20.0 90.0
Total 12.4 48.8 129.2 337.6 195.0 30.0 370.0 1,846.0
Administrative Spectrum Liberalised Spectrum Total
FDDx2+TDDCircle

Quarterly Report Dec’19 Page 6 of 17
Large Customer Base
Vodafone Idea is a leading mobile telecommunications company in India. The company had over
304 million subscribers as of December 31, 2019. As the company is expanding its broadband
coverage and capacity, specifically 4G, this large subscriber base provides a great platform for the
company to upgrade voice only customers to users of data services and digital content.
Robust Network Infrastructure
The company has large network assets in the form of 2G, 3G, 4G equipment and country wide
optical fibre cable (OFC). The company has presence in over 186,000 unique locations and has
over 417,000 broadband (3G+4G) sites. The company continues to expand its 4G population
coverage which stands at 974 million as of December 31, 2019. The company has a portfolio of
nearly ~356,000 km of OFC (vs. ~353,000 km in September 30, 2019) including own built, IRU OFC
and common routes. The incremental capex coupled with redeployment of co-located broadband
sites is allowing the company to expand its broadband coverage and create large capacities.
Consolidation of spectrum with each site using spectrum of both the erstwhile entities, coupled
with deployment of TDD sites, Small Cells and Massive MIMO is providing further capacity
increase.
Strong Brands
The company has two strong brands that have contributed significantly to its strong market
position. The brands and are complementary in nature with each brand having a
strong affinity with different segment of customers across 22 service areas.
Enterprise Offerings
The company is well positioned in enterprise offerings across industry verticals. Vodafone Idea
Business Services has clear leadership in IoT offerings which is an emerging segment and has
potential to grow multi fold in the near future amid government’s push towards ‘Digital India’ and
‘Smart Cities’. Our partnership with leading automobile players like Kia, Hyundai, Daimler-Benz
among others, has helped make connected vehicles a reality in India. This has been fuelled by IoT
connectivity and recent launch of our eSIM offerings. Today, we have captured 100% of the
Automotive OEM generated eSIM market and are well positioned to ride the wave of Connected
Mobility.
The company has built strong relationship with its enterprise customers by providing Enterprise
grade solutions and services over last several years. The strong relationship with customers and

Quarterly Report Dec’19 Page 7 of 17
global know how of Vodafone Group provide strong platform for future growth in this segment.
Vodafone Idea Business Services has been recognized at the recently held CIO Choice Awards,
2020. We emerged as the preferred provider of choice in 6 categories-Mobility, IoT, Managed
WiFi, SIP Trunking and Cloud Telephony. Our recent launch of “My Vodafone for Business” (MVB)
is also testimony to our continued commitment of providing transformative digital experiences.
Tower Investments (Indus)
Indus Towers Ltd. (Indus), a joint venture between Bharti Infratel Ltd., Vodafone Group and
Vodafone Idea Ltd, is one of the world’s leading tower company with 125,649 towers and a
tenancy ratio of 1.86 as of December 31, 2019. Vodafone Idea owns 11.15% stake in Indus. The
proportionate profit/loss of Indus is presently consolidated at the PAT level in Vodafone Idea’s
financial statements.
On April 25, 2018, the merger of Bharti Infratel and Indus towers was announced which will create
a listed pan-India tower company. The merger is awaiting regulatory approval from the
Department of Telecommunications, having received all other required approvals. The long stop
date on the original agreement had been initially extended to December 24, 2019 and then further
extended to February 24, 2020. Vodafone Idea plans to monetize its 11.15% stake in Indus on
completion of the Indus-Infratel merger.
Quarterly Report Dec’19 Page 8 of 17
3. Financial Highlights
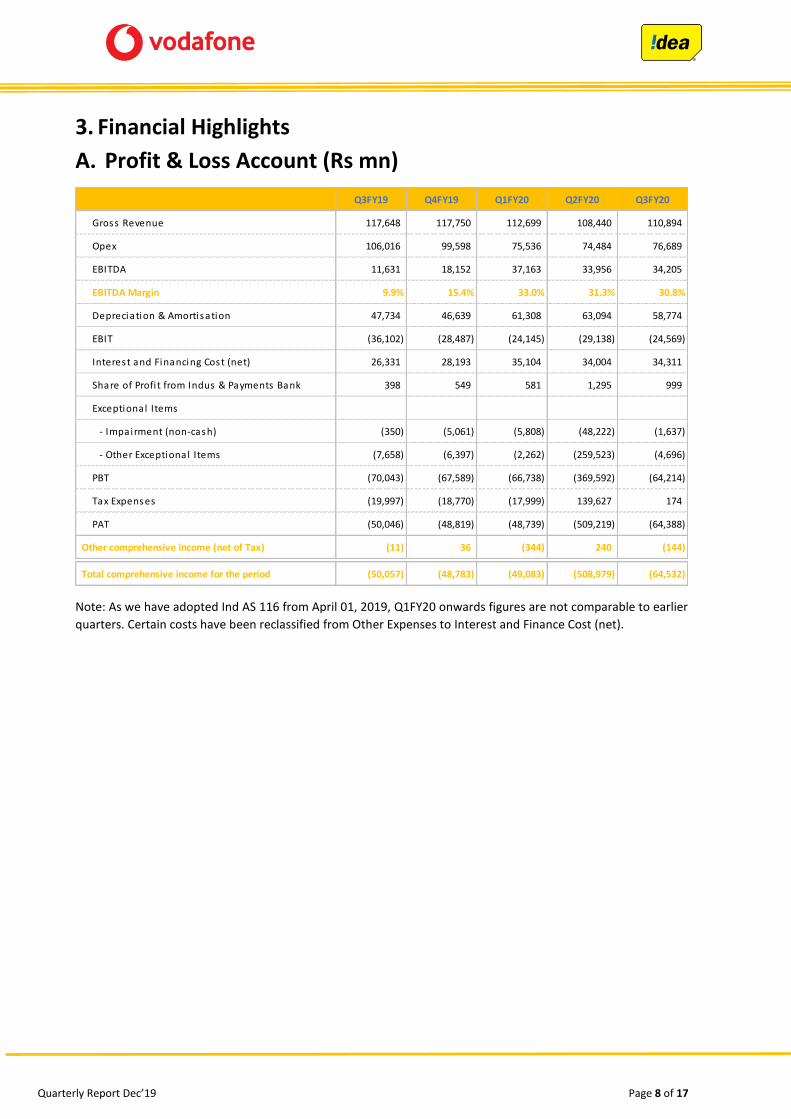
A. Profit & Loss Account (Rs mn)
Note: As we have adopted Ind AS 116 from April 01, 2019, Q1FY20 onwards figures are not comparable to earlier
quarters. Certain costs have been reclassified from Other Expenses to Interest and Finance Cost (net).
Q3FY19 Q4FY19 Q1FY20 Q2FY20 Q3FY20
Gross Revenue 117,648 117,750 112,699 108,440 110,894
Opex 106,016 99,598 75,536 74,484 76,689
EBITDA 11,631 18,152 37,163 33,956 34,205
EBITDA Margin 9.9% 15.4% 33.0% 31.3% 30.8%
Depreciation & Amortisation 47,734 46,639 61,308 63,094 58,774
EBIT (36,102) (28,487) (24,145) (29,138) (24,569)
Interest and Financing Cost (net) 26,331 28,193 35,104 34,004 34,311
Share of Profi t from Indus & Payments Bank 398 549 581 1,295 999
Exceptional Items
- Impairment (non-cash) (350) (5,061) (5,808) (48,222) (1,637)
- Other Exceptional Items (7,658) (6,397) (2,262) (259,523) (4,696)
PBT (70,043) (67,589) (66,738) (369,592) (64,214)
Tax Expenses (19,997) (18,770) (17,999) 139,627 174
PAT (50,046) (48,819) (48,739) (509,219) (64,388)
Other comprehensive income (net of Tax) (11) 36 (344) 240 (144)
Total comprehensive income for the period (50,057) (48,783) (49,083) (508,979) (64,532)

Quarterly Report Dec’19 Page 9 of 17
B. Balance Sheet (Rs mn)
31-Mar-19 31-Dec-19
Assets
Non-current assets
Property, plant and equipment 502,526 655,775
Capital work-in-progress 23,587 14,333
Investment property 672 663
Goodwill on consolidation 36 36
Other Intangible assets 1,274,767 1,236,916
Intangible assets under development 27,443 403
Investments accounted for using the equity method 15,298 14,613
Financial assets
Long term loans to employees 8 3
Other non-current financial assets 10,362 12,810
Deferred Tax Assets 103,385 22
Other non-current assets 155,099 134,207
Total non-current assets (A) 2,113,183 2,069,781
Current assets
Inventories 42 20
Financial assets
Current investments 67,088 43,051
Trade receivables 33,000 31,479
Cash and cash equivalents 8,428 23,114
Bank balance other than cash and cash equivalents 1,480 61,987
Short term loans 19 15
Other current financial assets 680 87,173
Current Tax Assets (Net) - -
Other current assets 71,260 82,999
Total current assets (B) 181,997 329,838
Assets classified as held for sale (C) 1,815 -
Total Assets (A+B+C) 2,296,995 2,399,619
Equity and liabilities
Equity
Equity share capital 87,356 287,354
Other equity 508,992 (111,125)
Total equity (A) 596,348 176,229
Non-Current Liabilities:
Financial liabilities
Long term borrowings 1,044,029 1,010,465
Trade payables 8,680 8,881
Other non-current financial l iabil ities 97,381 272,126
Long term provisions 3,467 4,110
Deferred tax l iabilities (net) 471 1,010
Other non-current l iabilities 4,235 4,835
Total Non-Current Liabilities (B) 1,158,263 1,301,427
Current Liabilities:
Financial l iabil ities
Short term borrowings 41,207 1
Trade payable 126,486 115,685
Current maturities of long term debt 174,163 148,000
Other current financial l iabil ities 129,783 147,507
Other current l iabilities 69,499 510,114
Short term provisions 379 656
Total Current Liabilities (C) 541,517 921,963
Liabilities classified as held for sale (D) 867 -
Total equity and liabilities (A+B+C+D) 2,296,995 2,399,619
ParticlularsAs on

Quarterly Report Dec’19 Page 10 of 17
4. Key Performance Indicators
* includes VoLTE subscribers from Q2FY20 onwards, thus not comparable to earlier quarters.
Q3FY19 Q4FY19 Q1FY20 Q2FY20 Q3FY20
Subscriber Base (EoP) mn 387.2 334.1 320.0 311.1 304.0
VLR Subscribers (EoP) mn 390.8 368.3 322.4 303.4 297.6
Pre-paid Subs (% of EoP subscribers ) % 93.9% 93.1% 92.8% 92.7% 92.4%
Average Revenue per User (ARPU) Blended INR 89 104 108 107 109
Average Minutes of Use per User (MoU) min 580 662 690 669 674
Blended Churn % 5.0% 7.2% 3.7% 3.5% 3.3%
2G Coverage - No. of Census Towns and Vi l lages no. 480,336 470,531 487,173 487,173 487,173
2G Coverage - Population mn 1,211 1,195 1,218 1,218 1,218
Broadband Coverage - No. of Census Towns and Vi l lages no. 271,488 273,034 285,180 314,129 318,506
Broadband Coverage - Population mn 919 922 943 993 998
4G Coverage - Population mn 857 871 916 962 974
Total Unique Towers (EoP) no. 198,171 192,580 189,547 187,357 186,011
Total Unique Broadband Towers (EoP) no. 157,683 155,632 157,278 158,153 160,097
Total Broadband s i tes (3G+4G) no. 376,816 371,922 392,747 405,346 417,361
Total Minutes of Use mn 712,283 702,749 676,259 630,688 624,289
Total Data Volume (2G+3G+4G) mn MB 2,705,157 2,947,472 3,222,159 3,491,899 3,790,390
Total Data Subscribers (2G+3G+4G) mn 146.3 146.3 143.3 140.3 142.0
Broadband Subscribers (3G+4G) mn 107.9 110.2 110.5 112.2 118.4
4G Subscribers* mn 75.3 80.7 84.8 95.9 104.2
Data Usage by Broadband Subscriber (3G+4G) MB 8,546 8,815 9,657 10,350 10,700
Mobility KPIs UnitVodafone Idea

Quarterly Report Dec’19 Page 11 of 17
5. Management Discussion and Analysis
Financial highlights
Revenue for the quarter was Rs. 110.9 billion, an increase of 2.3% QoQ, primarily supported by strong 4G
additions driving ARPU improvement.
EBITDA for the quarter increased to Rs. 34.2 billion, (Rs. 12.8 billion excluding Ind AS 116 impact vs Rs. 11
billion in Q2) a QoQ increase of 0.7% driven by higher revenue and incremental synergy realisation, which
was partially offset by increased interconnect cost. EBITDA margins (excluding Ind AS 116 impact) stood at
11.6% vs 10.2% in Q2FY20. The underlying operating expenses for the quarter (excluding License fees &
Spectrum Usage Charges and Roaming & Access charges) were Rs. 17.9 billion lower compared to Q1FY19,
after adjusting for inflation driven cost increases and incremental network rollout. On an annualised basis,
this reduction in operating expenses represents ~85% of our target opex synergy of Rs. 84 billion. We are
currently on track to realize our full opex synergy targets by Q1FY21.
Gross debt (excluding lease liabilities) as of December 31, 2019 was Rs. 1,158.5 billion, including deferred
spectrum payment obligations due to the Government of Rs. 885.3 billion. Cash & cash equivalents were Rs.
125.3 billion and net debt stood at Rs. 1,033.1 billion (vs Rs. 1,019.1 billion in Q2FY20). Capex spend in Q3FY20
was Rs. 33.3 billion compared to Rs. 21.4 billion in Q2FY20.
Integration update
Integration is progressing well and is expected to complete by Q1FY21. As at December 31, 2019, we had
completed network integration in 86% of total districts. Integration of Uttar Pradesh (E), Gujarat and Delhi
circles was completed in January, 2020, taking the integrated circles count to 17. In the remaining 5 circles,
integration continues to move at a rapid pace based on a cluster-by-cluster approach, with subscribers of
both brands benefitting from the integrated network, which has significantly greater coverage and capacity.
The improved coverage and capacity following integration, coupled with the deployment of TDD sites,
Massive MIMO and LTE 900 on select sites has increased our data capacity, which has now almost doubled
compared to September, 2018. This has driven a significant improvement in data speeds and customer
experience across all circles. We now have the fastest 4G network speeds across the three metros of Delhi,
Mumbai and Kolkata, along with West Bengal, Uttar Pradesh, Madhya Pradesh and Rajasthan, based on Ookla
data.
As part of our network integration, we had removed surplus equipment from ~58,000 sites out of the total
~73,000 co-located sites by the end of December, 2019, further reducing our cost. In addition, we had exited
~17,000 low utilization sites by the end of December, 2019.
Quarterly Report Dec’19 Page 12 of 17
Operational highlights
The subscriber base declined to 304 million in Q3 from 311 million in Q2FY20. Subscriber churn further
reduced in Q3FY20, reaching 3.3% compared to 3.5% in Q2FY20 and 3.7% in Q1FY20. ARPU for Q3 improved
to Rs. 109 vs Rs. 107 in Q2FY20 supported by improved customer mix.
After several years of hyper competitiveness which led to tariff decline, we as well as other operators
increased tariffs at the start of December, 2019 across all price points for both unlimited plans as well as
combo vouchers. However, the tariff increase had limited impact on this quarter’s revenue.
We continue to invest in 4G to increase coverage and capacity. During the quarter we added ~14,600 4G FDD
sites, our highest addition in a single quarter since merger, to improve 4G population coverage which now
stands at 974 million. We have deployed ~58,200 TDD sites in addition to deployment of ~11,400 Massive
MIMO till date. These network investment initiatives have delivered a significant capacity uplift and enhanced
our customers’ experience. We are making progress in implementing LTE 900 in select locations, including
through dynamic spectrum refarming, to improve customer experience. Our overall broadband site count
stood at 417,361 in Q3 compared to 405,346 in Q2FY20.
During the quarter, we added 8.3 million 4G customer, taking overall 4G subscriber base (including VoLTE
users) to 104.2 million. Total data volumes grew by 8.5% to 3,790 billion MB compared to the last quarter.
Total minutes on the network declined by 1% during the quarter, due to reduction in incoming minutes while
outgoing minutes witnessed strong growth.
Fund raising / Asset monetization
The merger of Indus Towers and Bharti Infratel is awaiting regulatory approval from the Department of
Telecommunications (DoT), having received all other required approvals. The long stop date on the original
agreement has been further extended to February 24, 2020. Vodafone Idea plans to monetize its 11.15%
stake in Indus on completion of the Indus-Infratel merger. We are also exploring the options to monetize
nearly 160,000 kilometers of intra-city and inter-city fibre as well as our Data Centre.
AGR Judgement by Hon’ble Supreme Court and its impact
The Hon’ble Supreme Court on October 24, 2019 had announced its judgment on the Adjusted Gross Revenue
(AGR) matter which has significant financial implications for the industry. Further, the Hon’ble Supreme Court
in a Supplementary order had provided three months’ time to pay the amount to DoT and report compliance.
A review petition filed by the company and some telecom operators was dismissed in January 2020.
Thereafter, the company and some of the telecom operators have filed an application for modification of the
Supplementary order before the Hon’ble Supreme Court, seeking modification of the Order and permit DoT

Quarterly Report Dec’19 Page 13 of 17
to decide on a schedule of payments and other reliefs, which is yet to be heard, pending which, the Company
has not yet made any payment.
We had accounted for the estimated liability of Rs. 441.5 billion related to License Fee and Spectrum Usage
Charges in the previous quarter, mainly based on the DoT demands received and estimation for periods for
which demands had not been raised by DoT till then, together with interest, penalty and interest on penalty,
all taken for periods upto September 30, 2019 and adjusted for certain computational errors. While
continuing to recognize the liability in the same manner, the Company, during this quarter, adjusted the
estimated liability for subsequent demands received, errors in computation, applicable interest for this
quarter, payments made in the past not considered in the DoT demands and consequential adjustments on
satisfaction of contractual conditions under a mechanism with Vodafone Group. Accordingly, the net impact
of these effects amounting to Rs. 528 million has been recognized as Exceptional Items during the quarter.
Further, as directed by DoT, the Company is undertaking a self- assessment exercise for computation of
liability as per the AGR Judgment.
Meanwhile, the Company continues to actively engage with the Government to provide relief on AGR matter.
The Government has also taken cognizance of the financial stress faced by the telecom operators currently
and has granted a moratorium of two years for the payment of Spectrum dues beyond April 01, 2020 up to
March 31, 2022. Separately, the Telecom Regulatory Authority of India (TRAI) has initiated a consultation on
floor pricing at the request of all the operators, through COAI.
It is to be noted that material uncertainty exists that cast significant doubt on the Company’s ability to
continue as a going concern and its ability to generate the cash flow that it needs to settle, or refinance its
liabilities including those relating to the SC AGR Judgement and guarantees as they fall due. Our ability to
continue as going concern is dependent on positive outcome of the application for modification of the
Supplementary Order before the Hon’ble Supreme Court and subsequent agreement with DoT for the
payment in instalments after some moratorium and other reliefs. Pending the outcome of the above matters,
the financial results have been prepared on a Going Concern Basis.

Quarterly Report Dec’19 Page 14 of 17
6. Stock Market Highlights
Vodafone Idea Daily Stock Price (NSE) & Volume (Combined of BSE & NSE) Movement
Volume (no. of Shares in mn) Closing Price (INR)
7. Shareholding Pattern
General Information
BSE Code 532822
NSE Symbol IDEA
Reuters IDEA.NS
No of Shares Outstanding (31/12/2019) mn 28735.4
Closing Market Price - NSE (31/12/2019) INR/share 6.15
Combined Volume (NSE & BSE) (01/10/2019 to 31/12/2019) mn/day 425.2
Combined Value (NSE & BSE) (01/10/2019 to 31/12/2019) INR mn/day 647.7
Market Capitalisation (31/12/2019) INR bn 177
Enterprise Value (31/12/2019) INR bn 1210
Particulars
Promoter and Promoter Group No. of Shares % holding
Aditya Birla Group 7,948,341,627 27.66%
Vodafone Group 12,755,576,455 44.39%
Total Promoter Holding 20,703,918,082 72.05%
Public Shareholding No. of Shares % holding
Institutional Holding 5,832,123,716 20.30%
Non-Institutional Holding 2,199,347,442 7.65%
Total 28,735,389,240 100.00%
As on Dec 31, 2019

Quarterly Report Dec’19 Page 15 of 17
8. Glossary
Definitions/Abbreviation Description/Full Form
ARPU (Average Revenue
Per User)
Is calculated by dividing services revenue (exclusive of infrastructure, fixed
line and device revenues) for the relevant period by the average number of
subscribers during the period. The result obtained is divided by the number
of months in that period to arrive at the ARPU per month figure.
Broadband Subscriber /
Broadband Data
Subscriber
Any subscriber with data usage of more than 0KB on 3G or 4G network in
last 30 days.
4G Subscriber Any subscriber with data usage of more than 0KB on 4G network in last 30
days, till Q1FY20.
From Q2FY20 onwards, any subscriber with data usage of more than 0KB
on 4G network or VoLTE usage, in last 30 days.
Churn Is calculated by dividing the difference in gross add and net add for the
relevant period by the average number of subscribers during the period.
The result obtained is divided by the number of months in that period to
arrive at the monthly churn.
Data Subscriber Any subscriber with data usage of more than 0KB in last 30 days.
EBITDA (Earnings before
interest, tax,
depreciation and
amortisation)
This is the amount after deducting operating expenditure from Revenue
from operations, which is comprised of Service revenue, Sales of trading
goods and Other operating income. Operating expenditure is comprised of
Cost of trading goods, Employee benefit expenses, Network expenses and IT
outsourcing costs, License fees and spectrum usage charges, Roaming and
access charges, Marketing, content, customer acquisition & service costs,
and other expenses.
Enterprise Value Is the summation of Market Capitalisation and consolidated Net Debt
EPS Earnings per share, is calculated by dividing the Profit after Tax for the
period by the weighted average number of outstanding equity shares.
EoP End of period
FY Financial year ending March 31
GSM Global System for Mobile communications, the most popular standard for
mobile telephony in the world
Gross Revenue Is the summation of service revenue, revenue from sale of trading goods
and other income
Ind AS Indian Accounting Standard
Indian GAAP Indian Generally Accepted Accounting Principles
Market Capitalisation Number of outstanding shares at end of the period multiplied by closing market price (NSE) at end of the period

Quarterly Report Dec’19 Page 16 of 17
Definitions/Abbreviation Description/Full Form
Net Adds Refers to net customer additions which is calculated as the difference
between the closing and the opening customer base for the period
Net Debt Total loan funds including deferred spectrum payment obligations due to the
Government but excluding the finance lease obligations, reduced by cash and
cash equivalents
Net Worth Calculated as the summation of Share Capital and Reserves & Surplus
reduced by debit balance of Profit & Loss account (if any)
Price to Earning Is calculated by dividing the closing market price (NSE) at the end of the
period by the annualised EPS
Site Represents unique combination of Technology and Spectrum band
(frequency). Site count does not include Massive MIMO and Small Cells
Service Area/ Circle Unless otherwise specifically mentioned, means telecom service areas in
India as defined by the DoT

Quarterly Report Dec’19 Page 17 of 17
For any clarification kindly contact
Phone – 91 9594003439