supersonic post-combustion inertial co2 extraction … library/research/coal/carbon capture... ·...
TRANSCRIPT
1
Supersonic Post-Combustion Inertial CO2 Extraction System Kickoff presentation to NETL Contract # DE-FE0013122 Pittsburgh, PA November 14, 2013

2
Objectives of the kickoff meeting
• To provide an overview of ICES including past work and results
• To discuss our proposed plans for the current effort in the context of how we will address the key remaining challenges

3
Presentation Outline
• Team overview and introductions • Overview of ICES concept • Review of results from ARPA-E IMPACCT program
activity • Summary of challenges and risks remaining • Overview of our plans for this effort • SOPO/PMP and milestone review • Summary and Q&A

4
ICES Team Organization

5
Company Backgrounds - ATK and ACENT
• ACENT is a small business dedicated to applying expertise in aerospace and defense to clean energy challenges
• Founded in 2007, ACENT is developing technologies in CO2 capture, algal biomass, hydrogen vehicles, and enhanced oil recovery
• ICES utilizes some methods developed under a DOE SBIR with ACENT
• ATK is a leading aerospace & defense contractor • ATK GASL in Ronkonkoma, NY operates the ATK Center for Energy and Aerospace Innovation
• Expertise and research interests include : • Aerospace propulsion • Carbon capture • Hydrogen fueled vehicles • Clean coal technologies • Oil recovery solutions

6
Other Key Team Members
Team Member Background Role in the Program
Ohio State University
Department of Chemical and Biomolecular Engineering has over 20 years experience working in the area of aerosol physics and chemistry, focusing on the formation, growth, and structure of nanodroplets. Supersonic nozzles are at the heart of the experimental apparatus used in all of this work.
• Support of the analytical study • Lab-scale experiments
EPRI
EPRI has extensive knowledge and contacts in the electric power industry provide a perspective to prepare technical and economic evaluations of the capture system in a broader electric power industry setting, and in the context of competing CO2 capture technologies.
• Techno-economic analysis • Cost-share partner
WorleyParsons
WP has more than 100 years of power experience having designed, constructed or managed the construction of more than 595 power generation plants. WP is proven and recognized industry leader in carbon management.
• Techno-economic analysis support
Energy Commercialization
EC is dedicated to enabling energy projects by transitioning bench-scale systems through pilot testing, demonstration, and then full deployment. Its mission is to assist organizations in enhancing energy security and managing and reducing carbon emissions
• Commercialization pathway development

7
ICES Overview
• Supersonic expansion of compressed flue gas results in CO2 desublimation (high velocity → low p & T)
• Inertial separation of solid particles instigated by turning the supersonic flow
• CO2-rich capture stream is removed and processed
• CO2-depleted stream is diffused and sent to stack

8
Thermodynamics of ICES on a P-T Diagram
0.0
2.0
4.0
6.0
8.0
10.0
12.0
0.001
0.01
0.1
1
10
100
50 100 150 200 250 300
Mac
h N
umbe
r
Pres
sure
[bar
]
Temperature [K]
Isentropic Expansion of 14mol% CO2 in N2 Relative to Phase Diagram of CO2
Triple Point
Partial Pressure of CO2during Isentropic Expansion in Supersonic Nozzle(p0=2bar, T0=300K)
Region of incipient condensation
Gas Phase
Liquid Phase
Solid Phase
Post Condensation
Path

9
Some key numbers for reference
X
X
X
X
Water Drain
Compressor/HEX
HEX
Cyclone separator (slip gas + CO2)
Solid CO2
Capture Duct
CO2 accumulation & self pressurization system
Flue gas from FGD
Supersonic expansion
X
16
T=330KP=1.05 atm15% CO2
18
T=300KP=1.03 atm
19
T=300KP=2.0 atm
22
T=400KP=1 atm<1.5% CO2
T=298KP=150 atm>99.5% CO2
21
20
Subsonic diffusion

10
Key Advantages of ICES over other options
• No moving parts (after start)
• No chemicals/additives or other consumable media
• No refrigeration expense – low temperatures from supersonic expansion
• Inexpensive construction (concrete, sheet metal)
• Small footprint
• ICES units in test are equivalent to 250-500kW slip stream
• The latest unit (250kW) is 96” x 24” x 3”
• Small size enables distributed deployment for other process applications in the petroleum and chemical industries
• Availability of “cold sink” in solid CO2 accumulated

11
ICES Development Challenges
• Development of optimized supersonic contour to maximize particle size/migration and minimize pressure losses
• Minimization of “slip gas” that is removed with solid CO2
• CO2 purity unknowns - other flue gas impurities that condense will be removed with the CO2
• Solid CO2 management/self pressurization
• This really is rocket science….but once the design is complete, it is easy and inexpensive to build and operate

12
Summary of test activity under IMPACCT
Gen1a and 1b (swirl)
Gen2 (2D)
Gen3 (2D - long)
VIDEO

13
ICES Unit Illuminated With Laser Sheet
3000 lb/hr flow unit, equivalent of ~0.3MW power

14
Representative Laser Sheet Image
Splice of images 601-68 and 602-33
Flow direction
Upper wall
Bottom wall
Migrating CO2 flow
Tests were conducted at nominal conditions (Pc=30 psia, 20%wt CO2) with pressure variation to 70 psi and concentration variation to 30%wt. Apparent migration of the CO2 stream towards upper wall was observed. Near duct exit white solid CO2 stream occupied ~50% of the duct height.

15
CO2 Particle Injection in Plenum
CO2 particle injection at ~10+ micron SMD at ~5% of the total flow was arranged in order to: 1) Observe migration of these particles and 2) Promote agglomeration with particles formed from main CO2 flow
Liquid CO2
CO2 particles
Shroud injector based on AFIT design and results
ICES inlet manifold

16
CO2 Particle Injection Results
a. Air+5% “liquid” CO2
b. Air+5% “liquid” CO2 +20% gaseous CO2
c. Air+20% gaseous CO2
GC probe reading: 0% CO2 Image: bright layer at the upper wall, individual particles are seen in the near upper wall flow (see next chart)
GC probe reading: ~20% CO2 Image: very bright layer at the upper wall, individual particles are seen in the near upper wall flow
GC probe reading: ~20% CO2 Image: some migration is visible

17
CO2 Particle Injection Results - Flow structure
Conclusion: When reasonably large particles are present in the flow, they migrate rather close to the upper wall - particle growth strategy focus of current activity
CO2 particles
Bright layer at the wall
Region of future capture duct

18
Results and Further Plans (CO2 particle injection)
• The most important result is that migration of 10+ micron CO2 particles was demonstrated
• Migration occurs only in the turning duct • Particles did not interact with gaseous and solid CO2 (too few particles?) • Particles appeared to be too big to promote agglomeration • For the current phase of the study, generation of smaller particles is planned
(~2-3 microns)
Particles do not favor top or bottom wall in the upstream (un-turned) flow
Particles migrate to the top wall in the turning duct

19
A preliminary Techno-economic assessment by WorleyParsons (WP) determined: • Cost of electricity (and increase in COE over non-capture case) • Levelized cost of electricity • Cost of CO2 captured • Cost of CO2 avoided
WP also evaluated overall efficiency of the different plant configurations. Key efficiency/economic numbers are provided in the table below:
Resulting lower COE increase for ICES technology is based on lower capital and O&M costs and improvements in the overall plant efficiency A path to the DOE research goal of 35% COE increase is being developed based on a more detailed capex/labor model and reduced flue gas compression (PR=2.0 vs 2.5 used in WP analysis)
Metric Case 11 Case 12, Amine Plant ICES Plant
CO2 capture no yes yes Net plant efficiency (HHV basis) 39.3% 28.4% 34.5% COE % increase base 77% 42% Parasitic Load 5.5% 20.5% 7.3% Cost per ton of CO2 captured NA US$ 62.8 US$ 41.8 Cost per ton of CO2 avoided NA US$ 90.7 US$ 48.4
ICES Economic Impact (WP analysis)

20
Full Scale ICES Plant Configuration (for 545MW PC plant)
• 545MW power level requires an array of twelve full-scale ICES nozzles • Modular arrangement allows operation of the system in 1/12th increments of plant power thereby
permitting efficient load-following • The twelve units can be arranged in a one row or in multiple rows. They can also be stacked with
other equipment.

21
ICES Plant Layout and Footprint
Boiler Exhaust Stack
Flue Gas Desulfurization
(FGD)
Continuous Emission
Monitors (CEMs)
Precipitator
Axial Compressors (3)
Air Coolers Captured CO2
processing
ICES Units
Direct Contact Cooler (DCC)
Unique Equipment for ICES System
The ICES footprint of ~8,000 m2 compares to 20,000 to 30,000 m2 for an amine plant of similar capacity. ICES nozzle and compressor stacking can further reduce footprint by 30-40%.
22
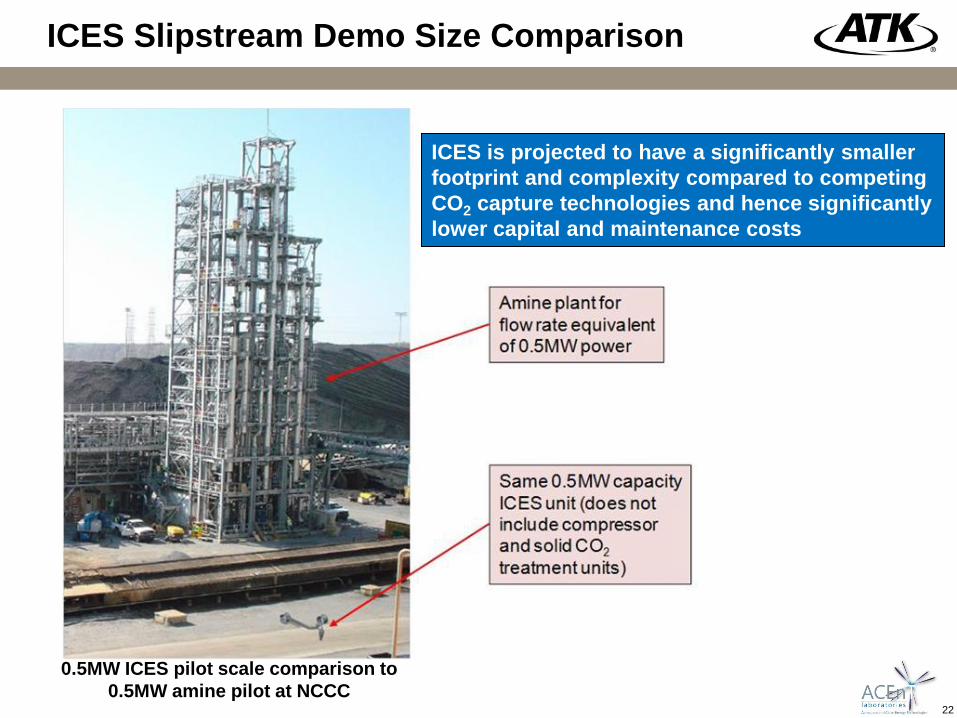
ICES Slipstream Demo Size Comparison
0.5MW ICES pilot scale comparison to 0.5MW amine pilot at NCCC
ICES is projected to have a significantly smaller footprint and complexity compared to competing CO2 capture technologies and hence significantly lower capital and maintenance costs

23
Plan of Attack for Current Effort
Three-phase plan addresses the key challenges and risks: Budget Period 1: Demonstration of solid CO2 particle growth methods at lab-scale. Demonstration of the separation and capture of migrated particles at bench scale using
surrogate controlled CO2 particle injection. Demonstration of the diffusion of the CO2-depleted flue gas flow to atmospheric pressure
with losses consistent with projected system economics. Budget Period 2: Bench-scale demonstration of CO2 particle growth methods supporting particle sizes
required for effective migration and separation.
Budget Period 3: Demonstration of the ICES process including condensation, migration, CO2 removal and
diffusion of the CO2-depleted flue gas flow to atmospheric pressure. Updating the ICES techno-economic analysis showing a path to meeting the DOE carbon
capture goals.

24
Top Level Project Schedule
Tasks Q1 Q2 Q3 Q4 Q5 Q6 Q7 Q8 Q9 Q10 Q11 Q12Task 1. Program ManagementTask 2. Lab-scale Condensation/Growth InvestigationTask 3. Analytical and Computational InvestigationTask 4. Bench-scale Capture and Diffuser TestingTask 5. Bench-scale Condensation/Growth TestingTask 6. Integrated SystemTask 7. Plant Integration and Techno-economic Analysis
QuartersBudget Period 1 Budget Period 2 Budget Period 3

25
Milestone Summary and Tracking
Budget Period
Task or Subtask
# Milestone Number and Description Planned
Completion Actual
Completion Verification Method
1 1 MS 1. Updated Project Management Plan 10/31/2013 10/28/2013 Project Management Plan document
1 1 MS 2. Kickoff Meeting 12/31/2013 11/14/2013 Presentation held at NETL with electronic copy
1 4 MS 3. Capture duct/diffuser demonstration complete
09/25/2014 Presentation file, Quarterly Report with data summary
2 1 MS 4. Updated Project Management Plan 10/27/2014 Project Management Plan document
2 5 MS 5. Bench scale condensation/growth testing complete
09/23/2015 Presentation file, Quarterly Report with data summary
3 1 MS 6. Updated Project Management Plan 10/26/2015 Project Management Plan document
3 7 and 8 MS 7. Techno-economic analysis (TEA) and EH&S Assessment complete
9/20/2016 TEA and EH&S documents, Quarterly Report
3 6 MS 8. Integrated system testing complete 9/15/2016 Presentation file, Quarterly Report with data summary
3 All MS 9. Final report complete 12/31/2016 Final report document
26
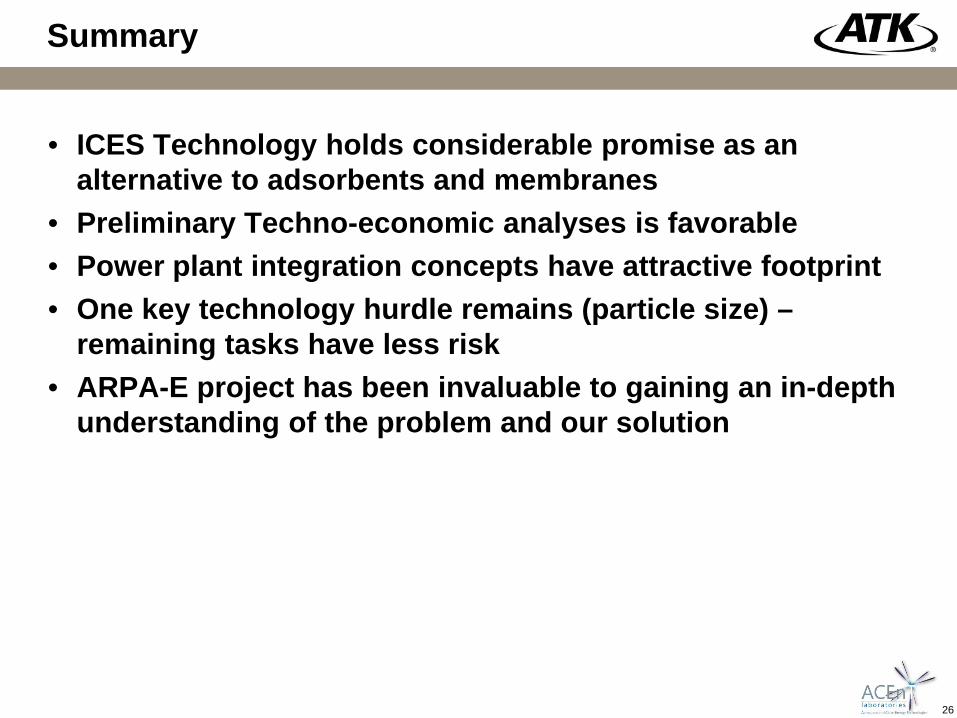
Summary
• ICES Technology holds considerable promise as an alternative to adsorbents and membranes
• Preliminary Techno-economic analyses is favorable • Power plant integration concepts have attractive footprint • One key technology hurdle remains (particle size) –
remaining tasks have less risk • ARPA-E project has been invaluable to gaining an in-depth
understanding of the problem and our solution

27
BACKUP
28
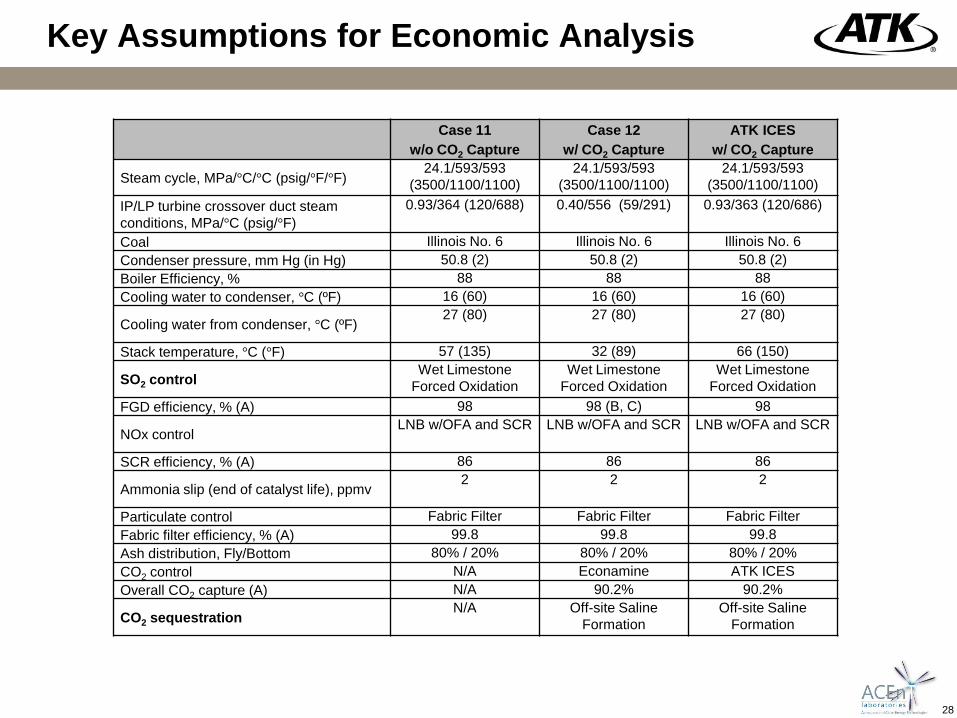
Key Assumptions for Economic Analysis
Case 11 w/o CO2 Capture
Case 12 w/ CO2 Capture
ATK ICES w/ CO2 Capture
Steam cycle, MPa/°C/°C (psig/°F/°F) 24.1/593/593
(3500/1100/1100) 24.1/593/593
(3500/1100/1100) 24.1/593/593
(3500/1100/1100) IP/LP turbine crossover duct steam conditions, MPa/°C (psig/°F)
0.93/364 (120/688) 0.40/556 (59/291) 0.93/363 (120/686)
Coal Illinois No. 6 Illinois No. 6 Illinois No. 6 Condenser pressure, mm Hg (in Hg) 50.8 (2) 50.8 (2) 50.8 (2) Boiler Efficiency, % 88 88 88 Cooling water to condenser, °C (ºF) 16 (60) 16 (60) 16 (60)
Cooling water from condenser, °C (ºF) 27 (80) 27 (80) 27 (80)
Stack temperature, °C (°F) 57 (135) 32 (89) 66 (150)
SO2 control Wet Limestone
Forced Oxidation Wet Limestone
Forced Oxidation Wet Limestone
Forced Oxidation FGD efficiency, % (A) 98 98 (B, C) 98
NOx control LNB w/OFA and SCR LNB w/OFA and SCR LNB w/OFA and SCR
SCR efficiency, % (A) 86 86 86
Ammonia slip (end of catalyst life), ppmv 2 2 2
Particulate control Fabric Filter Fabric Filter Fabric Filter Fabric filter efficiency, % (A) 99.8 99.8 99.8 Ash distribution, Fly/Bottom 80% / 20% 80% / 20% 80% / 20% CO2 control N/A Econamine ATK ICES Overall CO2 capture (A) N/A 90.2% 90.2%
CO2 sequestration N/A Off-site Saline
Formation Off-site Saline
Formation

29
ICES Heat and Material Balance
SCR
BAGHOUSE FGD
STACK
1AIR
3,501,716 W59.0 T14.7 P13.0 H
4AIR
1,075,690 W59.0 T14.7 P13.0 H
51,075,690 W
78.0 T16.1 P17.5 H
2
3,501,716 W66.0 T15.3 P14.8 H
780,920 W
59.0 T14.7 P13.0 H
3
126,595 W66.0 T15.3 P14.8 H
6
179,291 W78.0 T16.1 P17.5 H
10
5,114,896 W59.0 T14.7 P
140.7 H
11 ASH36,119 W
125,078,777 W
59.0 T14.7 P
132.8 H
13
5,078,777 W59.0 T14.7 P
138.0 H
ICES CO2 CAPTURE PROCESS
18
5,358,549 W136.0 T
14.9 P129.6 H
22
3,444,185 W150.0 T
16.5 P18.0 H
8 COAL465,600 W
59.0 T14.7 P
LEGEND
AIR
COAL/ASH
STEAM
HEAT AND MATERIAL FLOW DIAGRAM
ATK ICES CO2 CAPTURE CASE PULVERIZED COAL BOILER AND
GAS CLEANUP SYSTEMS
PAGEDRAWING NUMBER:
PROJECT:
AMMONIA
26
4,100,215 W1,100.0 T
655.8 P1,570.2 H
24
5,024,628 W1,100.0 T3,514.7 P1,494.7 H
THROTTLE STEAMTO HP TURBINE
SINGLE REHEAT TO IP TURBINE
254,100,215 W
668.0 T710.8 P
1,324.9 H
SINGLE REHEAT EXTRACTION FROM
HP TURBINE
0
5,024,529 W545.5 T
4,185.0 P539.3 H
FROM FEEDWATER HEATERS
LIMESTONE SLURRY
GYPSUM
14153,194 W59.0 T15.0 P
17 79,862 W136.0 T
14.9 P
15
433,364 W59.0 T14.7 P
16
52,827 W333.0 T
45.0 P76.4 H
CO2 PRODUCT TO PIPELINE
FLUE GAS
NOTES:1. ENTHALPY REFERENCE POINT IS NATURAL STATE AT 32°F AND 0.089 PSIA.
MAKE-UP WATER
OXIDATION AIR
DRY ICE MELTING PROCESS
19
4,877,099 W74.0 T36.5 P
-906.7 H
21
991,331 W95.0 T
2,214.6 P-3,931.0 H
201,019,037 W
-150.0 T4.4 P
-3,980.4 H
CONDENSATE HEATER
S-3,444,185 lb/hr
296.0 °F16.7 psia
COOLANT FROM DRY ICE MELTING PROCESS
COOLANT TO DRY ICE MELTING PROCESS
AUXILIARY COOLING TOWER
FLUE GAS COMPRESSOR
DIRECT CONTACT COOLER
CONDENSATE HEATER
DIRECT CONTACT COOLER
COOLANT FROM DRY ICE MELTING
PROCESS
AIR COOLER
DIRECT CONTACT COOLER
23
29,091 W90.0 T
144.9 P-6,735.6 H
WATER FROM CO2
ATK ICES
P ABSOLUTE PRESSURE, PSIAT TEMPERATURE, °FW FLOWRATE, LBM/HRH ENTHALPY BTU/LBM
PLANT PERFORMANCE SUMMARY
GROSS PLANT POWER: 590 MWeAUXILIARY LOAD: 40 MWeNET PLANT POWER: 550 MWeNET PLANT EFFICIENCY, HHV: 34.5%NET PLANT HEAT RATE, HHV: 9896 BTU/kW
PULVERIZEDCOAL
BOILER

30
Power Plant Steam Cycle with ICES