superposition of functional contours based prosodic
TRANSCRIPT
Superposition of Functional Contours Based Prosodic Feature Extraction forSpeech Processing
Shahid Ali Mahar1, Mumtaz Hussain Mahar1, Javed Ahmed Mahar1, Mehedi Masud2,Muneer Ahmad3, NZ Jhanjhi4,* and Mirza Abdur Razzaq1
1Department of Computer Science, Shah Abdul Latif University, Khairpur, 66020, Sindh, Pakistan2Department of Computer Science, College of Computers and Information Technology, Taif University, P.O. Box 11099, Taif, 21944,
Saudi Arabia3Department of Information Systems, Faculty of Computer Science & Information Technology, Universiti Malaya, Kuala Lumpur,
50603, Malaysia4School of Computer Science and Engineering, SCE, Taylor's University, Malaysia�Corresponding Author: NZ Jhanjhi. Email: [email protected]
Received: 05 December 2020; Accepted: 14 March 2021
Abstract: Speech signal analysis for the extraction of speech elements is viablein natural language applications. Rhythm, intonation, stress, and tone are theelements of prosody. These features are essential in emotional speech, speechto speech, speech recognition, and other applications. The current study attemptsto extract the pitch and duration from historical Sindhi sound clips using the func-tional contours model’s superposition. The sampled sound clips contained thespeech of 273 undergraduates living in 5 districts of the Sindhi province. SeveralPython libraries are available for the application of this model. We used theselibraries for the extraction of prosodic data from a variety of sound units. The spo-ken sentences were categorically segmented into words, syllables, and phonemes.A speech analyzer investigated the acoustics of sounds with the power spectraldensity method. Meanwhile, a speech database was divided into parts containswords of different sizes (ranging from 1-letter to 5-letter words). The results illu-strated the production of both minimum and maximum μ sound durations andpitches from the inhabitants of Khairpur and Ghotki districts, respectively. Bothdistricts lie in the upper part of the Sindh province. In addition, the second para-meter approach, observed versus obtained, was used to compare outcomes. Weobserved 5250 and 4850 durations and pitches, respectively.
Keywords: Intelligent systems; speech signal analysis; pitch; duration;Superposition of functional contours; prosody extraction; Sindhi speech analysis
1 Introduction
Over the past decade, attention toward prosody generation has been increasing, with the aim to obtainthe maximum accuracy in speech-based software applications. Academics interpret the term prosodydifferently. Still, most agree that prosody is a collection of prosodic features, i.e., pitch, voice quality,
This work is licensed under a Creative Commons Attribution 4.0 International License, whichpermits unrestricted use, distribution, and reproduction in any medium, provided the originalwork is properly cited.
Intelligent Automation & Soft ComputingDOI:10.32604/iasc.2021.015755
Article
echT PressScience

loudness, rhythm, speech rate, and pauses. These features help us to understand what individuals are saying[1]. Prosodic feature information is worth recognizing in spoken languages. Furthermore, prosody generationis an essential module for various speech processing (SP) applications, including speech understanding,speech synthesis, text to speech, speech recognition, and emotional speech. This module supports thegeneration of natural sounds. Generally, we obtain prosodic information symbolically and acoustically.The acoustic-based approach is useful for experimenting with Sindhi prosody because it relies on featuresof sound forms rather than complete knowledge of consonants, vowels, and other linguistic components.
The Sindhi language is rich in phonic treasures and contains a large variety of sounds [2,3]. It alsopossesses complex accent variations that hinder SP applications. Sindhi is a diacritics-based language thatpresents unanticipated differences in homographic words. Sindhi people frequently use homographic wordterms and diacritic marks. We can observe our system’s adverse output with an input of homographic wordsexceeding a maximum. Tab. 1 presents a sample of homographic words having sound variations.
The core purpose of the present research is to extract prosodic features, i.e., pitch and duration, fromsound clips of syllables and phonemes. These features are essential elements for SP application for theSindhi language [4] and will help generate the other prosodic features, such as rhythm, stress, andloudness. The generation and analysis of prosody are very intricate due to their relationship with multi-level and multi-nature data. Moreover, prosodic data correct the sentence’s accent for the entire process ofautomatic speech processing software application [5].
Academics have realized the importance of prosody generation to produce more accurate natural sounds.Several procedures have been suggested and applied to sound units, and commonly used approaches includethe neural network [6,7], rule-based model [8], probability-based model [9], superposition of functionalcontours (SFC) model [10,11], and Fujisaki parameters model [12]. SFC modeling is selected here toobtain Sindhi prosodic information; note that there is no concrete reason for selecting a specific type ofSFC approach. Furthermore, there is a limited amount of research on the extraction of prosodic data forthe Sindhi language [1,13]. This paper presents a practical application of SFC sound units. Moreover,introducing a neural network top-down approach makes this model useful for resolving phonologicalissues [14]. Our research aims to extract the prosodic information from sound units because SPapplications cannot produce natural sound without such details.
Table 1: Sample Homographic Words Showing Variation in Sounds
184 IASC, 2021, vol.29, no.1

2 Literature Review
Sindhi phonetics, being one of the most complicated Indo-Aryan languages in terms of phones, hasattracted researcher attention. The work of Shaikh [3] elaborated on the Sindhi phonological issuesexplicitly. A comparison was made among different accents, showing the waveform images as thesolution to the discovered problem. Mahar [2,15] added a letter to sound conversion and demonstrated anf0 peak of syllables of short and long vowels. Abbasi [16,17] analyzed the fundamental frequency of theSindhi language, focusing on pitch, intonation, and stress. Meanwhile, Keerio [18] examined Sindhisounds using acoustic analysis and worked on VCV sounds in experiments and focused on liquid soundsin addition to trill and lateral consonants. Building upon this work, Mahwish [19] worked on differentvowels to evaluate vocalic characteristics and made inter-lingual comparisons of vowels of the Sindhilanguage along with languages spoken in Pakistan using PRAAT for experiments.
Prosody data are essential for speech processing applications of any language. Mahar [1,13] performedexperiments on Sindhi prosody using recorded sounds. They recruited university undergraduates to producerecorded sound samples. They then investigated the pitch and duration of 1960 sound clips of male andfemale individuals using PRAAT. Prosodic data were collected, and using a backpropagation neuralnetwork resulted in an accuracy rate of 98.8%.
In our literature review, we could find literature on prosody generation of Arabic script-based languageslike Persian. However, we could not find literature on Arabic and Urdu, and thus we here present availableresearch contributions for other languages. This does not affect the quality of our work since the inputs aresound units.
We used the sound units of numerous languages to extract prosodic information. Breen [20]implemented event-based approaches for the representation of implicit prosodic details and comparedtheir performances to those of [x]. Prosody was generated by Chiange [21] precisely for the mandarinlanguage TTS system. The researcher used two linguistic features of the language to accomplish this.Nigel [22] also worked on prosody generation and suggested several prosody constructions as wellconfigurations to create relationships among various prosody units. Similarly, Nidhal [23] proposed somespeech unit techniques based on instances by considering the unit structure. The unit placement in thesound and the succeeding and preceding syllables are used in the Arabic TTS system. Obin [24] talkedabout the impediments regarding metric and linguistics mainly for different prosody events. To modelsound prosody structure, the HMM was used following a chain of linguistic processing with rich andfurnished inputted text arrangement. Meanwhile, Talman [25] introduced the NLP dataset with propernaming, as well as a benchmark of prosody. The dataset predicted significant prosody from the sound ofdescriptive sentences; moreover, by employing a neural network and feature-based classifier, prosodygeneration models were trained on the dataset.
Mixdroff [26] investigated different fundamental quantitative prosodic highlights, i.e., the prosodicinformation extracted from male speakers. They employed the Fujisaki model for the implementation ofsyllabic feature extraction. The Fujisaki model is a quantitative model preferred by scientists to shape theselected dialects’ sound. Given the rising programming applications in human–computer interaction, speechfusion and identification are frequently employed by analysts [27]. Using Fujisaki modeling, James [28]utilized verbal manifestations to conduct contour experiments, including selected human emotions.
The SFC model is best for Sindhi prosody generation tasks because it can disintegrate the prosodyprimary forms that are significant. Moreover, for learning the fundamentals of prosodic structures, theSFC model is based on neural networks. Gerazov [10] introduced a unit in which the model is based on arhythmic component. Bailly [11] proposed a model by building an information-based programmingapplication for prosody generation. Meanwhile, an ordinary SFC model was applied in [29] for prosodygeneration. The advanced SFC modeling version is known as weighted SFC, and functions by bordering
IASC, 2021, vol.29, no.1 185

each contour generator. The generators are then scaled with different designs given in [30]. Rhythmic units(RU) are estimated with multi-parametric counters at a specific range. The model then computes theprovisions relying on the ranges given in the sentences. The mono-layer neural network is based on thiscontour generator module, and thus associated with the specific RUs [31]. The researchers also discussedappropriate the position of units in the provided contour range.
3 Research Methodology
The research methodology for Sindhi prosody extraction is based on six phases: analysis of theliterature, introduction to the SFC model, development of a speech corpus, and its’ accumulationaccession, implementation of SFC using Python libraries, process execution, and reviewing the acquiredresults. Fig. 1 shows a flowchart of the research methodology. After the critical and systematic analysis ofprosody modeling, we present the limitations of Sindhi prosodic information extraction using prosodymodeling techniques, and then discuss the weighted SFC.
The third component of this research is about the speech corpus collection because researchers reportedthat the speech corpus is an important component for prosody extraction. Hence, we selected male andfemale personnel for the collection of speech units. The selected personnel recorded sounds of the
Figure 1: Research Methodology
186 IASC, 2021, vol.29, no.1

provided descriptive sentences. These recordings comprised our speech corpus and were further processedand segmented into words, syllables, and phonemes, and then stored. With the help of Python libraries, theSFC model was applied to the speech corpus. During this process, frequencies of Sindhi sounds at thesyllable level were analyzed acoustically. The power spectral density (PSD) was used for the analysis ofspeech signals and the computation of recorded sounds. However, we separately calculated the soundduration and pitch of Sindhi phonemes and syllables. The obtained results are presented in both tabularand pictorial formats.
4 Superposition of Functional Contours
The SFC model decomposes prosodic structures into primary forms relevant to the essential functions’contours. The method is suitable for language encoding using the prosody of a language. In addition to this,the generators based on the neural network use the SFC model for learning the primary prosodic forms. Sucha model helps us to detect the internal linguistic issues of signals and aids subsequent processing. The modelmanipulates signals and outputs of sound units; the entire model is based on rhythmic units, as suggested byGerazov [10]. The model presents a solution for a multifunctional phoneme in terms of energy, rhythm, andtheme. The model follows the data-driven framework to produce prosody. Bailly [11] suggested such a modelwhile developing a data-based software application for prosody generation.
Fig. 2 shows the different levels and stages of the model. The SFC model strictly follows some fixedstages which are well-structured. In this way, multiple parameters are associated with meta-functions oflanguage. The elements of acoustic data are given to the synthesizer for further processing. It undergoesthe process with a selection of suitable functions connected with prosodic information generation. Thestudy in [29] applied a typical SFC model for prosody modeling. With the capacity to deal with prosodycorpus and classified sound clips collection, two datasets were used. Both datasets were composed oflabeling and stylizing processes.
An advanced version of SFC is weighted SFC (WSFC). This version functions by adjoining eachcontour generator and scaling them with other architectures [30]. WSFC has a weighted contourgenerator. We illustrate WSFC in Fig. 3. The generator estimates a multi-parametric contour for allrhythmic units (RU) individually. The model makes calculations depending on the context of the contentsgiven in the sentence.
Figure 2: Model representation of SFC for prosody
IASC, 2021, vol.29, no.1 187

The contour generator module is based on a mono-layer neural network. Thus, it agrees with the exactRUs and relevant placement in the given range of created prosodic contour for the particular syllable andphoneme [31]. The module can obtain a vector with linguistic data and prosodic information.Furthermore, the variational prosody model (VPM) introduced in [10] and based on SFC standards wasused to model Sindhi prosody because this approach assimilates contour generators inside an architectureof the network. The VPM overlaps linguistic functions in rhythmic units. We train the VPM using theloss function and maximum mean discrepancy (MMD) to normalize the system, and the mean squareerror (MSE) for restructuring. Eq. (1) is used as discussed in [10].
L ¼ LMSE þ �LMMD ¼ 1
N
XN�1
n¼0f � f^Þ2 þ �DMMDðqf zð Þjjp zð ÞÞ ð1Þ
�
Here, the original and reconstructed prosody contours are f, and f^ prosody sample per syllable isrepresented with N. For the duration coefficient and pitch targets, we have N-1. � is the regularizationcoefficient, and for the estimation of borderline inference distribution DMMD is used on the dormant spaceðqf zð Þ and the prior p(z). The MMD intelligently measures the distance between the obtaineddistributions. Among the two models discussed above, the weighted SFC is used for experimenting withSindhi prosody due to the availability of neural network features.
5 Speech Corpus Collection
A simple random method is used to select the mean of known speakers with Eq. (2). ME is the margin oferror, alpha is used to estimate the confidence level, z is used to check the standard score, N is the totalnumber of speakers, and σ is used as input to get the speakers’ variance. Using this equation,273 speakers are selected for developing the speech corpus. The individuals belong to five districts Sindhof province, i.e., Khairpur, Sukkur, Ghotki, Shikarpur, and Larkana. There are two reasons for theselection of these speakers. (1) Author affiliation is with the district Khairpur, and (2) the undergraduates
Figure 3: Architecture of weighted SFC
188 IASC, 2021, vol.29, no.1

recruited for this study belong to these five districts. The detailed information of individuals is given in [1]and presented in Fig. 4. Students were between 19 to 22 years old. Since the quality of sounds decreases withan individual’s age, having an age range was important. Sindhi is divided into six dialects, and the selectedundergraduates spoke Sindhi with the Siroli dialect. Other dialects also need to be studied so that SPapplications can produce more natural Sindhi sounds; this may be a direction for future work.
n ¼ z2 � r2 � N
N � 1
� �� �= ME2 þ z2 � r2
N � 1
� �� �(2)
Eight utterances of 65 sentences were randomly taken for recording. We preferred the PRAAT softwarefor recording these sentences. SFC is implemented on our developed Sindhi speech corpus. The recordedsounds are segmented using the algorithm proposed by Esposito [32]. The algorithm works on varyingfeatures such as speech frames collected using the short-term investigation of speech signals. The words,syllables, and phoneme boundaries are fixed based on sharp transition events. Hence, we used the fittingprocedures in the speech segmentation algorithm. The sharp transitions are joints that perceive the similarframe n into an exclusive sign of unit-like syllable and phoneme boundary. Throughout parametersegmentation, c is used to identify the number of successive frames required to approximate the intensity.Feature t is fixed as a threshold and used when the intensity increases, and transitions from one syllableor phoneme to another by the fitting procedure represented by w. The following equations areimplemented for the segmentation of recorded sounds.
J ci n½ � ¼ jXn�1
m¼n�c
xi m½ �c
�Xnþc
m¼nþ1
xi m½ �c
j (3)
fn0 ¼ minn2 p;q½ �f n½ � (4)
f n½ � ¼Xq
m¼p
Xk
i¼1S m:ið Þ n� mj j 8n 2 p; q½ � (5)
c represents the width of the frame interval, and t is a threshold. We calculate w for the frame’s width whenthe fitting function found the boundaries of sound units; S is a matrix, and i is a time sequence at frame n.Furthermore, recorded sound clips were broken down into words, syllables, and phonemes. This led to a totalnumber of 1960 segments. We analyzed and segmented sound units through a PRAAT speech analyzer. Mostrecorded sentences were taken from [1,13] and stored in separate directories. We gave a limited number ofsentences to speakers for recordings—however, a larger speech corpus was required to get the maximumprecision from the system. A sound-free environment was not available at the university, and the
0
5
10
15
20
25
30
Khairpur Sukkur Larkana Shikarpur Ghotki
Selected Districts
20 Years
21 Years
22 Years
Num
ber
of S
elec
ted
Spea
kers
Figure 4: District wise statistics of selected speakers
IASC, 2021, vol.29, no.1 189

managers of Radio Pakistan Khairpur provided only a short time for recording. Hence, we could only recorda limited number of sentences. Two datasets of sounds were created and grounded with directories ofphonemes and syllables. These datasets contained 203 phonemes and 143 syllables respectively. A totalnumber of 346 sound units were experimented with the SFC model. The developed corpus was enoughfor our experiments, but we realize that a large-scale speech corpus would better train the prosodyextraction system.
6 Python Libraries
The SFC model uses different methods for synthesizing the sound units. Programming languages areinspired by the SFC model and provide maximum support to implement the model. Python has variouscommands, built-in functions, and libraries through which prosodic information can easily be extractedfrom different sound elements without hard integration efforts. The PySFC library was established forvarious sound tones and their statistical data representation. The PRAAT library, which is more suitablefor speech analysis, is associated with PySFC. We fix this combined approach in the file PySFC.py,which is typically used to deal with the maximum contour utterances. Python offers many functionalitiesto the developers of speech processing, including the composition and implementation of the neuralnetwork model.
We already discussed that RUs are critical in the SFC model, and we can standardize RUs with availablefunctions. This assures model performance by utilizing an earlier tone of a sound unit. Phonemes andsyllables have different segmentation procedures, and the context path is obtained using the Python filepy. Python’s core features are SciPy and NumPy, which directly pertain to the extraction of prosodicinformation. Hence, we chose these libraries to implement and extract the prosodic information ofdifferent Sindhi sound units. Furthermore, Spyder cells were used for programming and acquire thephonemic and syllabic information from sound units.
7 Implementation and Results
The extraction and examination of pitch and duration prosodic features from Sindhi sounds areconsidered significant tasks in this project. While we experiment with pitch and duration features,intonation, stress, and rhythm are also valuable features that needed an extraction. We acknowledge thatwe are failing to accomplish the entire task, but do present milestones that can be of use to otherresearchers. In the present study, we employ the SFC model, Python libraries, and the developed soundunits database. The mean values of durations in ms and pitches in Hz are calculated and presentedbecause it is hard to depict all values in table format. We classify the word sounds into 1 letter words(1LW), 2 letter words (2LW), 3 letter words (3LW), 4 letter words (4LW), and 5 letter words (5LW) forclearer understanding and comparison of received pitches and durations.
7.1 Execution of Python Libraries
Software developers always call different libraries to maintain and deal with files of different natures.The computations of duration, pitch, and amplitude are also handled by Python’s libraries. Callinglibraries is not automatic, and we use Jupiter to call the libraries. In contrast, the neural network isautomatically called and executed when the Python libraries are called. Librosa is another Python librarythat supports examining sound units. This library should explicitly be installed for getting the variousfunctions required to obtain the prosodic information, i.e., pitch and duration. All the necessary stepshave been taken regarding the installation of Librosa to accomplish prosodic information. Librosalibraries have sufficient skills to fetch the required information from the speech datasets developed forphonemes and syllables experiments. The “librosa” core is one module that needs to be imported in the
190 IASC, 2021, vol.29, no.1
programming code. The package Glob is required because the project contents are not directly imported fromthe local drive, i.e., it is impossible to call all the files needed at a time with the exact file extensions intogenerated directories.
The “matplotlib” library provides full services to generate a plot for the sound unit’s inputted file. Itpresents the prosodic information graphically for further processing and analysis. The “Glob” libraryrecognizes the variable named “data_dir.” This variable is tied to the “wav” file format. Subsequently,“NumPy” organized all inputted data into different arrays. The distribution of the data frames is theresponsibility of Panda. Another package called “matplot” constructs us a custom graph.
Furthermore, the function “Len” finds the length of the sound files stored in directories. The Librosalibraries manage and assess nearby contour locations. A novel mechanism is developed and implementedin this project after importing all the necessary files and libraries for extracting the pitches and durationsinformation. It is also essential to examine various sound units. Hence, we used a spectrogram and PSD.The duration and pitches of every sound unit are calculated using the developed code (in Pythonlanguage) and the built-in libraries of Python. We conducted the experiments using the weighted SFCarchitecture.
7.2 Acoustic Analysis of Sentences
Our dataset consists of many sentences for the analysis of sound pitch. The current study tested tendatasets. The impression of low and high frequency sound waves is referred as the low and high pitches[16]. We computed amplitudes, possible differences, and pitches to ensure the quality of the sounds.amplitude() acquired the variance between multiple sounds. Moreover, we analyzed all the sentencesseparately in terms of duration and quality. The given process is adopted and applied repeatedly tocomplete the task with an input of ten sentences.
Various sound reflection characteristics were evaluated in terms of a coefficient or a power spectral. Theselected characteristics were based on the sound’s quality and capacity. Several forms of a sound may appearas an alpha or a bright reflection. The fed sentences’ data differ from each other both males and femalesprovided recordings. The fluctuations and differences may be observed at the syllable levels whenutterances are analyzed. In total, 300 syllables are analyzed.
We produce a spectrogram from a range analyzer with a fine count of frequencies available in a speechdatabase at the current time. The darker areas in the graph represent extraordinarily low power frequencies.
7.3 Syllables Frequencies
Phonemes and syllables are the smallest parts of speech sounds. We stored segmented syllables in tendirectories for experiments. It is rather hard to put them in some arrangement like NumPy and Panda librariesdo at this preliminary stage. We put a time series into an image format based on the many syllables, frequencyof vowels. In addition to this, some extra elements are studied, like the power spectral of sound clips.
We view all the wave spectra in isolated form before observing their signal spectrograms. We do this tosee whether they are of low or high Hertz. This process helps us to examine the level of sound energy takenon different scales of time. The x axis in the spectrogram shows the time and the y axis shows the frequency,and the colors indicate the amplitude. Bright colors show the strength of the frequency of the FFT plot.Hence, the lower frequencies (from 0–1 kHz) are strong ones. This is how we may distinguish thefrequencies from each other. Furthermore, the acoustic information of sentences and frequency-basedinformation of the syllabus is compulsory for extracting the sound’s prosodic information.
IASC, 2021, vol.29, no.1 191
7.4 Power Spectral Density of Syllables
The PSD is a technique commonly used to define the power of speech-based signals with the unit offrequency [33]. PSD is widely used in various applications, including speech analysis and synthesis [34].The waves represent the amplitude of sound units; and by using the sound waves, prosodic informationcan be analyzed and extracted. Hence, the PSD approach is applied to segmented sounds of syllables inthe present work. We analyzed ten recorded sentences in Sindhi based on this approach. PSD has theability to modulate and characterize the carrier owing along with bandwidth. Likewise, we computedvarious speech units by considering their features properties. In the entire process of PSD calculations,the power of 10 is used for getting approximate results.
Additionally, we pay special attention to the isolation of modules. The same is done to obtain30 syllables from the aforementioned directories. This is useful for the recognition of noise in the sound clips.
7.5 Mean Syllable Sound Durations
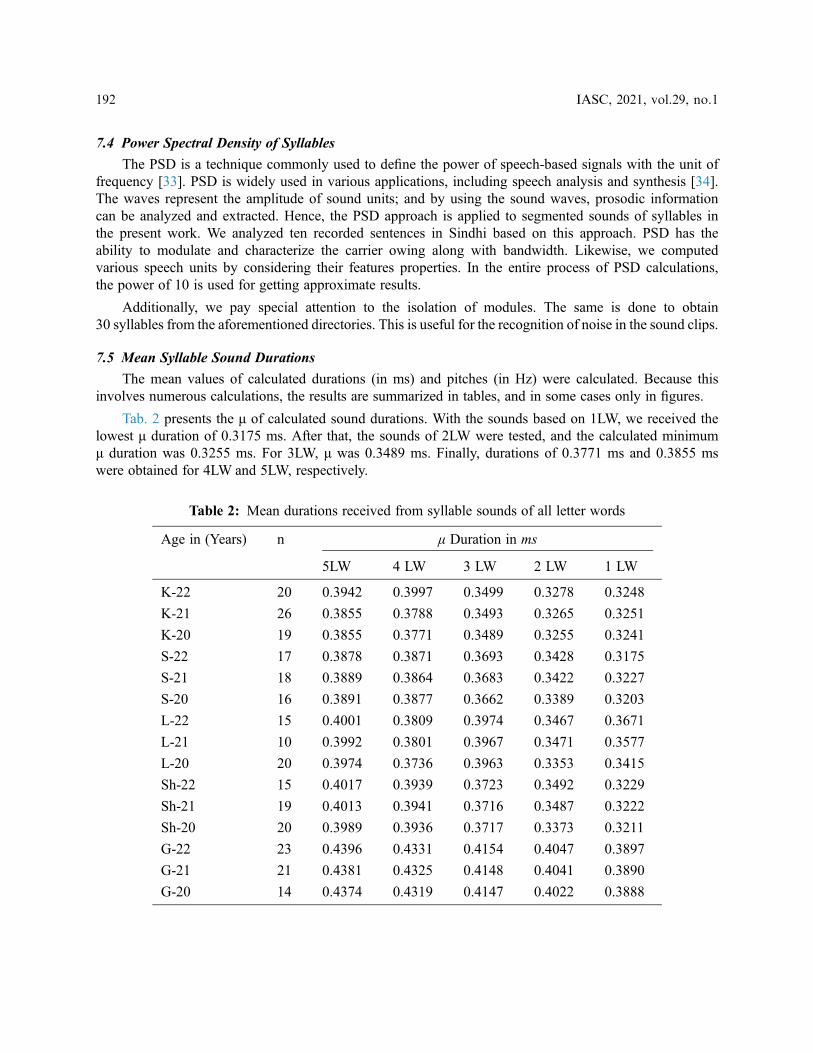
The mean values of calculated durations (in ms) and pitches (in Hz) were calculated. Because thisinvolves numerous calculations, the results are summarized in tables, and in some cases only in figures.
Tab. 2 presents the μ of calculated sound durations. With the sounds based on 1LW, we received thelowest μ duration of 0.3175 ms. After that, the sounds of 2LW were tested, and the calculated minimumμ duration was 0.3255 ms. For 3LW, μ was 0.3489 ms. Finally, durations of 0.3771 ms and 0.3855 mswere obtained for 4LW and 5LW, respectively.
Table 2: Mean durations received from syllable sounds of all letter words
Age in (Years) n μ Duration in ms
5LW 4 LW 3 LW 2 LW 1 LW
K-22 20 0.3942 0.3997 0.3499 0.3278 0.3248
K-21 26 0.3855 0.3788 0.3493 0.3265 0.3251
K-20 19 0.3855 0.3771 0.3489 0.3255 0.3241
S-22 17 0.3878 0.3871 0.3693 0.3428 0.3175
S-21 18 0.3889 0.3864 0.3683 0.3422 0.3227
S-20 16 0.3891 0.3877 0.3662 0.3389 0.3203
L-22 15 0.4001 0.3809 0.3974 0.3467 0.3671
L-21 10 0.3992 0.3801 0.3967 0.3471 0.3577
L-20 20 0.3974 0.3736 0.3963 0.3353 0.3415
Sh-22 15 0.4017 0.3939 0.3723 0.3492 0.3229
Sh-21 19 0.4013 0.3941 0.3716 0.3487 0.3222
Sh-20 20 0.3989 0.3936 0.3717 0.3373 0.3211
G-22 23 0.4396 0.4331 0.4154 0.4047 0.3897
G-21 21 0.4381 0.4325 0.4148 0.4041 0.3890
G-20 14 0.4374 0.4319 0.4147 0.4022 0.3888
192 IASC, 2021, vol.29, no.1

The minimum μ durations for speakers of the Khairpur district are presented in Tab. 2. We found that1LW and 2LW sounds have durations of 0.3897 ms and 0.4047 ms, respectively. For 3LW, we recorded aduration of 0.4154 ms. For 4LW, we obtained a duration 0.4331 ms. Lastly, the maximum μ duration of0.4396 ms was observed for the 5LW sounds. These results proved that speakers from Ghotki have thelargest μ durations compared to speakers from other districts. We also calculated the SD to check thevariations in sound duration at various levels. Mnsari [35] used this same methodology. 1LW and 2LWhad SDs of 0.027 ms, while 3LW and 4LW had SDs of 0.023 ms and 0.020 ms, respectively. The lowestSD of 0.019 ms was obtained for 5LW. Variations in SD between 1LW to 5LW can be seen in Fig. 5.
SD values are also calculated at the district level, which shows significant dissimilarity among the speakersof District Shikarpur (with an SD of 0.030 ms). Meanwhile, speakers of District Ghotki provide the lowest SDvalue (0.017 ms). Speakers of Khairpur, Sukkur, and Larkana districts have SDs of 0.08 ms, 0.027 ms, and0.023 ms, respectively. The obtained results are better than the results calculated by Obin [24].
Two variables are needed to measure the performance of the proposed method of prosodic informationextraction. Hence, the obtained and observed are fixed for the presentation of syllable durations. Thecomputed syllable sounds durations are presented in Fig. 6. As the percentage of parameter observationsis too high, 5250 values are chosen for the depiction of the method’s precision. We also calculatedinterval coordinates of every syllable sound from 0.2 ms to 0.6 ms. If both observed and obtainedparameters are considered, then the maximum observed durations are placed between 0.27 ms and0.58 ms, and the obtained durations are placed between 0.29 ms and 0.43 ms.
Figure 5: Calculated SD Values at 1LW to 5LW Level, and District Level
0
0.1
0.2
0.3
0.4
0.5
0.6
0.7
0 0.1 0.2 0.3 0.4 0.5 0.6 0.7
Observed Durations (ms)
Ob
tain
ed D
ura
tio
ns
(ms)
525
0 O
bse
rvat
ion
s
Figure 6: Demonstration of 5250 observations evaluated as obtained and observed durations
IASC, 2021, vol.29, no.1 193

7.6 Mean Syllable Sound Pitches
Like with the syllables durations, we deposited the generated pitch values in the database. We present themean values of estimated pitches in Tab. 3. The maximum and minimum pitch values, i.e., 184.91 Hz and151.67 Hz, are received for 1LW. The highest and lowest calculated μ pitches are 191.94 Hz and 157.08 Hz,respectively, with the sounds of 2LW.
Similarly, tests were conducted on numerous 3LW sound units; the minimum μ pitch was 157.69 Hz,and the maximum was 193.69 Hz. For 4LW sounds the maximum and minimum μ pitches were198.23 Hz and 159.16 Hz. Furthermore, the lowest μ pitch of 159.71 Hz and highest μ pitch of198.23 Hz were measured for 5LW sound units. The obtained values were then used to calculate the SDs.1LW had an SD of 10.772 Hz, 2LW had an SD of 12.869 Hz, and 3LW had an SD of 11.952 Hz. Theseare minute differences as compared to the SDs calculated for 4LW and 5LW, i.e., 13.002 Hz and15.343 Hz, respectively. Fig. 8 presents the differences between 1LW through 5LW. This study reflectsthe mehtdology adopted by Xydas [36]. The recorded pitch sounds for individually selected districts wereused to calculate additional SDs. The least and most significant variations in sound units were observedamong the speakers of Khairpur and Shikarpur districts, respectively. The recorded SDs for speakers ofthe Khairpur district was 1.886 Hz, while that for speakers of District Shikarpur was 10.268 Hz.However, SD values obtained from the speakers of the Sukkur and Ghotki districts are relatively close toeach other (8.034 Hz and 8.084 Hz, respectively). The results are depicted in Fig. 7. The obtained andobserved parameters are also used to measure the performance of segmented syllables in terms of pitches.The results of 4850 examined observations are presented in Fig. 8.
Table 3: Mean pitches received from syllable sounds of all letter words
Age in (Years) n μ Pitch in Hz
5LW 4LW 3LW 2LW 1LW
K-22 20 161.81 160.11 157.71 158.28 157.22
K-21 26 160.53 159.67 157.69 157.82 156.35
K-20 19 159.71 159.16 157.77 157.08 153.77
S-22 17 175.17 172.33 170.33 158.81 154.83
S-21 18 174.67 172.29 167.12 158.78 154.78
S-20 16 173.92 172.01 166.66 158.62 151.67
L-22 15 169.51 167.71 168.89 167.19 162.12
L-21 10 168.56 167.56 168.68 163.89 159.88
L-20 20 168.03 166.77 164.27 160.26 159.71
Sh-22 15 179.84 178.80 171.09 160.83 153.32
Sh-21 19 179.47 178.32 169.71 160.25 152.99
Sh-20 20 178.92 178.27 168.44 159.71 152.88
G-22 23 207.55 198.23 193.69 191.94 184.91
G-21 21 207.12 198.01 193.66 191.78 181.76
G-20 14 202.61 197.88 193.11 191.44 178.11
194 IASC, 2021, vol.29, no.1

We selected the observations randomly and received unexpected results. This might be because of high-level variance in inputted sentence sounds. Some positions are crucial because the obtained and observedparameter values are nearly associated with the same type of words used in a descriptive sentencepronounced by speakers. We found that most calculated pitches were between 160 Hz and 185 Hz. Themaximum pitch was 263 Hz, while the minimum pitch was 137 Hz.
Moreover, we found that prosodic information of syllables and phonemes are sufficient for speechsynthesis. There is no need to acquire sound pitch and duration information from the words and sentencesbecause concatenation of obtained information of pitches and durations can produce the prosodicinformation of words and sentences. Therefore, we performed experiments on phonemes and syllablesinstead of words and sentences. The collected data of prosodic features are authentic and reliable becauseadvanced IT tools and programming languages are used for experiments.
8 Conclusion
Speech signal analysis for extraction of speech elements is viable in natural language applications. Thedevelopment of Arabic Script-Based SP applications still requires much research for analysis and synthesis.The pitch and duration are the main prosodic features of sound units used to help us understand the cognitive
120
140
160
180
200
220
240
260
280
120 140 160 180 200 220 240 260 280
Observed Pitches (Hz)
Obt
aine
d P
itch
es (
Hz)
485
0 O
bser
vati
ons
Figure 8: Demonstration of 4850 observations evaluated as obtained and observed pitches
Figure 7: Calculated SD of syllable sound pitches from 1LW to 5LW, and district based
IASC, 2021, vol.29, no.1 195
concepts of phonetics. We presented analytical results after the extraction of pitch and duration. Wedeveloped a speech corpus for the practical application of Sindhi prosody with the SFC model. We firstanalyzed the utterances acoustically to determine their amplitude. Next, we calculated the frequency ofsegmented syllables through the PSD method and calculated the mean sound durations and pitches.Finally, our results showed us that speakers of the District Ghotki produce the highest pitches and thoseof Khairpur and Larkana districts produce the lowest pitches.
Funding Statement: Taif University Researchers Supporting Project number (TURSP-2020/10), TaifUniversity, Taif, Saudi Arabia.
Conflicts of Interest: The authors declare that they have no conflict of interest to report regarding thepresent study.
References[1] S. A. Mahar, M. H. Mahar, S. H. Danwar and J. A. Mahar, “Investigation of pitch and duration range in speech of
Sindhi adults for prosody generation module,” Int. Journal of Advanced Computer Science and Applications,vol. 10, no. 9, pp. 187–195, 2019.
[2] J. A. Mahar and G. Q. Memon, “Phonology for Sindhi letter-to-sound conversion,” Journal of Information &Commun. Technology, vol. 3, no. 1, pp. 11–21, 2009.
[3] H. Shaikh, J. A. Mahar and G. A. Mallah, “Digital investigation of accent variation in Sindhi dialects,” IndianJournal of Science and Technology, vol. 6, no. 10, pp. 5429–5433, 2013.
[4] A. Keerio, N. Channa, Y. A. Malkani and Qureshi, “Acoustic analysis of the liquid class of consonant sounds ofSindhi,” Sindh University Research Journal (Science Series.), vol. 46, no. 4, pp. 505–510, 2014.
[5] P. B. Dasgupta, “Detection and analysis of human emotions through voice and speech pattern processing,” Int.Journal of Computer Trends and Technology, vol. 52, no. 1, pp. 1–3, 2017.
[6] K. J. Min and U. C. Lim, “Korean prosody generation and artificial neural networks, ” in 8th Int. Conf. on SpokenLanguage Processing, Jeju Island, Korea, pp. 1–4, 2004.
[7] Y. Wu, S. Li and H. Li, “Automatic pitch accent detection using long short-term memory neural networks, ” in Int.Symp. on Signal Processing Systems. Beijing, China, 41–45, 2019.
[8] M. Begum, R. N. Ainon, R. Zainuddin, Z. M. Don. and G. Knowles, “Prosody generation by integrating rule andtemplate-based approaches for emotional Malay speech synthesis,” in Proc. IEEE Region 10 Conf., Hyderabad,India, pp. 1–6, 2008.
[9] X. J. Ma, W. Zhang, W. B. Zhu and Q. Shi, “Probability based prosody model for unit selection,” in Proc. IEEEInt. Conf. on Acoustic, Speech and Signal Processing, Montreal, Canada, pp. 1–5, 2004.
[10] B. Gerazon, G. Bailly, O. Mohammed, Y. Xu and P. N. Garner, “A variational prosody model for thedecomposition and synthesis of speech prosody. preprint, arXiv: 1806.08685v1, pp. 1–10, 2018.
[11] G. Bailly and B. Holm, “SFC: A trainable prosodic model,” Speech Communication, vol. 46, no. 3-4, pp. 348–364, 2005.
[12] Z. Mnasri and F. Boukadida, “F0 contour modeling for Arabic text-to-speech synthesis using Fujisaki parametersand neural networks,” Signal Processing An Int. Journal, vol. 4, no. 6, pp. 352–369, 2010.
[13] S. A. Mahar, M. H. Mahar, S. H. Danwar, J. A. Mahar and A. A. Shaikh, “Prosody generation using backpropagation neural network for Sindhi speech processing applications,” Indian Journal of Science andTechnology, vol. 13, no. 2, pp. 218–228, 2020.
[14] B. Gerazon, G. Bailly, O. Mohammed, Y. Xu and P. N. Garner, “A variational prosody model for mapping thecontext-sensitive variation of functional prosodic prototypes. arXiv: 1806.08685v2, 1–122019.
[15] J. A. Mahar, G. Q. Memon and H. A. Shah, “Perception of syllables pitch contour in Sindhi language,” in IEEEInt. Conf. on Natural Language Processing and Knowledge Engineering, Dalian, China, pp. 593–597, 2009.
[16] A. M. Abbasi and S. Hussain, “The role of pitch between stress and intonation in Sindhi,” ELFAnnual ResearchJournal, vol. 17, pp. 41–54, 2015.
196 IASC, 2021, vol.29, no.1
[17] A. M. Abbasi, H. Pathan and M. A. Channa, “Experimental phonetics and phonology in Indo-Aryan & Europeanlanguages,” Journal of Language and Cultural Education, vol. 6, no. 3, pp. 21–52, 2018.
[18] A. Keerio, N. Channa, Y. A. Malkani and B. Qureshi, “Acoustic analysis of the liquid class of consonant sounds ofSindhi,” Sindh University Research Journal (Science Series), vol. 46, no. 4, pp. 505–510, 2014.
[19] M. Farooq, “Acoustic analysis of corner vowels in six indigenous languages of Pakistan,” Journal of Research inSocial Sciences, vol. 6, no. 2, pp. 2305–6533, 2018.
[20] M. Breen, A. B. Fitzroy and M. O. Ali, “Event-related potential evidence of implicit metric structure during silentreading,” Brain Sciences, vol. 9, no. 8, pp. 1–28, 2019.
[21] C. Chiang, Y. Hung, H. Yeh and I. Liao, “Punctuation-generation-inspired linguistic features for Mandarinprosody generation,” Journal on Audio Speech and Music Processing, vol. 4, pp. 1–22, 2019.
[22] N. G. Ward and J. A. Jodoin, “A prosodic configuration that conveys positive assessment in American English,” inProc. Administrative Professional Conf., pp. 3368–3372, 2018.
[23] N. A. Al-Saiyd and M. Hijjawi, “Unit selection model in Arabic speech synthesis,” International Journal ofComputer Science and Network Security, vol. 18, no. 4, pp. 126–131, 2018.
[24] N. Obin and P. Lanchantin, “Symbolic modeling of prosody: from linguistics to statistics,” IEEE Transactions onAudio, Speech and Language Processing, vol. 23, no. 3, pp. 588–599, 2015.
[25] A. Talman, A. Suni, H. Celikkanat and S. Kakouros, “Predicting prosodic prominence from text with pre-trainedcontextualized word representations,” 2019. [Online]. Available at: https://arxiv.org/abs/1908.02262.
[26] H. Mixdorff, C. Watson and P. Keegan, “Quantitative analysis of Maori prosody from three generations,” in Proc.9th Int. Conf. on Speech Prosody, Poznan, Poland, pp. 631–635, 2018.
[27] S. A. Ali, S. A. Khan and N. Bashir, “Analyzing the impact of prosodic feature (pitch) on learning classifiers for speechemotion corpus,” Int. Journal of Information Technology and Computer Science, vol. 7, no. 2, pp. 54–59, 2015.
[28] J. James, H. Mixdorff and C. I. Watson, “Quantitative model-based analysis of F0 contours of emotional speech,”in Int. Conf. on the 19th Congress of Phonetic Science, Australia, pp. 72–76, 2019.
[29] S. Baumann and P. B. Schumacher, “The incremental processing of focus, givenness, and prosodic prominence,”Glossa: Int. Journal of General Linguistics, vol. 5, no. 1, pp. 1–30, 2020.
[30] A. Al-Shalaby, N. Alawa and O. Al-Dakkak, “Automatic prosody generation for Arabic text-to-speech systems,”Damascus University Journal, vol. 29, no. 1, pp. 207–222, 2013.
[31] B. Popovic, D. Knezevic, M. Secujski and D. Pekar, “Automatic prosody generation in a text-to-speech system forHebrew,” Electronics and Energetics, vol. 27, no. 3, pp. 467–477, 2014.
[32] A. Esposito and G. Aversano, “Text independent methods for speech segmentation, Lecture Notes in ComputerScience. , 261–290, 2005.
[33] J. Saini and R. Mehra, “Power spectral density analysis of speech signals using window techniques,” Int. Journalof Computer Applications, vol. 131, no. 14, pp. 33–36, 2015.
[34] A. Kydyrbekova, M. Othman, O. Mamyrbayev and A. Akhmediyarova, “Identification and authentication of uservoice using DNN features and i-vector,” Cogent Engineering, vol. 7, no. 1, pp. 1–21, 2020.
[35] Z. Mnasri, F. Boukadida and N. Ellouze, “Design and development of a prosody generator for Arabic TTSsystems,” Int. Journal of Computer Applications, vol. 12, no. 1, pp. 24–31, 2010.
[36] G. Xydas and G. Kouroupetroglou, “Modeling improved prosody generation from high-level linguisticallyannotated corpora,” Institute of Electronics, Information and Commun. Engineering Transaction and onInformation Systems, vol. 88, no. 3, pp. 510–518, 2005.
IASC, 2021, vol.29, no.1 197