super ground pac in combination with ceramic micro- filtration · pdf file2601 da delft, the...
TRANSCRIPT

Super ground PAC in combination with
Ceramic Micro-filtration
Techneau, DECEMBER 2008

© 2008 TECHNEAU TECHNEAU is an Integrated Project Funded by the European Commission under the Sixth Framework Programme, Sustainable Development, Global Change and Ecosystems Thematic Priority Area (contractnumber 018320). All rights reserved. No part of this book may be reproduced, stored in a database or retrieval system, or published, in any form or in any way, electronically, mechanically, by print, photoprint, microfilm or any other means without prior written permission from the publisher
Super ground PAC in combination with
Ceramic Micro-filtration
Techneau, 08. DECEMBER 2008

Colophon
Title SUPER GROUND PAC IN COMBINATION WITH CERAMIC MEMBRANE Author(s) J.Z Hamad1, M.D Kennedy1, S.G.J Heijman2, 3, J. Schippers1 and G. Amy1, 3 1UNESCO-IHE Institute of Water Education, P.O Box 3015,2601 DA Delft, The Netherlands. 2KWR Watercycle Research Institute, P.O. Box 1072, 3430BB, Nieuwegein, The Netherlands 3Delft University of Technology, Faculty of CivilEngineering and Geoscience, Delft, The Netherlands Quality Assurance UNESCO-IHE & KWR Watercycle Research Institute Deliverable number D 2.3.2.3
This report is: PU = Public

Summary
Ceramic membranes, with their inherent mechanical, thermal and chemical stability with a long life operation, offer an attractive alternative to polymeric membranes in surface water treatment applications despite being expensive. High cost of ceramic membranes can be compensated with its ability to operate at high Fluxes. To do so, the membranes need pre-treatment (coagulation or adsorption with activated carbon) to prevent frequent use of chemicals for membrane cleaning (CEB and CIP). The main goal of this research was to investigate the removal efficiencies of NOM and atrazine with sub-micron Powdered Activated Carbon (S-PAC) and normal (N-PAC) in combination with (ceramic/polymeric) microfiltration. S-PAC was obtained by grinding thermally N-PAC in a novel mill. The S-PAC and N-PAC had an average effective particle size of 0.3µm and 2µm, respectively.
The S- and N-PAC was pre-coated onto the (ceramic/polymeric) microfiltration prior to filtration. Pre-coat layers of 70mg/l and 20mg/l of S-PAC (48 and 14 layers, respectively) and 70mg/l of N-PAC (14 layers) were introduced onto 0.1µm MF PVDF membrane placed in Amicon (un)stirred Cell and 0.1µm MF Ceramic membrane prior to filtration. DOC, UV254 and atrazine were analysed to compare the removal efficiencies of S-PAC and N-PAC. An LDF model was employed to simulate the results of atrazine removal with S-PAC and N-PAC in pure MQ water.
The results showed that atrazine removal from Milli Q water (0.1mg/l) was maintained to 99% with 70mg/l of S-PAC after 1 hour and drop to 80% after 30 minutes with 70mg/l of N-PAC without NOM competition. No breakthrough achieved after 1 hour filtration through S-PAC but with N-PAC it was achieved after 25min. S-PAC (20mg/l) shows better removal of atrazine achieving 98% removal compared with 65% with 70mg/l of N-PAC without competitive adsorption after one hour.
The adsorption of atrazine is affected by competition with NOM but atrazine has a negligible effect on DOC and UV254 removal due to low concentration. Atrazine removal drop from 99% (without competition) to 62% (with competition) with S-PAC; and from 65% (without competition) to 55% (under competition) for N-PAC after 1 hour of filtration at the same dose. The contact time was < 1 second.
Alternatively, S-PAC showed better removal efficiency in terms of DOC & UV254 (without competitive adsorption) at the same dose and lower dose than N-PAC. S-PAC exhausted (C = 90%Co) after 90 minutes of Filtration while N-PAC exhausted after 60 minutes when a flux of 145L/m2.h applied to the filtration of Delft canal water. Also, 50% of DOC and UV254 removal was achieved after 20 minutes for S-PAC and 30% for N-PAC respectively. The same removal efficiencies was achieved for UV254 with competitive adsorption indicating that DOC removal is not affected by the presence of small amount of atrazine. S-PAC might have large surface area resulting into fast adsorption kinetic than N-PAC.
The formation of PAC cake fouling was very rapid in S-PAC than in N-PAC. Total resistance of membrane increases from 3 to 13 x 1011 m-1 in case of S-PAC and from 4.5 to 7x 10¹¹ m-1 for N-PAC after 1 hour. LC-OCD test carried out after that, showed high removal of biopolymers (>80%) in the first 45 minutes with S-PAC. This is suggesting that there was a physical removal of biopolymers due to straining since the bed porosity of S-PAC layer is 0.045µm (0.15d) and hence create some sort of straining which removes large molecular weight components of NOM like biopolymers.
Super ground PAC in combination with Ceramic Micro-filtration © TECHNEAU - 1 - December 22, 2008

However, good results were obtained with pre-coated flat membrane PVDF and not in ceramic. This is suggesting that either PAC layers were not well dispersed in Ceramic membrane and or some of the PAC might remain in suspension and did not take part in pre-coat layer. Therefore, to ensure well dispersing of S-PAC inside ceramic membrane channels is a great challenge for further studies on this topic.
Stimela software package designed by TU Delft, KIWA and HVS employed LDF model, shows similar trend of atrazine removal with laboratory results with S-PAC with breakthrough occurs after 1 hour. The model might be useful for prediction of breakthrough curve behavior for S-PAC; however more laboratory experiments are required to validate the statement. Keywords: Adsorption, pre-coat layer of S-PAC and N-PAC, Ceramic membranes, Flux, NOM, DOC, UV, atrazine and Stimela
Super ground PAC in combination with Ceramic Micro-filtration © TECHNEAU - 2 - December 22, 2008

Contents
Summary 1
Contents 3
1.0 Introduction 5
1.1 Background 5
1.2 Problem Identified 6
1.3 Research Goals and Objectives 6 1.3.1 Goal 7 1.3.2 Objectives 7
2. Materials and Methods 8
2.1 Feed Water 8
2.2 Cleaning Agents 8
2.3 Pre-treatment 8
2.4 Membrane Material and Equipment 8 2.4.1 Ceramic Membrane 8 2.4.2 MF PVDF membrane 9
2.5 Experimental Set-up 9 2.5.1 Ceramic Membrane set-up 9 2.5.2 Amicon (un) stirred Cell Set-up 10
2.6 Experimental Procedure 11 2.6.1 Pilot Plant – Ceramic membrane 11 2.6.2 Amicon Unstirrer Cell 12
2.7 Analytical Procedures for Measuring UV254, DOC and Atrazine 12
2.8 Modelling 13
3.0 Results and Discussion 15
3.1 Comparison of DOC, UV254 and Atrazine Removal with Pre-coat Layer of S-PAC and N-PAC 15
3.1.1 Removal of DOC, UV254 and Atrazine without Competition 15 3.1.2 Removal of UV254 and Atrazine with Competitive adsorption 20 3.1.3 Comparison of Atrazine Removal in Milli Q water (no competitive adsorption)
with S-PAC and N-PAC pre-coated in a 0.1µm MF PVDF membrane at different dose 23
3.1.4 Comparison of polymeric PVDF (0.1 µm) & Ceramic membrane (α-Al2O3 0.1 µm) pre-coated with S-PAC in terms of DOC & UV removal 25
3.1.5 PAC Cake Fouling 27 3.1.6 LC-OCD Test for filtrate of S-PAC and N-PAC 28
Super ground PAC in combination with Ceramic Micro-filtration © TECHNEAU - 3 - December 22, 2008

3.2 Modelling 31 3.2.1 Modelling Atrazine (0.1 mg/l) adsorption on 20mg/l S-PAC pre-coat layer
through 0.1µm MF PVDF membrane 31
4.0 CONCLUSIONS 33
4.1 Adsorptive Filtration through S-PAC and N-PAC (70mg/l pre-coat layers with bed volumes of 0.025cm3) 33
4.2 Modelling 34
5.0 References 35
6. 0 APPENDICES 37
Appendix 1 37
Appendix 2 38
Number of layers formed in S & N-PAC pre-coat 38
Appendix 3: LC-OCD Tests for N-PAC & S-PAC permeates and Pre-filtered Delft Water Canal 1
Super ground PAC in combination with Ceramic Micro-filtration © TECHNEAU - 4 - December 22, 2008

1.0 Introduction
1.1 Background
The use of membrane technology in surface water treatment for drinking water production is receiving more and more attentions (Lee et al., 2004), (Dong et al., 2006) and (K. Sundaramoothy et al., 2004). The quality of water produced by membrane, less space occupied by plant, minimum use of manpower and declining of membrane cost are major reasons to opt membrane technology than conventional treatment method (Xia et al., 2007) and (Amy, 2007)
In general, membrane technology is indispensable in 21st century. Ceramic membrane with the advantage of long life span and high flux capability promise a big step in water production technology. Basically, Ceramic membranes apart from cost implications (double to polymeric) have added advantages of outstanding mechanical strength, high resistance against heat and chemicals. Also they can withstand high velocity in hydraulic backwashing
However, the major problem in membrane technology is membrane fouling (Pontie et al., 2006). Fouling in membrane increases operation and maintenance costs by deteriorating the performance of membrane and eventually shortening the membrane life (Pontie et al., 2006). Four different types of fouling are identified as particulate fouling, bio-fouling, organic fouling and scaling (Kennedy et al., 2007).
Natural Organic matter (NOM) is a major causes of irreversible fouling of membranes. The origins of NOM in surface water are aqueous, terrestrial, vegetative waste (products and by-products), and other algal cellular matter (K. Sundaramoothy et al., 2004). One of the techniques of reducing the membrane fouling is pre-treatment of feed water by coagulation or by adsorption with powdered activated carbon PAC.
MF and UF membranes alone are not efficient enough in removing colour, NOM especially humic substances, synthetic organic chemicals (SOCs), taste and odour. Therefore, UF and MF should be combined with other conventional techniques like adsorption on powdered activated carbon (PAC). The association of adsorption on PAC and UF provides the following benefits: better physical removal of NOM and SOCs through optimal use of PAC, reduced sludge volume and reducing membrane (Mozia and Tomaszewska, 2003).
The study done by (Zhao et al., 2005) on Removal of organics and viruses using hybrid ceramic membrane MF system without draining PAC (20g/l) showed that DOC removal of 80% and UV removal of 90% at a flux of about
Super ground PAC in combination with Ceramic Micro-filtration © TECHNEAU - 5 - December 22, 2008

100L/m2.h. Furthermore, PAC cake layer assisted ceramic MF to remove viruses to less than detection limit after 60 days of operation (Zhao et al., 2005).
On the other side, PAC adsorption on organic matter (NOM) and metal ions are the main factors causing the PAC cake layer fouling on PAC-MF hybrid membranes (Zhao et al., 2005). Accumulation of particulates is also causing pore blocking and voids clogging in a membrane as well as in PAC layer.
The research by (Zhao et al., 2005) mentioned the decrease of particle size of PAC during operation due to particle breakage caused by severe collision and friction in aeration condition facilitates PAC cake formation on membrane. Moreover, metal ions play a great role on PAC cake fouling than organic matter. PAC with large size when combined with adsorbed small particulates from raw water brings the most severe PAC cake fouling. Oxidation of Iron II to Iron III during PAC adsorption affects PAC cake resistance more than other metal ions.
The importance of PAC on removal of NOM is not limited to water supply only, but also in waste water. The use of PAC into cross flow micro-filtration system resulting in formation of biological powdered activated carbon (BPAC) due to seeding micro-organisms found to be effective in increasing the sorption capacity for removal of organic matter than the fresh PAC (Seo et al., 1997).
The adsorption of PAC is mainly the function of particle diameter the smaller the size means better adsorption and hence low dose usage. This is strongly supported by (Matsui et al., 2005) in his study he found that 5mg/l of submicron PAC (0.8um) has a better adsorption performance than 40mg/l of Normal PAC with a constant flow of 1.5m/d (62.5L/m2.h).Besides, he also found that combination of submicron PAC and coagulant (Alum) improves the removal of NOM from 20% to 50% removal than dosing of PAC alone.
1.2 Problem Identified
The past researches on TOC removal on surface water by using S-PAC in a combine mixed stirrer chamber showed that a contact time of at least 1 min is required for better removal of NOM (Matsui et al., 2005). In plug flow the situation might be different. Therefore, this study went through and compares the efficiency of S-PAC and N-PAC used in the form of pre-coat as a pre-treatment prior to Ceramic membrane filtration looking at NOM (DOC), UV and micro-pollutants (atrazine) removal.
1.3 Research Goals and Objectives
The removal efficiency of NOM, pesticides and fouling reduction by pre-coat layer of PAC is mainly depends on amount of dosage, quality of raw water, temperature, pH, grain size of PAC and contact time. To understand the
Super ground PAC in combination with Ceramic Micro-filtration © TECHNEAU - 6 - December 22, 2008
removal of NOM and pesticides through adsorption with pre-coat layer of S-PAC and N-PAC for improving the quality of water is major target of this research.
1.3.1 Goal • To compare the efficient of Normal PAC (N-PAC) and Super PAC (S-
PAC) in terms of DOC, UV and pesticides removal with Ceramic Micro-filtration membrane without compromise the high Flux.
1.3.2 Objectives • To compare the DOC and UV254 removal efficiency with N-PAC and
S-PAC pre-coat layers at high Flux of 150 l/m2.h. • To determine the fractions of NOM that is removed by adsorption
with S-PAC and N-PAC along filtration time. • To compare the removal of atrazine with pre-coat layers of N-PAC
and S-PAC under high Flux without competitive adsorption. • To analyse the fate of atrazine removal on competitive adsorption
with NOM • Establish the breakthrough and exhaustion curve • Modelling the results of atrazine removal from MilliQ water.
Super ground PAC in combination with Ceramic Micro-filtration © TECHNEAU - 7 - December 22, 2008

2. Materials and Methods
2.1 Feed Water
Delft canal water which is surface water was used for laboratory experiments. The typical quality of the raw water is shown by the table below
Table 1: Typical Quality of Delft Water Canal
Parameter Turbidity (NTU) 14 TSS (mg/l) 25 DOC (mg/l) 15 UV254 (cm-1) 0.5 Source: Hamad (2008)- UNESCO IHE
2.2 Cleaning Agents
For backwashing and chemical enhanced backwashing and Cleaning in Place (CIP) the following cleaning agents were used.
• Demineralised water • Filtered water • Sodium hydroxide • Sodium Hypochlorite • Citric acid
2.3 Pre-treatment
Super ground Powdered Activated Carbon (S-PAC) with effective size of 0.3μm and Normal Powdered Activated Carbon (N-PAC) with effective size of 2-3μm was used as pre-treatment prior to ceramic membrane filtration in terms of pre-coat layers.
2.4 Membrane Material and Equipment
Two types of membrane were used, Ceramic Microfiltration membrane and 0.1μm PVDF membrane.
2.4.1 Ceramic Membrane
Monolithic ceramic membranes manufactured by NGK Insulator ltd of Japan with the following specifications was used
Super ground PAC in combination with Ceramic Micro-filtration © TECHNEAU - 8 - December 22, 2008

Table 2: Specifications of Monolithic Ceramic Membrane
Description Parameter Size (Diameter x length of module) 30mm x 1,000mm Membrane channel (channel diameter and no. of channels)
2.5mm and 55 channels per module
Membrane surface area 0.4m2 Norminal pore size 0.1 μm Operating TMP 5 – 100 kPa Backwashing Pressure 500 kPa Filtration duration 6 – 12 hrs Filtration condition Dead end mode Other accessories accompanied with membrane module are
• Gear pump, model Verdergear VG 1000 + pump for in dosing • Flow meter, model Endress + Hauser • Pressure gauges, model Endress + Hauser • Commpressed air pressure vessel • Automatic Data logger connected to a computer with software (Trend
Reader Standard vl. 22). Monitoring of flow, pressure, temperature and time is possible by using data logger.
• Dosing tanks •
2.4.2 MF PVDF membrane
Characteristics of MF PVDF membrane is shown by Table 3 below:-
Table 3: Specifications of MF PVDF Membrane
Thickness µm 125Porosity % 70Filter Material Hydrophylic PVDFPore size µm 0.1Wettability HydrophilicWater Flow Rate, L/m2.h 1500Bubble Point at 230C 4.8 bar≥
2.5 Experimental Set-up
2.5.1 Ceramic Membrane set-up The pilot plant has four processes that can be either operated automatically or manually. These processes are Filtration, Backwashing, Air Flushing and Forward Flushing. The set up of the pilot plant is shown below:
Super ground PAC in combination with Ceramic Micro-filtration © TECHNEAU - 9 - December 22, 2008
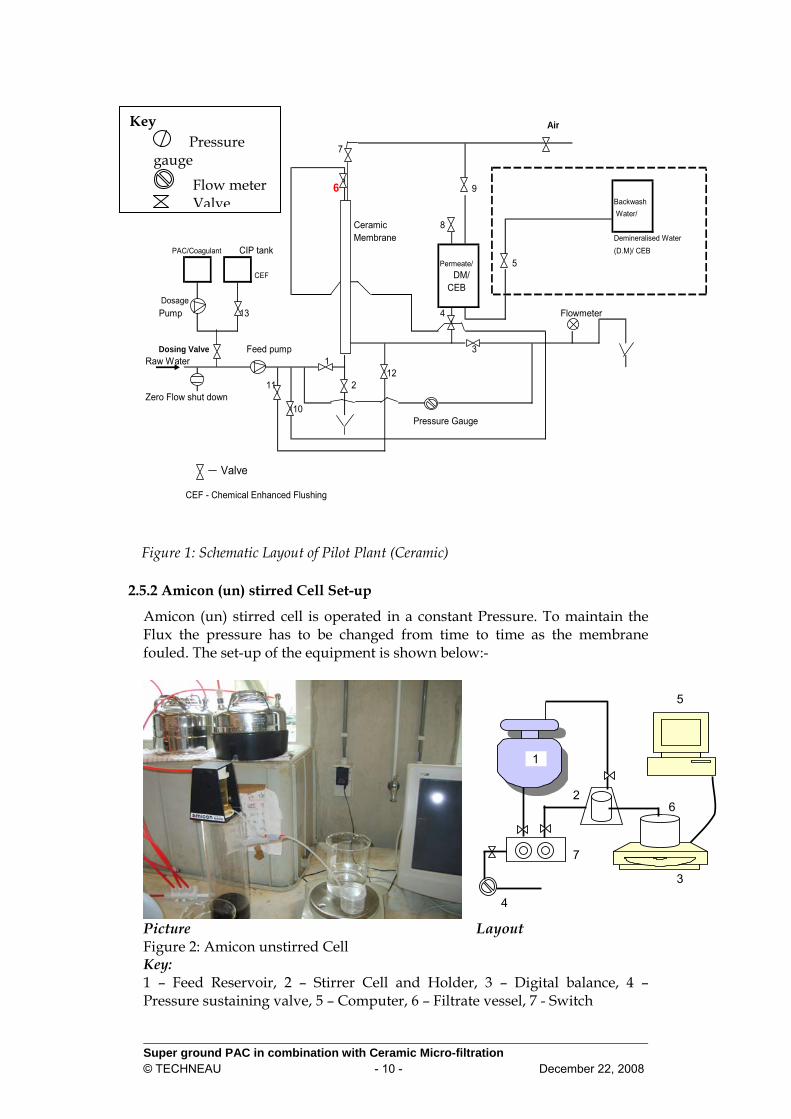
Super ground PAC in combination with Ceramic Micro-filtration © TECHNEAU - 10 - December 22, 2008
Air
7
6 9Backwash Water/
Ceramic 8 Membrane Demineralised Water
PAC/Coagulant CIP tank (D.M)/ CEBPermeate/ 5
CEF DM/ CEB
DosagePump 13 4 Flowmeter
Dosing Valve Feed pump 3Raw Water 1
1211 2
Zero Flow shut down10
Pressure Gauge
Valve
CEF - Chemical Enhanced Flushing
2.5.2 Amicon (un) stirred Cell Set-up
Amicon (un) stirred cell is operated in a constant Pressure. To maintain the Flux the pressure has to be changed from time to time as the membrane fouled. The set-up of the equipment is shown below:-
Picture Layout Figure 2: Amicon unstirred Cell Key: 1 – Feed Reservoir, 2 – Stirrer Cell and Holder, 3 – Digital balance, 4 – Pressure sustaining valve, 5 – Computer, 6 – Filtrate vessel, 7 - Switch
Figure 1: Schematic Layout of Pilot Plant (Ceramic)
Key Pressure gauge Flow meter
Valve
1
2
3
4
5
6
7

2.6 Experimental Procedure
2.6.1 Pilot Plant – Ceramic membrane
Filtration
In automatic mode the filtration time for one cycle can be set accordingly (e.g 60 minutes). The Flux required is also set in terms of percentage where by 20% was equivalent to 150L/m2.h flux when a membrane of 0.4m2 cross-sectional areas is used. The data logger records automatically the flow, temperature, pressure and time for analysis. For filtration process valve no. 1 and 3 are opened and sometimes valve no 8 is also opened to release the air from backwashing vessel. Also dosing time was set to 4 minutes when a stock solution of S-PAC (7.5g/l) dosed at a rate of given rate (1.8 L/h).
However for adsorption experiments the pilot plant operated manual with dosing rate of 5L/h for few minutes depending on the number of layers that are required to be built.
Backwashing (BW)
During Filtration process in automatic mode, the backwashing vessel is started to be filled after 5 minutes. Valve no. 4 and 8 are opened and it takes about 10 minutes for the backwashing vessel to be filled but it depends upon the Flux used. The capacity of backwashing vessel is 5 Liters. For backwashing 2-3 Liters are enough that ensure that the vessel is not fully empting to avoid interference of air in the system. The time set for backwashing was 16 seconds. Backwashing was done automatically after 1 hour of filtration cycle. The backwashing Flux was about 1,700L/m2.h. The process of backwashing is started by opening of valve no. 10 so the water is bypassed and the pump can operate without being stopped. Valve 1 and 3 are closed and valve 2, 4 and 9 are opened. The backwashing process is a combination of water and compressed air (5bar). When the process is finished all valves are closed except valve 10 (Bypass).
Air Flushing (AF)
After backwashing the membrane is flushed automatically with compressed air (5 bars). The process is called Air Flushing. In this process normal all valves are closed except valve no. 2, 7 and 10 and it takes about 30 seconds for Flushing.
Forward Flushing (FF)
When Air Flushing is finished then the Forward Flushing is done automatically. The purpose of FF is to remove the remained air from the membrane that was left from AF process. In this process valve no. 10 is also closed and valve no 1 and 6 are opened. The Flush is done with high Flux of 300L/m2.h and it takes about 1 minute. Then valve no.6 is closed and valve no. 3 is opened to start a new cycle.
Super ground PAC in combination with Ceramic Micro-filtration © TECHNEAU - 11 - December 22, 2008

Chemical Enhanced Backwashing (CEB)
CEB process was done by using 0.1M of NaOH and followed by 1% of Citric Acid. It was also done by using Sodium Hydroxide alone. The process was done on daily basis.
Chemical Cleaning
Chemical cleaning is employed to remove non-backwashable foulants in order to restore the function of membrane close to initial status in terms of permeability. The procedures involve soaking of membrane in 3000 ppm of Sodium Hypochlorite (NaOCl) solution at 200C in a pH of 12 at least for 6 hours. Then the membrane is flushed with water to remove the Sodium hypochlorite before soaked again in Citric acid (1%) for atleast 6 hours. The process was done once in a week.
2.6.2 Amicon Unstirrer Cell
The 0.1µm MF PVDF membrane cut into 58mm diameter size. The selection of PVDF membrane based on their pore sizes which is equivalent to ceramic membrane. With Amicon Cell (8200) the PVDF membranes are placed in a cell either single, double or triple depends on the initial flux required. The first step is washing the membrane with Milli Q water and membrane resistance can be also measured in this step by measuring the weight of the filtrate in a balance. The pressure is kept constant and with the Milli Q water filtration the Flux is almost remain constant. The second step is addition of 180ml of S-PAC or N-PAC solution to the cell. In this experiment 70mg/l dose was selected. The pressure used in the first step filtration was also used in this step. The idea is to create the PAC pre-coat layer as well as to measure the PAC resistance. Therefore the filtrates are measured in a balance. The third step is filtration of raw water through pre-coat layers of S-PAC or N-PAC. Pre-filtered Delft water canal (with 0.45μm filters) was used. Amicon un-stirrer cell is normal work at a constant Pressure. Therefore during filtration of Canal water through pre-coat layers of PAC, the flux declines as the PAC cake fouling increased. In order to keep at least average flux the pressure has to be adjusted from time to time. This can be possible done by monitoring the differences of filtrate weight in a balance. For good results at time interval of 30 seconds for recording of the filtrate weight is recommended.
2.7 Analytical Procedures for Measuring UV254, DOC and Atrazine
UV absorbance machine was used to measure the absorbance intensity of the collected samples at the wavelength of 254nm. The unit of the absorbance is cm-1. The DOC of raw water and the permeate samples were measured in a
Super ground PAC in combination with Ceramic Micro-filtration © TECHNEAU - 12 - December 22, 2008

TOC analyser. Machine can hold 60 samples in a time and it takes 15 minutes to measure one samples. The atrazine content in water was measured by using the Atrazine ELISA (Microtiter Plate). The prepared samples are put together with standards in duplicate and the wavelength is set to 450nm. The procedures for preparation of samples are time consuming and need special care in order to have good results.
TOC Analyser UV Spectrophotometer
Figure 3: Analytical Equipments
2.8 Modelling
The previous study in IHE by Ervin Orlandini (1995) on K and n values for atrazine removal from Milli Q water using activated carbon reveal that adsorption capacity K was 4.07 and adsorption intensity n was 0.25. These values have been adopted for modelling using STIMELA.
Similarly, another parameter for modelling that was remained unknown was mass transfer coefficient. This can be determined experimentally or by calculation based on filtration results of adsorptive filtration. The external mass transfer coefficient is the rate limiting controlling step in the systems that have:
• Poor mixing • Dilute concentration of the adorbate • Smaller particle sizes of adsorbent
Super ground PAC in combination with Ceramic Micro-filtration © TECHNEAU - 13 - December 22, 2008

• And high affinity of adsorbate to adsorbent Therefore, External mass transfer coefficient is regarded as a rate limiting controlling step when it comes to case of S-PAC pre-coat and atrazine removal. Therefore in modelling with STIMELA the internal mass transfer coefficient was also neglected. Ervin Orlandini (1999) in his study on Pesticide Removal by combined Ozonation and Granular Activated Carbon Filtration came up with the coefficient values of 15x10-04 cm/s (0.054m/h) and 9.6x10-
13cm2/s for external mass transfer coefficient (Kf) and effective surface diffusivity (Ds) respectively when virgin GAC was used. When the particle sizes becomes very small, then the value of internal mass transfer coefficient becomes negligible, thus the Mass Transfer Coefficient becomes a product of external mass transfer coefficient and specific surface area of adsorbent. K2 = Kf x a, where a = external surface area per unit particle volume = 3/R for the spherical particles of radius R and R = d1/2, d1 is particle diameter of adsorbent, therefore if consider porosity Mass transfer coefficient can be defined as:
)1(6
12 ε−=
dK
K f Excel spread sheet has been employed to simplify the calculations as shown in Appendix 1:
Super ground PAC in combination with Ceramic Micro-filtration © TECHNEAU - 14 - December 22, 2008

3.0 Results and Discussion 3.1 Comparison of DOC, UV254 and Atrazine Removal with Pre-coat Layer of S-PAC and N-PAC
The pore size of MF Ceramic membrane is 0.1µm and therefore NOM and SOCs can not easily be removed without pre-treatment (Seo et al., 1997). Therefore the addition of powdered adsorbent to the membrane filtration influent is a simple and cost effective way to reduce NOM and SOCs in water (Matsui et al., 2005)
The filtration of surface water containing NOM and SOCs through activated carbon filters (GAC) is subjected to two main mechanisms: preloading and competitive adsorption. NOM adsorption rates are mostly much lower than SOCs adsorption rates. Therefore, NOM moves faster through the GAC column whereby pre-adsorption of the NOM takes place in the lower part of the filter bed. Such kind of adsorption is known preloading with NOM (Orlandini, 1999). Another mechanism which is taking place is competitive adsorption. Competitive adsorption is a process in which two or more adsorbates compete for the available adsorption sites. Competitive adsorption between NOM and Synthetic Organic Compounds (SOCs) may reduce the activated carbon adsorption capacity for SOCs (Upadhyaya, 1995). The presence of NOM in surface water is more than 100 times compared with SOCs (Orlandini, 1999). Therefore under competition adsorption SOCs is mostly like to suffer than NOM. In MF membrane system associated with PAC pre-coat layers the effect of preloading is considered to be negligible since the layers are replaced after backwashing before starting a new filtration cycle. Therefore the only mechanism that will take place in a thin layer is competitive adsorption.
3.1.1 Removal of DOC, UV254 and Atrazine without Competition
Pre-filtered Delft water canal was used to compare the removal of DOC and UV254 by creating a pre-coat layer with a bed volume of 0.025cm3 that is equivalent to 70mg/l of S-PAC and N-PAC. Operational conditions are shown below:
S-PAC N-PAC
Average Flux (L/m2.h) 145 145
No. of MF PVDF filters 2 2
Initial Pressure (bar) 0.2 0.15
Equivalent no. of Layers with 70mg/l
48 7
Super ground PAC in combination with Ceramic Micro-filtration © TECHNEAU - 15 - December 22, 2008

The same bed volume (0.025cm3) of S-PAC - (48 layers) and N-PAC - (7 layers) used in filtration of delft water canal (see Appendix 2). For atrazine removal, atrazine (0.1 mg/l) was dosed in Milli Q water to determine the removal efficiency of atrazine with S-PAC and N-PAC at the same bed volume (0.025cm3). An average flux of 145L/m2.h and 170L/m2.h was maintained for DOC/UV and atrazine experiments respectively. Samples were taken from to time to time. DOC, UV254 and atrazine were measured. The results are shown below:
Table 4: DOC and UV254 measurements of filtered Delft Canal water through S-PAC and N-PAC pre-coat layers over 0.1um PVDF membrane at Average Flux of 145 L/m2.h
i) DOC and UV Removal
S-PAC N-PAC
Time (Min.)
DOC (mg/l)
UV254
(cm-1)%DOC Removal
% UV Removal
SUVA (L/mg-m-1)
DOC (mg/l)
UV254
(cm-1)%DOC Removal
% UV Removal
SUVA (L/mg-m-1)
0 1.64 0.053 91.6% 89.1% 3.23 2.81 0.074 85.6% 84.8% 2.635 5.87 0.129 69.9% 73.5% 2.20 9.56 0.218 51.0% 55.1% 2.28
10 6.55 0.162 66.4% 66.7% 2.47 12.05 0.283 38.2% 41.8% 2.3515 9.27 0.207 52.5% 57.4% 2.23 13.31 0.32 31.7% 34.2% 2.4020 9.97 0.234 48.9% 51.9% 2.35 13.96 0.345 28.4% 29.0% 2.4730 12.82 0.301 34.3% 38.1% 2.35 14.72 0.38 24.5% 21.8% 2.5845 14.55 0.368 25.4% 24.3% 2.53 15.9 0.414 18.5% 14.8% 2.6060 14.98 0.399 23.2% 17.9% 2.66 17.42 0.429 10.7% 11.7% 2.4675 15.90 0.416 18.5% 14.4% 2.62 17.55 0.437 10.0% 10.1% 2.4990 17.40 0.427 10.8% 12.1% 2.45 18.8 0.446 3.6% 8.2% 2.37
105 17.51 0.434 10.2% 10.7% 2.48 18.92 0.451 3.0% 7.2% 2.38120 18.76 0.438 3.8% 9.9% 2.33 18.92 0.451 3.0% 7.2% 2.38
19.50 0.486Pre-filtered feed water
2.5
19.5 0.486
2.5
0%
20%
40%
60%
80%
100%
0 20 40 60 80 100 120Time (Min.)
DO
C R
emov
al
S-PAC N-PAC NO PAC
0%
20%
40%
60%
80%
100%
0 20 40 60 80 100 120
Time (Min.)
% U
V R
emov
al
S-PAC N-PAC NO PAC
Figure 4: DOC and UV254 Removals from filtered Delft Canal water through S-PAC and N-PAC pre-coat layers over 0.1um PVDF membrane at average flux of 145 L/m2.h
Super ground PAC in combination with Ceramic Micro-filtration © TECHNEAU - 16 - December 22, 2008

Table 5: Summary of DOC and UV Removal with S-PAC and N-PAC
Time DOC
Removal -SPAC
DOC Removal - NPAC
UV254
Removal -SPAC
UV254
Removal -NPAC
SUVA (L/mg-m) S-PAC
SUVA (L/mg-m) N-PAC
20 49% 28% 50% 29% 2.35 2.47 45 25% 18% 24% 15% 2.53 2.6 60 23% 10% 18% 12% 2.66 2.46 90 10% 4% 12% 8% 2.45 2.37
NB: SUVA value for raw water = 2.5 L/gm-m The results DOC and UV254 removal from pre-filtered Delft canal water without PAC shows that the removal is ranging between 3-5% which is suggesting that MF membrane alone can not remove NOM. On the other hand, better DOC and UV254 removal was observed with S-PAC than N-PAC. Results (Table 5 and Fig. 4) show that after 20 minutes of filtration DOC was 49% with S-PAC compared to 28% N-PAC. The same removal efficiency was observed in UV254 removal. At recommended time of backwashing (45 minutes), the removal of DOC was 25% with S-PAC and 18% with N-PAC. S-PAC was exhausted after 90 minutes while N-PAC exhausted after 60 minutes of filtration. The specific UV Absorbance (SUVA) is also used to classify the dominant group of DOC components. If SUVA ≤ 2 L/mg-m non-humic NOM (e.g polysaccarides and proteins) is most likely to be a dominant group in raw water. When SUVA 4 L/mg-m, then the raw water is rich in humic substances (Amy, 2006). The values of SUVA for raw water and permeate for Delft canal water after filtration through S-PAC and N-PAC were ranging between 2.33 – 2.7 suggesting that both raw and permeates are composed of both humic and non-humic substances. The value of SUVA after S-PAC filtration in the first 20 minutes was lowered from 2.5 to 2.35 suggesting that hydrophobics were better removed than hydrophilics (non-humic). Also, initially SUVA value rise to 3.23 from 2.5 suggesting that rapid removal of biopolymers (polysaccharides) compounds and thereafter SUVA decline as humic fraction is also removed. The same story was observed for N-PAC initially when SUVA value rise indicates that biopolymers are removed but the value is less compared with S-PAC. Also, the SUVA value declines from 2.5 to 2.47 showing low removal of hydrophobics (humic) in the first 20 minutes.
≥
The hydrophobic fraction represents almost 50% of DOC with larger molecular weight while hydrophilic fraction is composed of 25-40% of DOC with lower molecular weight and their are commonly known as non-humic substances. The transphilic fraction is comprised with approximately 25% of DOC and its molecular weight ranged between hydrophobic and hydrophilic fractions (Tobar, 2007). Therefore, when S-PAC DOC up taking rate is compared to N-PAC then particle size is likely to influence the adsorption rate.
Super ground PAC in combination with Ceramic Micro-filtration © TECHNEAU - 17 - December 22, 2008

The particle sizes of S-PAC are roughly smaller than N-PAC, thus having large surface area which means more adsorption sites. The research done by (Matsui et al., 2005) concluded that S-PAC removed NOM better than normal PAC did, owing to improvements in both adsorption kinetics and capacity. However there is a different opinion regarding the capacity of activated carbon from (Armenate, 2007). The study by (Armenate, 2007) desribed the total surface area of the activated carbon used for adsorption to be not significantly affected by the particle size since micropore structure responsible for adsorption does not change despite the change of particle size (Armenate, 2007). This means that the adsorption capacities of small and large particles are not much different although the time required to achieve equilibrium can vary significantly because of the diffusion effects. The finer the particles mean equilibrium will be reached faster. While it needs one day for PAC to reach equilibrium GAC needs several days (Schippers et al., 2007a) Another study by (Najim et al., 1990) insisted that the use of smaller particles provide faster adsorption kinetics. Therefore, when we referred to those studies we can suggest that capacity has significant importance when it comes to the question of comparing the different adsorbents and not the particle sizes of the adsorbent itself but the particle size is mostly affected by adsorption kinetics. The time taken by N-PAC to reach exhaustion is shorter (30 minutes less) than S-PAC, therefore this shows that the S-PAC has high capacity than N-PAC as observed by (Matsui et al., 2005). In general the results show that S-PAC and N-PAC in the form of pre-coat can be applied to remove NOM then the use of membrane alone. This is also was found by (Tomaszewska and Mozia, 2002) when they find that PAC/UF was very effective in removal of Humic Acid (HA) to 90% compared with UF alone (40%) when 100mg/l continuous dosing was used.
Conclusion: The removal of DOC and UV254 is much effective in the first 20 minutes with 50% for S-PAC and 28% for N-PAC. S-PAC exhausted after 90 minutes while N-PAC exhausted after 60 minutes (S-PAC is better in kinetic ).
ii) Atrazine Removal
Atrazine (100µg/l) was dosed in Milli Q water to determine the removal efficiency of atrazine with S-PAC (48 layers) and N-PAC (7 layers) at the same bed volume (0.025cm3). An average flux of 170L/m2.h was maintained. Samples were taken from to time to time. DOC, UV254 and atrazine were measured. The results are shown below:
Super ground PAC in combination with Ceramic Micro-filtration © TECHNEAU - 18 - December 22, 2008
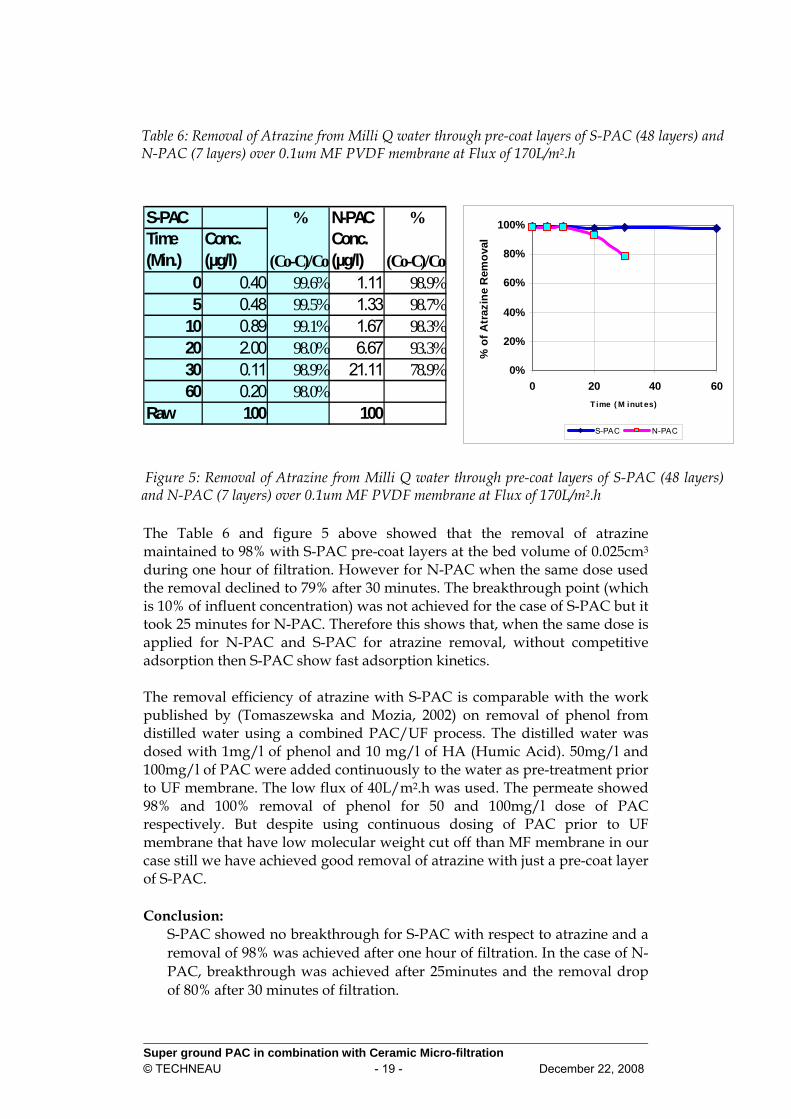
Super ground PAC in combination with Ceramic Micro-filtration © TECHNEAU - 19 - December 22, 2008
0%
20%
40%
60%
80%
100%
0 20 40 6Time ( M inut es)
% o
f Atr
azin
e R
emov
al
0
S-PAC N-PAC
The Table 6 and figure 5 above showed that the removal of atrazine maintained to 98% with S-PAC pre-coat layers at the bed volume of 0.025cm3 during one hour of filtration. However for N-PAC when the same dose used the removal declined to 79% after 30 minutes. The breakthrough point (which is 10% of influent concentration) was not achieved for the case of S-PAC but it took 25 minutes for N-PAC. Therefore this shows that, when the same dose is applied for N-PAC and S-PAC for atrazine removal, without competitive adsorption then S-PAC show fast adsorption kinetics. The removal efficiency of atrazine with S-PAC is comparable with the work published by (Tomaszewska and Mozia, 2002) on removal of phenol from distilled water using a combined PAC/UF process. The distilled water was dosed with 1mg/l of phenol and 10 mg/l of HA (Humic Acid). 50mg/l and 100mg/l of PAC were added continuously to the water as pre-treatment prior to UF membrane. The low flux of 40L/m2.h was used. The permeate showed 98% and 100% removal of phenol for 50 and 100mg/l dose of PAC respectively. But despite using continuous dosing of PAC prior to UF membrane that have low molecular weight cut off than MF membrane in our case still we have achieved good removal of atrazine with just a pre-coat layer of S-PAC. Conclusion:
S-PAC showed no breakthrough for S-PAC with respect to atrazine and a removal of 98% was achieved after one hour of filtration. In the case of N-PAC, breakthrough was achieved after 25minutes and the removal drop of 80% after 30 minutes of filtration.
Table 6: Removal of Atrazine from Milli Q water through pre-coat layers of S-PAC (48 layers) and N-PAC (7 layers) over 0.1um MF PVDF membrane at Flux of 170L/m2.h
Figure 5: Removal of Atrazine from Milli Q water through pre-coat layers of S-PAC (48 layers) and N-PAC (7 layers) over 0.1um MF PVDF membrane at Flux of 170L/m2.h
S-PAC % N-PAC %Time (Min.)
Conc. (µg/l) (Co-C)/Co
Conc. (µg/l) (Co-C)/Co
0 0.40 99.6% 1.11 98.9%5 0.48 99.5% 1.33 98.7%
10 0.89 99.1% 1.67 98.3%20 2.00 98.0% 6.67 93.3%30 0.11 98.9% 21.11 78.9%60 0.20 98.0%
Raw 100 100

3.1.2 Removal of UV254 and Atrazine with Competitive adsorption In real water, NOM is also present as well as pesticides such as atrazine. Competitive adsorption between atrazine and NOM may occur for adsorption site. A laboratory experiment was conducted to investigate the fate of atrazine in a competitive adsorption. Therefore atrazine was added to the pre-filtered delft canal water (with 0.45µm cellulose filters) to a concentration of 0.1mg/l. The delft water canal was then filtered on MF PVDF membrane (0.1 µm) through 0.025cm3 bed volumes of S-PAC dose and N-PAC dose respectively.
S-PAC N-PAC
Average Flux (L/m2.h) 145 145
No. of MF PVDF filters 2 2
Initial Pressure (bar) 0.2 0.15
Equivalent no. of Layers with 70mg/l 48 7
Concentration of Atrazine (mg/l) 0.1 0.1 The results are summarized below:
Table 7: Removal of UV254 with 70mg/l S-PAC and 70mg/l N-PAC pre-coat on 0.1µm MF PVDF membrane at average flux of 145L/m2.h
S-PAC N-PAC
Time (Min.)
UV254
(cm-1) UV/Vo (UVo-UV)/UVo
UV254
(cm-1) UV/Vo (UVo-UV)/UVo0 0.05 0.09 91.3% 0.07 0.13 87.1%
10 0.16 0.31 68.8% 0.28 0.54 45.8%20 0.22 0.43 57.5% 0.35 0.68 32.3%30 0.27 0.51 49.0% 0.39 0.74 25.8%45 0.33 0.64 36.3% 0.42 0.80 20.2%60 0.38 0.73 26.9% 0.43 0.83 16.5%90 0.43 0.82 17.7% 0.46 0.88 11.7%
120 0.45 0.86 13.7% 0.48 0.92 8.5%Raw 0.52 0.52
Super ground PAC in combination with Ceramic Micro-filtration © TECHNEAU - 20 - December 22, 2008

Table 8: Atrazine Removal with 70mg/l S-PAC and, 70mg/l N-PAC and without dose (Blank) by 0.1µm MF PVDF membrane at average flux of 145L/m2.h
NO PAC N-PAC S-PAC
Time (Minutes)
Conc. (µg/l) (C/Co) % (Co-C)/Co
Time (Min.)
Conc.(C)-µg/l (C/Co) % (Co-C)/Co
Conc.(C) - µg/l (C/Co) % (Co-C)/Co
0 92 0.9 0.1 0 1.4 0.014 98.6% 1.55 0.016 98.5%15 93 0.9 0.1 10 35.0 0.350 65.0% 2.9 0.029 97.1%30 100 1.0 0.0 20 40.0 0.400 60.0% 10.5 0.105 89.5%45 100 1.0 0.0 30 40.0 0.400 60.0% 22.5 0.225 77.5%60 100 1.0 0.0 45 45.0 0.450 55.0% 30 0.300 70.0%75 100 1.0 0.0 60 45.0 0.450 55.0% 37.5 0.375 62.5%90 96 1.0 0.0 90 80.0 0.800 20.0% 70 0.700 30.0%
120 93 0.93 0.1 120 80.0 0.800 20.0% 70 0.700 30.0%Raw 100
0%
20%
40%
60%
80%
100%
0 10 20 30 40 50 60 70 80 90 100 110 120
Time (Minutes)
% o
f Atra
zine
Rem
oval
S-PAC N-PAC NO PAC BW (T=45Min.)
0%
20%
40%
60%
80%
100%
0 10 20 30 40 50 60 70 80 90 100 120
Time (Minutes)
S-PAC N-PAC BW (t = 45 Min.
%UV Removal
Figure 7: UV Removal with 70mg/l S-PAC dose and 70mg/l N-PAC dose by 0.1µm MF PVDF membrane at Average Flux of 145L/m2.h
Figure 6: Atrazine Removal with 70mg/l S-PAC dose, 70mg/l N-PAC dose and without dose (Blank) by 0.1µm MF PVDF membrane at Average Flux of 145L/m2.h Where 45min is a time recommended for Backwashing. BW was not done actual it is only assumed.
Super ground PAC in combination with Ceramic Micro-filtration © TECHNEAU - 21 - December 22, 2008

Table 9: Summary of UV and Atrazine Removal with 70mg/l S-PAC, 70mg/l N-PAC dosed as pre-coat and Blank on a 0.1um MF PVDF membrane at average flux of 145L/m2.h
Time UV254 Removal -SPAC
UV254 Removal - NPAC
Atrazine Removal -70 mg/l SPAC
Atrazine Removal
–70mg/l N-PAC
20 57 % 32 % 90 % 60 % 45 36 % 20 % 70 % 55 % 60 27 % 16 % 63 % 55 % 90 17 % 11 % 30 % 20 %
The blank experiment (without dose) shows almost no removal of atrazine this is suggesting that atrazine is removed by adsorption through S-PAC or N-PAC and can not be removed by membrane alone as explained by (Mozia and Tomaszewska, 2003) that MF and UF membrane can not remove NOM and SOCs without pre-treatment.
The results presented in table 9 shows that the removal of atrazine from canal water with S-PAC pre-coated on PVDF membrane was 90% and 63% after 20 and 60 minutes respectively. In case of N-PAC, the removal efficiency of atrazine was 60% and 55% after 20 and 60 minutes respectively. It was observed that there is a declining of the removal efficiency when compared with atrazine removal from Milli Q water that showed 99% and 93% for S-PAC and N-PAC respectively after 20 minutes. The decline in removal efficiency of atrazine from Delft water compared with Milli Q water is caused by competitive adsorption of NOM.
Assuming that a filtration cycle is 45 minutes (BW after 45 min.) and the pre-coat layer is refreshed from membrane after 45 minutes then 70% of atrazine can be removed with S-PAC from Delft canal water compared to 55% with N-PAC. The breakthrough of atrazine removal with S-PAC observed after 20 minutes while N-PAC sowed breakthrough after 3 minutes, and after 1 hour of filtration the adsorption sites started to becomes exhausted then atrazine probably is adsorbed in a preloaded PAC and its removal is dramatically reduced
Nevertheless, (Kennedy et al., 2005) pointed that the performance of GAC on removal of pesticides depends on properties of natural organic matter (NOM) and not only the properties of pesticides alone. Conclusions:
Atrazine removal was affected by presence of NOM in surface water and the removal decline from 98% to 70% with S-PAC. Removal efficiency of atrazine with S-PAC was still better (70% after 45 min.) compared with N-PAC (55% after 45 min.)
Super ground PAC in combination with Ceramic Micro-filtration © TECHNEAU - 22 - December 22, 2008

3.1.3 Comparison of Atrazine Removal in Milli Q water (no competitive adsorption) with S-PAC and N-PAC pre-coated in a 0.1µm MF PVDF membrane at different dose
0.1mg/l of atrazine was dosed in Milli Q water, and S-PAC layer of 20mg/l which is equivalent to 14 layers were used for adsorptive filtration. Milli Q was also filtered through 70mg/l of N-PAC dose (7 layers) which is equal to 0.025cm3 bed volumes. The results were compared with previous results filtration of Milli Q water through 70mg/l of S-PAC (48 layers). Atrazine removal was measured with ELISA kits. The results are shown below:
Table 10: Comparison of Atrazine Removal with 20mg/l and 70mg/l of S-PAC with 70mg/l of N-PAC through 0.1um MF PVDF Membranes at Average Flux of 145L/m2.h
S-PAC 70mg/l
S-PAC 20mg/l
N-PAC 70mg/l
Time (Min.)
Conc. (µg/l) % (Co-C)/Co
Time (Min.)
Conc.(C)-µg/l (C/Co) % (Co-C)/Co
Atrazine Conc. (C)
N-PAC (C/Co) % (Co-C)/Co
0 0.4 99.6% 0 0.44 0.0044 99.6% 2.2 0.02 97.8%5 0.5 99.5% 10 0.9 0.0090 99.1% 4.8 0.05 95.2%
10 0.9 99.1% 20 1.44 0.0144 98.6% 16.8 0.17 83.2%20 2.0 98.0% 30 2.4 0.0240 97.6% 26.0 0.26 74.0%30 1.1 98.9% 45 2.32 0.0232 97.7% 32.0 0.32 68.0%60 2.0 98.0% 60 2.4 0.0240 97.6% 36.0 0.36 64.0%
Pre-filtered feed water 100 90 60 0.6000 40.0% 72.0 0.72 28.0%
120 76 0.7600 24.0% 72.0 0.72 28.0%Pre-filtered feed water 100
0%
20%
40%
60%
80%
100%
0 10 20 30 40 50 60 70 80 90 100 110 120
Time (Minutes)
Atra
zine
Rem
oval
%
20mg/l S-PAC (J=145L/m2h)70mg/l N-PAC (J=145L/m2.h70mg/l S-PAC (J=170L/m2.h)
Figure 8: Comparison of Atrazine removal with 20mg/l and 70mg/l of S-PAC with 70mg/l of N-PAC through 0.1um MF PVDF Membranes at average flux of 145L/m2.h
Super ground PAC in combination with Ceramic Micro-filtration © TECHNEAU - 23 - December 22, 2008

The results in Table 10 and Fig. 8 shows that 98% removal of atrazine can be achieved for up to 1 hour of filtration with 70mg/l of S-PAC (48 layers) at a flux of 170L/m2.h and 20 mg/l (14 layers) at a flux of 145L/m2.h. Alternatively, the removal efficiency of atrazine was much lower only (62%) after 1 hour of filtration for 70mg/l of N-PAC (7 layers).
Breakthrough was achieved after 65 minutes with S-PAC (20mg/l) while N-PAC (70mg/l) showed breakthrough after 15 minutes. Thus, the dose of S-PAC can be a factor of 3 lower than N-PAC. This was also supported by (Matsui et al., 2005) when he observed that NOM removal achieved with S-PAC at a dose of 5mg/l was not achieved by N-PAC even at a dose of 20 mg/l. (4 times higher).
Conclusions: 98% of atrazine was removed from Milli Q water with 20mg/l S-PAC while 65% of atrazine removal was achieved after 1 hour of filtration with 70mg/l N-PAC. Breakthrough achieved after 65 minutes with low dose of S-PAC (20mg/l) while N-PAC (70mg/l) took only 15 minutes.
Super ground PAC in combination with Ceramic Micro-filtration © TECHNEAU - 24 - December 22, 2008

3.1.4 Comparison of polymeric PVDF (0.1 µm) & Ceramic membrane (α-Al2O3 0.1 µm) pre-coated with S-PAC in terms of DOC & UV removal
A comparison between a polymeric PVDF membrane (flat sheet membrane tested in Amicon unstirred cell) and Ceramic membrane (a module with channels positioned upright) with S-PAC was performed on the basis similar number of pre-coat layers of S-PAC. The calculations shown in Appendix 2 indicated 47 and 48 layers for Ceramic and PVDF membrane respectively. The average flux used was 150L/m2.h. The delft water canal was used and filtrate samples were taken periodically. The DOC and UV254 for influent and effluent were measured to determine the removal efficiencies as shown below:-
Table 11: DOC and UV254 Removal with 48 Layers of S-PAC through 0.1um MF PVDF membrane and 47 Layers of 0.1 um MF Ceramic Membrane
MF PVDF Membrane CERAMIC MEMBRANE - PILOT
Time (Min.)
DOC (mg/l)
UV254
(cm-1)% DOC Removal
% UV Removal
Time (Min.) DOC (mg/l
UV254
(cm-1)% DOC Removal
% UV Removal
0 1.64 0.05 91.6% 89.1% 0 3.37 0.09 81.0% 84.1%5 5.87 0.13 69.9% 73.5% 10 8.82 0.22 50.2% 62.0%
10 6.55 0.16 66.4% 66.7% 15 12.42 0.34 29.9% 39.6%15 9.27 0.21 52.5% 57.4% 20 14.46 0.39 18.4% 30.9%20 9.97 0.23 48.9% 51.9% 30 15.88 0.47 10.3% 17.0%30 12.82 0.30 34.3% 38.1% 45 16.90 0.50 4.6% 11.5%45 14.55 0.37 25.4% 24.3% 60 17.31 0.53 2.3% 6.5%60 14.98 0.40 23.2% 17.9% 75 17.48 0.54 1.3% 4.2%75 15.90 0.42 18.5% 14.4% 90 17.61 0.54 0.6% 4.6%90 17.40 0.43 10.8% 12.1% 105 17.67 0.54 0.2% 4.6%
105 17.51 0.43 10.2% 10.7% 110 17.64 0.54 0.4% 5.3%
120 18.76 0.44 3.8% 9.9%Pre-filtered feed water 17.71 0.57
Pre-filtered feed water 19.50 0.49
0%
20%
40%
60%
80%
100%
0 10 20 30 40 50 60 70 80 90 100 110 120
Time (Minutes)
% D
OC
Rem
oval
0.1um PVDF Ceramic
0%
20%
40%
60%
80%
100%
0 10 20 30 40 50 60 70 80 90 100 110 120
Time (Minutes)
% U
V R
emov
al
0.1um PVDF Ceramic
Super ground PAC in combination with Ceramic Micro-filtration © TECHNEAU - 25 - December 22, 2008
Figure 9: DOC Removal with 47 Layers of S-PAC over 0.1um PVDF membrane 0.1 um Ceramic Membrane
Figure 10: UV254 Removal with 47 Layers of S-PAC on 0.1um PVDF membrane and 0.1 um Ceramic Membrane

The results shows that after 20 minutes of filtration PVDF membrane achieved 50% removal for both DOC and UV, while ceramic membrane achieved 20% removal for DOC and 30% removal of UV (Table 11, Fig. 9 and Fig. 10). The pre-coat layer of S-PAC in the ceramic membrane was exhausted (10% removal) after 30 minutes and 50 minutes respectively for DOC and UV removal, while DOC and UV removal with PVDF membrane exhausted after 90 minutes.
The PVDF membrane shows better results than ceramic membrane. Possible reason for low removal in ceramic is poor dispersion of the PAC layers inside the Ceramic membrane module. The second reason may be some of the PAC remained in suspension and did not take part in the pre-coat. This is because not all the water was emptied before filtration as in the case of PVDF membrane where the pre-coat layer was completely created by drying the suspension with pressure vessel.
The orientation and configuration of ceramic module make the task of distributing the PAC layers evenly through the tubular ceramic channels to be more difficult compared with the flat sheet membranes like PVDF and ceramic membrane. While the PVDF membrane was placed horizontal in the Amicon unstirred cell, ceramic membrane was oriented vertical, and this may affect the distribution of PAC as the two forces gravitational and hydraulic pressure are meet together.
Figure 11: Ceramic Membrane Module (Interior structure)
Figure 12: Used MF PVDF membrane covered with S-PAC
Conclusions: After 20 minutes, 50% removal was achieved with PVDF membrane for both DOC and UV254 while ceramic membrane achieved 20% removal for DOC and 30% removal of UV254. S-PAC in ceramic membrane exhausted after 30 minutes (DOC) and 50 minutes (UV) respectively while with PVDF membrane exhausted after 90 minutes.
Super ground PAC in combination with Ceramic Micro-filtration © TECHNEAU - 26 - December 22, 2008

3.1.5 PAC Cake Fouling
A batch experiment was carried out to determine the impact of NOM adsorption on S-PAC, N-PAC and the PVDF membrane. Pre-filtered (through 0.45µm Filter) Delft canal water was used for all 3 experiments. The dose of S-PAC and N-PAC used was 70mg/l and the starting pressure was 0.2 bars. Single, double and triple filters were used for S-PAC, N-PAC and blank respectively. The reason was to control flux in order to create average operating conditions.
0
2
4
6
8
10
12
14
0 10 20 30 40 50 60Time (Minutes)
Res
ista
nces
(m-1
) x 1
011
S-PAC (J=150L/m2.h) N-PAC (J=150L/m2.h)Blank (J = 200L/m2.h)
Figure 13: Resistances of 0.1um PVDF membrane with S-PAC, N-PAC pre-coat layers and Blank membrane at average flux of 150L/m2.h
The initial pressure at the beginning of experiment was 0.2 bars for all experiments. There was no increase on pressure for pre-filtered canal water with the MF PVDF membrane. The DOC removal for the blank was 5% indicates the fouling is slowly taking place. However the pressure of 0.2 bars is little bit high so it is difficult to notice the increase of resistances especial in the beginning of experiment. Therefore the resistance remained constant as shown in figure 13. It was observed that when raw water filtered through 70mg/l N-PAC pre-coat layer, the resistance increase from 4.5 to 7 x 10¹¹ m-1 after 1 hour of filtration with average Flux of 150 L/m2.h. But the filtration of raw water through 70mg/l of S-PAC shows different phenomena. The resistance rise from 2.7 to 13.5 x 10¹¹ m-1 after 1 hour of filtration as shown by the figure 13 above. PAC Cake Fouling may occur through adsorption of NOM, particulates and metal ions (Zhao et al., 2005). PAC may forms a cake layer combined with colloids, metals and NOM, providing an adsorption zone for further removal of NOM or hydraulic resistance layer to permeation (Zhao et al., 2005). All three constituents can take part simultaneously or individually.
Super ground PAC in combination with Ceramic Micro-filtration © TECHNEAU - 27 - December 22, 2008

Particulates are assumed to be negligible since the water was pre-filtered by using 0.45um that removes turbidity as well as some of organic matter. Metal ions that were dominant in Delft water canal are Calcium and Magnesium that were found in the range of 120 – 140 mg/l for Ca and 25 mg/l for Mg (Kamanyi, 2006). But the notable metal ion that may highly contribute to PAC fouling is Iron II when oxidized to Iron III (Zhao et al., 2005). However Iron II is not expected in surface water in aerobic conditions and most of the iron in the canal water is already present in Fe3+ form (Schippers et al., 2007a). Therefore, what is remaining is NOM that is adsorbed in PAC and form PAC cake fouling.
The results shows high increase rate of resistances for S-PAC compared with N-PAC and blank experiment which however, showed slightly increase of resistances which almost constant which strongly support that MF membranes can not remove NOM without pre-treatment. Conclusions: The rapid rise of resistance of filtration through S-PAC layer compared with N-PAC layer. This is suggesting that there a resistant layer is formed by either the adsorbed NOM or strained NOM. Blank test results showed that NOM without pre-treatment is not removed with Ceramic or PVDF membrane alone.
3.1.6 LC-OCD Test for filtrate of S-PAC and N-PAC
The samples from adsorptive filtration of S-PAC and N-PAC were further analysed to determine the fate of NOM components on adsorption. The samples were taken at interval of 15 minutes for a period of 1 hour. Therefore, 5 samples of S-PAC and N-PAC each were analysed in Harlem laboratory. The results are shown by the following tables and graphs.
Table 12: Composition of Delft Canal Water (NOM Fractions)
DOC (MG/L)
BIOPOLYMERS
HUMIC SUBSTANCE (HS)
BUILDING BLOCKS
NEUTRALS
LMW ACIDS
15.4 8.4% 66.7% 14.2% 10.6% 0.1% mwco > 20,000 Da 1,000–20,000 Da 300-500 Da < 350 Da < 350 Da The composition of Delft water Canal is mainly composed with Humic substances that are contributing to 2/3 of NOM fractions as shown in Table 12.
Super ground PAC in combination with Ceramic Micro-filtration © TECHNEAU - 28 - December 22, 2008

Table 13: DOC Fractions for permeates filtered through pre-coated layers of S-PAC & N-PAC at Flux of 145L/m2.h with MF PVDF membrane
SampleBiopolymers (mg/l)
HS (mg/l)
Building Blocks (mg/l)
Neutrals (mg/l)
Acids (mg/l)
S1 (t = 0) 0.081 1.543 0.215 0.345 0S2 (t =15) 0.082 4.71 0.806 0.519 0.008S3 (t = 30) 0.135 6.344 1.099 0.876 0.018S4 (t = 45) 0.182 8.142 1.521 0.989 0S5 (t = 60) 0.483 9.255 2.031 1.502 0.06RAW 1.299 10.299 2.195 1.639 0N1 (t = 0) 0.329 2.071 0.25 0.211 0.007N2 (t =15) 0.904 7.442 1.102 0.813 0.098N3 (t = 30) 1.028 8.501 1.617 1.006 0.159N4 (t = 45) 1.071 9.122 1.9 0.989 0N5 (t = 60) 1.137 9.649 2.231 1.305 0
The detailed results are shown in Appendix 3
a. b.
015 30 45 60
RA
W 015 30 45 60
Biopolymers (mg/l)Neutrals (mg/l)
0
0.5
1
1.5
2
2.5
Biopolymers (mg/l) Building Blocks (mg/l) Neutrals (mg/l)
S-PAC N-PAC
015 30 45 60
RA
W 015 30 45 60
Humic Substances
0
2
4
6
8
10
12
Humic Substances
S-PAC N-PAC
Figure 14: DOC Fractions of permeates of Delft Water Canal filtered in pre-coated MF PVDF membrane with S-PAC and N-PAC respectively. (a) Biopolymers, Building Blocks and Neutrals (b) Humic Substances (HS)
Super ground PAC in combination with Ceramic Micro-filtration © TECHNEAU - 29 - December 22, 2008

Table 14: Fractions of NOM
Fraction categories Definition Humics (HS) Humic and Fulvic Acids (1,000 – 20,000 Da) Building Blocks Weathering and oxidation products of Humics (300
– 500 Da) Low molecular Weight (LMW) organic Acids
Aliphatic low molecular weight organic acids (< 350 Da)
LMW Neutrals Alcohol, Aldehydes, ketones (< 350 Da) Biopolymers Associated with peptides or proteins and
originated from algae and bacteria (> 20,000 Da) Source (Kennedy et al., 2005) 100,000 Da ≈ 10 nm Pore sizes of PAC/GAC < 2 nm micropore > 50 nm macropore 2 – 50 nm mesopore Figure 14 showed S-PAC removed > 80% of biopolymers after 45 minutes of filtration compared with 20% removal by N-PAC at the same time. Also, S-PAC removed 40% of Humic substance (H.S) after 30 min while N-PAC removed only 20% of H.S (after 30 min.). Humic substances have a wide range of molecular weight cut off (mwco) but also contribute to 2/3 of the NOM fractions that made to be a major cause of fouling in case of canal water.
The removal of Building blocks by S-PAC is 50% after 30 minutes which is better than N-PAC removal of 30% after 30 minutes. However, both S-PAC and N-PAC achieved 40% removal of neutrals after 45 minutes of filtration. In general, Humic substances showed poor removal as well as building blocks. On regards of pore sizes, Biopolymers can only be removed by mesopore, therefore when the pore size is exhausted then this fraction starts to be resistant to removal. The bed porosity of S-PAC layer is 0.045µm (0.15d) that form straining which enable physical removal of biopolymers due to their large molecular weight than other NOM (> 0.002μm) and hence cause rapid increases of resistances in S-PAC. Humics can be removed by micropores and mesopores and LMW and building blocks can be removed with micropore. Therefore when micropore is also exhausted LMW Acids, humics and building blocks are starting to suffer. N-PAC also showed good removal of biopolymers and LMW Acids in the first 15 minutes. Conclusion: LC-OCD test showed high removal of biopolymers (>80%) in the first 45 minutes with S-PAC which is influenced by physical removal with straining phenomena. Also LMW Acids were removed significantly in the first 30 minutes with poor removal of humics and building blocks after 15 minutes of adsorptive filtration.
Super ground PAC in combination with Ceramic Micro-filtration © TECHNEAU - 30 - December 22, 2008

3.2 Modelling
To predict of breakthrough of the adsorbent, models that make use of isotherm parameters, mass balance and mass transfer equations are employed. Therefore the linear driving force model (LDF) is applied to illustrate the adsorption of atrazine through S-PAC. Stimela software package developed by TU Delft, KIWA and DHV was applied.
Stimela was used to compare the Laboratory results of atrazine removal with S-PAC and N-PAC without competitive adsorption. The adsorption capacity (K) and adsorption intensity (n) for atrazine removal with GAC determined by Orlandini (1999) were adopted for modelling. It is assumed that there is no significant change on K and n values with variation of PAC particle sizes what is varying is the time to reach equilibrium (Armenate, 2007). Therefore, K value and n adopted are 7.14 and 0.18 respectively. Mass transfer coefficients as a function of unit time (K2) was calculated for S-PAC is shown in Appendix 1. The effluent concentration was periodically measured and compared with influent.
3.2.1 Modelling Atrazine (0.1 mg/l) adsorption on 20mg/l S-PAC pre-coat layer through 0.1µm MF PVDF membrane
K2 value was calculated based on effective size of 0.3um of S-PAC as shown in Appendix 1. The data input for Stimela Modelling are shown below: Stimela Online Dynamic
Activated carbon filter - Laboratory No. Input Parameter Quantity Unit Remarks 1. Filter run time 0.08 Days 2. Filter surface Area 0.00264 m2 3. Bed height 0.00001 m 4. Water Flow 0.00038 m3/h 5. Grain size 0.0003 mm S-PAC Effective
size 6. Filter Porosity 50 % 7. Mass Density of
Activated Carbon 500 Kg/m3
8. Freundlich constant - n 0.18 9. Freundlich constant - K 7.14 (g/kg)*(m3/g)n 10 Mass Transfer Coefficient
– K2 4178864 h-1 K2 calculations -
see Appendix 1 11. Completely Mixed
reactor 1
Super ground PAC in combination with Ceramic Micro-filtration © TECHNEAU - 31 - December 22, 2008

Table 15: Laboratory results for Atrazine Effluent (20mg/l S-PAC)
S-PAC - 20m g/l
Tim e (m inutes)
Atrazine Conc - C (m g/l) C /C 0
0 0.00044 0.004410 0.0009 0.00920 0.00144 0.014430 0.0024 0.02445 0.00232 0.023260 0.0024 0.02490 0.06 0.6
120 0.076 0.76Raw (C o) 0.1
Figure 15: Laboratory and Modelling results of atrazine removal through S-PAC (20mg/l) with PVDF membrane at Average Flux of 145L/m2.h
NB: The experimental data are shown in point form while Modelling results are shown by a curve (line) Both laboratory results and modelling shows the breakthrough point after a 1 hour. The removal of atrazine after 2 hours from laboratory results was 24% and the model results shows 20% removal so it is quite similar. The difference is about 16% between the two value Both Model and Laboratory results shows that removal efficiency of more than 90% in the first hour of filtration Conclusion:
Both laboratory and modelling results of atrazine removal with 20mg/l S-PAC in PVDF membrane shows breakthrough after a 1 hour
Super ground PAC in combination with Ceramic Micro-filtration © TECHNEAU - 32 - December 22, 2008

4.0 CONCLUSIONS 4.1 Adsorptive Filtration through S-PAC and N-PAC (70mg/l pre-coat layers with bed volumes of 0.025cm3)
• The breakthrough points (C = 10%Co) were just achieved within first 5
minutes of filtration. Also, 50% of DOC and UV254 removal was achieved after 20 minutes with S-PAC and 30% with N-PAC respectively S-PAC exhausted (C = 90%Co) after 90 minutes of Filtration while N-PAC exhausted after 60 minutes when a flux of 145L/m2.h applied to the filtration of Delft water canal.
• The formation of PAC cake fouling was very rapid in S-PAC than in
N-PAC. Total resistance of membrane increases from 3 to 13 x 1011 m-1 in case of S-PAC and from 4.5 to 7 x 10¹¹ m-1 for N-PAC. The increase of resistance slope by S-PAC was 4 times more than N-PAC indicates high rate of adsorption of S-PAC and therefore can reduce membrane fouling more than N-PAC.
• Humics (HS) contribute to 2/3 of NOM in Delft water canal and is a
major cause of fouling. Biopolymers and LMW Acids are major components that contribute to PAC cake layer fouling. The bed porosity of S-PAC is 0.045μm (0.15d) suggesting that biopolymers are subject to physical removal by micro-straining formed by bed porosity of S-PAC. This might be the reason for rapid resistance increase when S-Pac pre-coat layer is used.
• Atrazine removal was maintained to 99% with 70mg/l of S-PAC after
1 hour and drop to 80% after 30 minutes with 70mg/l of N-PAC without NOM competition. No breakthrough achieved after 1 hour filtration through S-PAC but with N-PAC it was achieved after 25min. S-PAC (20mg/l) shows better removal of atrazine achieving 98% removal compared with 65% with 70mg/l of N-PAC without competition. 20mg/l of S-PAC achieve breakthrough after 1 hour of filtration.
• Atrazine removal is affected by NOM as both compete for the
available adsorption sites. Atrazine removal drop from 99% (without competition) to 62% (with competition) after 1 hour of filtration with 70mg/l of S-PAC, and drop to 55% (under competition) from 65% (without competition) after 1 hour of filtration with 70mg/l N-PAC (pre-coat layers).
• Breakthrough point for Atrazine removal (under competition) was
achieved after 20 minutes with 70mg/l of S-PAC and took about 5 minutes with the same dose of N-PAC. The adsorption of atrazine is affected by competition with NOM but atrazine has a negligible effect on DOC and UV254 removal since its concentration is very low.
Super ground PAC in combination with Ceramic Micro-filtration © TECHNEAU - 33 - December 22, 2008

• PVDF membrane with 48 layers of S-PAC shows better removal results on DOC and UV254 than ceramic membrane with 47 layers of S-PAC at a Flux of 150L/m2.h. DOC and UV254 removal with S-PAC in ceramic membrane exhausted after 30 minutes and 50 minutes respectively while with PVDF membrane exhausted after 90 minutes. PVDF membrane achieves 50% removal of DOC and UV254 after 20 minutes while ceramic membrane achieves 20% removal of DOC and 30% removal of UV254. This is suggesting that PAC layers were not well dispersed in Ceramic membrane channels.
4.2 Modelling
• The laboratory results shows similar trend with Modelling for S-PAC
with breakthrough point achieved after 1 hour. Therefore it is economical to use finer particles and refreshed by the new pre-coat layer after 1 hour of filtration
• Stimela Model is promising a chance for prediction of breakthrough
curve behaviour for S-PAC; however more laboratory experiments are required to validate the statement.
. General Conclusion: S-PAC showed better removal efficiency for atrazine, DOC & UV254 in both situations (with and without competition) at the same dose and lower dose than N-PAC
Super ground PAC in combination with Ceramic Micro-filtration © TECHNEAU - 34 - December 22, 2008

5.0 References Amy, G. (2007) Low Pressure Membranes & Advanced Water Treatment
Technology. Lecture Notes, Delft. Armenate, P. M. (2007) Adsorption. Lecture notes. Dong, B. Z., Chen, Y., Gao, N. Y., and Fan, J. C. (2006) Effect of pH on UF
membrane fouling. Desalination, 195(1-3), 201-208. K. Sundaramoothy, A. Brugger, S. Panglisch, A. Lerch, and Gimbel, R. (2004)
Studies on the minimisation of NOM fouling of MF/UF membranes with the help of a submerged "single"capillary membrane apparatus. Desalination 179 (2005) 355-367.
Kamanyi, J. (2006) UF membrane fouling by Natural Organic Matter (NOM) : the effect of Divalent Cations, NOM Composition and size. MSc Thesis, UNESCO-IHE, Delft - The Netherlands.
Kennedy, M. D., Chun, H. K., Quintanilla Yangali, V. A., Heijman, B. G. J., and Schippers, J. C. (2005) Natural organic matter (NOM) fouling of ultrafiltration membranes: fractionation of NOM in surface water and characterisation by LC-OCD. Desalination, 178(1-3), 73-83.
Kennedy, M. D., Schippers, P. J. C., and Sharma, S. (2007) Desalination & Membrane Related Technology. Lecture Notes, Delft.
Lee, N., Amy, G., Croue, J.-P., and Buisson, H. (2004) Identification and understanding of fouling in low-pressure membrane (MF/UF) filtration by natural organic matter (NOM). Water Research, 38(20), 4511-4523.
Matsui, Y., Murase, R., Sanogawa, T., Aoki, N., Mima, S., Inoue, T., and Matsushita, T. (2005) Rapid adsorption pretreatment with submicrometre powdered activated carbon particles before microfiltration. Water Science and Technology, 51(5-6), 249-256.
Mozia, S., and Tomaszewska, M. (2003) Treatment of Surface Water using hybrid Process - Adsorption on PAC and Ultrafiltration. Desalination, 162(2004), 23 - 31.
Najim, I. N., Snoeyink, V. L., Anselme, C., and Baudin, I. (1990) Effect of particle size and background natural organics on the adsorption efficiency of PAC. Amercan Water Works Association, 82(1), 65-72.
Orlandini, E. (1999) Pesticide Removal by Combined Ozonation and Granular Activated Carbon Filtration. Phd Thesis, Delft, 170.
Pontie, M., Thekkedath, A., Kecili, K., Habarou, H., Suty, H., and Croue, J. P. (2006) Membrane autospy as a sustainable management of fouling phenomena occuring in MF, UF and NF processes. Desalination, 204, 155-169.
Schippers, J. C., Petrusevski, B., Sharma, S. K., and Amy, G. L. (2007a) Groundwater Resources and Treatment Part 1. LN0263a/07/1, Delft.
Seo, G. T., Ohgaki, S., and Suzuki, Y. ( 1997) Sorption characteristics of biological powdered activated in bpac-mf (biological powdered activated carbon - microfiltration) system for refractory organic removal. Water Science and Technology, 35(7), 163-170.
Tobar, F. P. M. (2007) Removal of Natural Organic Matter (NOM) in integrated Membrane Systems. MSc Thesis(UNESCO-IHE).
Super ground PAC in combination with Ceramic Micro-filtration © TECHNEAU - 35 - December 22, 2008

Tomaszewska, M., and Mozia, S. (2002) Removal of organic matter from water by PAC/UF system. Water Research, 36(2002), 4137-4143.
Upadhyaya, A. K. (1995) Modelling Competititve Adsorption of Pesticides and natural organic matter. Msc Thesis, Delft.
Xia, S., Li, X., Zhang, Q., Xu, B., and Li, G. (2007) Ultrafiltration of surface water with coagulation pretreatment by streaming current control. Desalination, 204(1-3), 351-358.
Zhao, P., Takizawa, S., Katayama, H., and Ohgaki, S. (2005) Factors causing PAC cake fouling in PAC-MF 9powdered activated carbon microfiltration) water treatment systems. Water Science and Technology, 51(6-7), 231-240.
Super ground PAC in combination with Ceramic Micro-filtration © TECHNEAU - 36 - December 22, 2008

6. 0 APPENDICES Appendix 1
EXTERNAL MASS TRANSFER COEFFICIENT (Kf)DATA INPUTPorosity (PAC) - ε 0.5Membrane Diameter (d) 0.058 mAverage Flow - Q 0.38 L/hDensity of water ρ 1000 kg/m3
Temperature of water (T) 20 0CAssociation parameter for Water (X) 2.6Molecular wt of Water (M) 18 g/moleMolar Mass of atrazine (m) 215.685 g/moleDensity of atrazine (ρa) 1.187 g/cm3
Particle diameter -d1 0.0003 mm
DATA OUTPUTDynamic viscosity (µ) 0.00100586
Kinematic Viscosity (ע) 1.0059E-06
Radius of membrane filter - R 0.029 m d/2
Average flow in m3/s - Q 1.0556E-07 m3/s
Membrane Area - A 0.00264314 m2 A = πd2/4
Filtrate Velocity (V) 3.9936E-05 m/s V=Q/A
Molar volume of atrazine (Vb) 181.705981 g/cm3 Vb =m/ρa
Diffusity of Atrazine (DAB) 6.5023E-06 cm2/s
Reynolds Number - Re 2.30 OK(0.0016<Re<55 )
Schmidt Number - Sc 1.55E+03 OK(165<Sc<70,600 )
Sherwood Number - Sh 2589
External Mass Transfer Coefficient - Kf 0.10 m/h
MASS COEFFICIENT (K2)
Mass Transfer Coefficient - K2 4,178,864 1/h
5.1
3
)5.42(10497
+=
−
Txμ
ρμυ =
υRV2Re =
ABDSc υ
=
ε
31
)(Re09.1 ScSh =
RDSh
Kf AB
2.
=
6.0
5.011 )273()(10*4.7
bAB V
TXMDμ
+= −
)1(6
12 ε−
=d
KK f
Super ground PAC in combination with Ceramic Micro-filtration © TECHNEAU - 37 - December 22, 2008

Appendix 2
Number of layers formed in S & N-PAC pre-coat
Submicron Powder activated carbon (S-PAC) with effective size of 0.3µm and Normal Powder activated carbon (N-PAC) with effective size of 2µm was used to form pre-coat layers. 180ml of PAC solutions containing 70mg/l of S-PAC and N-PAC each were filtered through 0.1µm PVDF membrane placed Amicon unstirred cell until it is completely dry at constant pressure of 0.2bars. The layers of S-PAC or N-PAC containing 12.6mg or 0.025cm3 are formed at the top of MF PVDF membrane. This is equivalent to 48 layers for S-PAC and 7 layers in case of N-PAC. The below calculations show the calculations procedures.
C). PVDF membranePAC (mg/l) - C 70Particle diam.(um) - d 0.3Volume Filtered (L) - Vf 0.18Density (g/cm3) - ρ 0.5Weight of PAC (g) -M' 0.0126 M'=C.Vf/1000Volume of PAC (cm3) - Vb' 0.0252 Vb'=M'/ρVol. of 1 particle (cm3) - V1 1.41429E-14 V1=πd3/6
Membrane Area - Am 0.00264 m2
Area of 1 particle - A1 (m2) 7.07143E-14 A1 = πd2
No. of particles for Monolayer - n 3.73E+10 n =Am/A1
No of particles in Vol. Filtered - N 1.78182E+12 N=Vp'/V1
No. of layers - NT 48 NT=N/n
CALCULATIONS OF EMPTY BED CONTACT TIME (EBCT)EBCT = Vb/QWhere Vb = Carbon BedVolume, Q = Flow rate
Q ,and A = membraneArea
Vb = Vb' = 0.0252 cm3
Flux - J 180 (L/m2.h)Membrane Area -Am 0.00264 m2
Flow - Q = J*Am 0.4752 l/hEBCT 5.30E-05 Hours
Therefore Contact Time (Seconds) EBCT 0.19 Seconds
Super ground PAC in combination with Ceramic Micro-filtration © TECHNEAU - 38 - December 22, 2008

B). CERAMIC MEMBRANE WITH REDUCED AREAStock Solution (mg/l) 7,500 CtDosing rate (l/h) 5 qFeed Rate (Raw water) - Q in l/h 19.65 QTotal Flow QT= Q+q 24.65 QT
PAC (mg/l) - Do 1521.30 Do = q*Ct/QT t 2 Dosing timeParticle diam.(um) - d 0.3 dVolume Filtered (L) - V 0.66 V=Q.t Assume Dosage volume remained in membraneDensity (g/cc) - ρ 0.5 ρWeight of PAC (g) - M 0.996 M = Do.V A (m2) 0.131Volume of PAC (cm3) - Vp 1.993 Vp = M/ρ J (l/m2.h) 150Total Volume in one channel (cm3) - Vt 4.91 Vt=(πDc
2/4)*Lm Q (l/h) 19.65 Q= J/A
Total Volume of all channels in a module VT - (cm3) 88.39 VT=N.VtPercentage of PAC in a Module (R') channels 2.25% R' = (Vp/VT)*100%Total Number of Particles in one layer:Number of channels - N 18 N Channel diam. (mm) - Dc 2.5 mm Module length (m) - Lm 1Diameter of channel remained after PAC coat layer D1
% Percentage of channel remained after PAC dosing - R 97.75% R = 100 - R'0.977 R
Relationship between number of particles along the centre of channel (Nc) is given by D1 DcNc.d = (Dc - D1)/2 ..Eq.1 where d is particle diameterIf R is % of the channel that is not covered by PAC then,Volume of remained channel Vr = R x Vt where Vt is a total Volume of a channel
Vr = R.Vt where Vt is a volume of channelπ.D1
2.Lm/4 = R* π.Dc2.Lm/4 Nc
D1 = R1/2*Dc Equation 2From Equation 1: D1 = Dc - 2Nc.d, therefore substitute D1 in Equation 2
Dc - 2Nc.d = R1/2.Dc
Nc =(Dc - R1/2.Dc)/2d = Dc(1 - R0.5)/2d
Nc = number of layers formed in one channel after PAC dosingTherefore Total number of Layers in a module (NT) = Nc x N
Nc 47.24 Dc(1 - R0.5)/2d
Number of Layers - N 47 CALCULATIONS OF EMPTY BED CONTACT TIME (EBCT)
EBCT = Vb/QWhere Vb = Carbon BedVolume, Q = Flow rateQ = J.A, J = Flux and A =membrane Area
Vb = Vp = 1.99 cm3
Q = 20 l/hEBCT 1.01E-04 Hours
Therefore Contact Time (Seconds) EBCT 0.37 Seconds
Super ground PAC in combination with Ceramic Micro-filtration © TECHNEAU - 39 - December 22, 2008

Supe©
MF PVDF (0.1µm) Ceramic Membane (0.1µm) Dose (mg/l)
Number of Layers (S-PAC)
Number of Layers (N-PAC)
Dosing time (Minutes)
Number of Layers (S-PAC)
20 14 2 1 9 50 34 5 2 17 70 48 7 3 26 100 68 10 5 43 150 102 15 10 87
Table 16: Summary of Number of Layers of S-PAC and N-PAC over MF membrane (0.1um) for different doses
r ground PAC in combination with Ceramic Micro-filtration TECHNEAU - 40 - December 22, 2008
Based on number of layers, filtration experiments using pre-filtered surface water and then Milli Q was done to compare the removal efficient of atrazine, DOC (mg/l) and UV254 by using S-PAC and N-PAC.

Appendix 3: LC-OCD Tests for N-PAC & S-PAC permeates and Pre-filtered Delft Water Canal Project: 0 Partitioning of Organic Carbon (OC) Chromatographic Fractionation of Organic Carbon (CDOC) (UV@254 nm)sampl.date 1/0/1900 Approx. Molecular Weights in g/mol: >>20.000 ~1000 (see separate HS-Diagram) 300-500 <350 <350
TOC=DOC+POC DOC=CDOC+HOC
Note: POC, hence TOC may be too low Bio- Humic Building Neutrals Acids Inorg. SUVATOC DOC POC HOC CDOC Polymers DON Subst. DON Aromaticity Mol-Weight Blocks Colloid.
total OC dissolved particul. hydrophob. hydrophil. (Norg) (HS) (Norg) (SUVA-HS) (Mn) SAC (SAC/OC)
ppb-C ppb-C ppb-C ppb-C ppb-C ppb-C ppb-N ppb-C ppb-N L/(mg*m) g/mol ppb-C ppb-C ppb-C (m -1 ) L/(mg*m)
% TOC % TOC % TOC % TOC % TOC % TOC -- % TOC -- -- -- % TOC % TOC % TOC -- --
Sample 2241 2215 26 32 2183 81 5 1543 87 3.05 641 215 345 0 0.03 2.82S1 100 98.8 1.2 1.4 97.4 3.6 -- 68.8 -- -- -- 9.6 15.4 0.0 -- --
Sample 6335 6297 38 172 6125 82 4 4710 348 3.65 605 806 519 8 0.04 3.18S2 100 99.4 0.6 2.7 96.7 1.3 -- 74.3 -- -- -- 12.7 8.2 0.1 -- --
Sample 8802 8581 221 110 8471 135 11 6344 473 3.43 586 1099 876 18 0.12 3.17S3 100 97.5 2.5 1.2 96.2 1.5 -- 72.1 -- -- -- 12.5 9.9 0.2 -- --
Sample 10995 10778 218 -56 10833 182 17 8142 352 3.90 608 1521 989 0 0.02 3.47S4 100 98.0 2.0 -0.5 98.5 1.7 -- 74.0 -- -- -- 13.8 9.0 0.0 -- --
Sample 13710 13413 297 82 13331 483 48 9255 781 4.33 570 2031 1502 60 0.08 3.48S5 100 97.8 2.2 0.6 97.2 3.5 -- 67.5 -- -- -- 14.8 11.0 0.4 -- --
Sample 2854 2854 n.n. -14 2868 329 28 2071 127 3.30 609 250 211 7 0.04 2.97N1 100 100.0 -- -0.5 100.5 11.5 -- 72.5 -- -- -- 8.8 7.4 0.3 -- --
Sample 10305 10293 12 -67 10360 904 77 7442 560 3.79 556 1102 813 98 0.07 3.31N2 100 99.9 0.1 -0.6 100.5 8.8 -- 72.2 -- -- -- 10.7 7.9 1.0 -- --
Sample 12334 12141 193 -170 12310 1028 87 8501 718 3.99 569 1617 1006 159 0.11 3.38N3 100 98.4 1.6 -1.4 99.8 8.3 -- 68.9 -- -- -- 13.1 8.2 1.3 -- --
Sample 13215 12891 324 -191 13082 1071 89 9122 721 4.02 569 1900 989 0 0.04 3.36N4 100 97.5 2.5 -1.4 99.0 8.1 -- 69.0 -- -- -- 14.4 7.5 0.0 -- --
Sample 14773 14328 445 5 14323 1137 92 9649 764 4.32 565 2231 1305 0 0.03 3.46N5 100 97.0 3.0 0.0 97.0 7.7 -- 65.3 -- -- -- 15.1 8.8 0.0 -- --
}
Super ground PAC in combination with Ceramic Micro-filtration © TECHNEAU - 1 - December 22, 2008

Supe©
r ground PAC in combination with Ceramic Micro-filtration TECHNEAU - 2 - December 22, 2008
Project: 0 Partitioning of Organic Carbon (OC) Chromatographic Fractionation of Organic Carbon (CDOC) (UV@254 nm)sampl.date 19/6/2008 Approx. Molecular Weights in g/mol: >>20.000 ~1000 (see separate HS-Diagram) 300-500 <350 <350
TOC=DOC+POC DOC=CDOC+HOC
Note: POC, hence TOC may be too low Bio- Humic Building Neutrals Acids Inorg. SUVATOC DOC POC HOC CDOC Polymers DON Subst. DON Aromaticity Mol-Weight Blocks Colloid.
total OC dissolved particul. hydrophob. hydrophil. (Norg) (HS) (Norg) (SUVA-HS) (Mn) SAC (SAC/O
ppb-C ppb-C ppb-C ppb-C ppb-C ppb-C ppb-N ppb-C ppb-N L/(mg*m) g/mol ppb-C ppb-C ppb-C (m -1 ) L/(mg*
% TOC % TOC % TOC % TOC % TOC % TOC -- % TOC -- -- -- % TOC % TOC % TOC -- --
IHE Raw 15905 15716 189 284 15431 1299 103 10299 448 4.33 556 2195 1639 0 0.04 3.64 100 98.8 1.2 1.8 97.0 8.2 -- 64.8 -- -- -- 13.8 10.3 0.0 -- --
C)
m)
}}

Super ground PAC in combination with Ceramic Micro-filtration © TECHNEAU - 1 - December 22, 2008
0
10
20
30
40
50
60
0 20 40 60 80 1
rel.
Sig
nal
Res
pons
e (.5
x)
Retention Time in Minutes
Test Chromatograms
00
Biopolymers
Humics (HS)
Building Blocks
LMW Acidsand HS
Neutrals
Project : YumaSampling date :
N1
N2
-- OCD-- UVD-- OND
Nitrate
N3
N4
N5

Super ground PAC in combination with Ceramic Micro-filtration © TECHNEAU - 1 - December 22, 2008
0
10
20
30
40
50
60
0 20 40 60 80 1
rel.
Sig
nal
Res
pons
e (2
x)
Retention Time in Minutes
Test Chromatograms
00
Biopolymers
Humics (HS)
Building Blocks
LMW Acidsand HS
Neutrals
Project : Arpad 01Sampling date : April 2008
S1
S2
-- OCD-- UVD-- OND
Nitrate
S5
S4
S3

0
5
10
15
20
25
30
35
40
45
50
0 20 40 60 80 100
rel.
Sig
nal
Res
pons
e
Retention Time in Minutes
Test Chromatograms
Biopolymers
Humics (HS)
Building Blocks
LMW Acidsand HS
Neutrals
Project :Sampling date :
Raw
-- OCD-- UVD-- OND
Nitrate
Super ground PAC in combination with Ceramic Micro-filtration © TECHNEAU - 2 - December 22, 2008