super defocusing of light by optical sub-oscillationsalonb/journalpapers/eliezer-bahabad,...
TRANSCRIPT

Super defocusing of light by optical sub-oscillationsYANIV ELIEZER* AND ALON BAHABAD
Department of Physical Electronics, School of Electrical Engineering, Fleischman Faculty of Engineering, Tel-Aviv University, Tel-Aviv 69978, Israel*Corresponding author: [email protected]
Received 18 January 2017; revised 3 March 2017; accepted 6 March 2017 (Doc. ID 285158); published 13 April 2017
The mathematical phenomenon of superoscillation, in which a spectrally bound function oscillates locally at a ratefaster than its fastest Fourier component, has found use in both theoretical and applied areas of optical research.We show the existence of a complementary phenomenon we term sub-oscillation, in which a spectrally lower boundlimited function oscillates locally at an arbitrarily low frequency. The relevance of superoscillations to various fields,such as weak measurements, beam shaping, and super-resolution imaging, suggests that sub-oscillations could also findvarious uses. Here, we construct a spatially sub-oscillatory optical beam to experimentally demonstrate optical superdefocusing, i.e., a very fast, exceptional expansion of a partially blocked light beam. © 2017 Optical Society of America
OCIS codes: (020.1670) Coherent optical effects; (270.0270) Quantum optics; (120.7000) Transmission; (060.5625) Radio frequency
photonics; (170.0180) Microscopy.
https://doi.org/10.1364/OPTICA.4.000440
1. INTRODUCTION
The existence of band-limited signals that locally oscillate fasterthan their fastest Fourier components had been known since themid-20th century in antenna theory, when suggestions were madeto realize radiation patterns with very high directivity [1–4]. In1988, using similar mathematical concepts, Aharonov et al. [5]developed the formalism for quantum weak measurements.Today, such fast oscillations, exceeding the spectrum, are knownas superoscillations. Since the 1990s, superoscillatory functionshave been explored in many works [6–15]. The use of superoscil-lations in quantum weak measurements led to breakthrough ex-perimental works relating to the fundamentals of the quantummeasurement process [16–18]. In 2009, following a suggestionby Berry and Popescu made a few years earlier [7], a superoscil-latory phenomenon was first experimentally demonstrated in op-tics through the creation of a far-field pattern with sub-wavelength hot spots [19]. This work was followed by a seriesof works by several groups demonstrating the use of optical super-oscillations in realizing optical super-resolution microscopy[19–23]. Other successful uses of optical superoscillations werereported for the demonstration of non-diffracting, accelerating,and self-healing superoscillating optical beams [24–26] for real-izing super-narrow nonlinear frequency conversion [27] and forlight-focusing in the nano-scale regime [28]. Superoscillationswere also suggested as a means to overcome absorption indielectric media [29] and for achieving optical temporal super-resolution [30]. Outside of optics, superoscillatory functions wereused to realize sub-diffraction focusing of electron beams [31] andsub-wavelength focusing of radio waves [32,33].
Superoscillations can be viewed as a particular example of amore general phenomenon where a function locally oscillatesat a value outside its spectrum [34]. In the literature, apart from
superoscillations, the case of backflow [35–38] is also known.With backflow, a function having only positive-frequency spectralcomponents exhibits locally negative frequencies.
In this work, we first show theoretically that there exists acomplementary phenomenon to superoscillations: there existfunctions that are lower-bound limited yet can oscillate at an arbi-trarily low rate. We develop this concept of sub-oscillations forfunctions having either a continuous or a discrete spectrum.Then, we use such functions to realize experimentally superdefocusing of a light beam.
2. THEORY
A. Continuous Spectrum Sub-Oscillatory Functions
Berry, following Y. Aharonov’s argument, has shown [6] that it ispossible to take the following continuous Fourier composition:
f �x; δ; α� �Z
u2
u1A�u; δ; α� exp�ik�u�x�du; (1)
and make f �x; δ; α� oscillate locally faster than its highest Fouriercomponent (i.e., the highest value of k�u� ). This is done by usingthe following distribution function:
A�u; δ; α� � 1ffiffiffiffiffi2π
pδexp
�−�u − iα�22δ2
�; (2)
which, according to Aharonov’s reasoning, under the appropriatelimit of the δ parameter acts as a Dirac delta function that shiftsthe frequency distribution into k�iα� over the complex plane. AsBerry demonstrated, although k�u� is bound by some upper fre-quency limit, the complex shifted value k�iα� may exceed thislimit and effectively cause the function to superoscillate, i.e.,
2334-2536/17/040440-07 Journal © 2017 Optical Society of America
Research Article Vol. 4, No. 4 / April 2017 / Optica 440
to oscillate locally faster than the fastest frequency component ofthe band.
For example, if k�u� is selected to be k1�u� � cos�u� (the fre-quency distribution is bound by 1), and δ is sufficiently small, thecomplex Dirac delta distribution shifts the frequency distributioninto a hyperbolic cosine form,
limδ→0�
f �x; δ; α� ≅ exp�ik1�iα�x� � exp�i cosh�α�x�; (3)
where k1�iα� � cosh�α� with α > 0 obviously exceeds the fre-quency band limit of 1.
Using the same procedure, it is possible to take a lower-bound-limited frequency distribution signal and make it locally sub-oscillate slower than the slowest frequency of its spectrum(we define a lower-bound-limited signal as a signal whose spec-trum S�k� is zero for jkj < k0, where k0 is some positive real num-ber). This can be done, for example, by taking a signal with afrequency distribution corresponding to the hyperbolic cosineform k2�u� � cosh�u�, which has a lower frequency bound of1. In this case, the effective frequency distribution resultingdue to the shift over the complex plane is the complementarycosine form k2�iα� � cos�α�, which is bound from above by
1, which concludes that the signal adopts locally slow frequencies,and, thus, it sub-oscillates.
The integral expression in Eq. (1) fitted with the above frequencydistributions k1�u� or k2�u� can be evaluated numerically, while ananalytical evaluation is not available at the moment. Nevertheless,Berry’s analysis describes a case that can be calculated analyticallyand can also be approximated using the saddle point technique.By selecting k3�u� � 1 − u2
2 in the range of −2 < u < 2, thefunction’s spectrum is clearly band limited by �−1; 1�. Applyingthe complex plane shift operation results in k3�iα� � 1� α2
2 ,which turns the effective frequency distribution values to larger than1. The evaluation of Eq. (1) shows the function superoscillateslocally faster than 1 around x � 0 (see Fig. 1, left column).
We use the same methodology to show a sub-oscillatorybehavior for the following spectral distribution: k4�u� � 1� u2
2.
It is evident that in the same frequency range, −2 < u < 2, thespectrum’s shape is a bandpass spectrum exceeding the value of 1.Equipped with k4�u�, the resulting signal can now be expressed as
f �x;δ;α�� 1ffiffiffiffiffi2π
pδ
Z2
−2exp
�i�1�u2
2
�x�exp
�−�u− iα�22δ2
�du;
(4)
(a)
(b)
(c)
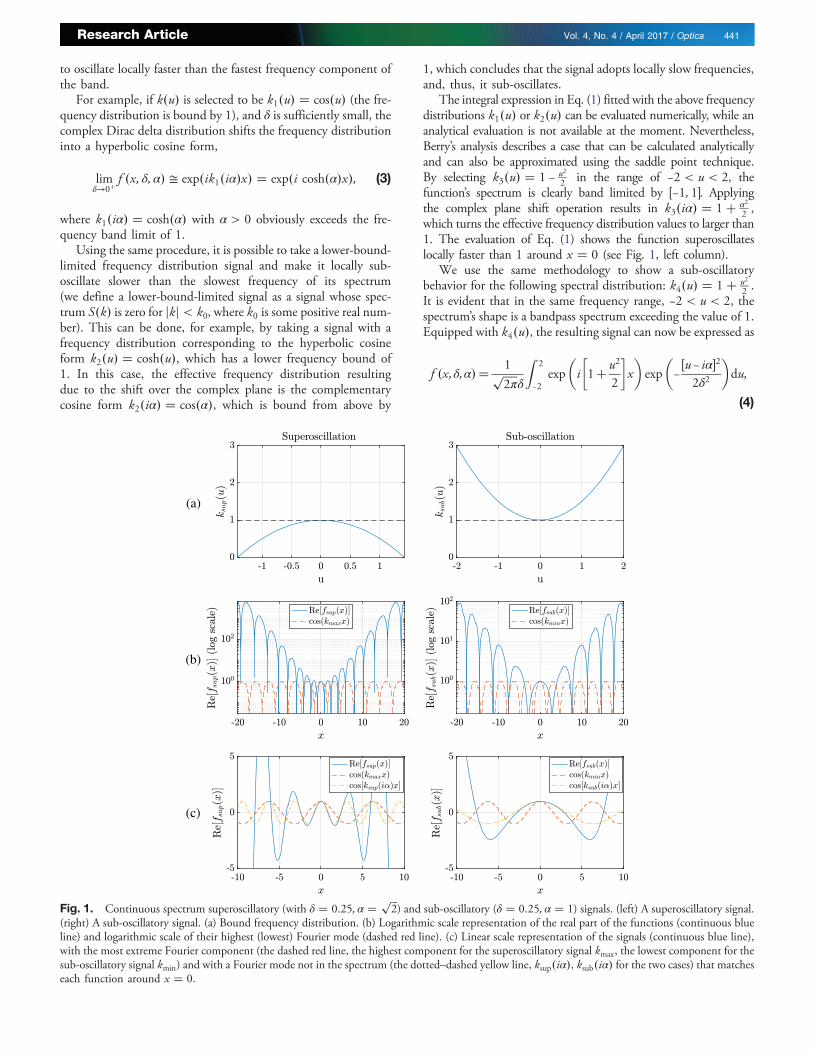
Fig. 1. Continuous spectrum superoscillatory (with δ � 0.25; α � ffiffiffi2
p) and sub-oscillatory (δ � 0.25; α � 1) signals. (left) A superoscillatory signal.
(right) A sub-oscillatory signal. (a) Bound frequency distribution. (b) Logarithmic scale representation of the real part of the functions (continuous blueline) and logarithmic scale of their highest (lowest) Fourier mode (dashed red line). (c) Linear scale representation of the signals (continuous blue line),with the most extreme Fourier component (the dashed red line, the highest component for the superoscillatory signal kmax, the lowest component for thesub-oscillatory signal kmin) and with a Fourier mode not in the spectrum (the dotted–dashed yellow line, ksup�iα�, ksub�iα� for the two cases) that matcheseach function around x � 0.
Research Article Vol. 4, No. 4 / April 2017 / Optica 441

which can be evaluated analytically using error functions:
f �x; δ; α� � i2
ffiffiffiffiffiffiffiffiffiffiffi1 − iξ
p exp
�ix�2 − α2 − 2iξ�
2�1 − iξ�
�
�erf
�2� iα − 2iξδ
ffiffiffiffiffiffiffiffiffiffiffiffiffi2 − 2iξ
p�� erf
�2 − iα − 2iξδ
ffiffiffiffiffiffiffiffiffiffiffiffiffi2 − 2iξ
p��
;
(5)
where ξ � xδ2. Using the saddle point approximation, it ispossible to approximate Eq. (4) with
f �x;δ;α�≅ 1ffiffiffiffiffiffiffiffiffiffiffiffi1� iξ
p exp
�ix�1−
α2
2�1� ξ2�
��exp
�α2ξx
2�1�ξ2�
�:
(6)
By differentiating the phase term in the above equation, thefollowing local wave number function is derived:
q�ξ� � 1 −α2�1 − ξ2�2�1� ξ2�2 : (7)
It is clear that for jαj < 2, the local frequency around x � 0 issmaller in its magnitude than 1. The signal becomes sub-oscillatory.
A numerical demonstration of these analytical superoscillatoryand sub-oscillatory functions [i.e., Eqs. (1) and (2) for the spectraldistribution given with k3 � ksup and k4 � ksub, respectively] isshown in Fig. 1. The logarithmic representation of the functions[Fig. 1(b)] clearly shows that the oscillations of the superoscilla-tory (sub-oscillatory) signal accelerate (decelerate) towards x � 0,while around x � 0 [Fig. 1(c)], the superoscillatory (sub-oscillatory) function exhibits an oscillation that is faster (slower)than the highest (slowest) Fourier component of the signal.
B. Discrete Spectrum Sub-Oscillatory Functions
Consider the following discrete spectrum superoscillatoryfunction [5,7]:
f �x� � �f 1�x��N � �cos�x� � ia sin�x��N ; (8)
where a ∈ fR > 1g and N ∈ N�. This function has the follow-ing polar form:
f �x� � �cos2�x� � a2 sin�x��N∕2 exp�iN arctan�a tan�x���;(9)
and it can also be expressed using the following band-limitedFourier expansion:
f �x� ��a� 1
2
�N XN
m�0
�−1�mN !
m!�N − m�!
�a − 1a� 1
�mei�N−2m�x ; (10)
which shows a clear frequency band �−N;N �.Approximating the function f �x� around x � 0 shows that it
locally superoscillates with the local frequency N · a. The calcu-lation of the local frequency function of the superoscillatoryfunction f �x� shows the same result:
kf �x� � Imddx
log�f �x�� � Nacos2 x � a2 sin2 x
: (11)
Furthermore, kf �x� also shows that the function’s slowest localfrequency is N
a for x � π2 � qπ (where q ∈ Z). As the signal’s
spectrum is within the band �−N;N �, a selection of an a param-eter in the range 0 < a < 1 would not result in a slower localoscillation out of the band. To achieve a sub-oscillation, a critical
condition is that the function’s spectrum should first have a lowerlimit. We now show that reciprocating the band-limited,superoscillating function of Eq. (9) results in a function thathas a lower-limited spectrum. Then, we show that this functionalso sub-oscillates. Reciprocating Eq. (9) results in
g�x� � �cos2�x� � a2 sin�x��−N∕2 exp�−iN arctan�a tan�x���:(12)
To assure the function in Eq. (12) has a lower-limited spectrum,we first reciprocate the base f 1�x� of f �x�:
g1�x� � f −11 �x� � 1
cos�x� � ia sin�x� : (13)
This function can be expressed as the following Fourier series:
g1�x� �Xm��∞
m�−∞G�1�
m exp�imx�; (14)
and its coefficients can be calculated by the complex integration
G�1�m � 1
2π
Zπ
−π
exp�−imx�dxcos�x� � ia sin�x�
��2
��a�1�12�m−1��a−1�12�m�1�
�; m ∈ O−
0 else
�; (15)
where O− stands for all odd numbers smaller than zero. The com-plete Fourier expansion of g�x� can be calculated from Eq. (15)using the following multinomial sum:
g�x�� �g1�x��N �X
Pki�N
N !
k1!k2!…km!
Yml�1
�G�1�l e−il x�kl ; (16)
where the sum is taken over all combinations of the non-negativeinteger indices k1…km such that
Pmi�1 ki � N .
Clearly, since the spectrum of g1�x� is one sided and the lowestnon-zero Fourier mode is m � 1, the N ’th power of this Fourierseries leads to an infinite number of Fourier modes, with thesmallest one having a frequency of N :
g�x� � �G�1�1 �N exp�−iN x� �…: (17)
Next, by using the local frequency operator on the reciprocal formg�x� [Eq. (12)], it is clear that its local frequency function issimply the negation of the local frequency function of thesuperoscillatory form f �x� [Eq. (9)],
kg�x� � Imddx
log�g�x�� � −Na
cos2 x � a2 sin2 x; (18)
where kg�x� shows the extrema of the local frequency of g�x� areidentical to the ones of the original superoscillatory function.They are N · a and N
a . However, considering the fact that thereciprocal function has a lower-limited spectrum and its slowestfrequency is N , then by assigning 0 < a < 1, the function wouldoscillate a times slower than the slowest frequency in the spectrumN . That is, the function would sub-oscillate at the rate of N · a.
It is also evident that with 0 < a < 1, the coefficients inEqs. (15) and (16) decay exponentially with m. This propertyis shared with the superoscillatory counterpart, where theFourier transform of the function needs to decrease at a sufficientrate, depending on the magnitude of the superoscillation[7,14,39]. This natural decay of the spectrum allows us toapproximate the sub-oscillatory function by omitting the tail
Research Article Vol. 4, No. 4 / April 2017 / Optica 442

of the Fourier coefficients (depending on the accuracy required).Put otherwise, the sub-oscillatory function can be approximatedas a lower-limited and band-limited function.
A numerical demonstration of the periodic sub-oscillatoryfunction discussed here compared to its reciprocal superoscillatoryfunction is shown in Fig. 2. Similarly to the continuous spectrumfunction discussed in the previous section, the acceleration(deceleration) of the superoscillatory (sub-oscillatory) function to-wards x � 0 is apparent, at which point the function superoscil-lates (sub-oscillates) at a rate faster (slower) then the fastest(slowest) component of the spectrum.
We would like to note that in addition to the example givenabove with Eq. (12) for a sub-oscillatory function, one can alsoeasily construct sub-oscillatory functions from backflow func-tions. Consider, for example, the form given by Berry [35]f BF�x���1−aexp�ikx��N with a ∈ f0 < R < 1g and N ∈ N�.This function has a single side band, with the lowest frequencybeing zero and the highest being N . Its local wave numberkBF�x� � Na�a − cos x�∕�1� a2 − 2a cos x� becomes negativeclose to x � 0 and has a minimal value of kBF�x � 0� �−Na∕�1 − a�. Now, with any k0 > 0, the new function f BF�x� ·
exp�ik0x� is lower-bound limited and its local wave number k0 �kBF�x� sub-oscillates for a < 2k0∕�N � 2k0�.
3. EXPERIMENT
As an application for sub-oscillatory signals, we demonstrate ex-perimentally the super defocusing of a light beam. We considerthe following problem: for the strongest defocusing of a lightbeam, we would first focus a given light beam as strongly as pos-sible (the theoretical limit being focusing to a point source), afterwhich the spread of the light beam would be maximal. Nowconsider the case in which we cannot focus the light beam tightlydue to an obstruction by an object in front of the beam, but westill desire to have strong defocusing after the object. Intuitively,we would bring most of the energy of the beam as close as possibleto the edges of the obstructing object, to facilitate in the far field abeam with as wide as possible a central lobe. Now, equipped withthe knowledge of sub-oscillatory functions, we can design thefield pattern in the plane of the obstructing object with modesextending transversely away from the object such that the centrallobe of the beam in the far field would expand arbitrarily fast by
(a)
(b)
(c)
(d)
Fig. 2. Discrete spectrum superoscillatory and sub-oscillatory signals. (left) Superoscillatory signal with the parameters of N � 10 and a � 2. (right)Sub-oscillatory signal with parameters of N � 10 and a � 1
2 . (a) Log-scale representations of the functions (continuous blue line) with the most extremeFourier component (dashed red line, fastest (slowest) for the superoscillatory (sub-oscillatory) signal). (b) Linear-scale representation of the function(continuous blue line) with the most extreme Fourier component (dashed red line, fastest (slowest) for the superoscillatory (sub-oscillatory) signal)and with a Fourier mode outside the spectrum (yellow line), which matches the superoscillation (sub-oscillation). (c) The spectrum in linear scale.The superoscillatory spectrum is in the range of �−N;N �, while the sub-oscillatory spectrum is in the range of �N ;∞�. (d) The spectrum in logarithmicscale.
Research Article Vol. 4, No. 4 / April 2017 / Optica 443

making the pattern in the plane of the object in the form of thespectrum of an arbitrarily slow sub-oscillating field.
Our experimental setup (Fig. 3) consists of a 532 nm CW laser(Quantum Ventus 532 Solo Laser) and a reflective phase-onlyspatial light modulator (Holoeye Pluto SLM). The laser lightis expanded and collimated before the SLM, reflected off it,and Fourier transformed using a 50 cm focal lens. The generatedfirst diffraction order beam is imaged after the Fourier plane of thelens by a CMOS camera (Ophir Spiricon SP620U Beam ProfilingCamera). The role of a virtual obstructing object is played by vir-tue of keeping a blank constant area in the middle of the patternsprojected on the SLM.
To demonstrate super defocusing in the experiment, we cal-culated the Fourier transform of the real part of the sub-oscillatory
periodic signal in Eq. (12) for various values of the parameter a(a � 1; 0.9; 0.8; 0.7) with N � 4. Then, we filtered all coeffi-cients having a magnitude that is less than 10−14 [this correspondsto M � N � 6 in Eq. (19) below] to establish a lower-bound-limited and band-limited spectrum. The resulting periodic signalspectra were convoluted with a Gaussian function to create a cor-responding finite Gaussian envelope in the spatial domain. Thefinal shape of the spectrum can be described by the followingexpressions:
g�k� �XMm�−M
G�N �m �a� exp
�−�k − mΔ�2
2σ20
�; (19)
G�N �m �a� � 1
π
Zπ
−π
cos�mx�dx�cos�x� � ia sin�x��N ; (20)
where G�N �m ≡ 0 for jmj < N , Δ � 0.25 mm, and
σ0 � 7.354 × 10⁻⁵, corresponding to a full width at half-maxi-mum of FWHM � 0.173 mm. Next we used a first diffractionorder phase-only encoding scheme [40] on each of the resultingspectra (that is, for each value of a ) and projected the phase profileon the SLM. Finally, the first diffraction order field intensity atthe back focal Fourier plane (consisting of the far-field pattern)was measured using the camera.
We would like to note that due to the convolution made withthe Gaussian envelope in Eq. (19), the tail of the envelope on thelowest mode penetrates into the low-frequency region of the spec-trum. As the sub-oscillations are the result of the interference ofthe modes, they would only be weakly influenced by the presence
Fig. 3. Experimental setup. BE, beam expander; SLM, spatial lightmodulator; CAM, CMOS camera; M, mirror; L1; L2; L3 are lenses. Thesum of the distances d 1; d 2 equals lens L3 focal length. Z 0 marks thelocation of the Fourier plane for an object in the SLM plane.
(a)
(b)
(c)
(d)
Fig. 4. Experimental demonstration of super defocusing of a light beam. (left) Phase masks applied to the SLM, serving as the spectral distribution forsub-oscillatory signals. The dotted white line marks the signal’s spectral boundaries. (middle) Measured intensity pattern at the plane corresponding to theFourier plane of the SLM (serving as the far-field pattern). (right) Horizontal line through the center of the measured intensity patterns (continuous bluelines), theoretically calculated waveforms (dotted black lines) overlaid with the measurement for the regular, non-sub-oscillatory case (corresponding toa � 1, dashed red line). The different patterns differ by the control parameter a. As a gets smaller, the pattern sub-oscillates slower, and the beamdefocuses stronger. (a) a � 1, (b) a � 0.9, (c) a � 0.8, and (d) a � 0.7. Dotted–dashed black lines mark the location of zeros around the sub-oscillation.Dotted–dashed black lines mark the sub-oscillation’s period.
Research Article Vol. 4, No. 4 / April 2017 / Optica 444

of the envelope (the convolution with the envelope in Fourierspace translates to an overall envelope over the whole signal indirect space). In strict mathematical terms, as there is still (evennegligible) spectral energy at the location of the sub-oscillation,we can only treat the features as essentially sub-oscillatory andnot as sub-oscillatory per se. Physically, in the experiment we haveconducted, the applied function on the SLM is still strictly lower-bound limited due to the discrete nature of the pattern projectedon the SLM. The local frequency of the slowest sub-oscillatoryfeature that we generate (for a � 0.7) resides below the lowerlimit of the spectrum we apply, and so it is sub-oscillatory inthe strict sense. The two other cases (a � 0.8; 0.9) are withinthe tail of the envelope of the slowest mode, and so they are onlyessentially sub-oscillating.
The phase masks that were used on the SLM are shown on theleft column of Fig. 4. The masks’ spatial signature is identical tothe spectrum of the sub-oscillatory signals captured on the cameraand depicted in the middle column of Fig. 4 (continuous lines).The right column shows a horizontal line through the middle ofthe captured images. The different rows of this figure correspond,from top to bottom, to beams that are getting more and moredefocused; that is, they correspond to beams which sub-oscillateslower. The top row corresponds to a beam that is not sub-oscillatory at all (a � 1). In this case, the corresponding phasemask is composed of a single mode projected into the firstdiffraction order. The result in the focal (Fourier) plane is adouble-slit diffraction pattern bound by a Gaussian envelope.The length of each fringe in this case was measured to be0.1437 mm. For the other rows, as a changes between the valuesof 0.9 to 0.8 to 0.7 (while N � 4 and the number of Fouriermodes is no more than M � 7), the central lobe of the beamexpands correspondingly to 0.1496 mm to 0.1584 mm to0.1672 mm. These three values represent local frequencies thatare below the lowest mode of the spectrum, which by itself cor-responds to the periodicity in the case of a � 1 (top row of thefigure, while the corresponding waveform is overlaid for all casesof different values of a with a dashed line).
Our results agree reasonably well with the calculated theoreti-cal waveforms (dotted lines in Fig. 4, right column). It is clearlyevident that the central sub-oscillation defocuses as the a param-eter decreases at a linear rate (N · a). It is also apparent that sim-ilarly to superoscillating signals, the amplitude at the sub-oscillation drops exponentially with respect to its adjacent lobesas the local frequency drops further away from the lower limit ofthe band.
4. CONCLUSION
We theoretically and experimentally demonstrated the concept ofsub-oscillations, where a spectrally lower-bound-limited functionoscillates slower than its slowest Fourier component. We havedemonstrated theoretically the existence of such functions havingeither a continuous or a discrete spectrum. Experimentally, weused the concept of sub-oscillations to facilitate super defocusingof a light beam, creating a beam that is initially obstructed in itsmiddle, yet in the far field has a central lobe that can be arbitrarilywide (albeit at the expense of its amplitude being smaller relativeto the side lobes).
Sub-oscillations can be regarded as a complementary phe-nomenon to superoscillations where a band-limited signal canlocally oscillate at an arbitrarily fast rate. The relevance of
superoscillations to varied fields, such as quantum measurement[16–18], optical beam shaping and super-resolution [19–26], par-ticle manipulation [41], electron beam shaping [31], and radiofrequency antenna design [32,33], suggests that sub-oscillationscould find interesting uses in varied fields as well. Our demon-stration of super defocusing by itself might be relevant for opticaldark-field microscopy.
REFERENCES
1. G. T. Di Francia, “Super-gain antennas and optical resolving power,”Nuovo Cimento 9, 426–438 (1952).
2. S. A. Schelkunoff, “A mathematical theory of linear arrays,” Bell Syst.Tech. J. 22, 80–107 (1943).
3. D. Slepian and H. O. Pollak, “Prolate spheroidal wave functions, Fourieranalysis and uncertainty,” Bell Syst. Tech. J. 40, 43–63 (1961).
4. M. Berry, “Superoscillations, endfire and supergain in quantum theory,”in Quantum Theory: A Two-Time Success Story: Yakir AharonovFestschrift, D. C. Struppa and J. M. Tollaksen, eds. (Springer, 2013),pp. 327–336.
5. Y. Aharonov, D. Z. Albert, and L. Vaidman, “How the result of a measure-ment of a component of the spin of a spin-1/2 particle can turn out to be100,” Phys. Rev. Lett. 60, 1351–1354 (1988).
6. M. Berry, “‘Faster than Fourier,’ quantum coherence and reality: in cel-ebration of the 60th birthday of Yakir Aharonov,” in Proceedings of theInternational Conference on Fundamental Aspects of Quantum Theory(World Scientific, 1994), p. 55.
7. M. Berry and S. Popescu, “Evolution of quantum superoscillations andoptical superresolution without evanescent waves,” J. Phys. A 39, 6965–6977 (2006).
8. M. Berry and M. Dennis, “Natural superoscillations in monochromaticwaves in d dimensions,” J. Phys. A 42, 022003 (2009).
9. M. Berry and P. Shukla, “Pointer supershifts and superoscillations inweak measurements,” J. Phys. A 45, 015301 (2012).
10. M. Berry, “Exact nonparaxial transmission of subwavelength detail usingsuperoscillations,” J. Phys. A 46, 205203 (2013).
11. A. Kempf, “Black holes, bandwidths and Beethoven,” J. Math. Phys. 41,2360–2374 (2000).
12. P. J. Ferreira and A. Kempf, “Superoscillations: faster than the Nyquistrate,” IEEE Trans. Signal Process. 54, 3732–3740 (2006).
13. M. R. Dennis, A. C. Hamilton, and J. Courtial, “Superoscillation in specklepatterns,” Opt. Lett. 33, 2976–2978 (2008).
14. Y. Aharonov, F. Colombo, I. Sabadini, D. Struppa, and J. Tollaksen,“Some mathematical properties of superoscillations,” J. Phys. A 44,365304 (2011).
15. E. Katzav and M. Schwartz, “Yield-optimized superoscillations,” IEEETrans. Signal Process. 61, 3113–3118 (2013).
16. O. Hosten and P. Kwiat, “Observation of the spin hall effect of light viaweak measurements,” Science 319, 787–790 (2008).
17. S. Kocsis, B. Braverman, S. Ravets, M. J. Stevens, R. P. Mirin, L. K.Shalm, and A. M. Steinberg, “Observing the average trajectories of sin-gle photons in a two-slit interferometer,” Science 332, 1170–1173 (2011).
18. Y. Gorodetski, K. Bliokh, B. Stein, C. Genet, N. Shitrit, V. Kleiner, E.Hasman, and T. Ebbesen, “Weak measurements of light chirality witha plasmonic slit,” Phys. Rev. Lett. 109, 013901 (2012).
19. F. M. Huang and N. I. Zheludev, “Super-resolution without evanescentwaves,” Nano Lett. 9, 1249–1254 (2009).
20. E. T. Rogers, J. Lindberg, T. Roy, S. Savo, J. E. Chad, M. R. Dennis, andN. I. Zheludev, “A super-oscillatory lens optical microscope for subwave-length imaging,” Nat. Mater. 11, 432–435 (2012).
21. A. M. Wong and G. V. Eleftheriades, “An optical super-microscope forfar-field, real-time imaging beyond the diffraction limit,” Sci. Rep. 3,1715 (2013).
22. N. I. Zheludev, “What diffraction limit?” Nat. Mater. 7, 420–422 (2008).23. C. Wang, D. Tang, Y. Wang, Z. Zhao, J. Wang, M. Pu, Y. Zhang, W. Yan,
P. Gao, and X. Luo, “Super-resolution optical telescopes with local lightdiffraction shrinkage,” Sci. Rep. 5, 18485 (2016).
24. E. Greenfield, R. Schley, I. Hurwitz, J. Nemirovsky, K. G. Makris, and M.Segev, “Experimental generation of arbitrarily shaped diffractionlesssuperoscillatory optical beams,” Opt. Express 21, 13425–13435 (2013).
Research Article Vol. 4, No. 4 / April 2017 / Optica 445
25. B. K. Singh, R. Remez, Y. Tsur, and A. Arie, “Super-airy beam: self-accelerating beam with intensified main lobe,” Opt. Lett. 40,4703–4706 (2015).
26. Y. Eliezer and A. Bahabad, “Super-oscillating airy pattern,” ACS Photon.3, 1053–1059 (2016).
27. R. Remez and A. Arie, “Super-narrow frequency conversion,” Optica 2,472–475 (2015).
28. A. David, B. Gjonaj, Y. Blau, S. Dolev, and G. Bartal, “Nanoscale shapingand focusing of visible light in planar metal-oxide–silicon waveguides,”Optica 2, 1045–1048 (2015).
29. Y. Eliezer and A. Bahabad, “Super-transmission: the delivery of super-oscillations through the absorbing resonance of a dielectric medium,”Opt. Express 22, 31212–31226 (2014).
30. Y. Eliezer, L. Hareli, L. Lobachinsky, S. Froim, and A. Bahabad,“Breaking the temporal resolution limit by superoscillating optical beats,”arXiv preprint arXiv:1607.02352 (2016).
31. R. Remez, Y. Tsur, P.-H. Lu, A. H. Tavabi, R. E. Dunin-Borkowski, andA. Arie, “Super-oscillating electron wave functions with sub-diffractionspots,” arXiv preprint arXiv:1604.05929 (2016).
32. A. M. Wong and G. V. Eleftheriades, “Superoscillatory antenna arrays forsub-diffraction focusing at the multi-wavelength range in a waveguideenvironment,” in IEEE Antennas and Propagation Society InternationalSymposium (IEEE, 2010), pp. 1–4.
33. A. M. Wong and G. V. Eleftheriades, “Sub-wavelength focusing at themulti-wavelength range using superoscillations: an experimental demon-stration,” IEEE Trans. Antennas Propag. 59(12), 4766–4776 (2011).
34. M. Berry and P. Shukla, “Typical weak and superweak values,” J. Phys.A 43, 354024 (2010).
35. M. Berry, “Quantum backflow, negative kinetic energy, and optical retro-propagation,” J. Phys. A 43, 415302 (2010).
36. M. Berry, “Superluminal speeds for relativistic random waves,” J. Phys. A45, 185308 (2012).
37. A. Bracken and G. Melloy, “Probability backflow and a new dimension-less quantum number,” J. Phys. A 27, 2197–2211 (1994).
38. K. Y. Bliokh, A. Y. Bekshaev, A. G. Kofman, and F. Nori, “Photon trajec-tories, anomalous velocities and weak measurements: a classical inter-pretation,” New J. Phys. 15, 073022 (2013).
39. Y. Aharonov, F. Colombo, I. Sabadini, D. Struppa, and J. Tollaksen,“The mathematics of superoscillations,” Mem. Am. Math. Soc. 247, 5–23 (2017).
40. E. Bolduc, N. Bent, E. Santamato, E. Karimi, and R. W. Boyd, “Exactsolution to simultaneous intensity and phase encryption with a singlephase-only hologram,” Opt. Lett. 38, 3546–3549 (2013).
41. B. S. Kumar, H. Nagar, Y. Roichman, and A. Arie, “Particle manipulationbeyond the diffraction limit using structured super-oscillating lightbeams,” arXiv preprint arXiv:1609.08858 (2016).
Research Article Vol. 4, No. 4 / April 2017 / Optica 446