supelco - sigma-aldrich · ©1999 sigma-aldrich co. supelco bare fused silica adsorbent unknown...
TRANSCRIPT

©1999 Sigma-Aldrich Co.
SUPELCOSPME-Adsorption versus
Absorption: Which Fiber is Bestfor Your Application?
Robert E. Shirey and Raymond F. Mindrup
00-0001 T400011
The continuing development of SPME fiber coatings has presented somedifficulties for analyst to select the appropriate fiber for their application.The goal of this presentation is to provide you with a guideline on how toselect the appropriate SPME fiber. A critical part of the selection processis determining whether to use an adsorbent type fiber or an absorbent typefiber. This presentation will attempt to provide you the informationneeded to determine when each type is appropriate.
1
©1999 Sigma-Aldrich Co. SUPELCO
Overview of Presentation
• Difference between an Adsorbent and Absorbent
• Extraction of low-molecular-weight analytes byvarious SPME fibers
• Extraction of semi-volatile analytes by variousSPME fibers
• The effects of analyte size on SPME fibers
• Capacity of SPME fibers
00-0002
To help you select the appropriate fiber, this presentation will first brieflydescribe the difference between an adsorbent and absorbent type fiber andthe various types of SPME fibers. The differences in the fibers will beshown in a study involving low-molecular-weight analytes and a studycomparing the efficiency of the fibers on the extraction of semi-volatileanalytes. The effects of the size of analytes on the extraction efficiency ofthe fibers will be discussed. And lastly a discussion on fiber capacity anddetection limits between adsorbent and adsorbent fibers will be given.
2
©1999 Sigma-Aldrich Co. SUPELCO
Adsorbent vs. Absorbent Fibers
Adsorbent type fibers• Physically traps or chemically
reacts bonds with analytes–porous material
–high surface area
–chemical derivatizing agent
• Analytes may compete for sites
• Fibers have limited capacity
Absorbent type fibers• Analytes are extracted by
partitioning–liquid phase
–retains by thickness of coating
• Analytes do not compete forsites
• Fibers can have high capacity
00-0003
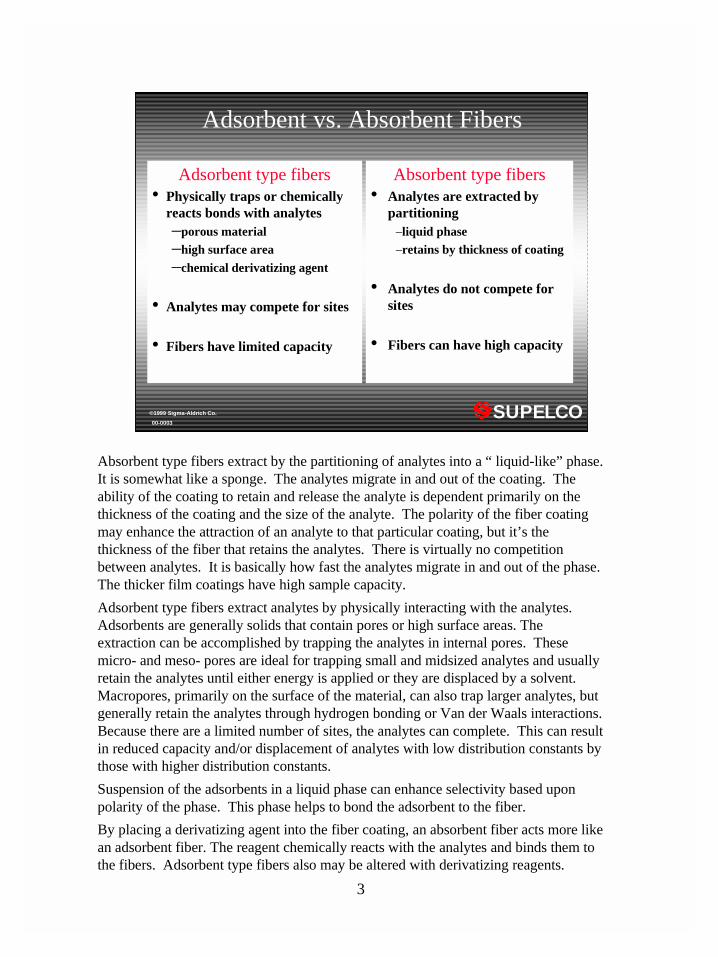
Absorbent type fibers extract by the partitioning of analytes into a “ liquid-like” phase.It is somewhat like a sponge. The analytes migrate in and out of the coating. Theability of the coating to retain and release the analyte is dependent primarily on thethickness of the coating and the size of the analyte. The polarity of the fiber coatingmay enhance the attraction of an analyte to that particular coating, but it’s thethickness of the fiber that retains the analytes. There is virtually no competitionbetween analytes. It is basically how fast the analytes migrate in and out of the phase.The thicker film coatings have high sample capacity.
Adsorbent type fibers extract analytes by physically interacting with the analytes.Adsorbents are generally solids that contain pores or high surface areas. Theextraction can be accomplished by trapping the analytes in internal pores. Thesemicro- and meso- pores are ideal for trapping small and midsized analytes and usuallyretain the analytes until either energy is applied or they are displaced by a solvent.Macropores, primarily on the surface of the material, can also trap larger analytes, butgenerally retain the analytes through hydrogen bonding or Van der Waals interactions.Because there are a limited number of sites, the analytes can complete. This can resultin reduced capacity and/or displacement of analytes with low distribution constants bythose with higher distribution constants.
Suspension of the adsorbents in a liquid phase can enhance selectivity based uponpolarity of the phase. This phase helps to bond the adsorbent to the fiber.
By placing a derivatizing agent into the fiber coating, an absorbent fiber acts more likean adsorbent fiber. The reagent chemically reacts with the analytes and binds them tothe fibers. Adsorbent type fibers also may be altered with derivatizing reagents.
3

©1999 Sigma-Aldrich Co. SUPELCO
Bare fused silica Adsorbent Unknown
7µm Polydimethylsiloxane (PDMS) Absorbent Nonpolar
30µm PDMS Absorbent Nonpolar
100µm PDMS Absorbent Nonpolar
85µm Polyacrylate (PA) Absorbent Polar
65µm PDMS-DVB, StableFlex™ Adsorbent Bipolar
65µm CW-DVB, StableFlex Adsorbent Polar
85µm Carboxen-PDMS, StableFlex Adsorbent Bipolar
55µm/30µm DVB/Carboxen™-PDMS, StableFlex Adsorbent Bipolar
Types of SPME Fibers
00-0004
There are four absorbent type fibers. These are the polydimethylsiloxane(PDMS) and the polyacrylate (PA). The nonpolar PDMS come in 3different coating thicknesses and the PA, a polar fiber, comes in only onethickness.
The adsorbent type fibers contain either divinylbenzene (DVB) and/orCarboxen™ 1006. Depending upon the desired polarity, the DVB fibersare available suspended either PDMS or Carbowax® (CW), a moderatelypolar phase. Carboxen is only available suspended in PDMS. Attempts tosuspend it in CW resulted in poor analyte recovery. There is one fiberavailable that contains a combination of DVB-PDMS layered overCarboxen PDMS. This fiber will be discussed in later detail in thepresentation.
Bare fused silica is listed as an adsorbent type fiber because the surface ofthe fused silica interacts with the analytes. This fiber is only available asa custom due to the fragility of bare fused silica.
All of the adsorbent fibers are available on a StableFlex™ core in additionto the standard fused silica. The thin coating of plastic on the fused silicamakes the StableFlex fiber more flexible. The phase coating also bonds tothe plastic better than fused silica. This results in a less breakable morestable fiber. We highly recommend the StableFlex version whendeveloping applications.
4

©1999 Sigma-Aldrich Co. SUPELCO
Physical Properties of Divinylbenzeneand Carboxen-1006
Surface Area Porosity (mL/g)*Material (m2/g) macro meso micro total
Divinylbenzene 750 0.58 0.85 0.11 1.54Carboxen™ 1006 720 0.23 0.26 0.29 0.78
*Macropore = >500Å, Mesopore = 20-500Å, Micropore = 2-20Å
00-0005
The surface area of DVB is fairly high at 750m2/g. The material isprimarily mesoporous with a moderate amount of macropores. There arevery little micropores present in this DVB material.
Carboxen-PDMS has a similar surface area as DVB. The majordifference is the much higher percentage of micropores. This material hasa fairly even distribution of macro, meso and micro pores.It is also a morerigid carbon based material. Carboxens differ from other porous carbonsbecause the pores are not sealed but pass entirely through the particle.The pores taper as they approach the center of the particle than expand asthey approach the perimeter. This pore structure allows analytes to desorbmore efficiently than with sealed pores common with charcoals and manycarbon molecular sieves.
To take advantage of both adsorbents, a fiber was developed that layersDVB suspended in PDMS over a layer of Carboxen suspended in PDMS.Because the coatings are layered, the larger analytes will be retained inthe meso and marco pores of the outer DVB layer, while the smalleranalytes migrate through this layer and are retained by the micropores inthe inner layer of Carboxen. This fiber expands the analyte molecularweight range and still enable extraction of analytes at trace levels. Thereis a reduction in the amount of analyte retained compared to the thickersingle adsorbent, but it is suitable for many analyses.
5

©1999 Sigma-Aldrich Co. SUPELCO
Analytes in Volatile Study
Isopropanol
OH
Acetone
O
Methylacetate
Propanal
O
Dichloromethane
Cl
Cl
Acetic acid
O
OH
1,4-Dioxane
O
O
Isopropylamine
Propionitrile
Nitropropane
NO
O
58 60
74
58
NH2
59
84 5560
89
88N
Pentane
72O
O
00-0006
In the first study,the goal was to evaluate the various types of fibers forthe extraction of low-molecular weight analytes. All of the above analytesare similar in size and vary only by functionality. The basis for selectingthese analytes was to keep the size similar so to determine the effect offunctionality on the extraction efficiency of the fibers. These are thesmallest, stable, nongaseous analytes at ambient temperature for each ofthese groups. Only 1,4-dioxane had a structure that was not similar to theothers, but diethylether, the first choice for an ether, co-eluted withpentane which was used as an internal standard.
The fibers selected to extract these analytes were those designed to retainvolatile analytes. There were two absorbent type fiber 100µm PDMS andthe 85µm PA fiber. The remaining fibers used in the study wereadsorbent style fibers on a StableFlex core. These fibers were the CW-DVB and PDMS-DVB fibers along with the Carboxen-PDMS and DVB-Carboxen-PDMS fibers.
6

©1999 Sigma-Aldrich Co. SUPELCO
Analyte Response Factor
Acetone 1.78Isopropanol 1.79Methylacetate 3.11Propanal 2.11Methylene chloride 7.13Acetic acid 6.411,4-Dioxane 2.60Isopropylamine 1.93Propionitrile 1.73Nitropropane 2.15
FID Response Factors for Analytes
00-0007
Response factors were calculated with respect to pentane using directinjections of the mixtures. If you multiple the area counts of each of theabove analytes by the response factors, the area response would be similarto the pentane response. This eliminates FID discrimination and gives abetter representation of the amount of each analyte extracted by the fibers.
7

©1999 Sigma-Aldrich Co. SUPELCO
Analytical Conditions for Evaluation ofFibers with Volatile Analytes
Sample: Water containing 25% NaCl and appropriate 0.05Mphosphate buffer, spiked with analytes to a final concentration of 2 ppm
Extraction: 15 min with agitation, using Varian 8200autosampler,
Desorption: 2 min, temperature varies, depending on fiber
Column: 30m x 0.32mm x 4.0µm SPB™-1 SULFUR
Oven: 40°C (2 min) to 140°C at 8°C/min (1 min)
Inlet: Split/splitless, closed 0.5min, 0.75mm ID liner
Detector: FID
00-0008
The analytes,contained in methanol at 2mg/ml, were spiked into the watersolutions containing 25% NaCl and the appropriate 0.05M phosphatebuffer that was either at a pH of 2,7 or 11. The final concentration of eachanalyte was 2ppm in water. The analytes were divided into 3 mixes toprevent co-elutions, and interactions. All of the solutions were extractedfor 15 min by immersing the fiber into the water. The fiber was agitatedto enhance recovery using the Varian 8200 Autosampler adjusted forSPME use. Each of the fibers used in this evaluation, extracted each mixat each pH level in triplicate.
The fibers were desorbed at 260°C except for the Carboxen-PDMS whichwas at 310°C and the PA fiber at 280°C. The fiber was kept in theinjection port for 2 min, but the splitter was opened after 0.5 min. Theanalytes were desorbed onto a SPB™-1 Sulfur 30m x 0.32mmID x 4µmcolumn. The analytes were eluted by programming the column from40°C (2min) to 150°C at 8°C/min under a flow rate of 35cm/sec at 40°C.The analytes were detected with an FID.
8

©1999 Sigma-Aldrich Co. SUPELCO
Comparison of Area Responses by Fiber Type
316
857
208
311
192
1062
121
528
1306
7229
758
2119
837 32
09
499
1671
7829
1442
0
5930
1572
0
5956
3
5587
0
6932
9
1087
35
Propanal Nitropropane Acetone Propionitrile
PDMSPAcrylatePDMS-DVBCW-DVBDVB-CARCarboxen
00-0009
This slide shows a comparison of the adjusted responses for the variousfibers for four of the relatively polar analytes. The area responses wereobtained from the average of three extractions at the optimum pH level foreach analyte.
The adjusted area responses show that the Carboxen-PDMS fiber was thebest choice for extracting these analytes. The Carboxen coated fiberextracted up to 300 times as much analyte compared to the absorbent typefibers. The dual coated fiber with DVB layered over Carboxen was thesecond best fiber and the DVB containing fibers extracted more of each ofthe analytes than the absorbent type fibers. The micropores of theCarboxen-PDMS coated fiber retain these smaller analytes better than theother fibers.
9

©1999 Sigma-Aldrich Co. SUPELCO
Comparison of Area Responses by Fiber Type
95
6
54
45
91
24
75
6 10
60
1
26
51
30
41 2
76
47
13
83 18
31
5
12
85
2
28
83
8
10
51
04
42
31
4
21
47
84
20
84
6
32
76
47
25
56
00
Methylacetate Methylene Chloride Pentane
PDMS
PAcrylate
PDMS-DVB
CW-DVB
DVB-CAR
Carboxen
00-0010
The same pattern is shown for the less polar analytes contained in thisslide with the Carboxen-PDMS fiber extracting significantly more of theanalytes than the other fibers. Again as with the previous slide, the dualcoated fiber was the second best choice if optimum extraction efficiencyis the desired goal. It was followed by the DVB containing fibers andthen the absorbent type fibers. The differences between fibers is not asdramatic with nonpolar analytes, such as pentane, compared to thedifferences in response between fibers when extracting the more polaranalytes.
10

©1999 Sigma-Aldrich Co. SUPELCO
Comparison of Area Responses by Fiber Type
144 14
45
349
155
981
101
554
1105
565
50 821
1078
1317
1954
8
1017
2
3519
6
2636
5
2927
6
Isopropanol Isopropylamine 1,4 Dioxane
PDMSPAcrylatePDMS-DVBCW-DVBDVB-CARCarboxen
00-0011
For the most polar analytes shown in this slide, the area responses aregreatly reduced for all of the fibers compared to the area responsesobtained with the less polar analytes. However, the Carboxen-PDMScoated fiber is still the best choice for extracting these small analytesexcept for isopropylamine. Previous studies have indicated that thePDMS-DVB coating has a high affinity for small aliphatic amines. Thisis apparent by the high area counts for isopropylamine with this fibercompared to the other small analytes extracted with this fiber. When youcombine the affinity of the PDMS-DVB coating for small amines coupledwith the ability of Carboxen to retain small analytes, the dual layeredPDMS-DVB over Carboxen-PDMS makes this fiber the best choice forsmall amines.
In summarizing these three slides, the micropores of the Carboxen-PDMSfiber make it an overwhelming choice for the extraction of small analytesat trace levels. Carboxen containing fiber coatings retain more smallanalytes better than the DVB containing coatings which retain more thanthe liquid absorbent fiber coatings .
11

©1999 Sigma-Aldrich Co. SUPELCO
Analyte Polarity vs. Area Response
Acetic
aci
d
Isopro
panol
Isopro
pylam
ine
Aceto
ne
Propan
al
1,4
Dioxa
ne
Propio
nitrile
Nitropro
pane
Met
hylace
tate
Met
hylen
e Chlo
ride
Penta
ne
100µm PDMS
Polyacrylate
00-0012
The effect of fiber polarity is shown in the next two slides. The analytesare arranged by decreasing polarity from left to right. In this slide, thetwo absorbent type fibers used for the extraction of volatile analytes arecompared. There appears to be no advantage for using the more polar PAfiber for the extraction of the polar analytes over the nonpolar 100µmPDMS fiber.
Some selectivity is observed by the fact that the polar fiber extracts muchless of the least polar analyte, pentane. This could be advantageous if onewanted to extract polar analytes in a mixture containing a equal or largerconcentration of a nonpolar analyte. By extracting less of the nonpolaranalyte, the polar analytes would be more easily detected and extracted.
12

©1999 Sigma-Aldrich Co. SUPELCO
Fiber Polarity vs. Area Response
Acetic
aci
dIso
propan
ol
Isopro
pylam
ine
Aceto
nePro
panal
1,4
Dioxa
nePro
pionitr
ileNitr
opropan
eM
ethy
lace
tate
Met
hyle
ne C
hlorid
ePen
tane
PDMS-DVB
Carbowax-DVB
00-0013
The same pattern was observed in this slide when comparing the polar andrelatively nonpolar adsorbent style fibers. Again the more polarCarbowax-DVB fiber does not show any advantage for the extraction ofthese polar analytes over the less polar PDMS-DVB. But like thepolyacrylate coated fiber, the Carbowax-DVB fiber extracts less of thenonpolar analytes relative to the PDMS-DVB fiber. This could be morecritical for adsorbent fibers because of the limited capacity of the fibers.The reduction in the extraction of the nonpolar analytes is important whenanalytes are competing for sites on the fiber.
The affinity that the PDMS-DVB fiber for amines was demonstratedpreviously in the chart showing the extraction of isopropylamine. Thisgraph shows that this same fiber also has an affinity for nitro groups asdemonstrated by the increased response for nitropropane compared to theCW-DVB fiber. This fiber is suitable for extracting many nitrogencontaining analytes.
13

©1999 Sigma-Aldrich Co. SUPELCO
Toluene 92
o-Xylene 106
Anisole
O
108Benzaldehyde
O
106 Phenol
OH
94Aniline
NH2
93
Benzoic acid
OHO
p-Nitrophenol
OH
NO O
139p-Nitroaniline
NH2
NO O
1,3,5-Trinitrobenzene
NOO
N
O
ON
O
O
138 122 213
Semi-volatile Analytes Used in Study
G001298
00-0014
In the second study 15 different analytes (shown in this slide and the nextslide) ranging in molecular weights from 92-500, representing a varietyof organic classes were extracted with 9 different types of SPME fibers .The analytes in this slide are aromatic ring compounds with mono-, di-and tri- functional groups. The analytes range in polarity from nonpolarto highly polar.
There were two purposes of this study. One purpose was to demonstratethe effects of analyte polarity on the extraction efficiency of allcommercially available SPME fiber coatings. The other purpose was todetermine the effects of fiber coating thickness relative the size of theanalyte.
14

©1999 Sigma-Aldrich Co. SUPELCO
Acenaphthene
N,N-Nitrosodibutylamine
N
N
O
Dimethylphthalate
OHO
O
OH
158 194
ChryseneCl
Cl
Cl
Cl
Cl Cl
Cl
Cl
Cl
Cl
154 228Decachlorobiphenyl
499
Semi-volatile Analytes Used in Study (cont..)
G001299
00-0015
In this slide the larger analytes are shown. Most of these analytes arenonpolar with the exception of the moderately polar N,N-nitrosodibutylamine. These analytes were selected primarily to show theeffects of fiber coating thickness on their extraction efficiency.
The analytes in this and the previous slide were made into one mix at afinal concentration of 100ng/µl in methylene chloride. This mixture wasspiked into the appropriate solution to obtain a final concentration 75 ppbfor each analyte.
15

©1999 Sigma-Aldrich Co. SUPELCO
Analyte Response Factor
Toluene 0.72o-Xylene 0.83Anisole 1.13Benzaldehyde 2.28Aniline 0.83Phenol 0.87Benzoic acid 3.93n-Dibutylnitrosoamine 2.53Dimethylphthalate 0.42Acenaphthene 1.00p-Nitrophenol 3.87p-Nitroaniline 3.161,3,5-Trinitrobenzene 4.64Chrysene 0.69Decachlorobiphenyl 3.16
Response Factors for Semi-volatileCompounds in Study
00-0016
Because the degree of fragmentation varies greatly when they areionized and because only selected ions are used for quantitation, responsefactors are also needed for MS discrimination. Using acenaphthene as aninternal standard, the responses were calculated based on multiple directinjections.
Even though compounds such as decachlorbiphenyl respond well in thetotal ion chromatogram, the compound is highly fragmented with respectto acenaphthene. As a result, it has a high response factor of 3.16. Someof the highly polar analytes are reactive with inlets, columns, and the ionsource and also require higher response factors. Using the response factorsbetter represents what the fiber is capable of extracting, not an evaluationof the analytical system.
16

©1999 Sigma-Aldrich Co. SUPELCO
Analytical Conditions for Evaluation ofFibers with Semi-volatile Analytes
Sample: Water containing 25% NaCl and appropriate 0.05M phosphate buffer, spiked with analytes to a final concentration of 75 ppb
Extraction: Directly immersed for 30 min with agitation
Desorption: 3 min, temperature varies, depending on fiber
Column: 30m x 0.5mm x 0.25µm PTE™-5
Oven: 45°C (2 min) to 210°C at 10°C/min, then to 320°C at 20°C/min (10 min)
Inlet: Split/splitless, closed 1 min, 0.75mm ID liner
Detector: MS ion trap, m/z = 50-515 at 0.6 sec/scan
00-0017
The samples were prepared by spiking 3µl of the standard mix at100ng/ml into a 4ml vial (nominal, actual 4.2) containing 4ml of theappropriate 0.05M phosphate buffer and 25% NaCl in water. The finalconcentration was 75 ppb. The analytes were extracted in duplicate at3 different pH levels (2,7, and 11) using each SPME fiber. Thesummary of fiber efficiency, shown in the next several slides, wasbased on the pH level that provided optimum extraction efficiency ofeach analyte.
The fibers were directly immersed in the solution and the analytes wereextracted for 30min at ambient temperature with stirring. Afterextraction the analytes were desorbed in the injection port containing a0.75mm ID straight liner. The desorption temperature was set at 270°Cfor all of the fibers except Carboxen-PDMS at 310°C, PA at 290°C andCW-DVB set at 260°C.
The analytes were desorbed into a 30m x 0.25mm ID x 0.25µm PTE™-5 column that was programmed as described above. The data werecollected in the full scan mode with an ion trap; however, selected ionswere used to quantify the peaks.
17

©1999 Sigma-Aldrich Co. SUPELCO
Comparison of Area Responses by Fiber Type
1.3
7E
+0
5
7.8
3E
+0
4
1.8
2E
+0
4
1.6
6E
+0
4
5.08E+065.43E+065.54E+06
4.98E+06
o-Xylene Toluene Anisole Benzaldehdye
Bare FS7µm 30µm 100µmPacrylatePDMS-DVBCW-DVBDVB-CARCarboxen
00-0018
This and the next three slides compares the adjusted responses of theanalytes extracted by the various fibers. Each analyte was extracted fromsolutions at pH levels that provided the optimum response for that analyte.The smaller less polar analytes in this series are shown in this slide. Asexpected for these smaller analytes, the Carboxen-PDMS fiber is the bestchoice. However, compared to the volatile analytes in the previous study,the advantage of the Carboxen fiber is not that much better than some ofthe other fibers. The DVB-Carboxen PDMS fiber extracts these analytessimilarly and for xylene slightly better that the Carboxen PDMS fiber.The area counts for the fibers that extracted the most and the least of eachanalyte are listed so that a relative comparison can be made.
These analytes are also extracted well by the DVB containing fibers andby the thicker absorbent fibers the 100µm PDMS and the 85µm PA. Thearea counts obtained with most of these fibers are within the same order ofmagnitude as those for the Carboxen-PDMS; however,the Carboxencontaining fiber coatings are the better choices for these analytes.
The uncoated fused silica and the 7µm PDMS fibers extract theseanalytes poorly compared to the other fibers (up to 2 orders of magnitudeless). This would be expected due to their small size. It was surprisingthat the bare fused silica fiber could retain any amount of these smalleranalytes. This demonstrates that there is an interaction between theanalytes and the bare fiber.
18
©1999 Sigma-Aldrich Co. SUPELCO
Area Response vs. Fiber Type
2.2
9E
+0
5
4.5
0E
+0
39.94E+06
9.14E+06
9.0
4E
+0
5
1.02E+079.85E+06
4.8
8E
+0
3
Dibutylnitrosoamine Acenaphthene Decachlorobiphenyl Chrysene
Bare FS
7µm
30µm
100µm
Pacrylate
PDMS-DVB
CW-DVB
DVB-CAR
Carboxen
00-0019
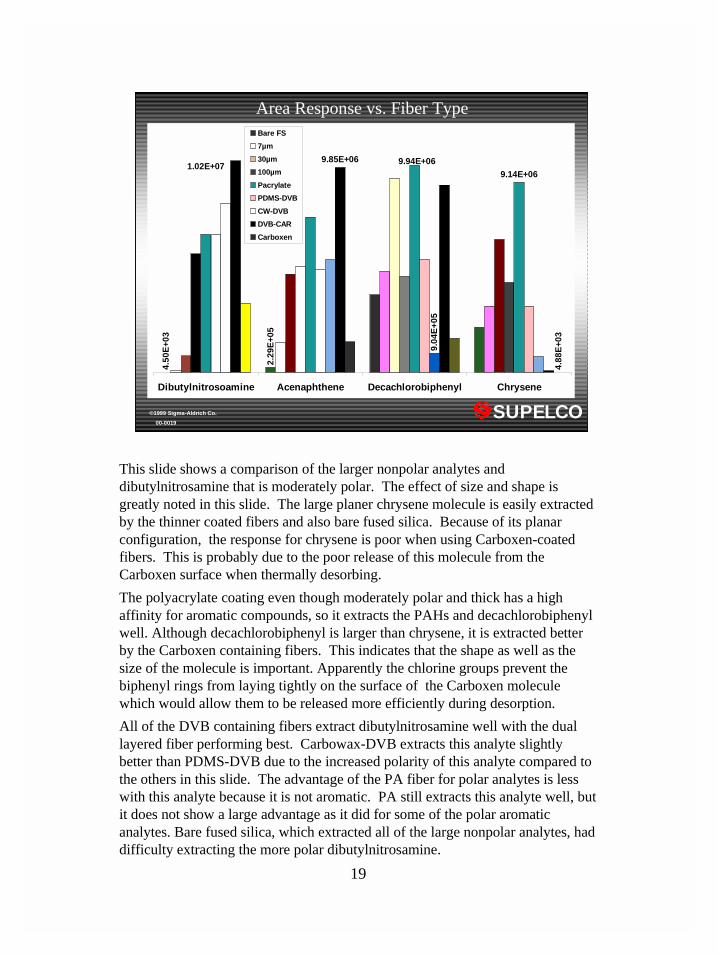
This slide shows a comparison of the larger nonpolar analytes anddibutylnitrosamine that is moderately polar. The effect of size and shape isgreatly noted in this slide. The large planer chrysene molecule is easily extractedby the thinner coated fibers and also bare fused silica. Because of its planarconfiguration, the response for chrysene is poor when using Carboxen-coatedfibers. This is probably due to the poor release of this molecule from theCarboxen surface when thermally desorbing.
The polyacrylate coating even though moderately polar and thick has a highaffinity for aromatic compounds, so it extracts the PAHs and decachlorobiphenylwell. Although decachlorobiphenyl is larger than chrysene, it is extracted betterby the Carboxen containing fibers. This indicates that the shape as well as thesize of the molecule is important. Apparently the chlorine groups prevent thebiphenyl rings from laying tightly on the surface of the Carboxen moleculewhich would allow them to be released more efficiently during desorption.
All of the DVB containing fibers extract dibutylnitrosamine well with the duallayered fiber performing best. Carbowax-DVB extracts this analyte slightlybetter than PDMS-DVB due to the increased polarity of this analyte compared tothe others in this slide. The advantage of the PA fiber for polar analytes is lesswith this analyte because it is not aromatic. PA still extracts this analyte well, butit does not show a large advantage as it did for some of the polar aromaticanalytes. Bare fused silica, which extracted all of the large nonpolar analytes, haddifficulty extracting the more polar dibutylnitrosamine.
19

©1999 Sigma-Aldrich Co. SUPELCO
Area Response vs. Fiber Type
5.2
6E
+0
3
4.2
4E
+0
3
5.5
1E
+0
4
8.9
5E
+0
4
8.87E+05
1.35E+06
2.61E+06
Aniline Dimethylphthalate Benzoic acid
Bare FS
7µm
30µm
100µm
Pacrylate
PDMS-DVB
CW-DVB
DVB-CAR
Carboxen
00-0020
This slide shows some of the more polar analytes in the mix. Theadvantage of a polar fiber is obvious. For the more polar benzoic acid andaniline, the two polar fibers, polyacrylate and CW-DVB extract theseanalytes best.
For the less polar dimethylphthalate, adsorbent type fibers extract muchbetter than absorbent type fibers. Again the PA fiber, though an absorbenttype fiber, extracts dimethylphthalate well because of its aromatic nature.
20

©1999 Sigma-Aldrich Co. SUPELCO
Area Response vs. Fiber Type
3.81
E+
03
2.99
E+
03
04.73
E+
03
7.04
E+
03
6.27E+05
1.34E+06
6.80E+05
2.58E+05
p-Nitroaniline p-Nitrophenol Phenol 1,3,5-Trinitrobenzene
Bare FS
7µm
30µm
100µm
Pacrylate
PDMS-DVB
CW-DVB
DVB-CAR
Carboxen
00-0021
The most polar analytes in the group are best extracted with the polarfibers. Carbowax-DVB and PA coated fibers are best for the nitroanilineand nitrophenol. They are also well suited for the extraction of phenoland trinitrobenzene. Carboxen-PDMS is capable of retaining phenolwhile the DVB-Carboxen was good for extracting trinitrobenzene. Asdemonstrated with the smaller analytes PDMS-DVB has a fairly highaffinity for nitrogen based analytes.
21

©1999 Sigma-Aldrich Co. SUPELCO
Analyte Polarity vs. Area Response
0.E+00
1.E+06
2.E+06
3.E+06
4.E+06
5.E+06
6.E+06
7.E+06
8.E+06
9.E+06
Chrysen
e
Decachlo
robip
henyl
Acenaphth
ene
o-Xyle
ne
Toluene
Anisole
Benzald
ehdye
Dimeth
ylphth
alate
Dibuty
lnitr
osoamin
e
Aniline
p-Nitr
oaniline
1,3,
5-Trin
itroben
zene
p-Nitr
ophenol
Phenol
Benzo
ic a
cid
100µm PDMS
PAcrylate
00-0022
The next two slides show the effect of fiber polarity on the recovery of theanalytes with this slide focusing of the absorbent type fibers. In this case,polarity increases from left to right. The more polar PA fiber extracts themore polar analytes from 1-2 orders of magnitude greater than the 100µmPDMS fiber. The advantage for using a polar fiber to extract polaranalytes is significant for analytes with molecular weights greater than 90.
Surprisingly the polyacrylate fiber even extracted the more nonpolaranalytes better than the PDMS fiber. As stated previously, we haveobserved that the PA fiber appears to have some pi-pi interactions witharomatic rings.
22

©1999 Sigma-Aldrich Co. SUPELCO
Analyte Polarity vs. Area Response
0.E+00
1.E+06
2.E+06
3.E+06
4.E+06
5.E+06
6.E+06
7.E+06
8.E+06
9.E+06
Chryse
ne
Decac
hloro
biphen
yl
Acenap
hthen
e
o-Xyl
ene
Toluen
e
Anisole
Benza
ldeh
dye
Dimet
hylphth
alat
e
n-Dib
utyln
itroso
amin
e
Aniline
p-Nitr
oanili
ne
1,3,
5-Trin
itroben
zene
p-Nitr
ophenol
Phenol
Benzo
ic a
cid
PDMS-DVB
CW-DVB
00-0023
This slide compares the analyte response and polarity obtained byextraction with 2 adsorbent type fibers. The less polar PDMS-DVBextracted the less polar analytes, shown on the left side, more efficientlythan the polar CW-DVB fiber. But as the polarity of the analytesincreased, the response of the analytes with the PDMS-DVB decreasedwith respect to the CW-DVB. The advantage the more polar CW-DVBcoated fiber is significant. The improvement in response ranges from 2-10 times greater.
Unlike the 100µm PDMS, shown in the previous slide, the PDMS-DVBwas capable of extracting the polar analytes at levels that were easilydetected. This made the advantage of the CW fiber over the PDMS-DVBfiber less than the PA fiber over the PDMS fiber. If you compare the CW-DVB fiber to the PA fiber for the extraction of polar analytes, theresponses were nearly the same.
23

©1999 Sigma-Aldrich Co. SUPELCO
Effects of Coating Thickness on Analyte Recovery
Tolueneo-Xylene
AcenaphtheneChrysene
Decachlorobiphenyl
Bare FS7µm30µm
100µm
00-0024
This slide shows the effects of analyte size and fiber coating thicknessusing 3 PDMS fibers and bare fused silica. The molecular weightsincrease from left to right. The smaller analytes as expected are extractedbest with the thicker coating. The results show that the response isdirectly proportional to the thickness of the fiber coating. The 100µmPDMS fiber extracts these analytes very well with respect to the others.However, the advantage of the thick film diminishes as the size of theanalytes increase. The larger analytes such as chrysene anddecachlorobiphenyl do not migrate quickly into this phase. For theresponse to increase, the extraction time would need to be increased.
Bare fused silica and the 7µm PDMS do not extract the smaller analyteswell as expected. The interesting fact is that the bare fused silica linesand the 7µm PDMS lines run parallel with each other. This indicates thatthe same mechanism for retaining the analytes on the bare fused silica arealso apparent with the 7µm PDMS. The coating did not impede theinteraction with the silica.
The 30µm PDMS fiber is an excellent choice for extracting a widemolecular weight range if the analytes are nonpolar. It appears that theamount of analyte extracted is directly proportional to the size of themolecule. Even at a molecular weight 500, the response is linear. Thesmaller analytes are sufficiently extracted to provide a good response.
24

©1999 Sigma-Aldrich Co. SUPELCO
Analyte Size vs. Area Response
Toluen
e
o-Xyle
ne
Acenap
hthen
e
n-Dib
utyln
itroso
amin
e
Dimet
hylphth
alat
e
Chryse
ne
Decac
hloro
biphen
yl
7µm PDMS
Carboxen-PDMS
00-0025
This slide shows the analyte response relative to their molecular weightwith the Carboxen-PDMS fiber and the 7µm PDMS fiber. The Carboxen-PDMS fiber is the strongest fiber whereas the 7µm PDMS is the weakestcoated fiber in terms of retention of analytes.
For the Carboxen coated fiber the amount of analyte extracted or detecteddecrease as the molecular weight increases. If one ignores the PAHs thatare not deosrbed well off the fiber, there is a fairly linear decrease inresponse as the size of the analyte increases.
Conversely, for the 7µm PDMS fiber the opposite is true. The amount ofanalyte detected increases as the size of the analyte increases. If oneoverlooks the more polar analytes dimethylphthalate anddibutylnitrosamine, that are not well extracted by this fiber, the increasein response is proportional to the molecular weight of the analyte.
25

©1999 Sigma-Aldrich Co. SUPELCO
Classical Adsorption Mechanismfor a Uniform Surface
number of adsorption sites filled
number of adsorption sites available
Langmuir’s Isotherm Ø = KPA /(1 + KPA )
where K = k a /kd k a = rate of adsorption k d = rate of desorption
Ø =
00-0026
In the third study, our goal was to determine the capacity and linear rangeof the analytes. By monitoring the adsorption profiles of an analyteversus its concentration, the capacity of the fiber for that analyte can bedetermined. However, this becomes more complex when there is morethat one analyte being extracted simultaneously.
For adsorbent type fibers, there are a limited number of sites or pores.Analytes may compete for the same site. This becomes a particularproblem when the pores are uniform. According to Langmuir’s Isotherm,when there is a uniform pore and under constant pressure conditions, theanalyte with the highest distribution constant will displace the analytewith the lower constant. This theory only holds when you have a uniformpore. The Carboxen 1006 particles used in the fiber, are tapered and notuniform; whereas, the DVB contains primarily uniform pores. Byincreasing the concentration of a mixture of analytes, eventually the siteswill become occupied. At this point no more sample will be adsorbed ordisplacement will occur. This study should be able to determine ifLangmuir’s Isotherm applies to the current SPME fiber coatings.
26

©1999 Sigma-Aldrich Co. SUPELCO
Analyte Response vs. Conc. (Carboxen-PDMS)15 Min Ext.
1.5
2
2.5
3
3.5
4
4.5
5
5.5
6
6.5
0.5 1 1.5 2 2.5 3 3.5 4 4.5 5 5.5
Log of Concentration (PPB)
Lo
g R
esp
on
se
Pentane
Nitropropane
Methylene Chloride
Propionitrile
Acetone
Isopropanol
Dioxane
00-0027
This slide shows the response of the 7 analytes versus concentration of theanalytes from a 15 min. extraction using the Carboxen-PDMS coated fiber. Thegraph is plotted in log/log form, because it covers 6 orders of magnitude. The rangein ppb is 5 ppb to 100,000 ppb or 100 ppm. On the log scale, the number 1 isequivalent to 10 ppb and the number 5 represents 100,000 ppb.
There are several interesting results from this study. All of the analytes in thismix could be extracted and quantified at 5 ppb with the Carboxen-PDMS fiber.This shows that this material maintains these analytes as previously shown.
The second point is that the plot was linear from 5ppb to 1000ppb. At higherconcentrations the response began to level off.
The third point is that there was only a slight displacement of isopropanol asindicated by its response decreasing as the concentration increased. When the lineson the curves crossover each other, this usually indicates displacement. The lack ofdisplacement was expected since the pores in Carboxen 1006 are not uniform.
The lower response may be more of a solubility issue than displacement. The highconcentration of seven solvents in the water made isopropanol more soluble.Because of its high solubility, in water, it could be greatly affected by othersolvents. It could be a combination, because if one analyte is being displaced byanother analyte, the response for the displacing analyte should continue to rise. Forthe most part this is not the case, but there may be a slight indication that methylenechloride might be displacing isopropanol.
27

©1999 Sigma-Aldrich Co. SUPELCO
Analyte Response vs. Conc. (Carboxen PDMS 2min Ext.)
1.5
2
2.5
3
3.5
4
4.5
5
5.5
6
1 1.5 2 2.5 3 3.5 4 4.5 5 5.5
Log of Concentration (PPB)
Log
of A
rea R
esp
on
se
Pentane
Nitropropane
Methylene Chloride
Propionitrile
Acetone
Isopropanol
Dioxane
00-0028
By reducing the extraction time to 2 min, the linear range for theCarboxen-PDMS could be extended to 25,000 ppb. However, theminimum quantitation limit was increased from 5 ppb to 25 ppb. Simplyby reducing the extraction time, you reduce the amount of the analytesextracted.
You will notice that the points for the analytes representing 100,000 ppbdramatically shifted. The response for the polar analyte sharply increasedwhereas the response for the nonpolar analytes dropped. This strangephenomenon was not expected and would only occur with impropersampling or handling. When the vial representing 100,000 ppb waschecked, it was determined that the lid was not on as snuggly as theothers. Also it was the last vial in the tray to be analyzed. The nonpolaranalytes, being less soluble in water evaporated. This reduced the co-solvating effects and thus the response for the polar analytes dramaticallyincreased. One could also interpret the results by noting the nonpolaranalytes were not occupying sites which enabled more of the polaranalytes to be extracted. Either case could be correct.
28

©1999 Sigma-Aldrich Co. SUPELCO
Analyte Response vs. Conc. (PDMS-DVB)
1
1.5
2
2.5
3
3.5
4
4.5
5
5.5
6
0.5 1 1.5 2 2.5 3 3.5 4 4.5 5 5.5
Log concentration (ppb)
Lo
g r
es
po
ns
e
PentaneNitropropaneMethylene ChloridePropionitrileDioxaneAcetoneIsopropanol
00-0029
When the analytes were extracted with the PDMS-DVB fiber for 15min,the curve appeared to be more linear than the Carboxen-PDMS fiberthroughout the range. There was never a decreased response as theconcentration increased, only the rate of increase was reduced for someanalytes.
If you look at methylene chloride and propionitrile, these analytes werelinear throughout the range, but if you look at acetone and isopropanol,you see the curves drop, relative to the curves for the other analytesencompassing them. This would mostly likely indicate that displacementis occurring, but it was not as obvious as expected. Because of therelatively uniform pore size in DVB, more displacement was expected;however, this result may indicate that there is a sufficient amount of non-uniform pores to reduce displacement.
The other factor observed with this fiber is that all of the lower detectionlimits were higher than the Carboxen coated fibers and that the limitswere dependent upon the polarity of the analyte. For the less polaranalytes the minimum quantitation limit was 5 ppb, but for the polaranalytes the minimum quantitation limit was 50-100 ppb.
29

©1999 Sigma-Aldrich Co. SUPELCO
Analyte Response vs. Conc. (100µm PDMS)
0.5
1.5
2.5
3.5
4.5
5.5
1.5 2 2.5 3 3.5 4 4.5 5 5.5Log Concentration (ppb)
Lo
g R
epo
nse
Pentane
NitropropaneMethylene Chloride
PropionitrileAcetoneDioxane
Isopropanol
00-0030
As expected the absorbent type 100µm PDMS fiber was linear at highanalyte concentrations; however the minimum quantitation limits werequite high ranging from 100 ppb for the nonpolar analytes to 1000ppb forthe most polar analytes. There is no displacement observed with this fiber.Most of the curves are quite parallel. Only acetone showed a slightdecrease in the linear rate at the higher concentration levels. Thecorrelation coefficients for all of the analytes had R values of three 9’s orbetter. This demonstrated the ability of the absorbent type fibers toextract analytes at high concentrations and not be concerned aboutdisplacement.
The various slides show that selecting a fiber is based on theconcentration range and the detection limits that the analyst needs. Thereis no need to use an adsorbent type fiber for extraction of analytes at highconcentration levels. However, if trace detection limits are needed, theadsorbent type of fibers are better.
30

©1999 Sigma-Aldrich Co. SUPELCO
Conclusions
• Carboxen-PDMS is best for extracting small analytes (MW<90)
• Adsorbent and absorbent fibers are suitable for larger analytes
• Fiber polarity has little effect on the extraction of small analytes
• Fiber polarity influences the extraction of larger analytes
• Carboxen-PDMS has good linearity at trace analyte concen-tration levels but saturates at high levels with little displacement
• PDMS-DVB has good linearity at low levels but exhibitsdisplacement at higher levels
• Absorbent fibers yield higher MDLs,
• Absorbent fibers have greater capacity and wider linear range
00-0031
Based on these three studies, the following conclusions can be made. TheCarboxen-PDMS coated fibers are the best for extracting small analytes attrace levels. But with larger analytes the advantages of the other fibersexceed those for the Carboxen-PDMS fiber.
Fiber polarity has little effect on the extraction of small polar analytes, butfiber polarity has a great effect on the extraction of larger, polar analytes.The PA fiber and the CW-DVB were suitable for extraction of both polarand nonpolar larger sized analytes.
The Carboxen-PDMS fiber can be easily saturated, but displacement isnot common. The DVB containing fibers can also be saturated, with somedisplacement. The absorbent type fibers show no displacement and arelinear at high concentrations, but their minimum detection limits are muchhigher.
The overall summary is that analyte size, concentration levels, anddetection limits must all be taken into consideration when selecting fibers.There is not going to be one fiber that will do all the analytes at tracelevels to high concentrations, but this presentation should help you pickthe best fiber for your particular application need.
31