sunspot & solar cycle - weebly
TRANSCRIPT

Objectives: S.W.B.A.T.
Understand the pattern of sunspot and solar cycle
Effects during the solar cycle on the sun
Discuss the research related to the solar cycle
Give evidence that the solar cycle has been relatively constant = proof and data

Activities:
Warm-up
Notes/discussion
Sunspot graph and questions review – discuss
Start on H.W. Sun 1-4 and Magic square sun parts review

Sunspot & Solar Cycle

Galileo – 1st to observe sunspots and record data
? Ancient Chinese also known to have observed sunspots
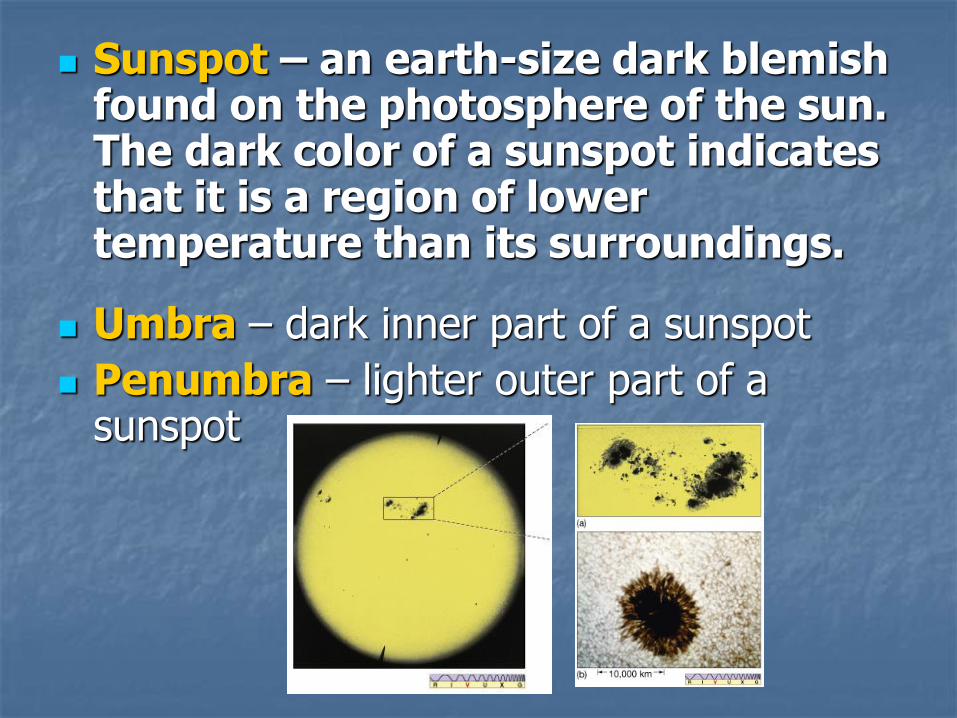
Sunspot – an earth-size dark blemish found on the photosphere of the sun. The dark color of a sunspot indicates that it is a region of lower temperature than its surroundings.
Umbra – dark inner part of a sunspot
Penumbra – lighter outer part of a sunspot
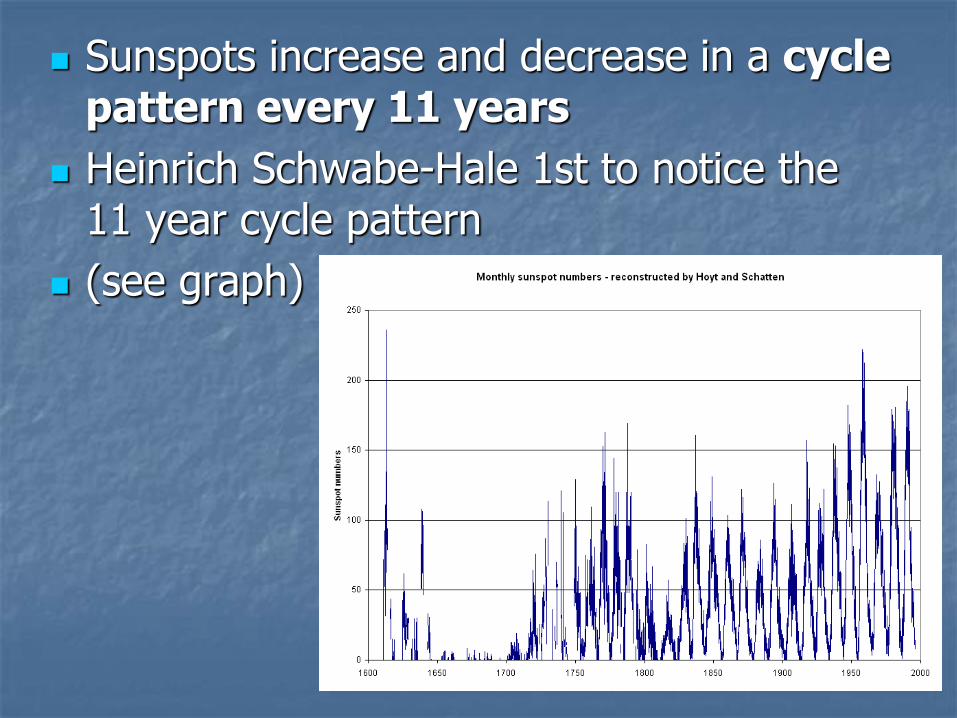
Sunspots increase and decrease in a cycle pattern every 11 years
Heinrich Schwabe-Hale 1st to notice the 11 year cycle pattern
(see graph)

Walter Maunder – 1st to observe that the cycle had missing data or sunspots did not occur during 1645-1715 – hardly any sunspot data or very few sunspots ???

John Eddy – confirmed this missing data and found cycle of low sunspot data to be true
Area and time period discovered is now called the
Maunder Minimum – a period of low sunspot activity, quiet period in solar activity.

Proof this occurred:
- Old book data (monks)
- Tree ring studies (carbon 14 in growth rings)
- Ice cores in glaciers and ice packs (thicker ice during this time period)
- Sedimentary rock deposition – layers found in Australia – matches the 11 year pattern and past solar data

The data above confirms as many as 12 Maunder Minimums may have occurred in the past

Key about this discovery:
Shows the sun cycle most of the time is very stable
Scientist wish to understand patterns in nature and how it may affect Earth’s weather and past events
A 1% energy change output could create a 1º Celsius change in Earth’s overall temperature, which would have drastic effects

Solar constant: The amount of energy received at 1 A.U. has been constant since observing sun’s energy output (satellite data)
= 1400 W/m² or 2 cal./cm²/minute

Magnetic cycle: 22 year poles flip
Sunspots mostly appear in pairs and in groups & clusters
Reason appear in pairs is due to rotation of the sun is not uniform

Center or equator of the sun rotates faster than the Polar Regions
Equator = 25 days, Polar = 30+ days
This twists and disrupts magnetic field lines of the sun
(rubber band demo)

Due to this rotational pattern sunspots appear in an orderly fashion and pattern on the photosphere
At the start of a sunspot cycle they appear around solar latitudes of +/- 30°
When at solar maximum sunspots appear at +/- 15º latitude
At the end of solar cycle or solar minimum they appear near equator

The pattern that develops over a 11-year span is often called butterfly diagram of sunspots (see diagram)
Once sunspots cycle is completed its pattern begins again but the polarity of sunspots change every 22 years

Ways to calculate solar rotation:
by observing sunspots
by using the Doppler effect using a spectroscope

Sunspot relationship to solar activity:
High sunspot number # = high solar activity
Which = more: flares, solar wind, larger corona, more prominences, extreme solar mass ejections of material

A few studies have shown relationships to droughts, ice ages, El Niño