sunsim storage manual eng · sunsim storage – user manual – 16/08/2016 5 data, which refer to...
TRANSCRIPT

SunSim Storage – User Manual – 16/08/2016
1
SunSim Storage – User manual
Introduction The program SunSim Storage has been devised and developed to calculate in a simple, quick and
reliable way the behaviour of the photovoltaic systems connected to the grid along with their energy
storage.
Frequently, the economic calculation for the photovoltaic systems with storage is based on yearly or
seasonal average data that do not take into account the actual trend of electric loads. These
approximated calculations in most cases lead to totally erroneous results because, especially
considering a single user, the highly discontinuous loads trend cannot be reduced to behaviours
averaged over time.
Demonstrating how said, one should try to see if the calculation method presently in use can answer
positively to the following questions:
− Does it take into account the different seasonal behaviour, also considering the different
availability of the solar source and the different trend of the loads (e.g. lighting, heating /
cooling devices, etc.)?
− Does it take into account the different load trend in the weekly days (working, Saturdays,
Sundays)?
− Does it take into account the presumable periods of summer inactivity (holydays, vacations,
closures, etc.)?
− Does it take into account the different type of loads (residential, commercial, industrial,
etc.)?
One should note that while for the usual grid connected photovoltaic systems what really matters
are the annual values of production and consumption, in case of systems with storage, it is
fundamental to foster the storage itself both energetically and economically. Nevertheless, to
achieve this result one needs to consider in detail the amount of energy that the storage can turn into
self-consumption. Only in this way one can evaluate if its presence is justified and which size can
be considered as optimal.
Calculation method SunSim Storage is a simulation program that works in the time domain. As concerns the
photovoltaic production, results are obtained by tracking the solar paths during the year, thus
evaluating the effects on the site in the sampled points and finally by properly adding all those the
partial results.
Consumption data are taken instead from a file and continuously compared with the photovoltaic
production and with the stored energy. The presence of the electric grid allows to equilibrate the
energy balance, as in every considered instant:

SunSim Storage – User Manual – 16/08/2016
2
− if the photovoltaic production is greater than consumptions the system readdress the surplus
toward the storage and, when this is saturated, the exceeding energy is sent to the grid;
− if the photovoltaic production is lower than consumptions the system picks up from the grid
the missing energy and, when the storage is empty or has reached its technical minimum, the
same energy is taken from the grid.
The corresponding energy fluxes are illustrated in the following figure.
SunSim Storage makes the simulation of the energy behaviour for the system composed by
photovoltaic plant, storage, electric loads and electric grid for a full calendar year.
The simulation approach, identical to that used by SunSim 8.0, allows the exploitation of the
initial data in a simple and understandable format (direct and diffuse monthly solar radiation, time
series for electric loads). Conversely, results need a huge amount of calculations (the time step
adopted by SunSim Storage is 5 minuts) and in the Annex B a few details on the used method are
shown.
The program is completely written in C/C++ language.
Minimum system requirements The program SunSim Storage can work on every PC commercially available with operating
system Windows Vista or higher and a minimum screen resolution of 1280×720.
The resources needed by SunSim Storage are anyway very low, because the program does not
need the installation of specific drivers, does not use its own DLL libraries and can work without an
installation procedure, because it can run from any folder contained in a fixed or movable device
such as, for example, a CD or a memory stick.
However, in the same folder of SunSim Storage the file loads.txt must be present, which contains
the input data related to the total consumptions of the electric loads considered.

SunSim Storage – User Manual – 16/08/2016
3
Installation SunSim Storage does not need any installation procedure and can run from any folder contained
in a fixed or movable device simply by double-clicking on the program icon.
Firstly, it is advisable to copy the executable file on the Desktop (along with the loads.txt) and, by
means of the right mouse button, activate the command “Add to Start Menu”.
Protection SunSim Storage is protected by means of a code of 3 characters that are notified at delivery time
and that shall be inserted in the specific editable field named Insert Code �.
If the 3 characters are right, the editable field disappear and at its place the text Code accepted
will appear. Otherwise, an error message will appear and the program terminates its execution.
Every copy of SunSim Storage distributed under licence is customized, because in the main
window the name of the owner is properly marked as it is in the user licence.
Operation description The program SunSim Storage consistes essentially of a main dialogue window through which is
possible to control all the main parameters involved in the calculations.
In the following, the specific items of the main window as well as the other windows that is
possible to open will be considered.
From the main window, it is possible to find the areas, which contain the main commands for the
program:
− Solar data-base – Meteo station
− PV Power, BOS
− Storage, DOD, η chsrge/disch.
− Loads data-base
Moreover, there are further areas where it is possible to select the graphical presentation of results:
− Solar, Production, Consumption, Prod. + Cons., Storage, Grid exchange, Self consumption, State of Charge
− Monthly, Day monthly, Daily
− Buttons for the selection of the current month and the current day
Finally, there are a report area for the yearly results and an area that allow to save the calculated
values on files .RTF e .CSV:
In the next figure an example of main window is shown. As almost all operations made without
opening further windows, the main window include a graphical sub-window where all trends of the
results can be plotted by selecting those that interest.

SunSim Storage – User Manual – 16/08/2016
4
Input data
Solar data-base – Meteo station This pane manages the choice of the solar source and the orientation of the photovoltaic array.
The following figure shows an example of this section.
By means of the drop-down menu it is possible to select the data of direct and diffuse radiation on a
horizontal plane for the chosen site. These data refers to those reported in the standard UNI 10349
for the Italian sites and to the calculation methods used by Ispra Joint Research Centre (JRC) for the
Europe, Middle East and North Africa as well as for a number of representative Italian sites.
Information available on PVGIS are of public domain and can be found on the JRC website.

SunSim Storage – User Manual – 16/08/2016
5
Data, which refer to the standard UNI 10349, concern the following 101 Italian provinces.
Agrigento Genova Pistoia
Alessandria Gorizia Pavia
Ancona Grosseto Potenza
Aosta Imperia Ravenna
Ascoli Piceno Isernia Reggio di Calabria
L’Aquila Crotone Reggio nell’Emilia
Arezzo La Spezia Ragusa
Asti Lecco Rieti
Avellino Lodi Roma
Bari Lecce Rimini
Bergamo Livorno Rovigo
Belluno Latina Salerno
Benevento Lucca Siena
Bologna Macerata Sondrio
Brindisi Messina Siracusa
Brescia Milano Sassari
Bolzano Mantova Savona
Cagliari Modena Taranto
Campobasso Massa-Carrara Teramo
Caserta Matera Trento
Chieti Napoli Torino
Caltanissetta Novara Trapani
Cuneo Nuoro Terni
Como Oristano Trieste
Cremona Palermo Treviso
Cosenza Padova Udine
Catania Parma Varese
Catanzaro Perugia Verbania
Enna Pescara Vercelli
Ferrara Piacenza Venezia
Foggia Pisa Vicenza
Firenze Pordenone Verona
Forlì Prato Viterbo
Frosinone Pesaro e Urbino
Data, which refer to the calculation methods, adopted by the Joint Research Centre, concern the
categories Classic PVGIS, PVGIS-Helioclim and Climate-SAF PVGIS.
The 88 sites listed here below have been selected by referring to the Classic PVGIS method.
Belfast (UK) Hamburg (D) Roma (I)
Birmingham (UK) Munchen (D) Campobasso (I)
Edinburgh (UK) Warszawa (PL) Napoli (I)
London (UK) Praha (CZ) Potenza (I)
Manchester (UK) Bern (CH) Bari (I)
Dublin (IRL) Innsbruck (A) Lecce (I)
Reykjavik (IS) Wien (A) Cosenza (I)
Oslo (N) Budapest (H) Reggio Calabria (I)
Stockholm (S) Barcelona (E) Palermo (I)
Helsinki (SF) Bilbao (E) Catania (I)
Kobenhavn (DK) Granada (E) Ragusa (I)
Vilnius (LT) Madrid (E) Sassari (I)
Riga (LV) Sevilla (E) Cagliari ()
Tallin (EST) Zaragoza (E) Ljubliana (SLO)

SunSim Storage – User Manual – 16/08/2016
6
Moskva (RU) Lisboa (P) Zadar (HR)
Minsk (BY) Porto (P) Beograd (SRB)
Kiev (UA) Aosta (I) Bucaresti (R)
Bordeaux (F) Bolzano (I) Sofija (BG)
Lyon (F) Torino (I) Tirana (AL)
Marseille (F) Milano (I) Athina (GR)
Nice (F) Padova (I) Thessaloniki (GR)
Paris (F) Udine (I) Istanbul (TR)
Rennes (F) Genova (I) Valletta (M)
Strasbourg (F) Bologna (I) Nicosia (CY)
Bruxelles (B) Firenze (I) Casablanca (MA)
Amsterdam (NL) Ancona (I) Algier (DZ)
Luxembourg (L) Perugia (I) Tunis (TN)
Berlin (D) Grosseto (I) Tripoli (LAR)
Frankfurt (D) Pescara (I) Cairo (ET)
Freiburg (D)
For the following 3 sites the reference is represented instead by the calculation method PVGIS-
Helioclim.
Doha (Q) Dubai (UAE) Riyad (KSA)
Finally, for the following 26 sites in Italy the calculation method Climate-SAF PVGIS was also
used.
Aosta Bolzano Torino
Milano Padova Udine
Genova Bologna Firenze
Ancona Perugia Grosseto
Pescara Roma Campobasso
Napoli Potenza Bari
Lecce Cosenza Reggio Calabria
Palermo Catania Ragusa
Sassari Cagliari
As one can see, a number of Italian sites are recallable both from UNI 10349 and from JRC. In this
way it is possible to understand how different solar data can affect results.
By means of a first pair of buttons marked with the arrows ↓ and ↑ it is possible to modify the
latitude of the site from 0° N to 90° N by initiating from that of the chosen site. The use of these
buttons for minor corrections does not cause any problem. However, if large variations are needed
one should always keep in mind that the radiation data loaded for that site could not be compatible
with the new latitude, especially shifting northward. Thus in these cases it is always necessary to
verify the correctness of the radiation data and modify them when needed.
There is also a second pair of buttons marked with the arrows ↓ and ↑, by means of which it is
possible to modify the tilt of the PV array plane from 0° N to 90° N. Similarly, with the arrows
and � it is possible to modify the azimuth between -180° and +180° compared to the South.
The last one of the sites in the list is indicated as <New site>. It is a site for which it is possible to
introduce solar radiation data from an existing site.
In this section, the solar radiation values for the selected site and the specific orientation of the solar
array are also displayed. These values refer to the direct, diffuse and total radiation.

SunSim Storage – User Manual – 16/08/2016
7
The button New Site allows the personalization of the direct and diffuse solar radiation by means
of a specific dialog window as shown in the following figure.
By means of the buttons Up and Dw it is possible to increase or decrease the values of direct and
diffuse daily average solar radiation per month. The values to modify are chosen by means of a
selection grid made by means of checkboxes placed in correspondence of the months of the year
and of the direct and diffuse radiation. By this method it is possible to modify several values at the
same time.
As an example, in the figure the direct and diffuse solar radiation for the months of August,
September, October and November has been selected. By pressing the buttons Up and Dw it is thus
possible to change all the selected values at the same time.
The window allow to save the new set values in a proper file .SIT and to open the existing files to
load the data previously saved.
Yearly production As seen, the section Solar data base – Meteo station refers to the solar radiation values
intercepted by the PV modules array, regardless of the solar conversion technology employed and
the characteristics of the photovoltaic system.

SunSim Storage – User Manual – 16/08/2016
8
Conversely, in this section dedicated to the yearly production, it is possible to specify the rated
power of the photovoltaic system (defined as the sum of the rated powers of the PV modules that
compose it) and the overall efficiency (BOS) of all the chain up to the output connections.
The following figure shows an example of this section.
Based on the solar radiation values previously calculated and the characteristics of the PV system
introduced in this section, the yearly production value of the PV system is also calculated and
displayed.
Storage characteristics The characteristics of the storage are identified by the parameters contained in the following figure,
reported as an example.
The parameter associated to Storage refers to the rated value of the storage capacity, expressed in
kWh.
DOD (Depth Of Discharge) refers to the maximum percentage of the dischargeable energy from a
chemical storage before a degradation might occur. This parameter, typically, is applied to lead-acid
elements that cannot be completely discharged. A value equal to 60%, as in the example, means that
actually only a 60% of the rated capacity of the storage can be employed. Conversely, if the storage
has not such problems it is possible to indicate a value equal to 100%.
The parameter η charge/disch. takes into account the fact that not all the energy entered in the
storage can be retrieved afterwards. In the given example, the 75% of the stored energy is actually
recovered.
Loads data-base It must be stated that the temporal values of the electric loads are contained in a single file named
loads.txt. In this file one can insert up to 10 different types of electric loads also differently
organized.

SunSim Storage – User Manual – 16/08/2016
9
By choosing a specific electric load form the dropdown menu, the total yearly consumption in kWh
is automatically displayed. Normally it is however necessary to conform such a value to specific
needs, while maintaining the trend over time and for this reason by means of the parameter Adjust it is possible to introduce a proper multiplying factor. In the above example, the yearly energy
consumed by loads was made almost coincide with the yearly energy produced by the photovoltaic
system (although these two values could differ anyway).
The file loads.txt provided with Sunsim Storage contains a few examples, but it is possible to add
others in a pretty simple way as reported in the annex C.
Graphical views SunSim Storage can plot the results in different ways by means of very simple selection tools.
The time range that one can display is one of the followings:
− Monthly – display of 12 monthly averages in the year
− Day monthly – display of the average daily trend in a given month
− Daily – display of a trend for a specific day in the year
Referring to the variables to be plotted it is possible to have the following graphs:
− Solar – values of the direct and diffuse solar radiation
− Production – photovoltaic production
− Consumption – consumption of the electric loads
− Prod. + Cons. – photovoltaic production and consumption of the electric loads in the same
graph
− Storage – energies in transit from and to the storage, compared with production and
consumptions
− Grid exchange – energies in transit from and to the grid, compared with production and
consumptions
− Self consumption – percentage of consumptions that have been covered by the produced
energy
− State of charge – state of charge of the storage
The following figure shows the area where it is possible to take these options.
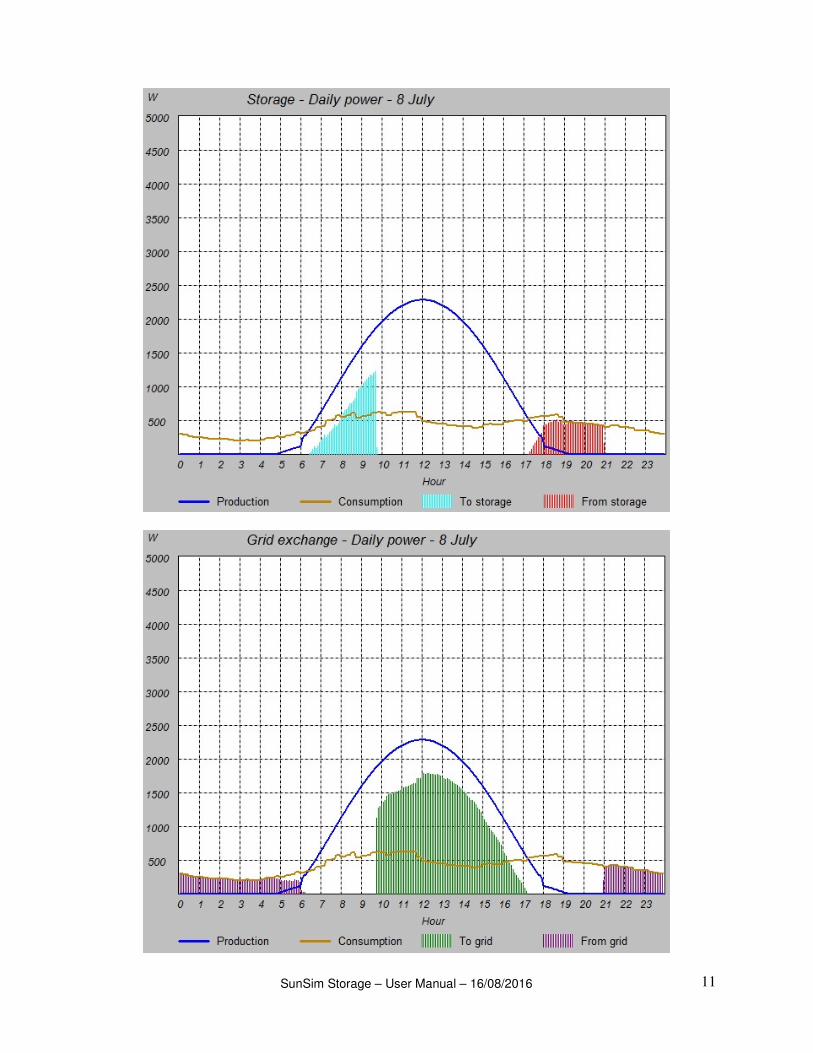
From a simple simulation as that reported in the example (3 kWp PV + 3 kWh storage) and with the
residential-type consumptions as indicated, one can observe that in some winter-autumn periods
there are days where the produced energy is totally self-consumed and the storage can therefore
transfer all the daily production to the evening hours. Conversely, in the months of higher
production, the storage cannot store all the exceeding energy and, once it is saturated, it must be
perforce disconnected up to the end of the day, when it will be required to give back the stored
energy.
The following figures show these behaviours in two specific day chosen in the months of December
and July.

SunSim Storage – User Manual – 16/08/2016
10
SunSim Storage – User Manual – 16/08/2016
11

SunSim Storage – User Manual – 16/08/2016
12
The program displays also a summary table that reports the energies exchanged during the year. The
following figure shows an example.
Reports SunSim Storage allows to obtain a number of reports that can be used by word processors and
spreadsheets, because it can produce files .RTF (Rich Text Format) and .CSV (Comma-Separated
Values).
In the section Save results it is possible to generate the reports of interest, that is:
Text RTF File readable by every word processor
CSV (i.f) File readable by every spreadsheet with a dot between the decimal and the integer
part of the values and those separated from one another by a comma (English
standard)
CSV (i,f) File readable by every spreadsheet with a comma between the decimal and the
integer part of the values and those separated from one another by a dot (Italian
standard)
Text file .RTF The content of the .RTF files is different depending on the temporal interval selected.
If Monthly is selected, the file reports the monthly averages and the daily trends.
It is the report most frequently used and that can give a general view of the trends of the system
variables, as in the example reported in the following figure that displays a portion of the file.

SunSim Storage – User Manual – 16/08/2016
13
In the case instead that Day monthly is selected, the file reports every single value with a 5-minute
interval of the average daily trend for the selected month, as in the example reported in the
following figure that displays a portion of the file.

SunSim Storage – User Manual – 16/08/2016
14
Finally, if Daily is chosen, the file reports every single value with a 5-minute interval of the specific
selected day, as in the example reported in the following figure that displays a portion of the file.

SunSim Storage – User Manual – 16/08/2016
15
File for the spreadsheet .CSV The .CSV files type generated by SunSim Storage, contain the same informations of the report
files .RTF but these can be read by every spreadsheet.

SunSim Storage – User Manual – 16/08/2016
16
Annex A
Files managed by SunSim Storage
LOADS.TXT File containing the data of the load types that SunSim Storage can use
<filename>.SIT File containing the latitude and the values of solar radiation data as
monthly averages for a given site not included in the list proposed by the
program
<filename>.RTF Report file readable by a un word processor
<filename>.CSV Report file readable by a spreadsheet
Files included in the software package
SunSim Storage.exe Executable program
Protection.txt File containing the 3 characters to digit in order to enable the
operation of the program
Licence.PDF User licence of the program
SunSim_Storage_Manual.PDF User manual of SunSim Storage
Possible problems of use in a few PC Although SunSim Storage was made with the aim of having the widest possible diffusion on
different PCs and versions of the Microsoft Windows operating system, in a few cases some
compatibility problems have been detected as listed hereafter.
Windows 8.0 e Windows 8.1
In some installations of these versions of Windows the library msvcr100.dll is not present, although
C-written programs, as SunSim Storage, often use it. In these cases, one can fix this problem by
adding the proper file in the system folder or by installing Microsoft Visual C++ 2010 (free).
Windows XP
On this version of Windows, no working problems have been reported, but the icon of the program
is not always properly read and in these case Widows shows the default symbol for unknown icons.
Annex B
Method used for the calculation of the solar radiation
Solar paths and shadows diagram
The values of the solar elevation h
θ and of the azimuth angle a
θ are obtained from the latitude Φ e
the declination δ (different curves have different declinations). Each curve is therefore obtained by
varying the hour angle ω in the following formulas.

SunSim Storage – User Manual – 16/08/2016
17
ωδδθ coscoscossinsincos ⋅Φ⋅+Φ⋅=h
Φ⋅
−Φ⋅=
coscos
sinsinsincos
h
h
a θδθ
θ
Where:
+⋅⋅=
365
284360sin45,23
nδ ( n is the day of the year calculated from the 1st of January)
18015 −∆+⋅= ωω t ( t is the time in hours and ω∆ depends from the longitude)
Orientation of the PV module array
The possible values for the tilt of the array β range from 0° and 90°, while those of the azimuth α
must range between -180° and +180° referred to South. This possibility to operate on the entire
diagram allow the simulation of northward tilts for the PV module array.
Calculation of the direct solar radiation
The calculation of the direct solar radiation is made by examining separately the solar paths referred
to different months. Each solar path is thus considered as composed by a number of points, whose
radiation with respect to the PV module array is calculated for each of them on the basis of the
following factors:
− Solar radiation data
− θ angle between the path of the direct radiation and the normal to the plane of the module
array
− Turbidity of the atmosphere
The solar radiation data are those prevoiously loaded on the site, while the θ angle is calculated
according to the following expression:
αβδδθ cossincossinsinsincos ⋅⋅Φ⋅−Φ⋅=
ωαβδωβδ coscossinsincoscoscoscoscos ⋅⋅⋅Φ⋅+⋅⋅Φ⋅+
ωαβδ sinsinsincos ⋅⋅⋅+
The turbidity of the atmosphere is calculated by means of the Linke formula:
amT
B
LCDAeII⋅⋅−⋅= δ
0
The Linke formula therefore may allow the calculation of the value of the direct solar radiation on
ground B
I from the extra-atmospheric one0I . The formula uses the value of the Air mass am , set
to h
θsin1 , and the Linke turbidity coefficient, which may vary according to the site and the season
of the year, but for sake of simplicity has been set constant and equal to 3, considering this last as an
average value commonly used.
As concerns the paramenter CDA
δ a number of expressions may be used. Among these, that
proposed by Kasten was chosen, which is valid in a wide interval of am :

SunSim Storage – User Manual – 16/08/2016
18
amCDA ⋅+
=9,04,9
1δ
Calculation of the diffuse solar radiation
The calculation of the diffuse solar radiation on the PV array plane D
I takes into account the
inclination β of the PV array with respect to the horizontal plane and uses the expression:
2
cos10
β+⋅=
DDII
Annex C
Structure of the file loads.txt The file loads.txt allows a rather flexible management of the electric consumption data, because it
is able to host both simple tables and very detailed tables, containing data collected with a high
frequency.
The main characteristics of the tables contained in loads.txt are reported here below.
− The file may contain up to 10 types of loads (tables), also with different formats. The integer
number in the first line (Number of loads) specify the number of loads.
− Each type of loads has its own name, to be typed without spaces, (Load name) with a
maximum of 45 characters.
− Data may be monthly, where for each month there is a record of data referred to the average
day, or alternatively may be daily, where it is necessary to introduce 365 records of data,
one for each day of the year. A proper value in the header of each table specify if data are to
be considered:
− Monthly, in this case type 0 (=0 � Monthly data)
− Daily, in this case type 1 (=1 � Daily data)
− In case of daily data, each month is considered as composed by the corresponding number of
days in a year of 365 days (28 days for February).
− As previously indicated, the difference between monthly and daily data is in the fact that
monthly data consider that the trends of load consumptions are the same in all days of the
same month, while the daily data are different for each day of the year. In other words, in
case of monthly data we have 12 records of hourly or intra-hourly data, while in case of
daily data we have 365 records for the same data.
− In all cases, at the beginning of the data of each month, a number indicates the reference
month (Month), between 1 (January) and 12 (December).
− The minimum frequency of the daily data is hourly (24 values for each day), but the
program is able to accept frequencies also further, provide they correspond to a multiple of 5
minutes in each hour. The maximum number correspond to the time interval used in
calculation, equal to 5 minutes, that is 12 data each hour. A suitable integer value in tables,
between 1 and 12 (Number of data per hour), provided is a submultiple of 12 (i.e. 60/5),
specify the number of data per hour. For sake of clarity, here below a list is reported with the
number of consumption data for each day that SunSim Storage needs to read according to
the value previously set.
− 1 � 24 daily values (1 data every hour)
− 2 � 48 daily values (1 data every half hour)

SunSim Storage – User Manual – 16/08/2016
19
− 3 � 72 daily values (1 data every 20 minutes)
− 4 � 96 daily values (1 data every 15 minutes)
− 6 � 144 daily values (1 data every 10 minutes)
− 12 � 288 daily values (1 data every 5 minutes)
− Consumption data contained in the tables are expressed in kW (that is the average power
value in the period) with a free number of decimals.
The next figure visually shows a portion of the file loads.txt, highlighting the structure. It is
important that the organization and the number of data actually inserted be consistent with the
values indicted in the fields above specified. If not, the program reports the error and cannot
perform calculations correctly.

SunSim Storage – User Manual – 16/08/2016
20