sun after storm a case study on pudong coffee shop dream chasers sun yat-sen university manager:liu...
TRANSCRIPT

Sun after storm
A Case Study on Pudong Coffee Shop
Dream ChasersSun Yat-sen UniversityManager: LIU MengningConsultants: ZHANG Wei
HUANG PeilongPENG Weijian

Outline
Goal: To help Pudong Coffee Shop weather the STORM.Goal: To help Pudong Coffee Shop weather the STORM.
A. Case OverviewA. Case Overview
• D1 Learning & Growth • D1 Learning & Growth
• D2 Internal Process Perspective• D2 Internal Process Perspective
• B1 A STORM Framework• B1 A STORM Framework
• D3 Customer Perspective • D3 Customer Perspective
• D4 Financial Perspective • D4 Financial Perspective
B. Current Situation AnalysisB. Current Situation Analysis
C. Strategy AnalysisC. Strategy Analysis
D. Utilization & ImplementationD. Utilization & Implementation
E. Net Cash Flow Forecast E. Net Cash Flow Forecast
• C1 Strategy Positioning• C1 Strategy Positioning
• C2 Strategy Map • C2 Strategy Map
• A1 Storm before Sun• A1 Storm before Sun
BSC
BSC
• E1 Income and Cash Flow Forecast• E1 Income and Cash Flow Forecast
• E2 Break-even Point• E2 Break-even Point
• E3 Overall Valuation• E3 Overall Valuation

Current Situation Analysis
Strategy Analysis
Case Overview
Utilization & Implementation
Net Cash Flow Forecast
A1 Case overview
Strategy Analysis
Utilization &Implementation
Net Income Forecast
Strategy Analysis
Utilization &Implementation
Net Income Forecast
Social Conditions
Technical Conditions
Organizational Conditions
Revenue Conditions
Market Conditions
Social Conditions
Technical Conditions
Organizational Conditions
Revenue Conditions
Market Conditions
A STORM Framework Analysis A STORM Framework Analysis
A SUN Solution A SUN Solution

B1 Social Conditions
Strategy Analysis
Current Situation Analysis
Utilization & Implementation
Case Overview STORM FrameworkSTORM Framework
Industry Retrospect: Growing Coffee Consuming in China
Broad Prospect: Coffee: A symbol of fashion, elegance and noble
Huge gap in the market: Chinese: 3 cups per year American: 500 to 700 cups per year
Coffee has a blooming future in China.Coffee has a blooming future in China.
Net Cash Flow Forecast

B1 Technical Conditions
Strategy Analysis
Current Situation Analysis
Utilization & Implementation
Case Overview STORM FrameworkSTORM Framework
Common
Satisfied
Comfortable
Joyful
Invalid
Bad
Awful
12 3
4
5
9
7
8
6
1.Wonderful environment
2.Warm welcome
3.Decoration
4.Less flavor and background music
5.Little waiting time
Higher price
Positive feelings
Negative feelings
7. A variety of coffee
8. Employees, who are friendly , familiar with coffee and professional in service
9.Long time waiting for coffee
1010.Taste and appearance
11
11.Relax and watch the world go by
12
12.magazines
13
Customer Experience Flow- Process of Pudong Coffee ShopCustomer Experience Flow- Process of Pudong Coffee Shop
Net Cash Flow Forecast

B1 Organizational Conditions
Strategy Analysis
Current Situation Analysis
Utilization & Implementation
Case Overview STORM FrameworkSTORM Framework
Training and development of employee are urgent.Training and development of employee are urgent.
FatherFather
SonSon
Full-timeEmployeesFull-time
EmployeesPart-time
EmployeesPart-time
Employees2 Persons
• Company Structure • Current situation
• No training for the employees.• No adequate performance evaluation.
•Owned the coffee shop
•Managed the shop without salary and bonus from it
Net Cash Flow Forecast

Average expense of each customer
Accessible
Time of ConsumptionAgeOccupations
1.Professionals2.International students3.Residents
Average quantity of customers every day
RMB 50
About 50
Lunch-time is the busiest period.
Young customers are the majority
Strategy Analysis
Current Situation Analysis
Utilization & Implementation
Case Overview STORM Framework
B1 Market Conditions – Customer Characters
Target MarketTarget Market
Net Cash Flow Forecast

GE Matrix of Judging Criteria
Sustained advantages Region
high
highlow
low
Customers’ satisfactionOf Pudong Coffee Shop
Importance of the criteria
Needed improvement Region
3
8
2
9
14
6
7
5
Judging Criteria for Coffee Shops(not listed in order of importance)
1. Beverages/food provided must be of good quality2. Décor, temperature and noise levels3. Free WiFi4. Friendly staff5. Excellent customer service6. Presentation of food and food offering7. Cleanliness and overall hygiene8. Availability of space9. Overall value for money
Strategy Analysis
Current Situation Analysis
Utilization & Implementation
Case Overview STORM Framework
Certain attention should be paid to Free Wifi, Cleanliness and overall hygiene, & Presentation of food offering.
Certain attention should be paid to Free Wifi, Cleanliness and overall hygiene, & Presentation of food offering.
B1 Market Conditions – Service Evaluation
Net Cash Flow Forecast
Strategy Analysis
Current Situation Analysis
Utilization & Implementation
Case Overview STORM Framework
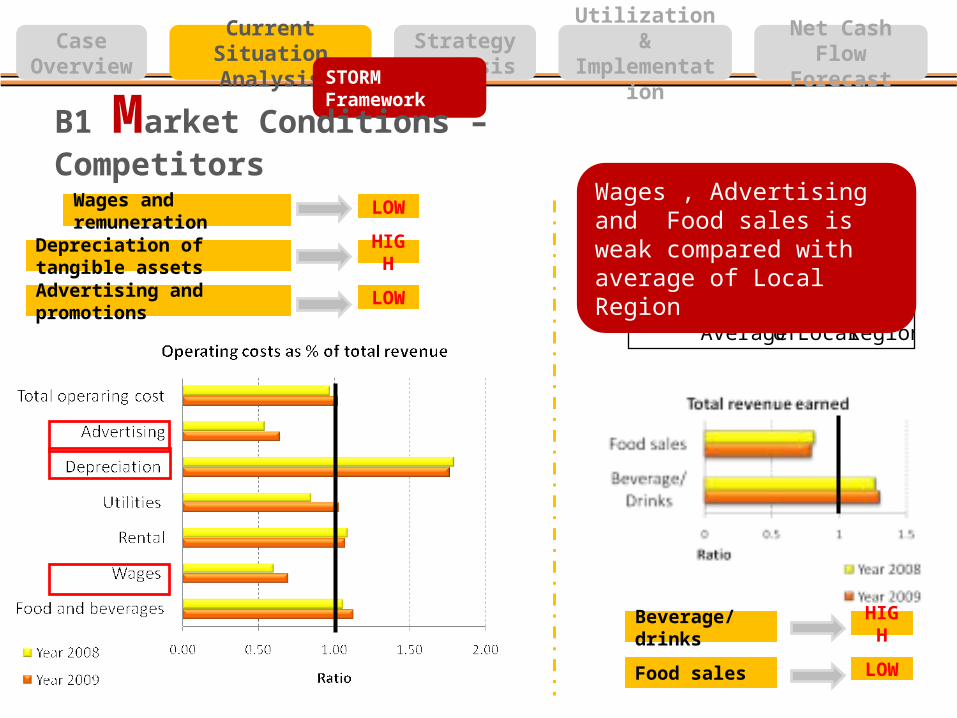
Wages and remuneration
Depreciation of tangible assets
Advertising and promotions
LOW
LOW
HIGH
Region Local of Average
Shop Coffee PudongRatio
LOW
HIGHBeverage/drinks
Food sales
Wages , Advertising and Food sales is weak compared with average of Local Region
B1 Market Conditions – Competitors
Net Cash Flow Forecast

Liquidity
Profitability
Solvency
▪ 1.225▪ 1.026▪ 43000
▪ 1.169▪ 0.957▪ 35000
▪ Current ratio▪ Quick ratio▪ Net working capital
▪ Inventory turnover▪ Asset turnover
▪ 20.464▪ 0.951
▪ 10.244▪ 1.047
Ratio Year 2008 Year 2009
▪ Times interest earned▪ Debt service coverage
▪ 2.125▪ 0.61
▪ 0.422▪ 0.1
▪ 0.035▪ 0.575▪ 0.034▪ 0.075
▪ Net profit margin▪ Gross margin▪ ROA▪ ROE
▪ -0.015▪ 0.548▪ -0.015▪ -0.033
Activity
Analysis
▪ Inventory turns over at fairly high rate
▪ Current ration and quick ratio are near 1
▪ Has adequate net working capital
▪ Made small profit in 2008, but net loss in 2009
▪ Decreased profitability
▪ Interest payment was quite large compared with net income
Good
Good
Poor
Poor
B1 Revenue Conditions
Strategy Analysis
Current Situation Analysis
Utilization & Implementation
Case Overview STORM Framework
Net Cash Flow Forecast
Financial Situation: Poor profitability but good liquidity.

IntratypeIntratype
IntertypeIntertype
C1 Strategy Positioning
Utilization & Implementation
Case Overview
Current Situation Analysis
Strategy Analysis
Starbucks
UCC
Pudong Coffee
Others
Italian-style restaurant
Ice-cream Café
In the intertype, Pudong Coffee Shop has to compete with various coffee shop. Thus, Pudong Coffee Shop should cut down its cost to jostle for the similar demanders.
In the intratype, Pudong Coffee Shop has to satisfy the local customers. Thus, to compete with other local family-owned cafes, Pudong must find its own features
Cost Leadership Differentiation
Enhance ProfitabilityEnhance Profitability
Net Cash Flow Forecast
FOCUS STRATEGY

Utilization & Implementation
Case Overview
Current Situation Analysis
Strategy Analysis
Financial Perspective
Customer Perspective
InternalPerspective
Learning & GrowthPerspective
Balance Gross Margin Rate
Boost Sales Growth
Enhance Asset Utilization
Retain Customer
Loyalty
Enhance Service Level
Enhance Customer
Satisfaction
Budgeting Control
Adjust Employee Structure
Improve Employee Competence
Enhance Employee Satisfaction
Increase Labor Productivity
Continuous Improvement of Internal Process
Boost Market Shares
Wider Product Range
Use Balance Scorecard to Implement the strategyC2 Strategy Map
Enhance Profitability
Cost LeadershipDifferentiation
Net Cash Flow Forecast

Measure Level KSF Indicators Actual Average in Industry Target*
Finance
Gross Margin RateBeverages/Drinks 28.5% 21.9% 22%
Food sales 26.3% 32.9% 33%
Sales Growth Sales Change from Prior Year 1.6% 5% 5%
Adverting Intensity 3.2% 5% 4.8%
Customer
Customer Value Revenue Per Customer 5- 43.2 50
Satisfaction Satisfaction Survey >90% 87.2% 95%
Market Shares Revenue/Total Consumption in the Local 33.3% 33.3% 43%
OperationBudgeting control
Utilities as % of Total Revenue 5.2% 5% 5%
Utilities change from prior year 23.1% 15% 15%
Service Required Revenue of take-away/total >1% N/A 10%
Learning &Development
Employee Structure Part-time staff/full-time 4 N/A 4
Employee Competence Revenue/per employee 232,500 N/A 320,000
Employee Satisfaction Satisfaction Survey >80% N/A 90%
Strategy Analysis
Case Overview
Current Situation Analysis
Utilization & Implementation
Utilization & Implementation
To transfer KSF into targets using Benchmarking ApproachTo transfer KSF into targets using Benchmarking Approach
Net Cash Flow Forecast

D1 Learning and Growth Perspective – Action Plan
Strategy Analysis
Case Overview
Current Situation Analysis
Utilization & Implementation
1.SalaryBasic Wage:2700Use the Proportionate Commission related to every customer serviced (3%)
2.Work HoursFull-time employees: 8h is required.Arrange them to 2 shifts:
Part-time employees: 6.5h is required. Arrange them to 4 shifts:
Employee training planTrain employees for at least 10 hours per month and invest ¥ 300 per month.
Performances recordingRank the performance results and give the best one 10% bonus
Improve Employee CompetenceImprove Employee CompetenceEnhance Employee SatisfactionEnhance Employee Satisfaction
To employ one more full-time employee Keep the current structure
Adjust Employee StructureAdjust Employee Structure
Net Cash Flow Forecast
Morning 8:00---12:30
Noon 12:30---14:30
Afternoon 14:30----18:30
Evening 18:30----21:00
8:00---16:00
14:00---21:00

D2 Internal Process Perspective - Action Plan
Strategy Analysis
Case Overview
Current Situation Analysis
Utilization & Implementation
Save Utility
Utilities as % of Total Revenue:
Utilities change from prior year:
Boost Take-away Rates
• Redesign layoutsadditional expense of ¥ 3000
• Bio-material and lower-wattage bulbs
• Energy-saving idea
• Personal responsibility system
• Encourage Take-away Service • Reduce Customers’ Waiting Time
Check the waiting time though observing
• Provide Take-away Service to Passers-bySet an employee particularlyIn the morning (8:00-9:00)
Take-away Rate:
Service required
Budgeting Control
Purpose Targets Action
Net Cash Flow Forecast
5.2%5.0%
23.1%15%
<1%>10%

Enhance Customer Satisfaction
Strategy Analysis
D3 Customer Perspective - Action Plan
Net Cash Flow Forecast
Case Overview
Current Situation Analysis
Utilization & Implementation
Found a member club
Develop campus agent at the cost of ¥ 300 per month
Set ¥ 1000 to hold coffee culture competition once a year
5% off for old patrons’ bringing new customer.
Provide light music
Do customer satisfaction survey of 200 samples every 3 month
Decorate the walls and bar counter with ¥ 2000 to ¥ 3000
Customer retention and absorption
Boost Market Shares Enhance Profitability
Develop 3 new types of coffee flavor every 6 month
Provide 3 special offers every week

Strategy Analysis
D4 Financial Perspective
Net Cash Flow Forecast
Case Overview
Current Situation Analysis
Utilization & Implementation
Balance Gross Margin Rate
Beverages/Drinks
Decrease the drinks’ price lightly to 3% to expend its sales. Pay attention to the invest, develop 5-7 different types of blend coffee Encourage take-away service with the budget of ¥ 2000 for packaging
Food salesIncrease the price to 5% Develop 3 types of coffee every 6 monthsEnhance the variety of breakfast, add 3-4 kinds of food
Boost Sales Growth
Sales Change from Prior Year
Consider all aspects when starting a renovation
Advertisement and promotions
as % of Total Revenue
Increase invest in marketing promotion and advertising to 4.8% Irregular preferential price with 20% off
Enhance Asset Utilization
Depreciation of tangible assets
Keep the depreciation rate
Enhance ProfitabilityEnhance Profitability
E1 Forecast Income Statement for year ended: 31st December
2010 31st December
2009 31st December
2008
¥ ¥ ¥ Revenue (beverages/drinks) 427,800 485,000 465,000 Revenue (food sales ) 641,700 445,000 450,000 Total revenue (food and beverages) 1,069,500 930,000 915,000 Cost of sales (441,000) (420,000) (389,000)Gross profit 628,500 510,000 526,000 Less Operating expenses: Depreciation of tangible assets (82,000) (82,000) (82,000) Wages and remuneration (155,520) (130,000) (110,000) Rental (200,000) (200,000) (200,000) Utilities (lighting and heating etc.) (53,475) (48,000) (39,000) Garbage collection (11,100) (10,000) (9,000) Advertising and promotions (51,336) (30,000) (25,000) General and administrative expense(training and development) (14,400) 0 0
Total operating expenses (567,831) (500,000) (465,000)Operating profit for year 60,669 10,000 61,000 Interest payable on loans (18,368.7) (23,710) (28,700)
Profit (loss) for year 42,300.3 (13,710) 32,300
Strategy Analysis
Utilization & Implementation
Case Overview
Current Situation Analysis
With all the implementation mentioned above, Pudong Coffee Shop will have promising net income in 2010With all the implementation mentioned above, Pudong Coffee Shop will have promising net income in 2010
Net Cash Flow Forecast
The forecast of these accounts is based on the assumption Li has made for 2010, and other accounts are predicted based on the set targets mentioned before.
The forecast of these accounts is based on the assumption Li has made for 2010, and other accounts are predicted based on the set targets mentioned before.
E1 Forecast Balance Sheet
31st December 2010
31st December 2009
31st December 2008
¥ ¥ ¥
Goodwill 400000.00 400000.00 400000.00
Furniture and fittings (net) 164000.00 246000.00 328000.00
Inventories 42100.00 44000.00 38000.00
Cash at bank 227700.00 198000.00 196000.00
Total assets 833800.00 888000.00 962000.00
Owner’s equity 460890.30 418590.00 432300.00
Bank loan payable 180778.70 262410.00 338700.00
Trade payables 192131.00 207000.00 191000.00
Total liabilities and owner’s equity 833800.00 888000.00 962000.00
With the increasing profitability, total assets and owners’ equity will enlarge fast, especially after 2012 when depreciation of tangible asserts finishedWith the increasing profitability, total assets and owners’ equity will enlarge fast, especially after 2012 when depreciation of tangible asserts finished
The forecast of these accounts is based on the assumption Li has made for 2010.The forecast of these accounts is based on the assumption Li has made for 2010.
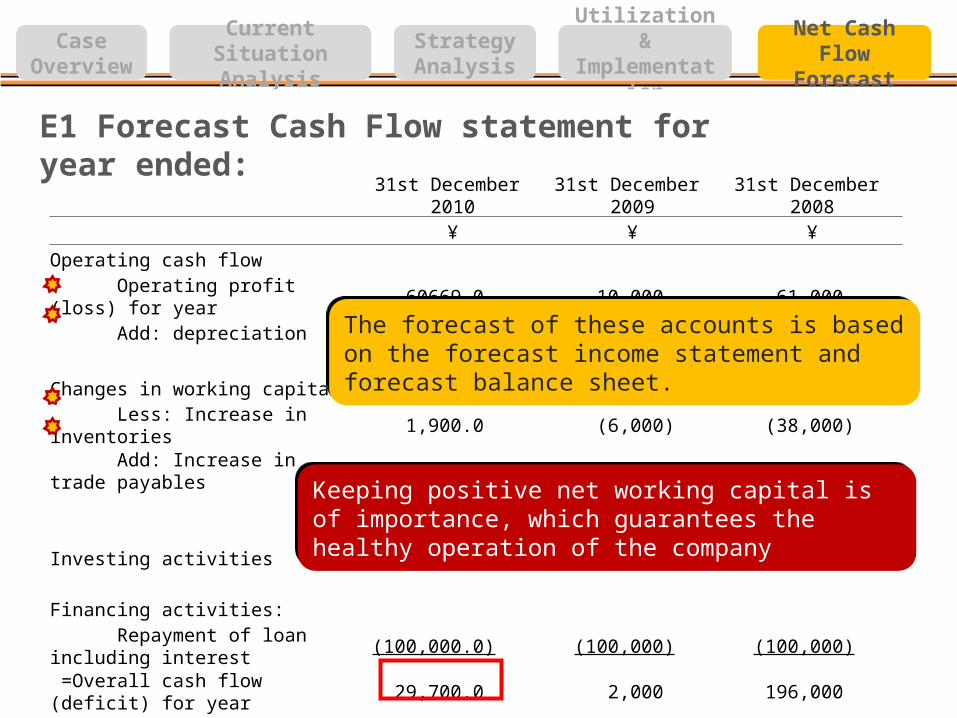
E1 Forecast Cash Flow statement for year ended: 31st December
201031st December
200931st December
2008 ¥ ¥ ¥
Operating cash flow Operating profit (loss) for year 60669.0 10,000 61,000 Add: depreciation 82,000.0 82,000 82,000
142,669.0 92,000 143,000 Changes in working capital: Less: Increase in inventories 1,900.0 (6,000) (38,000) Add: Increase in trade payables (14,869.0) 16,000 191,000
111,331.3 102,000 296,000
Investing activities Nil Nil Nil
Financing activities: Repayment of loan including interest (100,000.0) (100,000) (100,000) =Overall cash flow (deficit) for year 29,700.0 2,000 196,000 Add: Opening bank balance 198,000.0 196,000 Nil
Equals: Closing bank balance 227,700.0 198,000 196,000
Keeping positive net working capital is of importance, which guarantees the healthy operation of the companyKeeping positive net working capital is of importance, which guarantees the healthy operation of the company
The forecast of these accounts is based on the forecast income statement and forecast balance sheet.The forecast of these accounts is based on the forecast income statement and forecast balance sheet.

Strategy Analysis
Utilization & Implementation
Case Overview
Current Situation Analysis
E2 Break-even Point Analysis
Net Cash Flow Forecast
Cost Behavior Analysis
Fixed cost: Depreciation, Rental, Utilities and Ad & PromotionsVariable cost: Cost of sales, Garbage collectionMix cost: Wages and remuneration,
Assumption: Unit cost 35 yuan(According to the case, The average cost of a cup of coffee in these international chains amounts to between Yuan 30 and 40.)Thus, sales volume should be counted as :The Year 2008: Sales Volume= ¥ 915,000÷35= ¥ 11,114.27The Year 2009: Sales Volume= ¥ 930,000÷35= ¥ 12,000.00
Assumption: Labor Equivalent : 1 part-time = 0.5 full-time
• In the year 2009, half of the sales volume comes from part-time employees, and the other half comes from part-time ones.•Half of the wages and remuneration is fixed cost. The graph of cost behavior of wages and remuneration is shown below:
The formula of wages and remuneration :
BEx= TFC/(p-VC)Based on the assumption and the analysis above ,we can calculate:
Total Fix cost(TFC)=82,000+65,000+200,000+48,000+30,000= ¥ 425,000 Break-even Sales Volume(BEx)=425,000.00/(50-35)= ¥ 28,333
Total Fix Cost(TFC)=82,000+65,000×1.2+20,000+53,475+51,336+14,400= ¥ 479,211
Break-even Sales Volume(BEx)=479,211/(50×1.05-35)=27,383
Year 2009
Year 2010

E3 Overall Valuation of Pudong Coffee Shop
Assumption: Assumption: 1. Free from going concern;1. Free from going concern;2. Run at the same growth rate of 2010 in the next five years.2. Run at the same growth rate of 2010 in the next five years.
Strategy Analysis
Utilization & Implementation
Case Overview
Current Situation Analysis
Net Cash Flow Forecast
Period Net Cash Flow Discounted Rate
• n=5 Make forecast cash flow statement in the next five years.
Choose the interest rate of long-term bank loan 7% as the discounted rate.

Strategy Analysis
Utilization & Implementation
Case Overview
Current Situation Analysis
Net Cash Flow Forecast
E3 Forecast Income Statement for the Next Five Years Year 2010 2011 2012 2013 2014
¥ ¥ ¥ ¥ ¥
Revenue (beverages/drinks) 427800 491970 565766 650630 748225
Revenue (food sales ) 641700 737955 848648 975945 1122337
Total revenue (food and beverages) 1069500 1229925 1414414 1626576 1870562
Cost of sales (441000) (463050) (486203) (510513) (536038)
Gross profit 628500 766875 928211 1116063 1334524
Less Operating expenses:
Depreciation of tangible assets (82000) (82000) (82000) 0 0
Wages and remuneration (155520) (189734) (235271) (296441) (374112)
Rental (200000) (200000) (200000) (200000) (200000)
Utilities (lighting and heating etc.) (53475) (61496) (70721) (81329) (93528)
Garbage collection (11100) (12321) (13676) (15181) (16851)
Advertising and promotions (51336) (61496) (70721) (81329) (93528)
General and adminstrative expense (14400) (16560) (19044) (21901) (25186)
Total operating expenses (567831) (623608) (691432) (696180) (803205)
Operating profit for year 60669 143267 236779 419883 531319
Interest payable on loans (18369) (12655) (6557) 0 0
Profit (loss) for year 42300 130613 230222 419883 531319
Increasing total revenue and profit.Increasing total revenue and profit.
E3 Forecast Balance Sheet for the Next Five Years
Year 2010 2011 2012 2013 2014
¥ ¥ ¥ ¥ ¥
Goodwill 400000 400000 400000 400000 400000
Furniture and fittings (net) 164000 82000 0 0 0
Inventories 42100 48339 50756 58370 70044
Cash at bank 227700 368978 565449 1012969 1544100
Total assets 833800 899317 1016206 1471339 2014144
Owner’s equity 460890 591503 821725 1241608 1772927
Bank loan payable 180779 93433 0 0 0
Trade payables 192131 214381 194481 229731 241217
Total liabilities and owner’s equity
833800 899317 1016206 1471339 2014144
Total assets rapidly increase as well as the owner’s equity.Total assets rapidly increase as well as the owner’s equity.
E3 Forecast Cash Flow Statement for the Next Five Years
2010 2011 2012 2013 2014
¥ ¥ ¥ ¥ ¥
Operating cash flow
Operating profit (loss) for year 60,669 143,267 236,779 419,883 531,319
Add: depreciation 82,000 82,000 0 0 0
142,669 225,267 236,779 419,883 531,319
Changes in working capital:
Less: Increase in inventories 1,900 (6,239) (2,417) (7,613) (11,674)
Add: Increase in trade payables (14,869) 22,250 (19,900) 35,250 11,487
129,700 241,277 214,462 447,519 531,132
Investing activities Nil Nil Nil Nil Nil
Financing activities:
Repayment of loan including interest (100,000) (100,000) (100,000) 0 0
=Overall cash flow (deficit) for year 29,700 141,277 114,462 447,519 531,132 Satisfying cash flow for the next five years.Satisfying cash flow for the next five years.

2009¥
2010¥ 29700
2011¥ 13429
8
2012¥ 243277
2013¥ 476569
2014¥ 612014
1/(1+7%)-1
1/(1+7%)-2
1/(1+7%)-3
1/(1+7%)-4
1/(1+7%)-5
¥ 27,757
¥ 117,301
¥ 198,586
¥ 363,572
¥ 436,357
Total PV: ¥ 1,143,574
E3 Overall Valuation of Pudong Coffee Shop
NPV= ¥ 1143574Though the shop experience a financial storm this year, it has a profitable future.
NPV= ¥ 1143574Though the shop experience a financial storm this year, it has a profitable future.
Strategy Analysis
Utilization & Implementation
Case Overview
Current Situation Analysis
Net Cash Flow Forecast

Uncertainty
New Entrants in the local region Mitigation:Use CRM system to enhance customer loyalty
Increasing Price of the Materials Mitigation:Develop new non-coco products
Rapid InflationMitigation:Increase the price
Strategy Analysis
Utilization & Implementation
Case Overview
Net Cash Flow Forecast
Current Situation Analysis

Summary A STORM framework Analysis
A SUN Solution
A. Case OverviewA. Case Overview
B. Current Situation AnalysisB. Current Situation Analysis
C. Strategy AnalysisC. Strategy Analysis
D. Utilization & ImplementationD. Utilization & Implementation
E. Net Cash Flow Forecast E. Net Cash Flow Forecast
Social Conditions
Technical Conditions
Organizational Conditions
Revenue Conditions
Market Conditions
Social Conditions
Technical Conditions
Organizational Conditions
Revenue Conditions
Market Conditions
Learning &Growth Perspective
Internal Process Perspective
Customer Perspective
Financial Perspective
Learning &Growth Perspective
Internal Process Perspective
Customer Perspective
Financial Perspective
Management Accounting Approaches such as Benchmarking and Balance Scorecard are applied to help Pudong Coffee Shop go from storm to sun.Management Accounting Approaches such as Benchmarking and Balance Scorecard are applied to help Pudong Coffee Shop go from storm to sun.

Thank You for Your Time!
Dream ChasersSun Yat-sen University