summer / Été 1986 vol. 8 no. 3 - cmosarchives.cacmosarchives.ca/chinook/ch0803.pdfcover cool air...
TRANSCRIPT


Learning Weather A resource study kit, contains:
1. Mapping Weather A series of maps with exercises. Teaches how weather moves. Includes climatic data for 50 Canadian locations.
2. Knowing Weather Booklet discusses weather events, weather facts and folklore, measurement of weather and several student projects to study weather.
3. Knowing Clouds A cloud chart to help students identify various cloud formations.
Cat. No. EN56-53/1983·E Each kit $4.95
Order kits from: CANADIAN GOVERNMENT PUBLISHING CENTRE OTTAWA, CANADA, K1A OS9
Order Form (please print) Please send me __ copy(ies) of Learning Weal her at $ 4.95 per copy. TOTAL $ . Cat. No.: EN56·53/1983E.
Name
School
Address Ci ty
Province Postal Code
o Account No, o Enclosed $
o Visa 11111111 1111111 o Master Card
Expiry Date Bank
Signature
Orders prepaid by pos tal money o rder or cheque must be made to the order o f the Receiver General '0( Canada and addressed 10 the Canadian Govern ment Publishing Centre, O ttawa (Canada) K1 A 059. Also available through au thorized books tore agen ts o r your local bookseller Add 20% to prices for books 10 be shipped out side Canada, Payable in Canadian fund s
Ega/ament disponible en fram;ais : "Oecouvrons la me/eo" W de cal : EN56·53/1983F.
••
Learning Weather • • • A resource study kit suitable for students grade seven and up, prepared by the Atmospheric Environment SelVice of Environment Canada - - - - - ------ - --- - -Includes new revised poster·size cloud chart
Decouvrons la meteO ... Pochettes destinees aux eleves du secondaire et du collegial, preparees par Ie selVice de I'environnement atmos hen ue d'Environnement Canada Incluant un tableau revise descriptif des nuages
Oecouvrons la meteo Pochette documentaire comprenant:
1. Cartographie de la meteo Serie de cartes accompagnees d'exercices. Oecrit les fluctuations du temps et fournit des donnees climatologiques pour 50 localites canadiennes.
2. Apprenons iI connaitre la meteo Brochure traitant d'evenements, de faits et de legendes meteorologiques. Techniques de I'observation et de la prevision de la meteo. Projets scolaires sur la meteorologie.
3. Apprenons iI connailre les nuages Tableau descriptif des nuages aidant les elEwes iI identifier differentes formations.
Cal. N° EN56-5311983F Chaque pochelte: 4,95 $
Commandez les pochettes au : CENTRE D'EDITION DU GOUVERNEMENT DU CANADA OTTAWA (CANADA) K1A OS9
Bon de commande Veuillez m'expedier __ exem plaire(s) de la pochette " Decouvrons la meteo" a 4,95 $ la copie. N° de cat. EN56-53/1983F. Nom
Adresse
Vil le
Prov in ce Code pos tal
o Ci ·loint $
1lllllnrntHII-f-1 -o Visa
o Master Card
Date d'expiration
Banque
Signature Les commandes sont payables a I'avance par cheque ou mandaI fal l a r Ofdre du Aeceveur general du Canada el dOiven t eire adressees au Centre d'edll ion du gouvernemen t du Canada. Onawa (Canada) K1 AOS9 En vent e aussi chez les agents librai res agrees OU chez volfe librai re
Te lephone (B19) 997·2560 Te lex 053·4296
Also available in English: " Learning Weather" Cal No EN56-5311983E
Canada

COVER
Cool air behind a cold front has resulted in the development of fair weather cumulus clouds whose vertical growth is restricted by a subsidence inversion. Because ofthe strong northwesterly flow the cloud elements are aligned and form a pattern of lines that are often referred to as cloud streets. The photo-graph was taken during the early fall near the Frenchman's Bay area on Lake Ontario, east of Toronto, at about two o'clock in the afternoon.
COUVERTURE
L'air frais a l'arriere d'un front froid en-traine la formation de Cumulus de beau temps dont Ie developpement vertical est restreint par une inversion de subsidence. Les forts vents du nord-ouest causent l'aligne-ment des nuages; cette configuration en lignes est souvent appeIee «rue de nuages ».
La photo fut prise tot a l'automne, a l'est de Toronto, pres de Frenchman's Bay vers 14 h.
Some back issues of Chinook are no longer available and are now collectors' items (Vol. 1, nos. 1 & 2; Vol. 3, no. 1), but you can still obtain copies of the remaining issues at the original price of $1 .50 each.
Not a collector? Then do your friends a favour and pass your copies along to them. You'll give them some good reading and you may help create a subscription for us.
Certains numeros du Chinook, maintenant epuises, sont des pieces de collection (vol. 1, nOs 1 et 2; vol. 3, nO 1), mais vous pouvez encore vous procurer des exemplaires des numeros restants au prix unitaire d'origine de 1,50 $.
Vous n'etes pas collectionneur? Vous pouvez rendre un service a un ami en lui donnant vos exemplaires. Ainsi, vous lui offrirez de la lecture interessante et contribuerez peutetre a nous obtenir un nouvel abonne.
Contributions, enquiries, comments and suggestions from readers are welcome. They should be addressed to: Edftor, Chinook, Suite 805, 151 Slater Street, Ottawa, Ont. K1 P 5H3.
KEEPING ON TOP OF THE WEATHER By Philip Chadwick
Summer/Ete 1986
FATALITIES DUE TO A TORNADIC WATERSPOUT By Michael J. Newark WEATHER AND THE CONTROL OF PLANT DISEASES
Vol. 8
By William J. Blackburn, Andrew Bootsma and Terry J. Gillespie PROFESSOR KINGSTON'S SCHEME: FOUNDING
No.3 44
46
48
THE METEOROLOGICAL SERVICE 51 By Morley Thomas THE WINTER OF 1985-86 56 By Andy Radomski CRITIQUE 58 PRESENTATION D'ARTICLES POUR LE CHINOOK A L'INTENTION DES AUTEURS 58 PROFESSIONAL AND BUSINESS DIRECTORY
EDITORIAL BOARD I CONSEIL DE REDACTION
Frank A. Boddy Ontario Association for Geographic
and Environmental Education Inc. Barrie, Ontario
Howard Freeland Institute of Ocean Sciences Sidney, British Columbia
Barry Grace Agriculture Canada Research Branch Lethbridge, Alberta
Yves Gratton Universite du Quebec a Rimouski Rimouski, Quebec
Richard Leduc Ministere de l'environnement Quebec, Quebec John W. Loder Bedford Institute of Oceanography Dartmouth, Nova Scotia John Maybank Saskatchewan Research Council Saskatoon, Saskatchewan Hans VanLeeuwen (Chairman) Atmospheric Environment Service Downsview, Ontario
EDITOR Hans Vanleeuwen REDACTEUR TECHNICAL EDITOR Edward J Truhlar REDACTION TECHNIQUE
BUSINESS MANAGER J. Carr Mcleod GESTIONNAIRE ART WORK Bill Kiely and Joan Badger IllUSTRATION
TRANSLATION Joanne Gagnon TRADUCTION FOUNDER AND EDITOR 1978-1964 Michael J Newark FONDATEUR EDITEUR 1978-1964
ISSN 0705-4572
Published by: Publie par:
59
Canadian Meleorological and Oceanographic Society la Societe canadienne de meteorologie et d'oceanographie
Printed and produced in Canada and published quarterly by Ihe Canadian Meteorological and Oceanographic Society, Suite 805, 151 Slater Sireet, Ottawa, Ont. Kl P 5H3 Annual subscriplion rates are $10 00 for CMOS members, $12.00 for non·members and $15.00 for institutions Contents copyright © Ihe aulhors 1986. Copying done for other than personal or internal reference use without the expressed permission of Ihe CMOS is prohibited All correspondence including requests for special permission or bulk orders should be addressed to Chinook at the above address.
Second Class Mail Registration No. 4508 Summer 1986 Date of issue - September 1986
Edite et imp rime au Canada Chinook esl publie tous les trois mois par la Societe canadienne de meteorologie et d'oceanographie, Suite 805, 151, rue Slater, Ottawa (Ontario) Kl P 5H3. Les frais d'abonnement annuel sont de 10,00$ pour les membres de la SCMO. de 12.00$ pour les non-membres el de 15,00 $ pour les instilutions Les auteurs detiennenl Ie droit exclusif d'exploiter leur oeuvre lilteraire (© 1986) T oute reproduction, sauf pour usage personne� au consultation interne. est interdite sans la permission explicite de la SCMO Toute correspondance doit etre envoyee au Chinook II I'adresse ci-dessus, y compris les demandes de permission speciale et les commandes en gros.
Courrier de deuxieme classe - enregislrement nO 4508 Ete 1986 Date de parution - septembre 1986
43

KEEPING ON TOP OF THE WEATHER
A picture is worth "a thousand words" and it's a good thing! This article has room for two excellent satellite images and about 900 words. Simple addition gives a total of nearly 3000 words. This should be sufficient to highlight the interesting meteorology as viewed by the satellite during the late afternoon of November 20,1985.
The images in question were ob-served by a polar-orbiting satellite and are centred over the Great Lakes. At the relatively low altitude of 850 km, the satellite orbits from pole to pole while scanning the underlying atmosphere and terrain. Images exhibiting excel-lent detail and clarity are produced.
On this particular November day, a vigorous cold front swept across the Great Lakes to lie just south of Lake Ontario by image time. A cold and relatively dry Arctic air mass flooded across the lakes in the wake of the front. Daytime temperatures ranged from -10 to -15°C which was about 15°C below seasonable normals. In addition the Arctic air mass was relatively stable with light winds near the surface. The wind speed increased rapidly above the surface to west-southwesterly winds of 40 to 50 knots between 900 and 1500 metres above sea-level. These physical characteristics of the situation created a very striking cloud pattern as shown in the imagery.
The satellite imagery reveals a large swath of stratocumulus forming over Lake Michigan. The southern and nor-thern edges of the cloud align perfectly with the mean wind direction through the cloud layer. The edges are very
by Philip Chadwick
sharp and may be traced upwind to the southern and northern extremities of Lake Michigan. The convergence of these cloud edges reveals convergence in the strong west-southwesterly flow. This fact is confirmed in the appropriate analysis of winds at the upper levels.
The leading edge of the cloud swath begins over Lake Michigan, the ulti-mate culprit! The cold relatively dry air as seen over Wisconsin passes over the warm water surface with temperatures ranging from 6 to 8°C. Immediately, the Arctic air draws heat and moisture into its lowest levels. More than one half of the total modification that results oc-curs within the first 10 minutes over the water surface. After the modification process is complete, the temperature of the air has climbed approximately 6 degrees and the relative humidity has increased from 50-60% to more than 75%. The result is that warm, moist parcels of air rise buoyantly in the cold Arctic air to form cloud which is confined to the lowest levels of the atmosphere. This cloud is sculpted by the wind field in the layer.
The internal cloud structure is as interesting as the large-scale cloud shape. As the clouds build vertically, they are aligned into cloud streets parallel to the wind direction. The vertical velocity field about one cloud street interacts with the adjacent streets. The net result is an array of parallel cloud streets that are most evident in the NIR image over Michigan and northern Wisconsin.
A second internal feature of interest is the banding of the cloud tops that is roughly perpendicular to the cloud
streets identified. This banding results from the stable atmospheric lid put on the low-level instability generated by Lake Michigan. The atmosphere is very stable at this "lid". The strong winds in the layer below the lid are forced into vertical oscillations upon reaching hilly terrain. These vertical oscillations force the height ofthe stable atmospheric lid into a wave pattern that is analogous to water waves. The height of the clouds as determined by the height of the stable layer exhibits this wave structure. In the NIR satellite image, the wave struc-ture of the cloud is made apparent through shadows and differing cloud thickness. Note that this wave banding is apparent only over and downstream .from rough terrain. It is not visible over Lake Michigan.
A final point that bears mentioning about the internal structure ofthe cloud swath is the thinning of the cloud over northeastern Michigan. This is a result of the air mass subsiding down the eastern slopes of Michigan approaching Lake Huron and Saginaw Bay. As the air subsides, it warms owing to compres-sion, and without the addition of more moisture the relative humidity of the air decreases. The decrease is sufficient so that the clouds become widely scattered over this region in the NIR image. The strength of this effect increases as the amount of downslope and the wind speed increases.
This "bird's-eye view" from space has allowed meteorologists to examine the atmosphere from a different perspective. Cloud patterns and physical processes that were previously only theorized are now revealed in black and white.
-- -- -...... ......... ,..- --. ./ " ,/-....,
"--...-- -............... ""-"......- '-. -- -_./ ,,---./ ........... - -------------- ~./ ~
{ijrf!;J 4 ~ .4.4
heat/moisture Wisconsin .. Michigan '
Lake Michigan Lake Huron
44 Chinook Summer/Ete 1986

Near-infrared (NIR) satellite image taken at 3 p.m. EST. The shade of grey varies mainly with the reflectivity ofthe surface. The non-reflective lake is black and the reflective clouds are white.
\. (
The ll-micrometre satellite image taken at 7 p.m. EST. The shade of grey of the image varies directly with temperature. The warm water of Lake Michigan is black while the cold cloud tops are white.
The application of satellite imagery ranges from everyday operational fore-cast decisions to weighty theoretical studies of the atmosphere. With this
much at stake, some people might think a picture is worth much more than a thousand words.
Philip Chadwick is an instructor in the Professional Training Section at the Atmo-spheric Environment Service Headquarters in Downsview, Ontario.
45

FATALITIES DUE TO A TORNADIC WATERSPOUT
Waterspouts are frequently observed over Canadian lakes and adjacent ocean waters. The Canadian Geographic mag-azine of June/July 1985 contains an excellent photograph of one that formed over Lake Winnipeg on August 8, 1984.
They are very close cousins of the tornado. In fact, visually, the two phenomena cannot be distinguished from each other because each is a rapidly rotating vortex of air (which usually is made visible by condensed moisture) in the shape of a funnel or cone. However, they form in completely different meteorological circumstances, which strongly influence their behav-iour and potential for damage. The waterspout requires a sustaining ma-rine environment and an atmosphere destabilized by cold air aloft. If one or the other of these ingredients is re-moved (either by the waterspout mov-ing onshore, or by the cold air moving elsewhere) the waterspout dissipates. On the other hand, tornadoes are usually more energetic (and hence po-tentially more damaging) because they typically form in regions of the atmo-sphere where warm air converges to-wards the storm at levels near the earth's surface while at the same time strong winds (or jet streams) occur at higher levels. Since tornadoes form in more dynamic situations they tend to move more quickly than waterspouts, expend more energy, and persist over land.
Waterspouts are generally slow mov-ing and long-lived, making them easy for mariners to spot and fairly easy to avoid (in power craft). As a result, over the years no proven cases of a fatal interaction between sailors and water-spouts have occurred in Canadian wa-ters. However, they have been known to cause damage to the superstructure of boats, in one case partially lifting a vessel out of the water, and in several others causing minor structural dam-age as they made landfall.
MARINE FATALITIES Obviously, tornadoes do move from the land across bodies of water, or form directly over water. These are some-times called tornadic waterspouts. On November 10, 1983, what is believed to be a tornadic waterspout caused a fatal marine accident in Millar Channel,
46 Chinook Summer/EM 1986
by Michael J. Newark
Figure 1 The location in Millar Channel, B.C. where the Storm Prince capsized after being struck by a tornado.
KILOMETRES o '00
Figure 2 The synoptic surface weather map for 1600 PST, November 10, 1983. The isobars are labelled in kPa and the storm track is shown at 6-hourly intervals. The high-level jet axes are indicated by the arrowed lines.

This image of North America obtained by the GOES West weather satellite at 1600 PST November 10, 1983, shows an intense storm off Canada's West Coast. The tornado appears to have been associated with the leading (eastern) edge of the second spiral arm.
(which divides Flores Island from the west coast of Vancouver Island). At approximately 1535 PST, the 11.6-metre wooden fishing boat, ironically named Storm Prince, encountered the phenom-enon and capsized with the loss of two lives out of a complement of 10 people.
The Storm Prince was ferrying for-estry workers from Whitepine Cove to Ahousat (see Figure 1) and was towing a herring skiff. Because of choppy water it was decided to cease towing and three forestry workers took the skiff safely to Ahousat through 0.6 to 0.9 metre waves and winds of 25 to 35 kmfh.
After hoving to at Clifford Point for a few minutes to appraise the wind and sea conditions, the operator of the Storm Prince started across Millar Channel in sea conditions similar to those encountered by the skiff, but with somewhat stronger winds from the south at 45 to 55 kmlh. Seven of the remaining passengers were playing cards in the cabin abaft the wheel-house, while another two were in the wheel-house with the operator.
At about 1535 PST when the vessel was close to mid-channel, one of the workers went outside the wheel-house but returned almost immediately to report that the surface of the water astern was churning and a waterspout was approaching. From then on. events
happened very quickly. The wind and waves veered the vessel to port; it would not repond to the helm, but broached and then capsized to starboard. Report-edly, the waves rapidly grew in height to between 2.4 and 3 metres, and the wind blew at least 110 kmlh. Everyone was able to scramble outside the boat, but none had time to grab and put on a life-jacket. Subsequently, two were washed away from the capsized boat and were presumed to have drowned. The other eight were rescued by small boats from the village of Marktosis where residents had witnessed the tragedy.
NOVEMBER 10, 1983 WEATHER It is interesting to look at the weather situation of Thursday, November 10, 1983 (Figure 2). During the day an intense Pacific storm swept northeast-wards towards Vancouver Island, but curved towards the north during the afternoon. By 1600 PST it had deepened to about 95.6 kPa and was centred about 650 km west-southwest of Victoria. Weather satellite images (see photo-graph) show that the storm was in a very mature stage of its life cycle, with 2! spirals of warm air wrapped into the storm centre. It appears that the torna-dic waterspout occurred in association with convective cloud embedded in the second arm of the spiral cloud band. It
was also located beneath the left exit of a velocity maximum in the jet stream, a favoured position for severe thunder-storm development. The axes of the high-level jet streams are shown in Figure 2.
Data and statistics concerning torna-does over land are relatively plentiful, but over ocean areas there is very little information, so that the characteristics of marine tornadoes are not well known. The west coast of Vancouver Island may seem to be an unusual location and November an unusual month for a tornado occurrence. However, in the United Kingdom (which experiences Atlantic storms in much the some way that Vancouver Island experiences Paci-fic storms) tornadoes are frequent and their maximum number from 1960 to 1982 occurred in November. In fact, on November 23, 1981 a super-outbreak of 102 tornadoes formed in association with a vigorous storm (low pressure, 98.6 kPa) centred near the Faeroe Islands (Elsom and Meaden, 1984).
Given the paucity of meteorological reports off Canada's West Coast, and the sparse population along most of that coast, it is possible that tornadoes are more common there than is generally thought to be the case.
FURTHER READING Canadian Coast Guard, 1985. Report of
Investigation Into the Circumstances At-tending the Capsizing and Subsequent Sinking of the Canadian Fishing Vessel "Storm Prince". Report No.378, Ottawa.
Elsom, D.M. and G.T. Meaden, 1984: Spatial and Temporal Distribution of Tornadoes in the United Kingdom 1960-1982. Weather, Vol. 39, 317-323.
Newark, M.J., 1982: Waterspouts. A Photo Feature. Chinook, Vol. 4, 40-41.
Seath, D.W., 1985: Waterspouts over Lake Winnipeg. Canadian Geographic, Vol. 105, No.3, 88.
Michael Newark is the founder-editor of Chinook (1979-1984). He was for many years a forecaster in the Ontario Weather Centre and the Centre's Summer Severe Weather Meteorologist. He is currently head of the Climate Monitoring and Prediction Section of the Canadian Climate Centre.
RESUME Au point de vue visuel, les trombes marines ressemblent aux tornades mais elles resultent de conditions meteorologiques bien differentes. Les tornades se forment tors de situations atmaspMriques plus dynamiques que les trombes marines; elles se deplacent aussi plus rapidement et degagent plus d'energie, et elles persistent sur terre tandis que les trombes marines, en general, se dissipent lorsqu'elles atteignent la c6te. Il arrive parfois qu'une tornade se forme au-dessus ck l'eau ou qu'elle parcourre des masses d'eau apres s'etre formee sur terre. Voila ce qui se serait produit Ie 10 novembre 1983 quand, apparemment, une tornade causa un accident maritime martel dans le canal Millar ( qui separe l'tIe Flores de la c6te ouest de l'ile Vancouver,
en Colombie-Britannique). Vers 1535 HNP, un bateau de peche en bois, de 11,6 m, portant ironiquement Ie nom de "Storm Prince., chavira it sous l'effet de ce phenomene en enlevant la vie d 2 des 10 personnes d bordo Bien que la c6te ouest de l'tIe Vancouver semble peu propice a la formation de tornades, et que ce pMnomene soit rare en novembre, on observe que les conditions meteorologiques predomi-nantes sont analogues d celles du Rayaume-Uni qui connatt un climat maritime OU c' est en novembre que les tornades se manifestent en plus grand nombre. Etant donne la population clairsemee de la cote ouest du Canada, il est possible, contrairement d l'avis general, que les tornades soient en ces endroits, des phenomenes frequents.
47
WEATHER AND THE CONTROL OF PLANT
DISEASES
by William J. Blackburn, Andrew Bootsma and Terry J. Gillespie
The use of weather information is playing an ever increasing role in agricultural decisions. For example, we know that radiation and temperature characteristics are important in influ-encing the rate at which plants tran-spire water and take in carbon dioxide from the air, and the rate of crop
MONITORING CLIMATIC DATA SOURCES: - special stations (in-crop) - standard climate stations
Type: - temp., precip., R.H. - radiation, wind - past days, weeks to
present
development. Therefore, this weather information is valuable not only to the meteorologist, and other scientists, but also to the farmer. Important advances in using these and other data, including moisture (rainfall, dew duration), rela-tive humidity, and heat units have been made in agriculture.
MONITORING BIOLOGICAL DATA - crop phenology - disease outbreaks - injury levels
DATA COMMUNICATION
- scout reports - inspection officers - telephone/ electronIc
meil
RESEARCH CENTRAL PROCESSING OFFICE - di sease/ weather - analyse climate,
relationships ~--...c biological, forecast data - model develop- 14---..., - run, adjust models
ment and testing - calculate indices
WEATHER FORECASTS - temp., prec ip., R.H .•
wind, radiation - 24-48 h forecasts
- indices - prepare management (spray) r----, recommendations
- feedback/evaluations
COMMUNICATION TO GROWERS
- disease report s , spray advisories
- telephone - newspaper, radio, TV - mail
EVALUATION - Questionnaires - Surveys - Cost/Benefit - di sease incidence - spraying practi ces
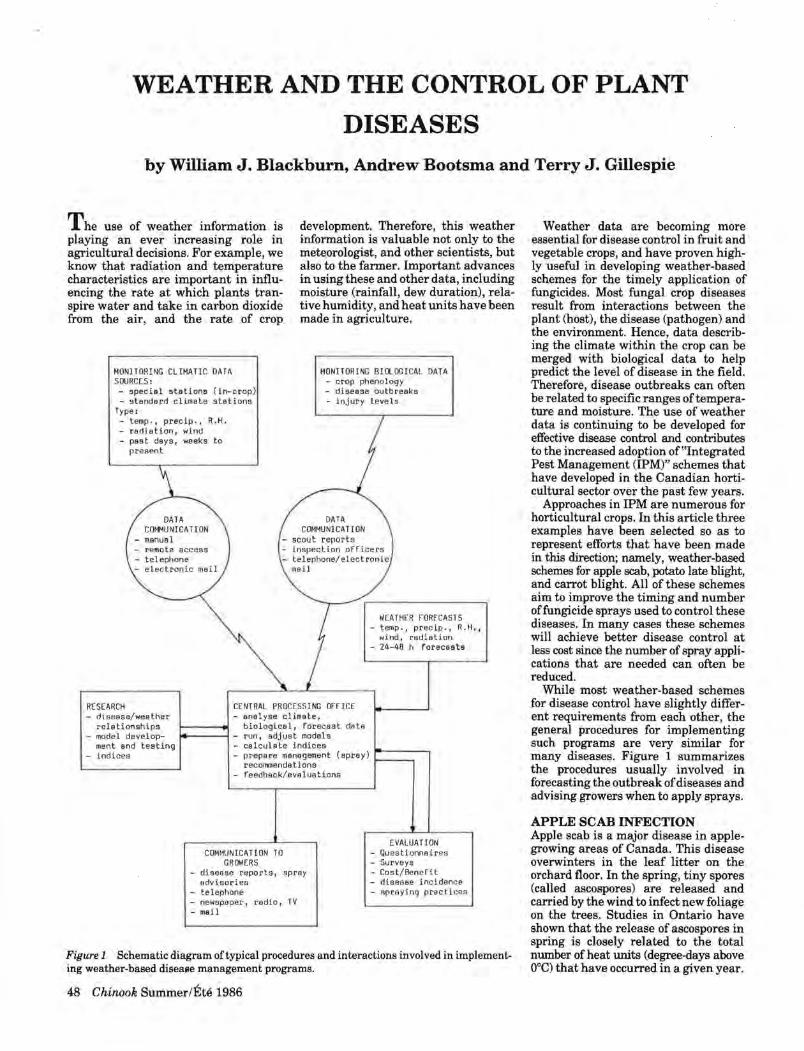
Figure 1 Schematic diagram of typical procedures and interactions involved in implement-ing weather-based disease management programs.
48 Chinook Summer/EM 1986
Weather data are becoming more essential for disease control in fruit and vegetable crops, and have proven high-ly useful in developing weather-based schemes for the timely application of fungicides. Most fungal crop diseases result from interactions between the plant (host), the disease (pathogen) and the environment. Hence, data describ-ing the climate within the crop can be merged with biological data to help predict the level of disease in the field . Therefore, disease outbreaks can often be related to specific ranges oftempera-ture and moisture. The use of weather data is continuing to be developed for effective disease control and contributes to the increased adoption of "Integrated Pest Management (IPM)" schemes that have developed in the Canadian horti-cultural sector over the past few years.
Approaches in IPM are numerous for horticultural crops. In this article three examples have been selected so as to represent efforts that have been made in this direction; namely, weather-based schemes for apple scab, potato late blight, and carrot blight. All of these schemes aim to improve the timing and number of fungicide sprays used to control these diseases. In many cases these schemes will achieve better disease control at less cost since the number of spray appli-cations that are needed can often be reduced.
While most weather-based schemes for disease control have slightly differ-ent requirements from each other, the general procedures for implementing such programs are very similar for many diseases. Figure 1 summarizes the procedures usually involved in forecasting the outbreak of diseases and advising growers when to apply sprays.
APPLE SCAB INFECTION Apple scab is a major disease in apple-growing areas of Canada. This disease overwinters in the leaf litter on the orchard floor. In the spring, tiny spores (called ascospores) are released and carried by the wind to infect new foliage on the trees. Studies in Ontario have shown that the release of ascospores in spring is closely related to the total number of heat units (degree-days above QOC) that have occurred in a given year.

In these studies, data on the forma-tion of ascospores and their release into the air were taken from "Mcintosh" apple leaf samples collected from or-chard litter and analysed along with weather data for various Ontario apple-growing districts. It was found that some phases of ascospore maturity and discharge were related to some stages of development of the apple tree and others were not.
Apple growers are most concerned about the first time that ascospores are released from the orchard litter in the spring since they are attempting to keep the fruit completely free from disease. Therefore, in order to deter-mine the most appropriate date to start accumulating heat units, it is desirable to select the development stage of the apple tree that corresponds best with the time the first ascospores are re-leased. Silver tip (when the buds are swollen and bud scales are separated at the tip to expose some light grey tissue) was selected since data showed that first discharge usually occurs after this stage.
Examination of 13 years of data revealed that the number of days between silver tip and estimated first ascospore discharge was closely related to the cumulative degree-days over the same time period. Degree-days were calculated from the average of daily maximum and minimum temperatures. This relationship assumes that once the required number of degree-days is ob-tained, a rain event of greater than 2.0 mm must follow silver tip to initiate ascospore discharge.
This relationship can be used to help decide when to begin spraying fungi-cides to control apple scab. Sprays are needed when the sum of the degree-days computed using temperatures measured on-site or at a nearby weather station equals or exceeds the required thresh-old. Use can also be made of weather forecasts. For example, the forecast temperatures for the next 3 to 5 days may be used to calculate the degree-days, which can be compared to the threshold value.
POTATO LATE BLIGHT In areas of Canada where potatoes are grown in humid climates, fungal dis-eases may cause serious economic losses unless proper control measures are undertaken to prevent the spread of disease. Late blight of potatoes is one such disease that requires periods of high relative humidity (wet foliage) for the disease to spread and infect new plant tissue. A weather-based control scheme has been used effectively in Prince Edward Island and is similar
Horizontal boom sprayer in a carrot field in the Holland Marsh, Ontario.
Flat plate used to measure duration of wetness on apple leaves.
to those used successfully in other parts of the Atlantic region of Canada and in the northeastern United States.
Forecasts of the initial occurrence and subsequent spread oflate blight are based on measurements of relative humidity (RH), temperature and rain-fall taken within the crop. From these data the following values are computed for each day: the number of continuous hours with RH greater than 90%, the average temperature during the period of RH greater than 90%, the maximum and minimum temperatures, and the total 24-hour rainfall amount. A daily index is computed to describe the severity of the weather for blight development. This index (called blight severity index (BS!) ranges from a value
of 1 to 4 depending on the average tem-perature and the hours ofRH above 90%.
When the RH is high for long periods the BSI is high (closer to 4), indicating that conditions arE!' conducive to develop-ment of late blight. During warm, wet weather, the blight develops more rap-idly so that fewer hours of high RH are needed to produce high BSI values.
Values of the BSI are accumulated for the preceding 7-day period and com-bined with rainfall data to determine the risk of blight outbreak (i.e., "very low" to "extreme"). The most suitable spray schedule may require the spray interval to be as short as 5 to 7 days or as long as 14 days or more depending largely on the 7 -day accumulation of the BSI.
49

Left Carrot blight showing typical symptoms of dying tissue on the leaf margins. Right Typical lesions caused by the late blight fungus on potato leaves (From: Busch, L.V., 1979: Late Blight of Potato. Ontario Ministry of Agriculture and Food Factsheet 79-043).
CARROT BLIGHT CONTROL Alternaria leaf blight is a disease that commonly occurs in carrot crops. Just as for apple scab and potato late blight, its spread is also related to weather factors.
A predictive scheme was developed to improve the efficiency of fungicide use in controlling alternaria leaf blight in carrots. Spray scheduling can be timed according to blight-favourable weather. This scheme has controlled blight effec-tively. Frequently, one to five fewer sprays are required than in a tradition-al spray program after blight symptoms are observed on 1 to 2% ofthe foliage in the field.
Studies show that fungicides need only be applied when forecast weather for the forthcoming 36 hours is favour-able for infection of carrot leaves by the fungus. This forecast uses data on
temperature and leaf wetness duration. Temperatures are based on regional forecasts, and wetness duration on the occurrence of rain and regional fore-casts of cloud cover and surface wind speeds.
FURTHER READING Bootsma, A., 1979: Potato Late Blight Fore-
casting in Prince Edward Island in 1978. Canadian Plant Disease Survey,Vol. 59, No.3, 63-66.
Gillespie, T.J. and J.C. Sutton, 1979: A Pre-dictive Scheme for Timing Fungicide and Applications to Control Alternaria Leaf Blight in Carrots. Canadian Journal of Plant Pathology, Vol. 1,95-99.
Proctor, J.T.A. ; W.J. Blackburn, T.J . Gilles-pie and B.H. MacNeill , 1983: Prediction of Apple Scab: Reduction of Spraying. High-lights, Vol. 6, No. 3, 7-9.
William J. Blackburn is an Agrometeorol-ogist with the Resources and Environment Section, Regional Development Branch, Agri-culture Canada, Ottawa. His work has focussed on environmental factors and tech-nology related to crop yield and production trends, practices, efficiences and potentials. He is also a member of Canada's expert Committee on Agrometeorology.
Andrew Bootsma is an Agrometeorologi-cal Resources Specialist with the Land Re-source Research Institute, Research Branch, Agriculture Canada, Ottawa. He is presently involved in various assessments of agrocli-matic resources for agriculture in Canada.
Terry Gillespie is a professor of Agromete-orology in the Department of Land Resource Science, University of Guelph. He has been instrumental in developing various pest management schemes for horticultural crops.
RESUME On discute de l'application des donnees meteorolo-giques aux scenarios de contr6le des maladies dans trois cultures horticoles. L'utilisation de telles donnees permet d'etablir un rapport quantitatif entre les conditions meteorologiques et les facteurs de maladies dans les cultures, en vue de planifier La pulverisation de fongicides . Etant donne que la temperature et l'humidite dans les cultures different souvent et considerablement de celles enregistrees aux stations meteorologiques avoisinantes, il est habituellement necessaire d'y placer des instruments meteorologiques afin de rendre
effectifs les scenarios de previsions des maladies. Grace d des recherches plus poussees sur ces differences, il sera de plus en plus possible d'utiliser les donnel!$ provenant plutot (le stations m~tdorologiques standard. Les scenarios bases sur les d-01UleeS meteo-rologiques permett~nt (requemment aux exploitants agricoles de miellx choisir l~ mom~nt ideal de pulverisation et de redltire le nombre de pulverisations necessaires; il en resulte d'importantes economies, Ilne amelioration du contr61e des maladies et une reduction de La contamination environnementale.
50 Chinook Summer/Ete 1986

PROFESSOR KINGSTON'S SCHEME FOUNDING THE METEOROLOGICAL SERVICE
On November 3,1870 William Smith, Deputy Minister of Marine and Fisher-ies, wrote Professor Kingston of the Toronto Observatory, to inform him "that the Minister approves the scheme proposed by you". The part of Kings-ton's "scheme" approved at that moment was simply to have certain lighthouse keepers take meteorological observa-tions. It was this simple acceptance of a proposal to have federal government employees take weather observations that opened the door for the founding of the Meteorological Service of Canada.
The first systematic, scientific weath-er observations had been taken in Quebec City from 1742 to 1756. Official, or government, meteorology began in 1839-40 when Her Majesty's Magnetic and Meteorological Observatory was established in Toronto. A detachment of the Royal Artillery manned the observ-atory until 1853 when the Imperial Government withdrew its support. The Canadian Legislature then undertook to maintain the observatory and placed it under the supervision of the Universi-ty of Toronto.
George Templeman Kingston ar-rived in Toronto in August 1855 to become professor of meteorology and director of the observatory. A Cam-bridge graduate, Kingston was abreast of the developing theories of meteorolo-gy and of the steps that were being taken in EuroPe, Britain and the United States to develop "weather teleg-raphy" - the use of the new telegraph system to collect and distribute weather information from which, it was hoped, "a knowledge of the laws that govern the progress of storms" would be gained and storm warnings attempted.
OBSERVATIONS In Canada the Legislature had passed a bill calling for a program of mete oro log-ical observations at the senior county grammar schools. Delayed for lack of equipment, since American manufac-tured instruments had proved to be unsatisfactory, the program had not yet started in 1855. Kingston became in-volved and wrote the instructions for use in the schools but his view of the future for meteorological observing was wider than the grammar school pro-gram. Early in 1856 the Canadian
by Morley Thomas
Professor G.T. Kingston (1816-1886), Direc-tor of the Observatory from 1855 to 1880 and Founder of the Meteorological Service (Pho-tograph: Journal of the Royal Astronomical Society, 1940).
Institute established a Meteorological Committee to consider "rendering the (observing] system complete". Kingston was named chairman and reported to the Institute early in 1858. In it he suggested that, since the grammar school system was now in place, the Institute should recruit and support additional observers and place them in communication with the Toronto Ob-
servatory. The Institute took little or no action on the recommendations. Kings-ton's first reports to the U ofT's Board of Visitors, written in December 1855 and October 1856, had optimistically re-ferred to additional work to be under-taken at the observatory to receive, process and perhaps publish climate data from the grammar schools and private observers. But it is likely that Kingston was sharply criticized for planning to undertake this extraneous work since it was not mentioned in his later annual observatory reports.
WEATHER FORECASTS The challenge of weather forecasting was "in the air" in the 1850s. Following discussion in the Canadian Institute about the need for a system of simulta-neous meteorological observations in British North America, Kingston pre-sented a paper in 1857 on the employ-ment of the electric telegraph for pre-dicting storms. The Institute endorsed Kingston's plan and copies were sent to several Boards of Trade, insurance companies and the government. There is no evidence that any action resulted but Kingston now had the basis of his "scheme", which consisted of a Central Offic~, different classes of observing stations and, in time, a weather fore-casting service.
The second Toronto Observatory, built in 1855, where the Meteorological Service was organized and administered from 1871 to 1908 (Photograph: Journal of the Royal Astro-nomical Society, 1940).
51

Dr. Charles Smallwood (1812-1873), Found-er of the McGill Observatory in 1863 (Not-man Photographic Archives No. 73424-B1, McCord Museum, Montreal).
Meanwhile Kingston was establish-ing contacts with others interested in meteorology in British North America. With the advent of Confederation, he became concerned over the "anomaly involved in this observatory being the property of the Dominion and under the supervision of a local university", and wrote suggesting that the Quebec, McGill and Queen's observatories be supported, that observatories be set up in Nova Scotia and New Brunswick and that all report to the Toronto Observatory. He wrote to several officials, such as Sand-ford Fleming, urging the establishment of a network for rain gauge stations to provide a "service to engineering", and to several politicians promoting an observatory in the Red River Settlement. He also corresponded with officials of the Northern Railroad, a fruit-growers association, the Crown Lands Depart-ment and universities regarding weather observations.
In Europe there had been a remark-able surge of interest in the science of meteorology in the two to three decades prior to 1870. Several scientists had published on the theory and "philo-sophy" of storms, and the first Interna-tional Meteorological Conference was held in Brussels in 1853. Several west-ern European countries set up meteoro-logical institutes, observatories or ser-vices during the early and mid-1850s and began the national collection of meteorological data. Weather telegra-phy followed in most European countries by 1870 and several services and institutes began to issue storm warnings and general forecasts during the next decade.
In the United States, meteorological science was also being developed and
52 Chinook Summer/Ete 1986
the politicians had become aware of a public demand for storm warnings. The result was the passing by Congress on February 9, 1870 of a joint resolution that authorized the Secretary of War "to provide for taking meteorological obser-vations at the military stations and at other points in the interior of the continent, and for giving notice on the northern lakes and seaboard of the approach and force of storms". The Signal Office was charged with develop-ing and supervising the service and on November 1,1870 "systematic synchro-nous meteoric reports" from 24 stations were "placed upon the telegraph for transmission". Storm warnings were first issued a few days later and "weather probabilities" were published twice daily beginning in 1871.
CANADA 1867-1870 An Act establishing the Canadian Department of Marine and Fisheries was assented to on May 22, 1868. There was nothing in the Act regarding meteo-rology but the department was made re-sponsible for "such matters as refer to the marine and navigation of Canada". As it happened these years were "ex-tremely boisterous and stormy" and considerable loss of life and property was reported from both the seaboard and the inland lakes. In July 1870, Kingston visited the Deputy Minister of Marine and Fisheries to discuss his scheme to collect data which they both hoped would be useful in discovering the laws governing storms so that a system of storm signals to warn mari-ners and fishermen might soon be set up.
Kingston continued to approach oth-er federal politicians, writing to the Secretary of State, the Minister of Public Works, the Minister of Agricul-
Built in the early 1870s, this house served as the residence and telegraphic reporting station for Manuel Payne, the Port Stanley observer from 1873 to 1908.
ture, and the new Lieutenant Governor of Manitoba. But when he received the Deputy Minister's letter of Novem-ber 5 advising him that the Minister had approved his scheme he dropped his other contacts and moved quickly to propose guidelines for the program. After receiving advice "that $5,000 had been placed in the estimates for meteo-rological observations" he sent off de-tailed expenditure plans and a request for "authority" for himself. On May 1, 1871 the Governor General approved the proposed expenditure and Kingston began to plan for launching the light-house observing program.
CHIEF STATIONS During the summer of 1871, equipment and supplies were forwarded to 37 lighthouses and Kingston moved quick-ly to have superintendents named for the Chief Stations he had included in his proposed organization. Frederick Allison of Halifax, Gilbert Murdoch of Saint John and Dr. Charles Smallwood of Montreal were appointed superintend-ents on July 1, 1871, at $400 a year, the first paid personnel of the Meteoro-logical Office. Kingston himself contin-ued to work gratuitously; it was 1873-74 before he was paid an additional $1,000 a year for his Service work.
In addition, Kingston was given auth-ority to negotiate with Professor W.B. Jack of the University of New Bruns-wick, and with the Bishop of Rupert's Land for two stations, one at Winnipeg and another at Spence's Bridge, B.C. By March 1872, Chief Stations were oper-ating at seven locations. The concept of Chief Stations had been basic in Profes-sor Kingston's scheme but their impor-tance began to fade almost immediately as the rapid introduction of self-register-ing instruments alleviated the need for several observations each day.
TELEGRAPH STATIONS When Professor Kingston wrote to the Chief Signal Officer of the U.S. Army in June 1871, as authorized by the Minis-ter of Marine and Fisheries, to inquire about the possibility of a "systematic interchange, by telegraph, of meteoro-logical information between Canada and Washington" he was advised that "such an interchange will be cheerfully made". Kingston, however, was in no position to move rapidly into weather telegraphy since he had no resources. He advised the Deputy Minister that "it would be wise policy for Canada to allow time for the further development of the System before becoming committed to any costly telegraphing arrangements". Meanwhile the U.S. Chief Signal Offi-cer had another contact in Canada
whom he used to speed Canadian participation. Earlier, in March 1871, Dr. Smallwood of the Montreal McGill Observatory had written to the Ameri-cans requesting an interchange of mete-orological observations by telegraphy. The response was enthusiastic; Lieu-tenant Howgate, Acting Signal Officer, went so far as to suggest the posting of U.S. Army observers to Canadian sta-tions if "permission can be obtained from the Colonial Government". Despite being told by Kingston that he had been given governmental authority, the Americans continued to press Smallwood for obser-vations from other Canadian locations during the summer and fall of 187l.
Early in October 1871 Kingston ad-vised the Chief Signal Officer that he had made arrangements with his mete-orological agents in Halifax and Saint John to telegraph weather reports to Washington and that he could arrange for seven additional stations to start within a year. To Kingston's dismay the Chief Signal Officer responded by ask-ing for telegraphic weather reports from five locations on the Great Lakes and advising that reports from Quebec and the Maritimes were "not of special value to our service at present". In subsequent correspondence over the next two weeks, stations at Port Dover, Port Stanley, Kingston and Saugeenl Southampton were agreed to and for the remainder of 1871 Professor Kingston was exceedingly busy finding observers and sending instructions and equip-ment to the new stations. Negotiations were begun with the Montreal Tele-graph Company, and the international exchange of data with the Americans began on January 2, 1872.
Kingston's development of his mete-orological system during the late months of1871 was most remarkable. In negoti-ating with the new telegraph station observers he gambled that the service would soon be funded. He told each observer that he had recommended payment of $18 a month and that he, Kingston, would personally guarantee payment of $15 for the month of January 1872. Soon after the New Year he reported his progress to the Depart-ment in Ottawa, stating that "my action so far has been at my own risk" and submitted estimates amounting to an additional $4,000 for the remainder of the fiscal year, which ended on June 30,1872.
No help came from Ottawa. On Febru-ary 14, 1872 Kingston was forced to write to his new observers and to the office of the Chief Signal Officer in Washington to advise that weather telegrams from the four out-stations were suspended "till Parliament has
.. .... .. ..... . ,- .. .....
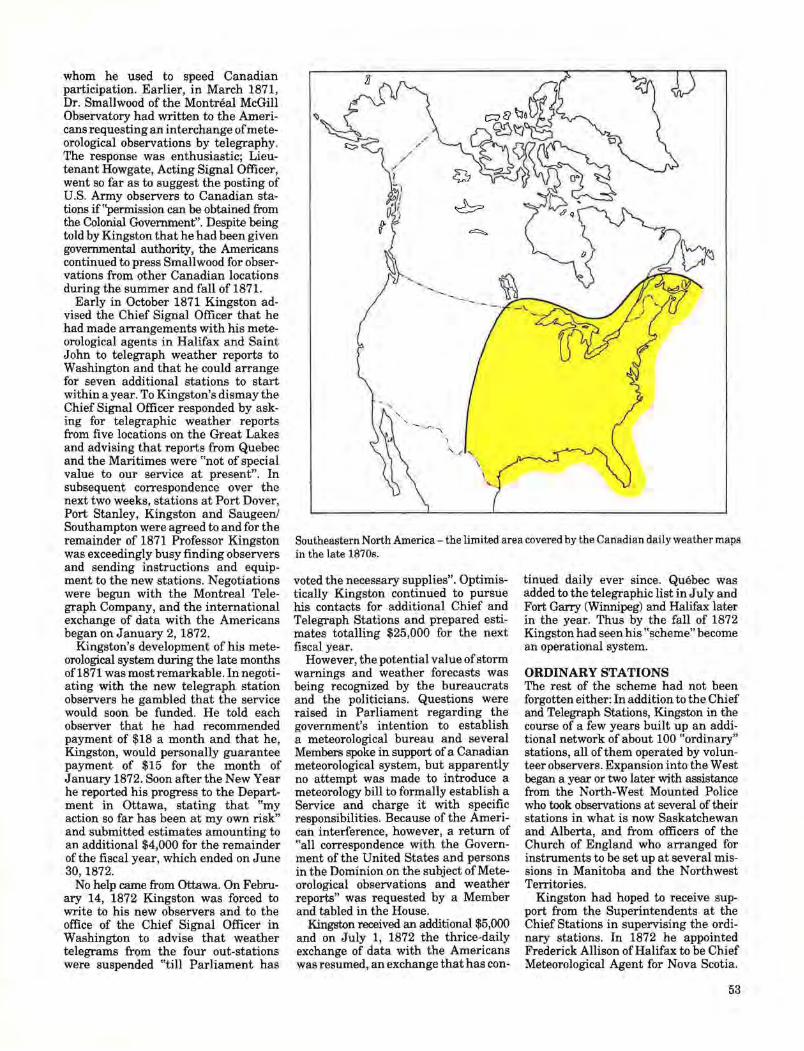
Southeastern North America - the limited area covered by the Canadian daily weather maps in the late 1870s.
voted the necessary supplies". Optimis-tically Kingston continued to pursue his contacts for additional Chief and Telegraph Stations and prepared esti-mates totalling $25,000 for the next fiscal year.
However, the potential value of storm warnings and weather forecasts was being recognized by the bureaucrats and the politicians. Questions were raised in Parliament regarding the government's intention to establish a meteorological bureau and several Members spoke in support of a Canadian meteorological system, but apparently no attempt was made to introduce a meteorology bill to formally establish a Service and charge it with specific responsibilities. Because of the Ameri-can interference, however, a return of "all correspondence with the Govern-ment of the United States and persons in the Dominion on the subject of Mete-orological observations and weather reports" was requested by a Member and tabled in the House.
Kingston received an additional $5,000 and on July 1, 1872 the thrice-daily exchange of data with the Americans was resumed, an exchange that has con-
tinued daily ever since. Quebec was added to the telegraphic list in July and Fort Garry (Winnipeg) and Halifax later in the year. Thus by the fall of 1872 Kingston had seen his "scheme" become an operational system.
ORDINARY STATIONS The rest of the scheme had not been forgotten either: In addition to the Chief and Telegraph Stations, Kingston in the course of a few years built up an addi-tional network of about 100 "ordinary" stations, all of them operated by volun-teer observers. Expansion into the West began a year or two later with assistance from the North-West Mounted Police who took observations at several of their stations in what is now Saskatchewan and Alberta, and from officers of the Church of England who arranged for instruments to be set up at several mis-sions in Manitoba and the Northwest Territories.
Kingston had hoped to receive sup-port from the Superintendents at the Chief Stations in supervising the ordi-nary stations. In 1872 he appointed Frederick Allison of Halifax to be Chief Meteorological Agent for Nova Scotia.
53

METEOROLOGICAL SERVICE OF THE DOMINION OF CANADA.
WEATHER BULLETIN,
ISSUED BY THE CENTRAL OFFICE, TORONTO, AT 10 A..M., iMWPl&111§1, 1S78.
.Received by Telegraph at ~ali{b;,t at 11.1-5 a.m.,
PROBABILITIES FOR THE NEXT 24 HOURS. * FOR THE LOWER LAKE REGION :-
"frt.CY<i£JuUe 1('; JwIt )cffi1Ii-JJJe8~ 10 II'IffJA ~t~ AJJin&'; d£cllo jaiYt ~FOR THE ST. LAWRENCE :-
'lritYdPJwk ~i~t&A;.&,ulA ~uJfjtiJtP1f~ ;nmtA-AJJCJ!PYt% AJJiJnJJ; ~ 1& !6iJr.JVfutMt; Aln1i6n~ ~11, Jd1 tTlg .lerntfeJtcJi;uM.
FOR THE MARITIME PROVINCES:-
cDw..caJMyj ~ 10 ~ JDirulJ.,; ~ .amJ. wPJRJi ~.
Tbese probabilities are issued at 10 a.m. Toronto time, and are for the 24 hours following.
LOWJ:R LAKE REGION includes the Peninsula of Ontario, and east as far as Kingston.
ST. LAWRENCE includes the St. Lawrence River and adjacent territory. MARITIME PROVINCES includes Nova Scotia and New Brunswick and Prince
Edward Island. The ordering up of tb~ Cautionary Slol'm Signals (which constitutes a storm
warning), is intended to warn those oonnsetG(\ with shipping that a storm will pro-bablyoccur, either at the 'place at which the signal is displayed, or within such a distance that ships leaving por~ might be' affect·id by it.
• The probabilities for each district (with a few exception6) are sent only to those stations situated in that district.
An example of a weather forecast displayed in Halifax, N.S., in 1878.
METEOROLOGICAL SERVICE OF THE DOMINION OF CANADA. STORM WARN~NG.
I8sued by the Cent·ral Ojict, POT07ltQi at"!.10IMn'J21i.i!J«em~f818. Received by Telegntph at J!;t'~1 dt9.0S/J.'m. ~e.t(;1II.e !&.cm~ (/gmt.
CAUTIONARY STORM BIGYAUI ARE ORDERED UP AT
. . ;g!?!!l" ~~~" " ~'~' IS'<Ji.t 01<. . t , m~&. t.~&. G. T. KINGSTON, Superi..undml.
The ordering up of the Cautionary Storm Signal is intended to warn those con-nected with shipping that a storm will probably occur, either at the place at which the signal is displayed, or within such a distance that ships leaving port might be affected by it.
An example of a storm warning displayed in Saint John, N.B., in 1878.
54 Chinook Summer/Ete 1986
Through Allison's efforts additional stations were obtained but soon confu-sion arose regarding the extent of his authority. Later J. Murray of Spence's Bridge, B.C. was successful in obtaining 20 or so precipitation observers in that province. The officers of St. John's Col-lege in Winnipeg, the Chief Station established by the Bishop of Rupert's Land, was successful in setting up a few volunteer stations in Manitoba. How-ever, Kingston was unable to use the Chief Station Superintendents to any extent to lighten the administrative and supervisory tasks at the Central Office -mostly because he seemed unwilling to delegate authority and to share "control" of his new system with his subordinates across the country. Until late 1872 Kingston had only the help of his three observers in Toronto. Over the next few months he was permitted to hire a few assistants for the new Service including Charles Carpmael, another Cambridge MA, who eventually succeeded him as director.
THE OPERATIONAL SYSTEM At the reporting Telegraph Stations, observers were responsible for 3 obser-vations a day at 7:25 a.m., 4:25 p.m. and 10:40 p.m. Toronto Mean Time. After examination the Canadian telegraphed reports were sent on to Washington and in exchange the daily reports from a few U.S. stations were sent from Buffalo to Toronto. Maps were prepared at the Toronto Central Office and from them deductions were made regarding ex-pected weather and whether or not stonn warnings should be issued. For the first few years Kingston and his assistants relied on warnings sent from Washing-ton, but beginning in September 1876 all decisions on storm warnings were made independently of Washington.
Both Britain and the United States had begun stonn signal programs where cautionary drums, baskets or lights were hoisted on masts overlooking ports and harbours whenever stormy weath-er was expected. With the objective of reducing stonn losses, Kingston was able to move quickly to organize a similar system. Spurred by the loss of 600 lives and 1,100 vessels in Atlantic Canada from the passage of a hurricane in August 1873, there were 36 storm signal stations operating within two or three years. In addition, by 1878, Toronto prepared daily "probabilities" for the ensuing 24 hours that were issued daily at 10 a.m., Sundays except-ed, for newspapers. The "probabilities" were also posted at telegraph and post offices and by 1878 were received in over 100 places in Ontario, Quebec and the Maritimes.

CONCLUSIONS Undoubtedly because of Empire connec-tions and his own background, Kings-ton looked to Britain for guidance and support in developing his scheme for a meteorological system in Canada. For example, in the late 1860s he began ordering meteorological instruments from English firms through the British Meteorological Office. In the 1870-72 period Kingston gave every indication that he wished only to gather and an-alyse climate data before getting into weather telegraphy, following the policy laid down by the Royal Society's Mete-orological Committee. He was, however, forced to move much more quickly, mainly on account of the Americans.
As might be expected Canada's mete-orological relations with the United States were, and are, unique. Mention has already been made of Canada's rapid move into weather telegraphy because of the advantages to be gained from the U.S.'s "very liberal and exten-sive scheme ... which in other circum-stances would have been better post-poned". Politically there was undoubt-edly the realization that the Americans needed, and were going to get in some manner, daily weather observations from Canada. However, the Canada/U.S. cooperation begun by Kingston and his U.S. national weather service counter-parts has flourished and continued without interruption.
N~ 1
NIGHT NUIT
RID ROUGE
HUou3 MIGHT NUIT
RtD ROUGE
WHITE BLANC
NI! 2ou4
George Templeman Kingston was truly the founder of the Canadian meteorological service. Under his su-pervision a unique civilian Canadian system was developed, borrowing from both the Americans and the British whenever this would be advantageous. He was firm in his belief that his should be the only authority in the Service and he battled the Department for more and more resources with moderate success.
The signals indicate the probable occurrence of: 1 (2) - a gale at first from an easterly (westerly) direction; 3 (4) - a HEAVY gale at first from an easterly (westerly) direction. The night signal corresponding to No. 1 or 3 is a red light, and to No.2 or 4 is a red light above a white light.
Kingston was never a robust healthy man. Early in his life a career in the Royal Navy had to be given up on account of poor health. Frequently complaining of exhaustion and absent through illness during the latter half of 1879 he was forced to retire on January 31, 1880 and died in Toronto on January 21, 1886 in his 70th year.
FURTHER READING Morley Thomas has had a long and distin-guished career with the Atmospheric Envi-ronment Service and the World Meteorologi-cal Organization. He is a former Director General of the AES Canadian Climate Centre and is currently Archivist for the Canadian Meteorological and Oceanographic Society.
Newark, M.J ., 1983-4: The Pre-Confedera-tion Weather Network. Chinook, Vol. 5/6, 42-45.
Sommerville, S., 1981: Dr. Charles Small-wood: A Meteorological Pioneer. Chinook, Vol. 3, 56-57.
RESUME En 1855, on nommait George T. Kingston professeur de meteorologie et directeur de l'observatoire de magnetisme et de meteorologie d l'Universite de Toronto. Les quelques annees suivantes, il a travaille, de concert avec le ministere de l'Education, d recruter des observateurs benevoles et d mettre en oeuvre un systeme d'observations meteorologiques dans les colleges du Haut-Canada. Comme suite d ses propositions au Gouvernement federal, le ministre de la Marine et des Peches acceptait en 1870, que les gardiens de phares relevent des observations. Plus tard dans l'annee, les Etats-Unis lantraient un service operationnel d'observations et de previsions meteorologiques qui necessitait de mettre sur pied au
Canada, des stations de transmission telegraphique d'observations. C'etait lit une chance it ne pas manquer et, en 1871, Kingston commentra d participer it l'installation d'un reseau provincial de stations d'observations et de stations climatologiques principales et ordinaires. C'est en 1869 que les premieres donnees climatologiques furent recueillies; 1872 marqua le debut de l'echange, aux fins d'exploitation, des donnees transmises par telegraphe entre les Etats-Unis et le Canada; eten 1876, le bureau central de Toronto emit les premiers avis de tempetes et les premieres previsions meteorolo-giques generales.
55
THE WINTER OF 1985-86
Mean temperatures were consistently above normal in the Yukon, Northwest Territories and extreme northern Que-bec for each of the three winter months. The contrary was true in northern Ontario and central Quebec. In the Prairies, where winter temperatures averaged well above normal, only Feb-ruary was relatively cold. January at many B.C. and Prairie locations was the warmest ever. Weather systems mov-ing across the Great Lakes and up the St. Lawrence Valley gave typically changeable conditions for this time of year. Heaviest snowfalls occurred to the lee of the Great Lakes in December, and in the Gulf of St. Lawrence in January. Snowfalls were above normal across the North, especially in northern Quebec and Baffin Island, where some were almost double the normal. Except in February, southern Alberta was very dry. By mid-January, the snow pack was almost depleted in central Alberta, and non-existent in the south. Owing to the lack of moisture and snow on the western prairies, strong winds caused some soil erosion, while the lack of snow to the east allowed farmers to complete their fall harvest. Although eastern Canada received its fair share of Atlan-tic storms, the winter began and ended dry and sunny - The precipitation was excessive only during January. A cold December caused ice to develop rapidly in the Gulf of St. Lawrence, where by mid-winter, the ice was extensive and thick. Strong northwesterly winds con-gested the ice-pack, and made this one of the more difficult ice seasons for the Coast Guard.
DECEMBER The record cold weather that covered western Canada during November was slowly replaced by much milder air. Weather systems affecting the west coast regularly produced cloudy skies, but only light precipitation. After the middle of the month, a strong high pressure built northwards across west-ern Canada. A southerly flow of very mild air from the U.S.A. overran the cold air trapped in B.C. valleys. As a result thick fog developed during the Christmas period and disrupted trans-portation. Many high temperature re-cords were broken in northern B.C. and the Yukon, but the warm weather was also accompanied by freezing rain. Even under above normal tempera-
56 Chinook Summer/Ete 1986
by Andy Radomski
tures, all lakes and rivers were frozen by mid-month across the North. Blowing snow and blizzards were common in the central and eastern Arctic.
In Alberta, where skies were mainly sunny, temperatures soared into the teens during the holiday period, break-ing many records. When the mild weather reached the eastern prairies, temperatures eventually climbed above freezing. With a few exceptions, snow-falls were below normal, and in Alberta and Saskatchewan, agricultural dis-tricts lost most of their snow cover.
On December 1 and 2, a fierce storm from the U.S. Midwest hit Ontario, with heavy rains in the south, snow in the north, and gale-force winds. South-westerly winds up to 100 kmlh forced the lake level in eastern Lake Erie to rise two metres. Waves pounded the shoreline and caused extensive flood-ing, destroying houses and cottages. Damage was estimated to exceed $15 million. The storm swept across Quebec on December 3 and 4 with gale-force winds to 100 kmlh, and forced a barge aground, spilling fuel oil in the St. Lawrence River. By mid-month, an Arctic air mass encompassed most of eastern Canada, and triggered heavy snow squalls to the lee of the Great Lakes. To the delight of ski resort operators in the snowbelt, snow fell every day from December 13, right through the holiday period. In Muskoka and near the shores of Georgian Bay, some places received more than 300 cm of fresh snow by month's end, and several new snowfall records were set with amounts ranging between 100 and 200 cm.
Weather disturbances tracking across Quebec, after the middle of the month, gave substantial snowfalls to the south. During December, the Laurentians re-ceived almost 100 cm of snow, while the north had above normal falls of 50 cm.
Cold, but frequently sunny weather was encountered in the Maritimes, while cloud plagued Newfoundland. Several places enjoyed record amounts of sunshine, while others recorded the lowest total precipitation in three dec-ades. Storms brought heavy snow to Cape Breton Island and Labrador, and strong winds and blowing and drifting snow to Atlantic Canada. At Moncton on December 2, a record wind speed of 126 kmlh was observed while at Port-aux-Basques, on December 19, winds hit 157 kmlh, producing whiteouts and
drifts and paralysing transportation.
JANUARY Unseasonably mild Pacific air crossed the Rockies, establishing this as one of the warmest Januaries on record in western Canada. In British Columbia, where daytime temperatures climbed to the mid to high teens, six monthly maxi-mum temperature records were set. On-shore winds produced cloudy skies and heavy rainfalls along the west coast; some places received twice their normal precipitation. McInnes Island set a January record of 395 mm. Cold air trapped in Yukon mountain valleys caused low stratus and fog to form. The unseasonably mild Prairie weather vir-tually depleted the protective snow cover in the southwest, and valuable topsoil was blown away. In some areas dust re-duced visibilities significantly.
The Great Lakes weather was un-eventful with temperatures moderating somewhat, especially in the northwest. Heavy snowfalls in Ontario were rare. Occasional Arctic outbreaks triggered snow squalls to the lee of the Great Lakes. By month's end, some snowbelt communities had accumulated several metres of snow. In contrast, falls in the southwest were well below normal.
Heavy snow from several east coast storms fell in Quebec. On January 27, the worst snowstorm of the winter dumped 30-50 cm of snow on the St. Lawrence Valley, and 25 cm of snow on eastern Ontario. In the Eastern Town-ships, heavy rain and mild temperatures caused some rivers to rise alarmingly. Highways in both provinces had to be closed because of heavy blowing snow. Snowfalls were above normal in eastern Quebec, breaking several monthly pre-cipitation records. Blanc Sablon was buried under 182 cm of snow. Snowfalls in northern Quebec were also substan-tial, ranging up to 75 cm.
In Atlantic Canada several storms produced wintry weather conditions: very high winds, (60 kmlh or more), blowing snow and well above normal precipitation amounts. Snowfalls var-ied considerably from area to area. On January 4, Moncton set a new 24-hour snowfall record of 66 cm, while winds of 160 kmlh caused whiteouts on Prince Edward Island. On January 14, winds gusted to 148 kmlh at Daniel's Har-bour, Nfld. On January 20, heavy rains in excess of 40 mm fell on Nova Scotia,

while southern Newfoundland was in-undated with a 24-hour record 75-mm rainfall. There was heavy flooding along the Salmon River in central Nova Scotia. Frequently Labrador blizzards resulted in snow depths of nearly 200 cm. Total snowfall at St. Anthony, Nfld., was 161 cm.
Temperatures fluctuated and both daily and monthly records were broken. There were several mild spells, but the warmest temperatures occurred towards the end of the month, climbing into the teens.
On January 27 and 28, new monthly high temperature records were estab-lished in Prince Edward Island, Nova Scotia and Newfoundland. Ice condi-tions in the Gulf of St. Lawrence were severe. Persistent northwesterly winds pushed heavy pack-ice through the Cabot Strait, and many ships were unable to make headway through the ice. On the east coast of Newfoundland, ice developed later than in the previous two years and ships needed little navi-gational assistance.
FEBRUARY While cold Arctic air invaded west-ern Canada, temperatures moderated sharply in the Arctic, breaking many daily high temperature records. At the same time, blizzards, blowing snow and winds gusting to 100 kmlh were fre-quent. Watson Lake in the Yukon set an all-time high monthly maximum temperature of 9.4°C on February 23. Pacific weather systems gave periods of heavy precipitation to southern British Columbia and Alberta. Temperatures fluctuated markedly as Arctic and Paci-fic air masses alternated. Heavy snow-falls, blizzards and whiteouts in the in-terior closed the Trans-Canada Highway on a number of occasions. At Vancouver
DEPARTURE FROM NORMAL OF
MEAN TEMPERATURE ('C)
DECEM BER 1985 TO FEBRUARY 1986
Harbour a new monthly low tempera-ture record was set, -6.7°C, while at Vancouver, the mercury reached 18.4°C, setting a monthly high temperature record. At Victoria Gonzales, 17.4°C was the warmest February tempera-ture since 1898. During the last week the warm weather triggered many avalanches, and caused considerable flooding on the lower mainland.
Record cold and snowy weather hit the western prairies during mid-month; the Pincher Creek area of Alberta received more than 70 cm of snow. It was a very dry month in central Sas-katchewan; The Pas, Manitoba, re-ceived only 2.8 mm of precipitation. The final week was very warm and windy. In southern Alberta 54 cm of snow on the ground disappeared in less than a week. The heavy runoff caused flash floods in many low-lying areas. By the end of the month most of the snow had disappeared in farming areas, again giving rise to increased incidents of blowing dust. Sunshine was plentiful in western Canada, except in southern Manitoba, where it was one of the cloudiest months on record.
In northwestern and southwestern Ontario snowfalls were heavier than normal. Windsor received 67 cm of snow, almost three times the normal. Two major snowstorms crossed south-ern Ontario, each leaving behind 15 to 20 cm of snow. Widespread fog and freezing precipitation, which eventual-ly made its way into southern Quebec, covered a large portion of Ontario after mid-month, disrupting transportation.
Relatively fine, but cold weather prevailed in Quebec during the first part of the month. Gaspe set two February records: lowest precipitation of 15.4 mm, less than half the previous record; lowest total snowfall of21.6 cm.
PER CENT OF NORMAL PRECIPITATION
DECEMBER 1985 TO FEBRUARY 1986
Elsewhere snowfalls generally exceed-ed 40 cm, and ranged as high as 72 cm at Blanc Sablon.
In the Maritimes, it was the sunniest February since 1972, but snowfalls were substantial in most areas, includ-ing Newfoundland. Sydney, N.S., re-ceived 152 cm of snow, more than double the normal, while Greenwood had 99 cm, the heaviest snowfall since 1972. Snowfalls on the Burin Peninsula in Newfoundland exceeded 100 cm, more than twice the normal. On Febru-ary 22 and 23, Cape Breton was paralysed by the largest two-day snow fall, 75 cm, since records began in 1870. St. John's, Nfld., received more than 100 mm of rain, even experiencing a thunderstorm earlier in the month. Strong winds buffeted the East Coast, frequently reaching nearly 100 kmlh, causing blowing snow and whiteouts. At Twillingate, Nfld., on February 16, winds gusted to 145 kmlh in a snow-storm, which dumped 45 cm of snow on parts of Newfoundland; meanwhile heavy rains caused flooding on the Avalon Peninsula. The below normal temperatures and strong winds resulted in one ,of the worst ice situations in years in the Gulf of St. Lawrence. Four Canadian ice-breakers were busy trying to keep the shipping routes open through the heavy pack-ice congesting Cabot Strait. Off the east coast of Newfound-land, the Labrador ice-pack extended farther south than usual, forcing drill-ing rigs to leave the Hibernia oil fields. However an open water lead allowed ships to sail as far north as Bonavista without assistance.
Andy Radomski is engaged in climate modelling and prediction studies in the Canadian Climate Centre and is Editor of the AES periodical Climatic Perspectives.
57

GUIDE DE LA METE ORO LOGIE. Par G.D. Roth et A. Gillot-Petre. Delachaux et Niestle, 1984 (1979 pour l'edition allemande), 14 chapitres, 248 p., 19,95 $.
Ce Guide de la meteorologie est un volume tres attirant; en effet, il contient une grande variete de photos couleurs, de belles illustrations et plusieurs cartes meteorologiques. Le profane, it qui ce livre est destine, voudra surement se Ie procurer, surtout qu'il est it un prix raisonnable.
L'edition originale de ce livre a ete publiee en Allemagne en 1979 et sa version fran"aise ne souffre pas des defauts relatifs it la traduction que l'on retrouve dans d'autres ouvrages.
Dans sa preface, A. Gillot-Petre s'ad-resse it ses compatriotes fran"ais de fa"on assez crue afin de secouer leurs vieilles conceptions en meteorologie. Cet auteur et homme public en France a aussi redige Ie premier chapitre, ou il presente, sur un ton un peu plus serieux, mais dans un langage simple et clair, une information interessante sur les satellites meteorologiques.
Dans Ie second chapitre, l'auteur (G.D. Roth) aborde les questions tou-chant la composition et la structure de l'atmosphere, Ie rayonnement, la con-tinentalite, etc. et leurs liens avec Ie temps qu'il fait. Le troisieme chapitre
discute de nombreux phenomenes me-teorologiques de fac;on tres originale et que je n'ai retrouve dans aucun volume recent. L'auteur presente 32 pheno-menes accompagnes d'une photo cou-leur pleine page (pour la plupart) et qui sont traites selon les quatre themes suivants : observation du phenomene, physique du phenomene, meteorologie, previsions que l'on peut en tirer. Les sujets dont on parle vont du clair de lune it la neige en passant par les halos, les eclairs, Ie brouillard, etc. et Ie ciel bleu. Les photos que l'auteur a choisies sont toutes tres belles et certaines sont meme spectaculaires. Les photos clas-siques des 10 genres de nuages ne figurent pas dans ce chapitre; elles sont vers it la fin du livre et en noir et blanc plut6t qu'en couleur. II aurait peut-etre ete plus approprie de decrire les nuages dans ce chapitre puisque l'on y fait reference assez sou vent. La description de ces phenomenes demande aussi une certaine connaissance des notions qui ne sont traitees que plus loin dans Ie livre. Ainsi, il est fort probable qu'une re-Iecture s'imposera au lecteur non familier avec la meteorologie.
Le chapitre suivant traite des ele-ments de la meteorologie; on y discute de la pression, de la temperature, de l'humidite, des variations diurne et saisonniere, des vents et on y donne une explication sommaire de l'equilibre geo-strophique mais sans aborder les sys-temes meteorologiques. Vient ensuite l'explication des cartes du temps ou on presente les symboles de pointage puis
Ie chapitre suivant analyse les grandes situations meteorologiques d'Europe. On presente 18 situations avec cartes en surface et it 500 mb que l'on traite selon les themes suivants: circulation, loca-tion, evolution du temps, frequences et situations apparentees. Ces analyses sont tres interessantes pour Ie lecteur qui pourra se familiariser davantage avec les cartes et les situations meteoro-logiques. Cependant, no tons que les concepts de fronts et masses d'air ne sont presentes qu'au chapitre suivant qui se veut un approfondissement de la me-teorologie. Ce dernier veritable chapitre donnera peut-etre au lecteur une im-pression de repetition, ce qui n'est peut-etre pas une mauvaise chose pour celui qui n'a aucune connaissance prealable.
Le livre s'acheve par de courtes sections qui presentent sommairement les services meteo, les 10 genres de nuages, l'etat de la mer en fonction du vent, la carte du temps marin et l'observation du temps. Un court lexique, quelques adresses et un index terminent l'ouvrage. II n'y a pas de bibliographie.
Ce volume a un caractere tres euro-peen et, par consequent, il n'est pas necessairement approprie pour Ie lec-teur nord-americain. Neanmoins, et malgre quelques defauts, ce livre plaira au lecteur interesse grace it des presen-tations originales et it un montage (photos, graphiques) tres reussi.
Richard Leduc
UIDE DE
1. Contenu de I'article, langu et lecteurs On voua invite it pr~senter des artioles d'ordre g~n6ral, rMig~s soit en anglais, soit en fran~isJ dans Ie domaine de la m6Morologie et de I'oc~anographiet et qui conviennent it des lecteurs du niveau scolaire secondaire. Les opinions exprim6es dans Ie texte retliltent celles de I'auteur.
2; Longueur et format La longueur sugg6r6e d'un al'tic\e est de 1500 a 3000 mots, avec deux it quatre figures . (et 16gendes). La pr6fientation de photo-graphies et d'i1lua,trations nettes est pal'ticullilrement encourag~e. Les auteurs sont pl'i6s de (ournir un r6sum6 de 100 it 200 mots, de pr~ference dans l'autre langue officie'le. Au besoin, les resum6s seront traduits et publi6s dans l'autre langue.
3. References Les citations litteraires dans Ie texte meme sont a ~viter. On su~gilre plutOt d'y indiquer Ie nom des auteurs ou de I~organisme It qUI Ie m6rite est attribu6 et d'ajouter, it. la fin de l'article, les r~f6rences sous forme d'une Hate brilve de • lectures recomman-d6es ». Toute r6f~rence it. un article de revue doit comporter Ie nom et les initiales du ou.des auteurs, I ann~e de publication, Ie titre de I'article en entier, II! nom de la revu.e, Ie num6l'o du volume et Ie numero des,pal(es concemees. La mention d'un liVTe doit arborer Ie nom et les initlales du ou des auteurs l'ann6e de publication, Ie titre du livre, et Ie nom et I'adresse de la maison d'edition. Toutes. les r6ferenees doivent i!tre pr~senUes dans I'ordre alphaMtique selon Ie nom de fainille de I'auteur principal.
58 Chinook Summer/Ete 1986
4. Mode de pr6sentation des articles Le manuscrit doit etl'e dactylographie a double interligne et soumis en deux exemplaires A : R~.dacteur du CMnook, als de 1.a Soci~te canadienne de m~~orologie et d'oc6anographiet,151, rue Slater, suite 805, Ottawa (0ntario), Canada, K1P oRa. Les ~preuves finales des figures tracees et les phooographies en noir et blanc-de bonne qualite (l'original et deux photocopies de chacune) doivent accompagner Ie manusel'it. Nous raisons bon aecueil aux illustrations ou photographies en couleurs qui pourraient paraitre en page couverture du num6ro. Le!! auteurs son pl'i6s de fournir una breve description (50 mots environ) de leur affiliation professionneUe (Ie cas ecMant) et de leur interet en meteorologie et en oeeanographie; Hs devraient de plus indiquer si leur article a dejA ete publi6 ,ailleurs ou Ie sera plus tard.
5. PoUtique de redaction Le r~dacteur encbef d~oidera de la pertinence des articles Ii publier en consultation avec au moins un autre membre du conseil de r~daction. On pretera une attention toute particuliilre Ii la lisibilite des articles par des profanes.
6. Tires A part On.ne POUlTS pss faire reimprimer les articles. L'auteur principal recevra quatre · tir.~~ a part du numero de parution ~e I'article. Des exemplalres ad.ditionnels seront fourms au fraLs de l'auteur pourvu que la demande soitJaite avant I'impression.

PROFESSIONAL AND BUSINESS DIRECTORY CLIMATOLOGICAL CONSULTING CORPORATION. Route 2, Box 372, Asheville, NC 28805. (704) 298-4237.
METEOROlOGICAl INSTRUMENTS A complete range of instruments end ayatems to meet eU your land baaed requirements. • Temperature and Humidily recorders. sensors, indicators,
transmitters • Thermometers, maximum and minimum (10 A.E.S
opeclfic.donsl • Wiod rccordorS.lJnd Iransmlt1ers • Solar radiation and duration instruments • Rain gauges, transmitters and recorders • Precipilalion and evaporation recorders • Barographs and precision barometers
~ t • Complete weather stations ~_ • Compatible recorders, controllers and indicators.
P,O. Box 20, Sin. "U", Toronto, Onl MSZ 5M4 (416) 231·5335
METEOROLOGICAL &
ENVIRONMENTAL
P LANNING LTD,
S OLVING INDUSTRY'S PROBLEMS IN POLLUTION CONTROL
DATA NEEDS
MODELING
REGULATION
Monitoring Networks Meteorological and Air Quality Studies Climatological and Dispersion Analysis
Dispersion Model Development/Evaluation Atmospheric Process Modeling
Environmental Modeling
Environmental Impact Assessment/Review
Control Strategies Expert Representation
7050 Woodbine Ave •• Suite 100 Markham, Ontario, Canada, L3R 4G8
(416) 477-0870, Telex 06·966599
THE MEl=» COM~NV
M.I.C. COMPANY. Acid Rain Collectors, Data Acquisition Systems, Mini-sondes. 216 Duncan Road, Thornhill, Onto L4C 6P3. (416) 889-6653.
GEOTEST INSTRUMENT CORP. Ice and snow testing instruments. Catalogue available. P.O. Box 59114-C, Chicago, IL. 60645 (312) 677-0780 Telex 206175
~. ATMOSPHERE·OCEAN
"'~ ~ ... .. ~ ... Canadian Meteorological and Oceanographic Society
La Societe Canadienne de Meteorologie et d' Oceanographie
Une revue scientifique qui traite de la recherche meteorologique et oceanographique 11 l'echelle intemationale . Publication trimestrielle.
BULLETIN DE NOUVELLES DE LA SCMO Pour vous tenir au courant des activites de la Societe canadienne de meteorologie et d'oceanographie. Publie six fois par annee.
BULLETIN CLIMATOLOGIQUE Recherche climatologique et actualites. Publil! trois fois par annee.
Ces publications sont disponibles aupres de la SCMO, Suite 805, 151, rue Slater, Ottawa (Ontario) KIP 5H3.
THE CANADIAN MAGAZINE OF WEATHER AND OCEANS WHAT? Chinook is a popular magazine concerned with two major components of the Canadian environment - the atmosphere and the oceans. It is published quarterly by the Canadian Meteorological and Oceanographic Society (CMOS).
Features in Chinook include articles, weather summaries, interpretations of satellite and other photographs, and news and notes. These appear in the language submitted (English or French). In addition, summaries of all articles appear in the other language.
WHY? The aims of Chinook are • to increase public awareness of mete
orology and oceanog raphy in Canada and of their modern scientific and technological aspects and achievements
• to stimulate public interest in and understanding of the impact of climate, weather and oceans on Canadian society and economics
• to inform Canadians about the education, information and interpretative services available to them on climate, weather and oceans
WHO? Features in Chinook are chosen to appeal particularly to • secondary school and community col
lege students • farmers, fishermen and foresters
SUBSCRJPT[ON ORDER
Plea"" e n ter my 8ub""rip~lon 1.0 h in«>It for one year () 986, 4 "",ues) 0< ~h" fo ll owing rotc (plea"" ch eck on e );
o CMOS Member 510.QO o Non ·m <lm b.". lndi yidunJ $ 12.00 o Institution $15.00
Nwno--------------------~C~"~~.R~ •• ~'N="'~--------------------
Addre~------------------------------------------~'-~--.L-~~O. '
School or University (if s tud" n ' ) ___________ ____________________ _
Mail with payment to CMOS, Suite 805, 151 Slater Street, Ottawa, Ontario KIP 5H3.
This is a D NEW order; a 0 subscription renewal. $ _____ is enclosed.
• marine-recreation, sportsandtourism operators and enthusiasts
• aviators • amateur observers of natural pheno-
mena • specialists in other sciences • environmentalists
HOW? Subscriptions to Chinook may be ordered using the handy form above.
LA REVUE CANADIENNE DE LA METEO ET DES OCEANS QUOI? Chinook est une revue de vulgarisation qui traite de I'atmosphere et des oceans - deux des importants elements qui composent I'environnement canadien. Chinook est publie tous les trois mois par la Societe canadienne de meteorologie et d'oceanographie (SCMO).
On retrouve dans Chinook des articles, des sommaires du temps, des interpretations de photos satellitaires et autres, des articles d'actualite ~t des notes. Ces articles paraissent dans la langIJe originale, Ie francais ou I'anglais; tous les resumes sont rediges dans I'autre langue.
POURQUOI? Chinook vise a : • eveiller la curiosite du public en ce
qui a trait aux aspects de la meteorologie et de I'oceanographie au Canada et a I'informer des realisations scientifiques et technologiques d'aujourd'hui;
• stimuler I'interet du public et I'aider a mieux comprendre les effets du climat, du temps et des oceans sur la societe et sur I'economie du Canada;
• renseigner les canadiens sur les services d'education, d'information et d'interpretation qui leurs sont disponibles et qui traitent du climat, du temps et des oceans.
QUI? Les articles choisis pour Chinook vise a interesser notamment :
ABONNEMENT • les etudiants d'ecoles secondaires et
de colleges communautaires
Je d~8ire m'abonner A Chinook POUT une annee (1986. 4 num6ros) au tarif Buivant (veuillez cocher):
o Membre de la SeMO 10,00$ o Non·membre 12,00$ o Institution 15,00$
Nom--------------------~C~.H~M-M~U~~~U~L~~.-•. ~y.~.,~------------------
Ad r" ... ·"--------------------------------------------;:'C=OD==."'...,.== •• ,,-; .. , tcole ou universitk (pour 6tudianU ______________________________ _
Envoyez votre paiement Ii laSCMO,Suite805, 151, rue Slater, Ottawa (Ontario), KIP5H3.
Premier abonnement 0 Renouvellement d'sbonnement 0 J'inc)uB-$
• les agriculteurs, pecheurs et agents forestiers
• les exploitants d'etablissements de nautisme, de sports et de tourisme, et les amateurs des ces activites
• les aviateurs • les observateurs amateurs de pheno
menes naturels • les specialistes d'autres sciences • les environnementalistes
COMMENT? On peut s'abonner a Chinook en envoyant Ie formulaire cicontre.