summer outlook report - national grid plc · pdf filew summer outlook report summary and...
TRANSCRIPT

Summer Outlook Report
Summary and Contents 3 April 2013
1
Summer Outlook Report 2013
Introduction 1. This document sets out National Grid’s analysis and views on the gas and electricity
systems for the coming summer. Previous outlook reports are published on National Grid’s website1.
Industry Feedback 2. National Grid continually seeks feedback on its outlook reports to increase their
usefulness to the industry and to reflect changes in trends when they become apparent. To feed back comments on this outlook report please contact us at [email protected].
Roles and Responsibilities 3. The competitive gas and electricity markets in Great Britain have developed
substantially in the last decade and have successfully established separate roles and responsibilities for the various market participants. In summary, the provision of gas and electricity to meet consumer demands and contracting for capacity in networks is the responsibility of suppliers and shippers. National Grid has two main responsibilities: first, as the primary transporter, for ensuring there is adequate and reliable network capacity to meet anticipated transportation requirements; second, as system operator of the transmission networks, for the residual balancing activity in both gas and electricity. The structure of the markets and the monitoring of companies’ conduct within it are the responsibility of Ofgem, whilst the Department for Energy and Climate Change (DECC) has a role in setting the regulatory framework for the market.
Legal Notice 4. National Grid operates the electricity transmission network through its subsidiary
National Grid Electricity Transmission plc and the gas transmission network through its subsidiary National Grid Gas plc. For the purpose of this report “National Grid” is used to cover both licensed entities, whereas in practice our activities and sharing of information are governed by the respective licences.
1 https://www.nationalgrid.com/uk/Electricity/SYS/sumOutlook/

W Summer Outlook Report
Summary and Contents 3 April 2013
2
5. National Grid has prepared this document in good faith, and has endeavoured to prepare this document in a manner which is, as far as reasonably possible, objective, using information collected and compiled by National Grid from users of the gas transportation and electricity transmission systems together with its own forecasts of the future development of those systems. While National Grid has not sought to mislead any person as to the contents of this document, readers of this document should rely on their own information (and not on the information contained in this document) when determining their respective commercial positions. National Grid accepts no liability for any loss or damage incurred as a result of relying upon or using the information contained in this document.
Copyright 6. Any and all copyright and all other intellectual property rights contained in this document
belong to National Grid. To the extent that you re-use the document, in its original form and without making any modifications or adaptations thereto, you must reproduce, clearly and prominently, the following copyright statement in your own documentation: © National Grid plc, all rights reserved.

W Summer Outlook Report
Summary and Contents 3 April 2013
3
Summer Outlook - Key Details Fuel Prices
Over the last 12 months energy prices have remained relatively stable with the exception of declining coal prices and some increased gas price volatility towards the end of March through a combination of cold weather and supply restrictions. Forward prices show a decline for oil, a marginal increase for coal, whilst those for gas and base load power show some seasonality for next winter.
For power generation, current fuel prices strongly favour coal burn over gas for the summer and beyond.
Gas
Demand forecast (maximum) – cold April day 350 mcm/d
Demand forecast (minimum) – mid summer day, limited exports / storage injection
110 mcm/d
Average summer demand – similar to 2012 actual average demand 189 mcm/d
Summer supplies – forecasts assume similar UKCS, lower LNG and potentially higher imports from Norway.
35 bcm
Electricity
Maximum demand level (during high summer) 40.3 GW
Current generator capacity 76.6 GW
Forecast minimum positive surplus at time of weekly demand maximum, based on normal demand, notified generator availability and interconnectors at float
13.5 GW
Lowest assumed generator availability at time of weekly demand maximum, assuming median wind and interconnectors at float (during high summer)
47.6 GW
Forecast minimum positive surplus at time of weekly demand maximum, based on normal demand, assumed generator availability, median wind and interconnectors at float (during high summer)
3.5 GW
Minimum demand level 20.1 GW
Forecast minimum negative surplus at time of weekly demand minimum, based on normal demand and high inflexible generation output
1.9 GW

W Summer Outlook Report
Summary and Contents 3 April 2013
4
Contents Summer Outlook Report 2013 ......................................................................... 1
Summer Outlook - Key Details ......................................................................................3
Contents ........................................................................................................................4
Fuel Prices.....................................................................................................................5
Gas................................................................................................................................8
Weather ............................................................................................................. 8
Demand Forecast .............................................................................................. 9
Supply Forecast ............................................................................................... 16
Summer 2013 NTS Maintenance Programme & Network Expansion .............. 21
Electricity .....................................................................................................................22
Demand Levels ................................................................................................ 22
Generation Fuelled by Intermittent Power Sources.......................................... 28
Generator Availability ....................................................................................... 33
Interconnector Flows........................................................................................ 36
System Operation during Low Demand Periods .............................................. 37
Transmission Issues ........................................................................................ 43

Summer Outlook Report
Fuel Prices 3 April 2013
5
Fuel Prices 7. Figure F1 shows the recent history of energy prices for coal, oil, gas, power and
carbon, and the future prices, at the time of writing.
Figure F1 - Energy Prices - History and Forwards Source: Heren, Platts & ICE
0
30
60
90
120
150
Mar-12 Sep-12 Mar-13 Sep-13 Mar-14 Sep-14
Fu
el
Pri
ces
ARA Coal Price $/tonne Baseload Power £/MWh NBP Gas Price p/thermBrent Oil Price $/bbl Carbon Price €/tonne
FUTURES
8. The chart shows a mixed picture of energy prices over the last 12 months:
• Oil prices have been relatively stable since September 2012 at around $115/bbl, having been volatile during the summer of 2012.
• Coal prices have slowly declined during the last 12 months falling about $10/tonne to just below $90/tonne.
• Gas prices were largely stable throughout summer 2012 before rising steadily throughout the winter. However during March 2013 there have been some significant price spikes driven by above normal demands and a relatively tight supply position.
• Power prices have continued to be linked with UK gas prices over the previous 12 months.
• The EU Allowances (EUAs) market for carbon has remained flat throughout 2012.

Summer Outlook Report
Fuel Prices 3 April 2013
6
9. In terms of forward prices, the chart shows:
• Oil prices slowly trending downwards throughout 2013-14
• Coal prices slowly rising to about $110/tonne by 2014
• Gas prices rising slowly with seasonal swings related to weather sensitive demand
• Power prices rising in line with gas
• European Union Emission Trading System (EUETS) carbon prices remaining very low and flat.
From 1st April a carbon price support (CPS) will be applied to fossil fuels used for electricity generation via the Climate Change Levy (CCL), this will be in addition to the EUETS. The rate for 2013/14 was set in the 2011 Budget at £4.94/tonne equivalent.
10. Figure F2 shows a view of the relative economics for generating electricity from burning coal compared to gas based on historic and forward gas and coal prices.
Figure F2 - Relative power generation economics (1) Source: Heren, Platts & ICE
-40
-20
0
20
40
Mar-12 Sep-12 Mar-13 Sep-13 Mar-14 Sep-14
£/M
Wh
FUTURES Coal Fa
voura
ble
Gas
Favoura
ble
11. Figure F2 shows a trend over the past year maintaining coal as the ‘preferred’ source of UK power generation. The forward outlook for the summer 2013 continues to favour coal despite the introduction of the carbon price support (included in both Figure F2 above and Figure F3 below).
12. This simplified approach does not fully address other factors such as individual station efficiencies, generators’ portfolios (including fuel stocks and contracts), environmental restrictions under the LCPD and plant outages. All of these will affect the amount of gas fired generation in the summer.

Summer Outlook Report
Fuel Prices 3 April 2013
7
13. Figure F3 looks at the effect of station efficiency in terms of the future summer prices for coal and gas.
Figure F3 - Relative power generation economics (2) Source: Heren, Platts & ICE
14. The chart shows a very strong bias throughout the summer period for coal to be the
favoured source of fuel for power generation over gas. The chart also highlights that a price reduction of about 30 p/therm for gas or a price increase of about $60/tonne for coal would shift the economics to a more balanced position.

Summer Outlook Report
Gas 3 April 2013
8
Gas 15. This chapter covers the gas supply-demand outlook for the forthcoming summer.
Despite storage injection and Continental exports, demands during mid summer are about half those in the winter. Supply availability during the summer is generally high but at times is reduced due to periods of maintenance and this can result in relatively high flow ranges in terms of supply source and entry terminals.
Weather 16. The Met Office has ceased publication of their long term winter weather forecast. The
Met Office web site contains a short description of the weather up to 30 days ahead2
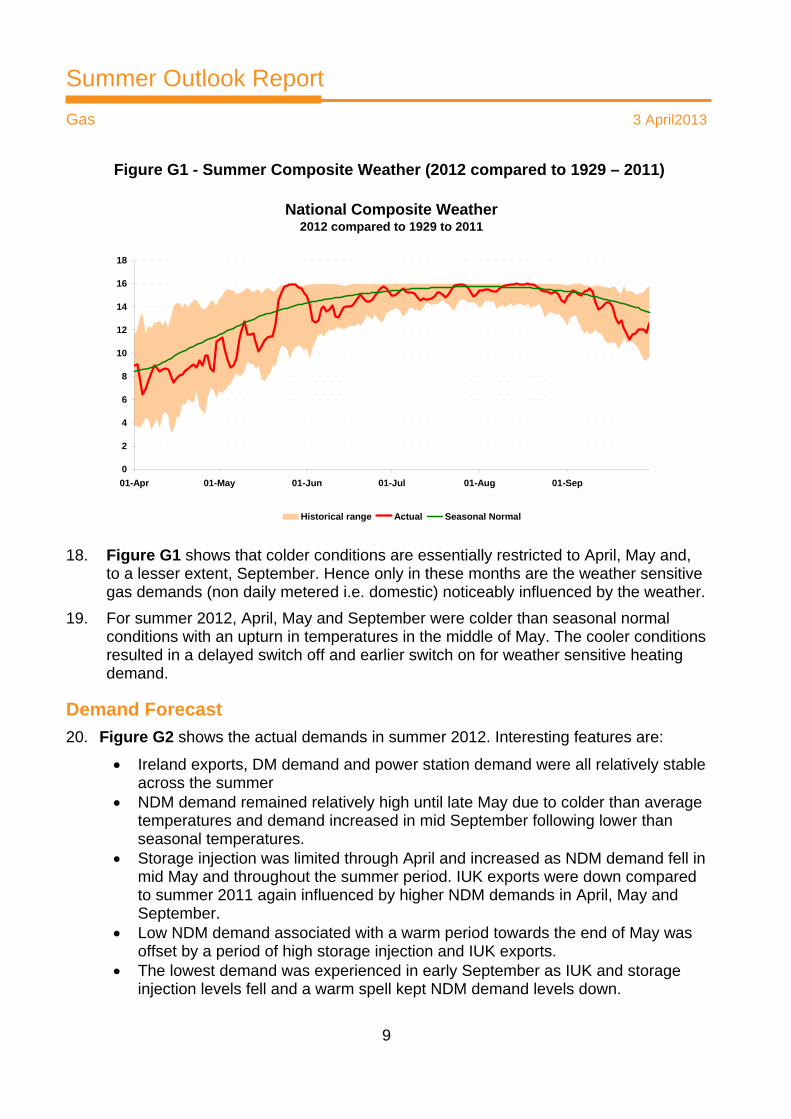
and guidance for contingency planners up to 3 months ahead3. 17. Figure G1 shows the historical Composite Weather Variable (CWV, essentially a
proxy for temperature), seasonal normal conditions and actual conditions for summer 2012. The CWV is capped at 16oC as there is little or no influence of temperature sensitive gas demand above this. This means that in the warmer months (June, July and August) there is very little variation in CWVs.
2 (http://www.metoffice.gov.uk/public/weather/forecast/?tab=map&map=SignificantWeather ) 3 http://www.metoffice.gov.uk/publicsector/contingency-planners
W
Summer Outlook Report
Gas 3 April2013
9
Figure G1 - Summer Composite Weather (2012 compared to 1929 – 2011)
National Composite Weather2012 compared to 1929 to 2011
0
2
4
6
8
10
12
14
16
18
01-Apr 01-May 01-Jun 01-Jul 01-Aug 01-Sep
Historical range Actual Seasonal Normal
18. Figure G1 shows that colder conditions are essentially restricted to April, May and,
to a lesser extent, September. Hence only in these months are the weather sensitive gas demands (non daily metered i.e. domestic) noticeably influenced by the weather.
19. For summer 2012, April, May and September were colder than seasonal normal conditions with an upturn in temperatures in the middle of May. The cooler conditions resulted in a delayed switch off and earlier switch on for weather sensitive heating demand.
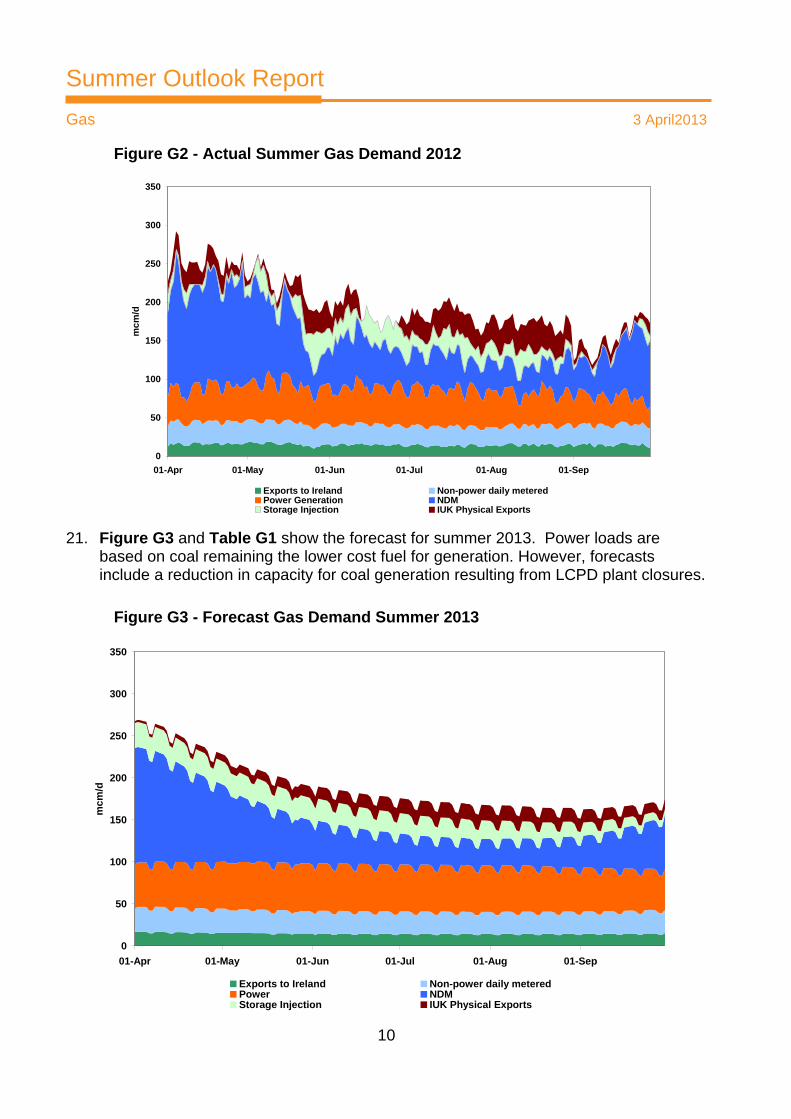
Demand Forecast 20. Figure G2 shows the actual demands in summer 2012. Interesting features are:
• Ireland exports, DM demand and power station demand were all relatively stable across the summer
• NDM demand remained relatively high until late May due to colder than average temperatures and demand increased in mid September following lower than seasonal temperatures.
• Storage injection was limited through April and increased as NDM demand fell in mid May and throughout the summer period. IUK exports were down compared to summer 2011 again influenced by higher NDM demands in April, May and September.
• Low NDM demand associated with a warm period towards the end of May was offset by a period of high storage injection and IUK exports.
• The lowest demand was experienced in early September as IUK and storage injection levels fell and a warm spell kept NDM demand levels down.
W
Summer Outlook Report
Gas 3 April2013
10
Figure G2 - Actual Summer Gas Demand 2012
0
50
100
150
200
250
300
350
01-Apr 01-May 01-Jun 01-Jul 01-Aug 01-Sep
mcm
/d
Exports to Ireland Non-power daily meteredPower Generation NDMStorage Injection IUK Physical Exports
21. Figure G3 and Table G1 show the forecast for summer 2013. Power loads are based on coal remaining the lower cost fuel for generation. However, forecasts include a reduction in capacity for coal generation resulting from LCPD plant closures.
Figure G3 - Forecast Gas Demand Summer 2013
0
50
100
150
200
250
300
350
01-Apr 01-May 01-Jun 01-Jul 01-Aug 01-Sep
mcm
/d
Exports to Ireland Non-power daily meteredPower NDMStorage Injection IUK Physical Exports

W
Summer Outlook Report
Gas 3 April2013
11
Table G1 - Forecast Average Daily Gas Demand for Summer 20134 (mcm/d) April to
September Daily average Actual range Forecast
range
mcm/d 2012
actual
2012 weather
corrected2013
forecast2012 low
2012 high
2013 low
2013 high
NDM 71 61 56 30 171 25 210 DM + Industrial 26 24 27 22 31 22 33 Ireland Exports 15 15 15 10 19 10 20 Total Power 45 45 53 23 64 35 100 Total demand 159 148 153 100 268 110 300 IUK export 21 21 14 0 48 0 50 Storage injection 17 17 23 0 53 0 50 GB Total 196 169 189 120 294 110 350
22. Table G1 shows the daily average and forecast range in demand compared with the
actual values in 2012. The 2013 forecast average values are derived using seasonal normal conditions.
23. For NDM daily demand we have used the previous 30 year weather history to identify the possible range of demand for 2013.
24. It is evident that the 2012 summer period was colder than seasonal normal summer periods, resulting in a higher than average summer NDM demand to that experienced in 2011 and forecast for 2013. However, Great Britain has experienced a wider range of demand variations in the past. Accordingly, the forecast range for 2013 remains wider than experienced in 2011 and 2012 (Figure G4).
25. It is also worth noting that the range for storage injection on a particular day was greater than forecasted in 2012. This was perhaps due, once again, to the delayed reduction in NDM demand that appears to have reduced the period for storage injection overall but led to high volumes of storage in May as temperatures fell (Figure G2). Accordingly, we have set the high and low daily values based on a view from historic experience.
26. Figure G4 to Figure G7 show the summer demands for NDM, DM and Industrial, Ireland exports and power generation for the last two years and the forecast for 2013. Each chart shows a line to represent the average and a shaded area to show the range in daily demand. The blue bars show the figures for the 6 months from April to September and the brown bars show the figures for the 3 warmest months from June to August.
4 Range totals do not add up due to diversity i.e. for cold conditions and high demand maximum IUK exports or maximum storage injection would not be expected
W
Summer Outlook Report
Gas 3 April2013
12
Figure G4 – Forecast NDM Gas Demand
NDM
0
50
100
150
200
250
20116-month
20126-month
20136-month
20113-month
20123-month
20133-month
mcm
/d
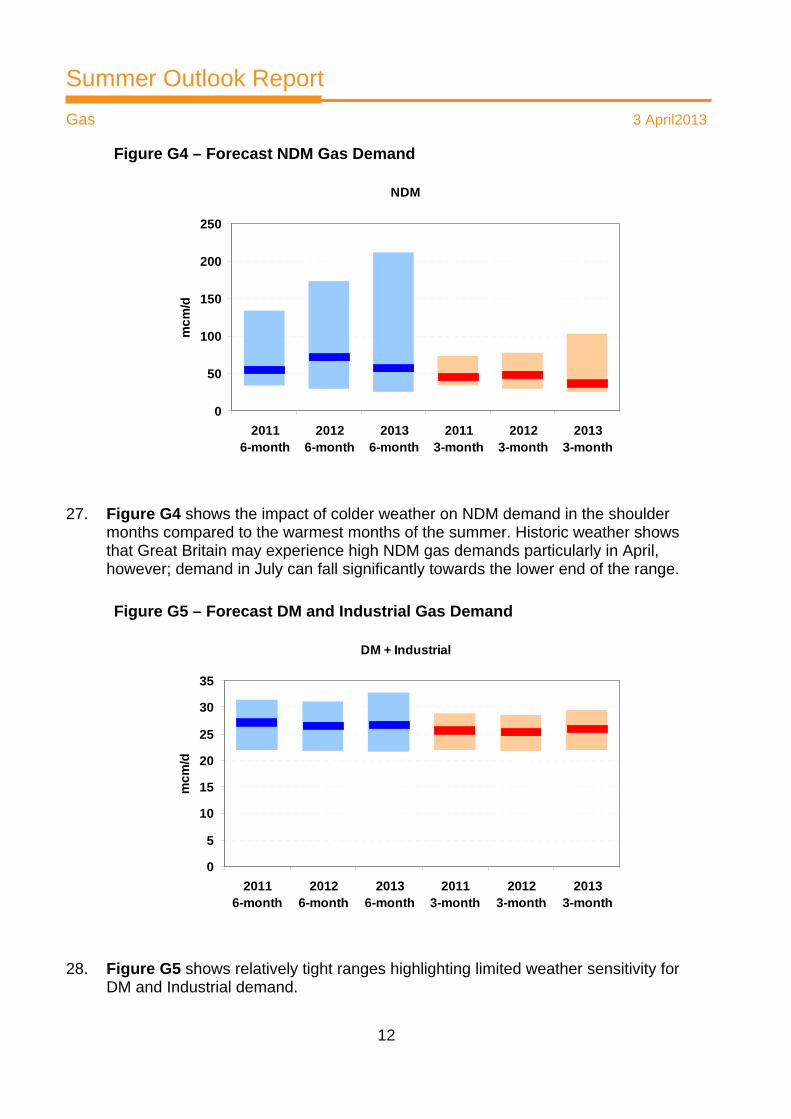
27. Figure G4 shows the impact of colder weather on NDM demand in the shoulder
months compared to the warmest months of the summer. Historic weather shows that Great Britain may experience high NDM gas demands particularly in April, however; demand in July can fall significantly towards the lower end of the range.
Figure G5 – Forecast DM and Industrial Gas Demand
DM + Industrial
0
5
10
15
20
25
30
35
20116-month
20126-month
20136-month
20113-month
20123-month
20133-month
mcm
/d
28. Figure G5 shows relatively tight ranges highlighting limited weather sensitivity for
DM and Industrial demand.

W
Summer Outlook Report
Gas 3 April2013
13
Figure G6 – Forecast Ireland Exports Gas Demand
Ireland Exports
0
5
10
15
20
25
20116-month
20126-month
20136-month
20113-month
20123-month
20133-month
mcm
/d
29. Figure G6 shows a decline in Ireland exports levelling out in 2013. This has primarily
been due to the decline in the Irish economy, potentially less use of gas for power generation due to relatively high gas prices and increasing renewable generation.
Figure G7 – Forecast Power Generation Gas Demand
Power Generation
0
20
40
60
80
100
120
20116-month
20126-month
20136-month
20113-month
20123-month
20133-month
mcm
/d
30. Figure G7 shows the possibility of a considerable range in terms of the power
generation demand forecasts for 2013. If power generation gas demand reverts to base load, as it often has in the summer, then demand may tend towards a higher

W
Summer Outlook Report
Gas 3 April2013
14
level. If the current gas and coal prices are maintained into the summer it will be more economical to generate using coal resulting in lower demands. This situation was experienced in the summer of 2012. However, a number of coal plants are expected to close, leading to a higher dependence on gas to last summer.
31. For summer 2013 we are anticipating the commissioning of a gas fired power station at West Burton. Since last summer there have been closures of coal and oil plant at Kingsnorth and Grain Oil and over the spring of 2013 Cockenzie, Didcot (coal), and Fawley Oil have announced closure dates.
Table G2 - Total Volume of Summer Demand for 2012 and Forecast for 2013 (bcm)
bcm Summer total
2012 actual
2012 weather
corrected2013
forecastNDM 13.0 11.2 10.3 DM + Industrial 4.8 4.7 4.9 Ireland Exports 2.7 2.7 2.7 Total Power 8.3 8.3 9.8 GB Total 29.0 27.1 27.9 IUK Export 3.9 3.9 2.5 Storage Injection 3.0 3.0 4.1 Total 36.0 34.0 34.6
32. Table G2 shows a similar forecast for the total volume of summer gas demand in
2013. This is driven by lower assumptions of NDM demand offset by a higher power generation demand.
33. Overall demand for net storage injection over summer 2013 is expected to be higher than in summer 2012, at approximately 4.1bcm. This has been driven by greater depletion of storage stocks during winter 2012/13 compared with the previous winter. The commissioning of Hill Top Farm and the potential for injection into the Stublach facility (currently under construction) may provide a further upside to storage injection demand.
W
Summer Outlook Report
Gas 3 April2013
15
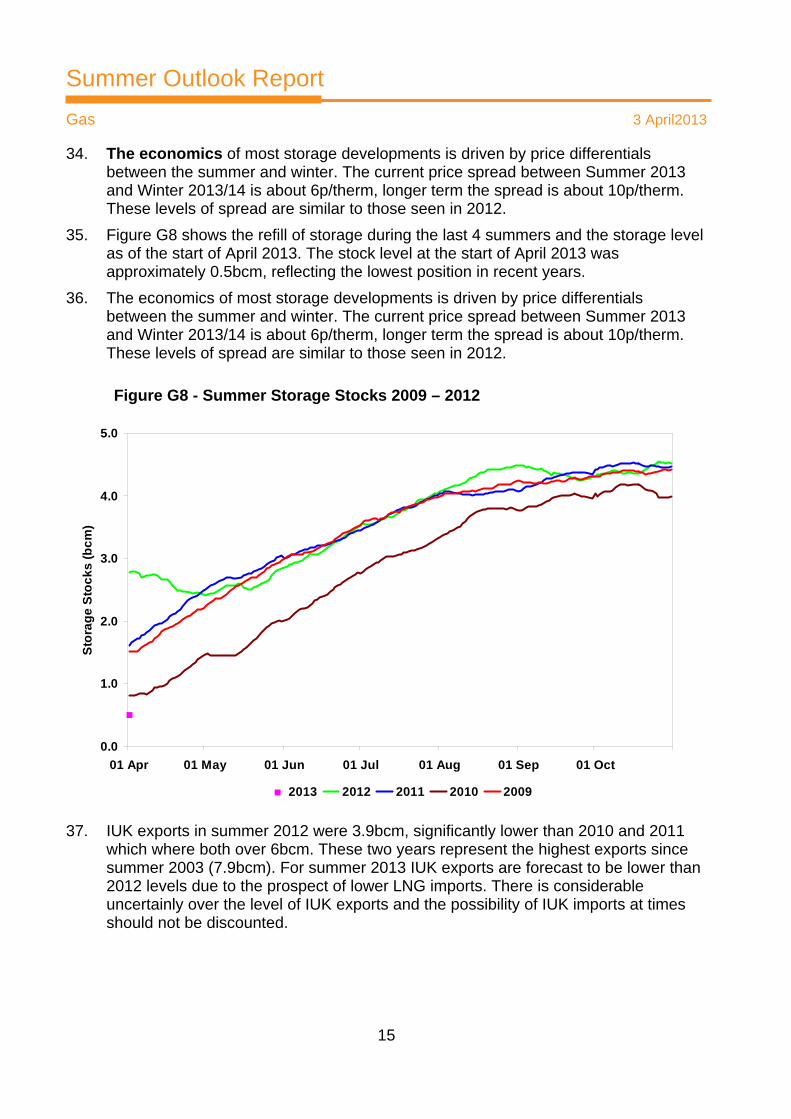
34. The economics of most storage developments is driven by price differentials between the summer and winter. The current price spread between Summer 2013 and Winter 2013/14 is about 6p/therm, longer term the spread is about 10p/therm. These levels of spread are similar to those seen in 2012.
35. Figure G8 shows the refill of storage during the last 4 summers and the storage level as of the start of April 2013. The stock level at the start of April 2013 was approximately 0.5bcm, reflecting the lowest position in recent years.
36. The economics of most storage developments is driven by price differentials between the summer and winter. The current price spread between Summer 2013 and Winter 2013/14 is about 6p/therm, longer term the spread is about 10p/therm. These levels of spread are similar to those seen in 2012.
Figure G8 - Summer Storage Stocks 2009 – 2012
0.0
1.0
2.0
3.0
4.0
5.0
01 Apr 01 May 01 Jun 01 Jul 01 Aug 01 Sep 01 Oct
Stor
age
Stoc
ks (b
cm)
2013 2012 2011 2010 2009
37. IUK exports in summer 2012 were 3.9bcm, significantly lower than 2010 and 2011 which where both over 6bcm. These two years represent the highest exports since summer 2003 (7.9bcm). For summer 2013 IUK exports are forecast to be lower than 2012 levels due to the prospect of lower LNG imports. There is considerable uncertainly over the level of IUK exports and the possibility of IUK imports at times should not be discounted.

W
Summer Outlook Report
Gas 3 April2013
16
Supply Forecast 38. Figure G9 shows the make up of summer supplies by supply source since 2001 and
also the forecast for 2013. The forecast for 2013 is based primarily on recent trends of summer supply.
Figure G9 - Historic and Forecast Summer Gas Supplies by Source
-20
-10
0
10
20
30
40
50
2001 2002 2003 2004 2005 2006 2007 2008 2009 2010 2011 2012 2013
bcm
Storage UKCS Norway IUK BBL LNG IUK Exports
39. Figure G9 shows:
• Similar levels of summer supply / demand of about 35bcm on a weather corrected basis
• Higher imports from Norway but lower imports of LNG and supplies from the UKCS
40. In 2013, new LNG production is expected in Algeria and Angola, the extra liquefaction capacity (~7bcm/a) is shown in Figure G10.
41. However some recent reports state that additional capacity in Algeria may run below capacity and fulfill existing contracts, while older plant is mothballed. Although the start up of the Angola project may provide some relief to the market, it is thought that significant quantities of Angolan LNG will be sent to Asia. In February 2013, a major outage on a feedgas pipeline at the ~30bcm/y Nigerian LNG liquefaction plant significantly reduced the terminal’s output. It is unclear how long this outage will last. Although Angolan LNG could be sent to the UK, Qatar is likely to remain the largest supplier over the summer period.
W
Summer Outlook Report
Gas 3 April2013
17
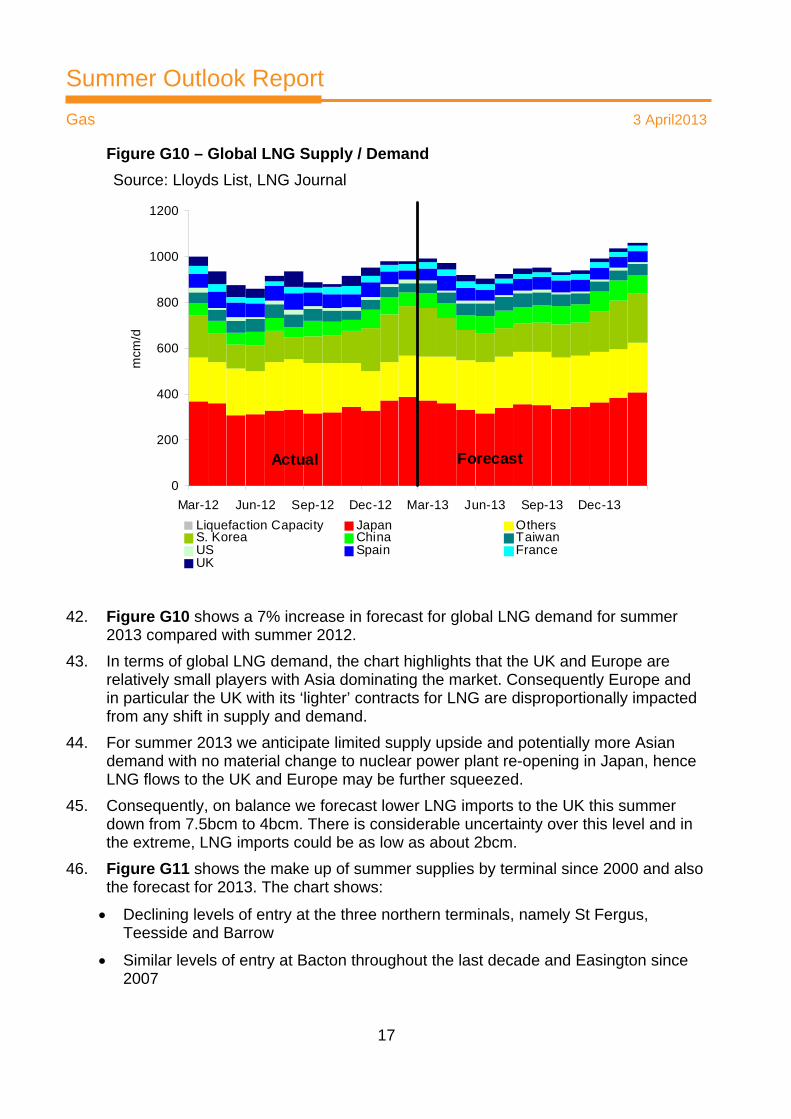
Figure G10 – Global LNG Supply / Demand Source: Lloyds List, LNG Journal
0
200
400
600
800
1000
1200
Mar-12 Jun-12 Sep-12 Dec-12 Mar-13 Jun-13 Sep-13 Dec-13
mcm
/d
Liquefaction Capacity Japan OthersS. Korea China TaiwanUS Spain FranceUK
Actual Forecast
42. Figure G10 shows a 7% increase in forecast for global LNG demand for summer 2013 compared with summer 2012.
43. In terms of global LNG demand, the chart highlights that the UK and Europe are relatively small players with Asia dominating the market. Consequently Europe and in particular the UK with its ‘lighter’ contracts for LNG are disproportionally impacted from any shift in supply and demand.
44. For summer 2013 we anticipate limited supply upside and potentially more Asian demand with no material change to nuclear power plant re-opening in Japan, hence LNG flows to the UK and Europe may be further squeezed.
45. Consequently, on balance we forecast lower LNG imports to the UK this summer down from 7.5bcm to 4bcm. There is considerable uncertainty over this level and in the extreme, LNG imports could be as low as about 2bcm.
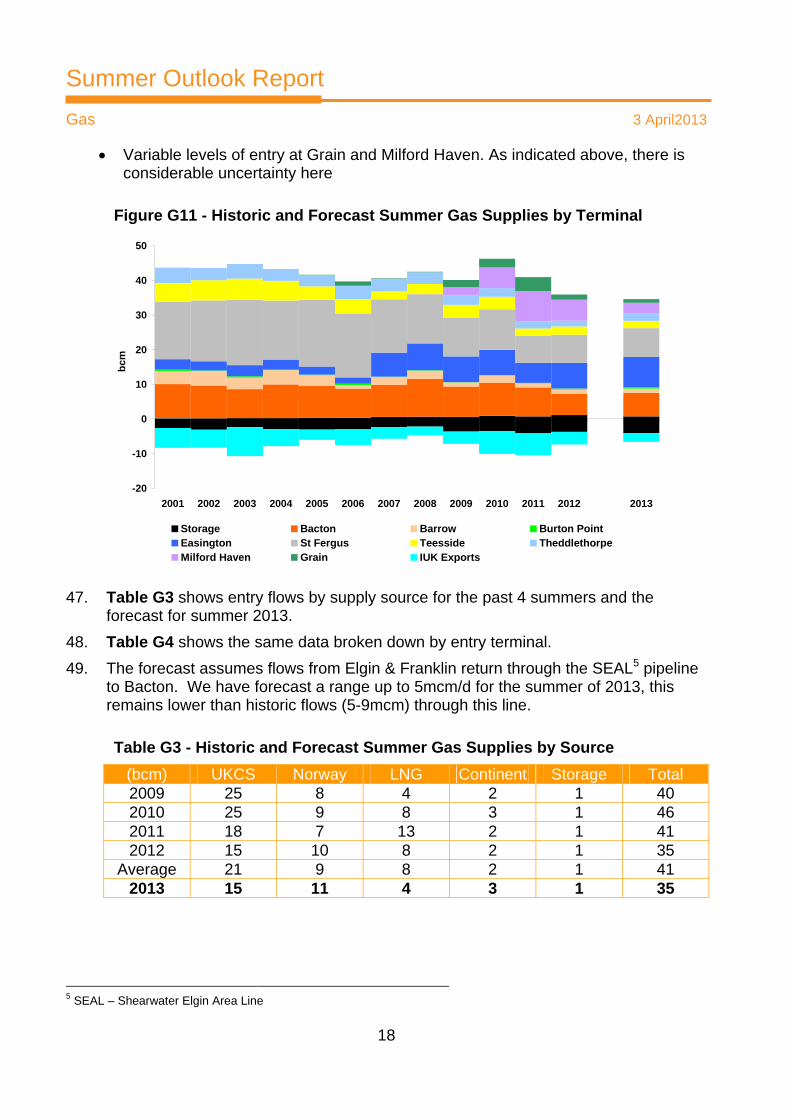
46. Figure G11 shows the make up of summer supplies by terminal since 2000 and also the forecast for 2013. The chart shows:
• Declining levels of entry at the three northern terminals, namely St Fergus, Teesside and Barrow
• Similar levels of entry at Bacton throughout the last decade and Easington since 2007
W
Summer Outlook Report
Gas 3 April2013
18
• Variable levels of entry at Grain and Milford Haven. As indicated above, there is considerable uncertainty here
Figure G11 - Historic and Forecast Summer Gas Supplies by Terminal
-20
-10
0
10
20
30
40
50
2001 2002 2003 2004 2005 2006 2007 2008 2009 2010 2011 2012 2013
bcm
Storage Bacton Barrow Burton PointEasington St Fergus Teesside TheddlethorpeMilford Haven Grain IUK Exports
47. Table G3 shows entry flows by supply source for the past 4 summers and the forecast for summer 2013.
48. Table G4 shows the same data broken down by entry terminal. 49. The forecast assumes flows from Elgin & Franklin return through the SEAL5 pipeline
to Bacton. We have forecast a range up to 5mcm/d for the summer of 2013, this remains lower than historic flows (5-9mcm) through this line.
Table G3 - Historic and Forecast Summer Gas Supplies by Source (bcm) UKCS Norway LNG Continent Storage Total 2009 25 8 4 2 1 40 2010 25 9 8 3 1 46 2011 18 7 13 2 1 41 2012 15 10 8 2 1 35
Average 21 9 8 2 1 41 2013 15 11 4 3 1 35
5 SEAL – Shearwater Elgin Area Line
W
Summer Outlook Report
Gas 3 April2013
19
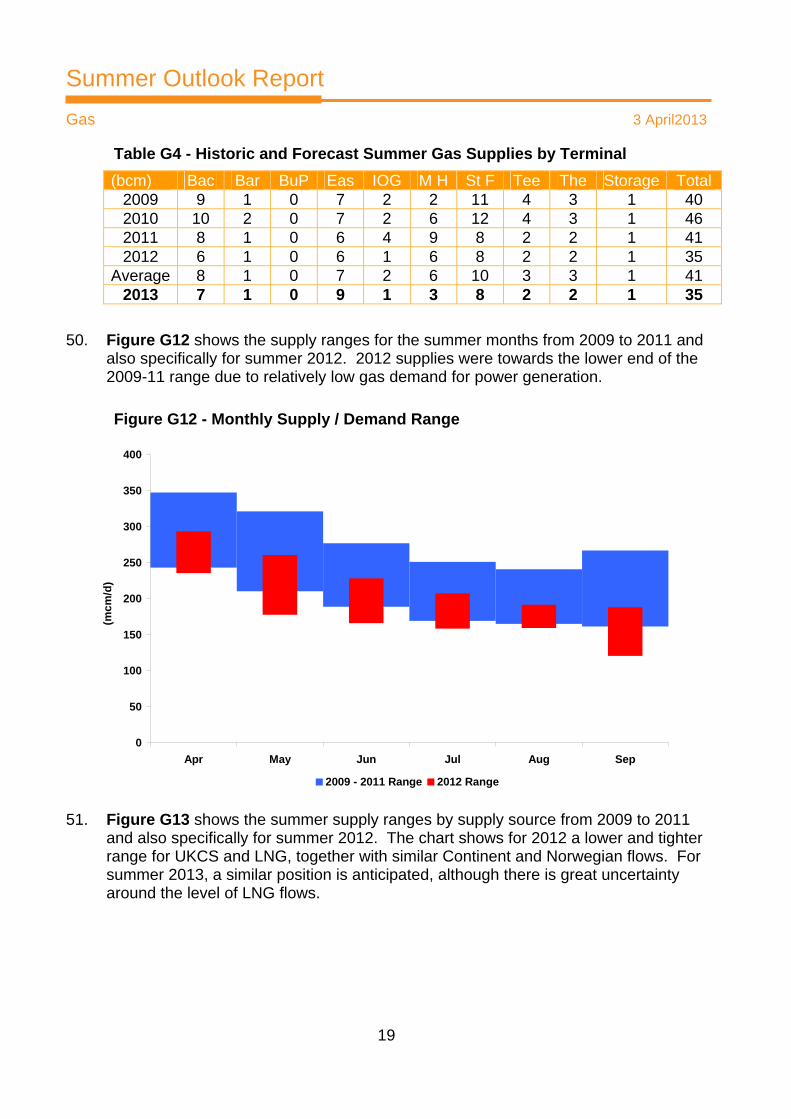
Table G4 - Historic and Forecast Summer Gas Supplies by Terminal (bcm) Bac Bar BuP Eas IOG M H St F Tee The Storage Total
2009 9 1 0 7 2 2 11 4 3 1 40 2010 10 2 0 7 2 6 12 4 3 1 46 2011 8 1 0 6 4 9 8 2 2 1 41 2012 6 1 0 6 1 6 8 2 2 1 35
Average 8 1 0 7 2 6 10 3 3 1 41 2013 7 1 0 9 1 3 8 2 2 1 35
50. Figure G12 shows the supply ranges for the summer months from 2009 to 2011 and
also specifically for summer 2012. 2012 supplies were towards the lower end of the 2009-11 range due to relatively low gas demand for power generation.
Figure G12 - Monthly Supply / Demand Range
0
50
100
150
200
250
300
350
400
Apr May Jun Jul Aug Sep
(mcm
/d)
2009 - 2011 Range 2012 Range
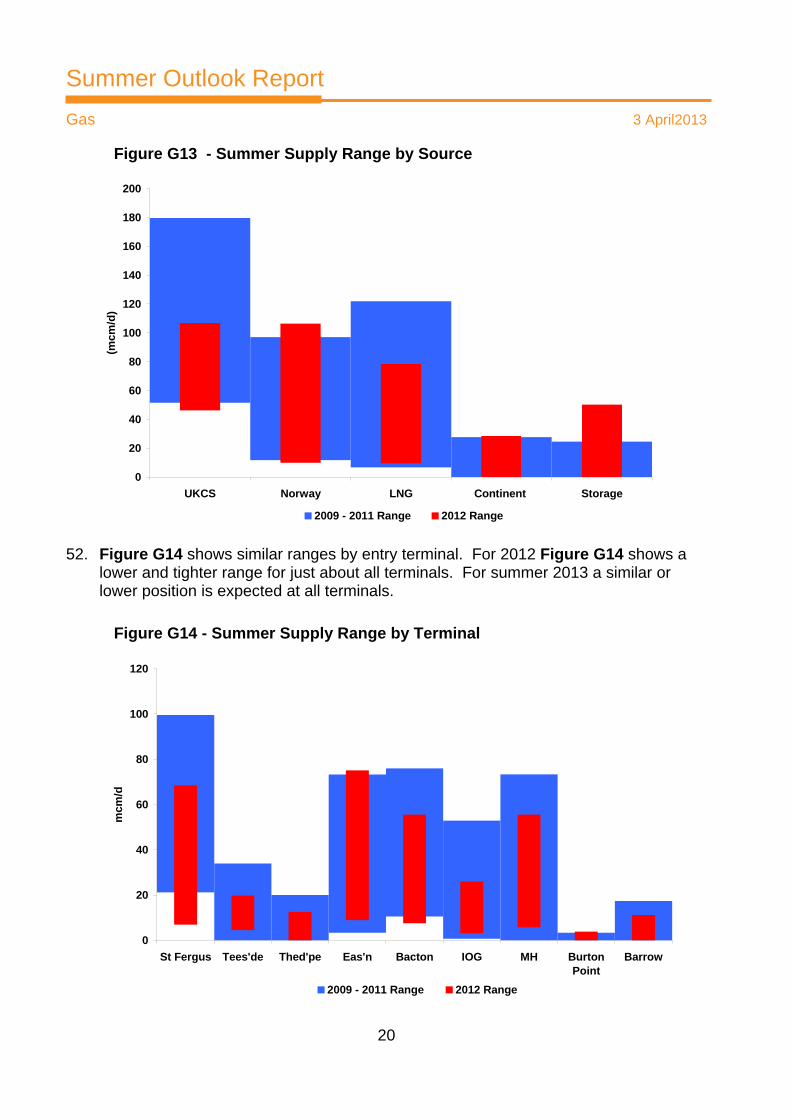
51. Figure G13 shows the summer supply ranges by supply source from 2009 to 2011 and also specifically for summer 2012. The chart shows for 2012 a lower and tighter range for UKCS and LNG, together with similar Continent and Norwegian flows. For summer 2013, a similar position is anticipated, although there is great uncertainty around the level of LNG flows.
W
Summer Outlook Report
Gas 3 April2013
20
Figure G13 - Summer Supply Range by Source
0
20
40
60
80
100
120
140
160
180
200
UKCS Norway LNG Continent Storage
(mcm
/d)
2009 - 2011 Range 2012 Range
52. Figure G14 shows similar ranges by entry terminal. For 2012 Figure G14 shows a lower and tighter range for just about all terminals. For summer 2013 a similar or lower position is expected at all terminals.
Figure G14 - Summer Supply Range by Terminal
0
20
40
60
80
100
120
St Fergus Tees'de Thed'pe Eas'n Bacton IOG MH BurtonPoint
Barrow
mcm
/d
2009 - 2011 Range 2012 Range

W
Summer Outlook Report
Gas 3 April2013
21
Summer 2013 NTS Maintenance Programme & Network Expansion 53. To ensure a high level of safety and reliability in operation, it is essential that a system
of inspection and maintenance exists for assets associated with the transmission of natural gas. Effective maintenance is essential to minimise the safety and environmental risks caused by failure of pipelines and plant.
54. In accordance with National Grid's Gas Transporter Safety Case, maintenance activities shall comply at all times with any statutory or legislative requirements, in order to meet legal obligations. These practices are robustly designed and seek to minimise overall operating cost by increasing the useful life of pipelines and plant, reducing the risk of failure and reducing the risk of emergency repairs.
55. The NTS investments delivered last summer for capacity expansion for winter 2012/13 have provided additional capacity and network flexibility. These projects included:
• Connection of new storage facilities in Cheshire
• Tie in of a new Pressure Reduction Installation in Gloucestershire
• Uprating of Feeder 28 to 94 bar between Milford and Treaddow 56. This summer will see the continued commissioning of gas and electric drive
compressors at Felindre as conditions allow and further progression of an additional electric unit at Hatton and Kirriemuir as part of the project to reduce compressor emissions.
57. In addition, following last years in line inspection results, the pipeline defect inspection programme continues, with an ongoing planned programme of in line inspection operations for 2013.
58. National Grid’s maintenance plan includes the impact of network reinforcement, annual maintenance programme and supply outages. Published documents can be found on the National Grid website at: http://www.nationalgrid.com/uk/Gas/OperationalInfo/maintenance/
59. The documents detail Aggregated System Entry Points (ASEP) capacity for each month, based on Seasonal Normal Demand conditions for the period where scheduled maintenance has most impact on capability. The figure has been generated by National Grid and assumes the particular ASEP is favoured at the expense of other terminals. Where no volume has been given, this indicates that the maintenance scheduled has no adverse effects on the ASEP capability.
Summer Outlook Report
Electricity 3 April 2013
22
Electricity 60. This chapter covers the electricity supply-demand outlook for the forthcoming
summer. Demands during the summer are around two thirds of winter demands. There also tends to be a high level of generation unavailability during the summer months due to maintenance and lower prices.
Demand Levels 61. Unless otherwise stated, demand discussed in this report excludes any flows to or
from France, Netherlands and Ireland.
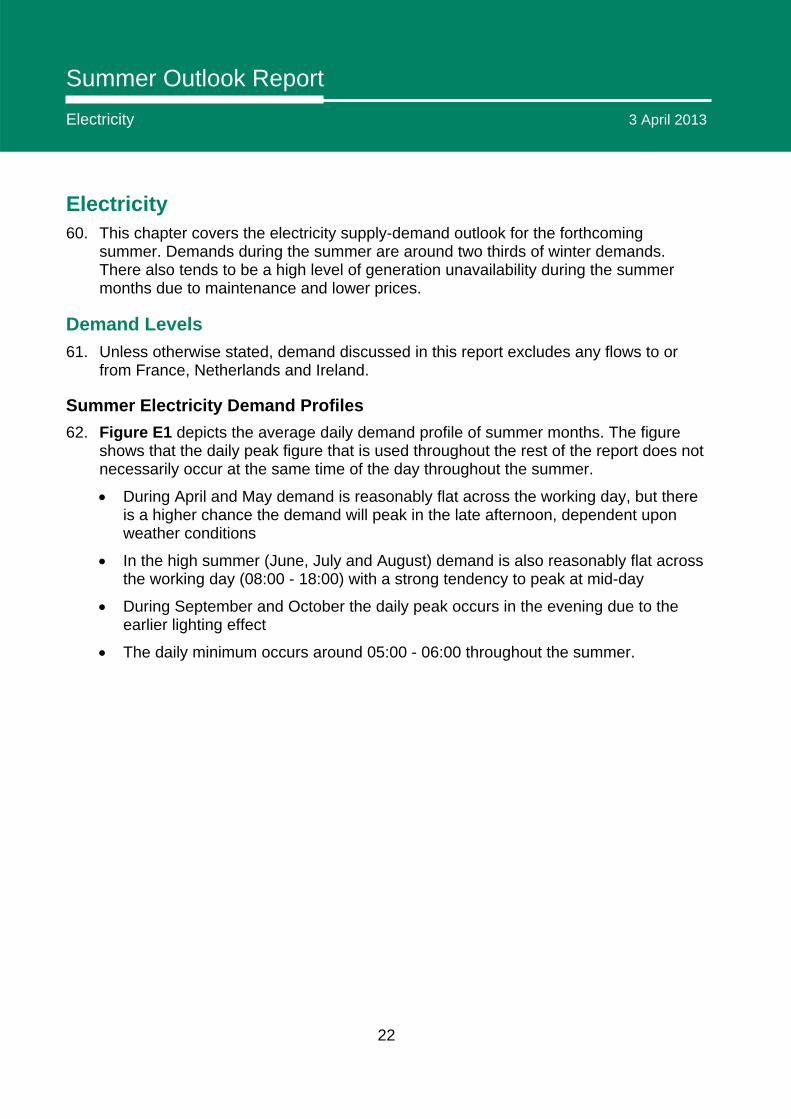
Summer Electricity Demand Profiles 62. Figure E1 depicts the average daily demand profile of summer months. The figure
shows that the daily peak figure that is used throughout the rest of the report does not necessarily occur at the same time of the day throughout the summer. • During April and May demand is reasonably flat across the working day, but there
is a higher chance the demand will peak in the late afternoon, dependent upon weather conditions
• In the high summer (June, July and August) demand is also reasonably flat across the working day (08:00 - 18:00) with a strong tendency to peak at mid-day
• During September and October the daily peak occurs in the evening due to the earlier lighting effect
• The daily minimum occurs around 05:00 - 06:00 throughout the summer.
Summer Outlook Report
Electricity 3 April 2013
23
Figure E1 - Half hourly Demand Profiles
20
22
24
26
28
30
32
34
36
38
40
42
44
30 130
230
330
430
530
630
730
830
930
1030
1130
1230
1330
1430
1530
1630
1730
1830
1930
2030
2130
2230
2330
Time
GB
Nat
iona
l Dem
and
with
Sta
tion
Load
(GW
)
Apr/May Jun/Jul/Aug Sept/Oct
Daily Minimum Occurs around 5am to 6am
Jun/Jul/Aug Peak occurs around mid-day
Apr/May Peak can be mid-day, afternoon or evening
Sept/Oct Peak occurs near sunset
Summer Electricity Demand Levels 63. Figure E2 shows weather corrected demand levels and these demands corrected
and smoothed to remove seasonal variation. Prior to August 2008 demand levels had remained fairly stable. After June 2008 the effect on the demand levels due to the economic environment can be seen by a decline in demand levels. From August 2009 to April 2011 the demand levels remained relatively similar. From April 2011 until February 2012 there was a further decline in normalised demand levels. Since then, except for a small decline in August 2012, there has been a slight return towards summer 2010 levels, although demands are still a bit below that level. Economic forecasts from several different institutions suggest that the average GDP growth rate6 in 2013 will be marginally positive
64. Current estimates are for demand levels during summer 2013 to be similar to the demand levels during summer 2012. The forecast will continue to be updated as part of our normal process and will be published on www.bmreports.com7.
6 http://www.hm-treasury.gov.uk/forecasts 7 http://www.bmreports.com/bsp/BMRSSystemData.php?pT=WEEKFC

Summer Outlook Report
Electricity 3 April 2013
24
Figure E2 - Weather Corrected and Seasonally Corrected Monthly Peak Demand
38
40
42
44
46
48
50
52
54
56
58
60
Apr-
05
Jul-0
5
Oct
-05
Jan-
06
Apr-
06
Jul-0
6
Oct
-06
Jan-
07
Apr-
07
Jul-0
7
Oct
-07
Jan-
08
Apr-
08
Jul-0
8
Oct
-08
Jan-
09
Apr-
09
Jul-0
9
Oct
-09
Jan-
10
Apr-
10
Jul-1
0
Oct
-10
Jan-
11
Apr-
11
Jul-1
1
Oct
-11
Jan-
12
Apr-
12
Jul-1
2
Oct
-12
Jan-
13
Date
Wea
ther
Adj
uste
d M
onth
ly P
eak
Dem
and
(GW
)
38
40
42
44
46
48
50
52
54
56
58
60
Seas
onal
ly A
djus
ted
and
Smoo
thed
(GW
)
Weather Corrected Seasonally Adjusted Smoothed
Second diprecession
65. Figure E3 shows the previous 3 years’ weekly summer demand peaks. The increase in minimum demands in April – May 2012 is probably accounted for by the exceptional heavy rain and flooding.
Figure E3 - Weekly Peak Demand of Previous 3 Summers
38
40
42
44
46
48
50
52
Apr
May Jun
Jul
Aug
Sep Oct
Month
GB
Nat
iona
l Dem
and
with
Sta
tion
Load
(GW
)
2010 2011 2012
High Summer (June, July, August)
2010 Peak43.1 GW
2011 Peak42.5 GW
2012 Peak41.3 GW
Summer Outlook Report
Electricity 3 April 2013
25
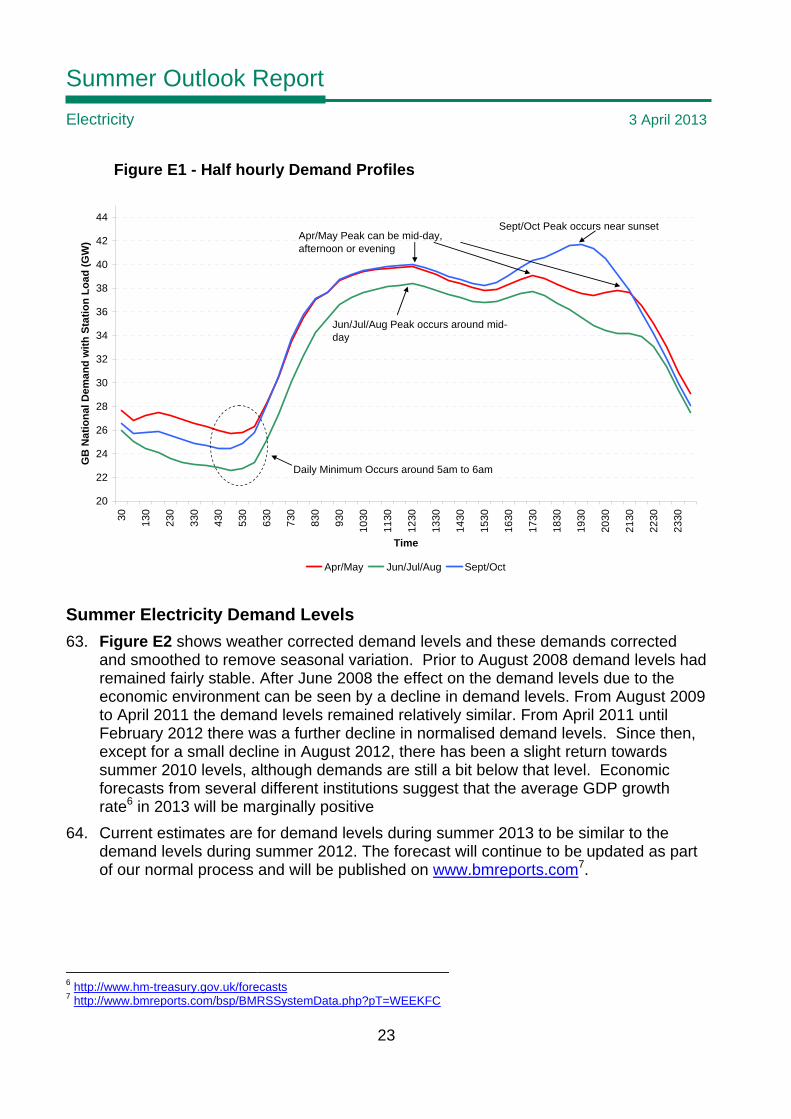
Summer Peak Demands 66. Figure E4 shows the forecast demand levels for 2013. For the high summer period of
June, July and August, the peak weather corrected summer demand for 2013 is expected to be 40.3 GW against an actual weather corrected outturn of 40.6 GW for 2012.
Figure E4 - Weekly Peak Weather Corrected Demand Forecast
38
39
40
41
42
43
44
45
46
47
48
49
01-A
pr
08-A
pr
15-A
pr
22-A
pr
29-A
pr
06-M
ay
13-M
ay
20-M
ay
27-M
ay
03-J
un
10-J
un
17-J
un
24-J
un
01-J
ul
08-J
ul
15-J
ul
22-J
ul
29-J
ul
05-A
ug
12-A
ug
19-A
ug
26-A
ug
02-S
ep
09-S
ep
16-S
ep
23-S
ep
30-S
ep
07-O
ct
14-O
ct
21-O
ct
Week Beginning
Wee
kly
Peak
Dem
and
(GW
)
Weather Corrected Weekly Peak for 2012 Weather Corrected Weekly Peak for 2011Forecast Weather Corrected Weekly Peak for 2013

Summer Outlook Report
Electricity 3 April 2013
26
Summer Minimum Demands 67. The summer minimum demand is expected to occur on a Sunday around 05:00 to
06:00 in late July. Figure E5 shows weather corrected weekly minimum demands for the last three years as well as the forecast minimum demands for the summer 2013. The minimum demand for summer 2013 is forecast to be 20.1 GW compared to an outturn of 19.7 GW in summer 2012. The forecast minimums are in line with minimum demands in 2010 and 2011. Minimum demands in 2012 were lower as embedded non-metered wind generation was higher than is typical, which reduced the demand supplied by the transmission system.
Figure E5 - Weekly Minimum Weather Corrected Demand Forecast
18
19
20
21
22
23
24
25
26
27
28
01-A
pr
08-A
pr
15-A
pr
22-A
pr
29-A
pr
06-M
ay
13-M
ay
20-M
ay
27-M
ay
03-J
un
10-J
un
17-J
un
24-J
un
01-J
ul
08-J
ul
15-J
ul
22-J
ul
29-J
ul
05-A
ug
12-A
ug
19-A
ug
26-A
ug
02-S
ep
09-S
ep
16-S
ep
23-S
ep
30-S
ep
07-O
ct
14-O
ct
Week Beginning
Wee
kly
Min
imum
Dem
and
(GW
)
Forecast Weekly Minimum for 2013 Weather Corrected Weekly Minimum for 2012Weather Corrected Weekly Minimum for 2011 Weather Corrected Weekly Minimum for 2010
Summer Outlook Report
Electricity 3 April 2013
27
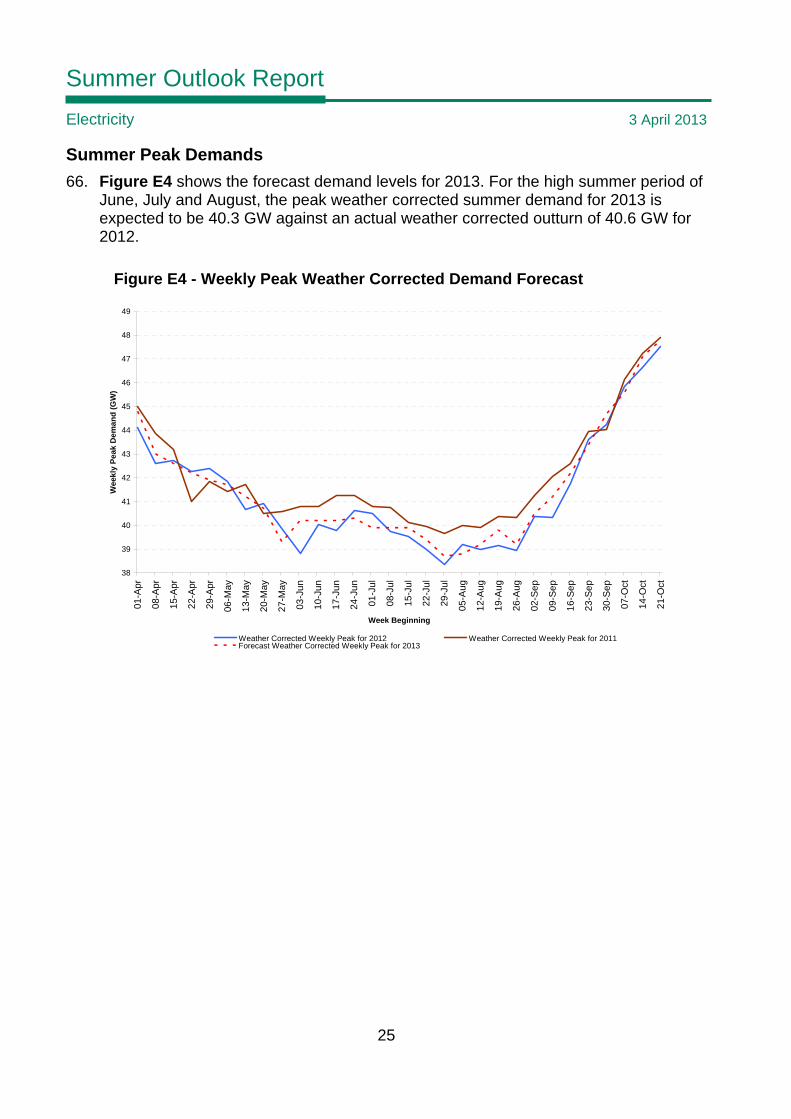
68. There has been a decline in the summer minimum demand since 2006. This is shown in Figure E6. To be able to show a long trend, pre-BETTA data for England and Wales has been scaled to GB levels. The drop in minimum demand between summer 2008 and summer 2009 is consistent with the overall drop in normalised demands shown in Figure E2. This suggests that economic factors have driven this change; however increasing levels of embedded generation and environmental awareness may also have played a part.
69. Since 2009 minimum demands have levelled out; however there is no guarantee that this levelling off will continue.
Figure E6 – Yearly Weather Corrected Minimum Demands
16
17
18
19
20
21
22
23
24
1990
1991
1992
1993
1994
1995
1996
1997
1998
1999
2000
2001
2002
2003
2004
2005
2006
2007
2008
2009
2010
2011
2012
Year
GB
Min
imum
Dem
and
(GW
)
Weather Corrected Minimum Demand 2012 Level Polynomial fit for Minimum Demand
Electricity Demand Variation due to Weather 70. Demand response to weather conditions varies during the year and also varies over
different years as demand characteristics change. Figure E7 depicts the relationship between summer demand and weather, at different times of the summer based on historic demand and weather data.
• Demand is generally higher when the temperatures are colder. This is normally between April and mid-June, and also from September onwards
• In high summer, mid-June to mid-August, the temperature is often close to the comfort temperature of 16-17 degrees. Either an increase or decrease in the temperature will cause the demand to increase.

Summer Outlook Report
Electricity 3 April 2013
28
Figure E7 - Electricity Demand under average, warm and cold conditions
38
40
42
44
46
48
50
52
28-M
ar
04-A
pr
11-A
pr
18-A
pr
25-A
pr
02-M
ay
09-M
ay
16-M
ay
23-M
ay
30-M
ay
06-J
un
13-J
un
20-J
un
27-J
un
04-J
ul
11-J
ul
18-J
ul
25-J
ul
01-A
ug
08-A
ug
15-A
ug
22-A
ug
29-A
ug
05-S
ep
12-S
ep
19-S
ep
26-S
ep
03-O
ct
10-O
ct
17-O
ct
24-O
ct
Week Beginning
Wee
kly
Peak
Dem
and
(GW
)
Average Weather Cold Weather Warm Weather
Higher demand when temperature is lower than normal.
Lower demand when temperature is higher than
normal.
Higher demand when temperature is either higher or lower than normal.
Higher demand when temperature is lower than normal.
Lower demand when temperature is higher than normal.
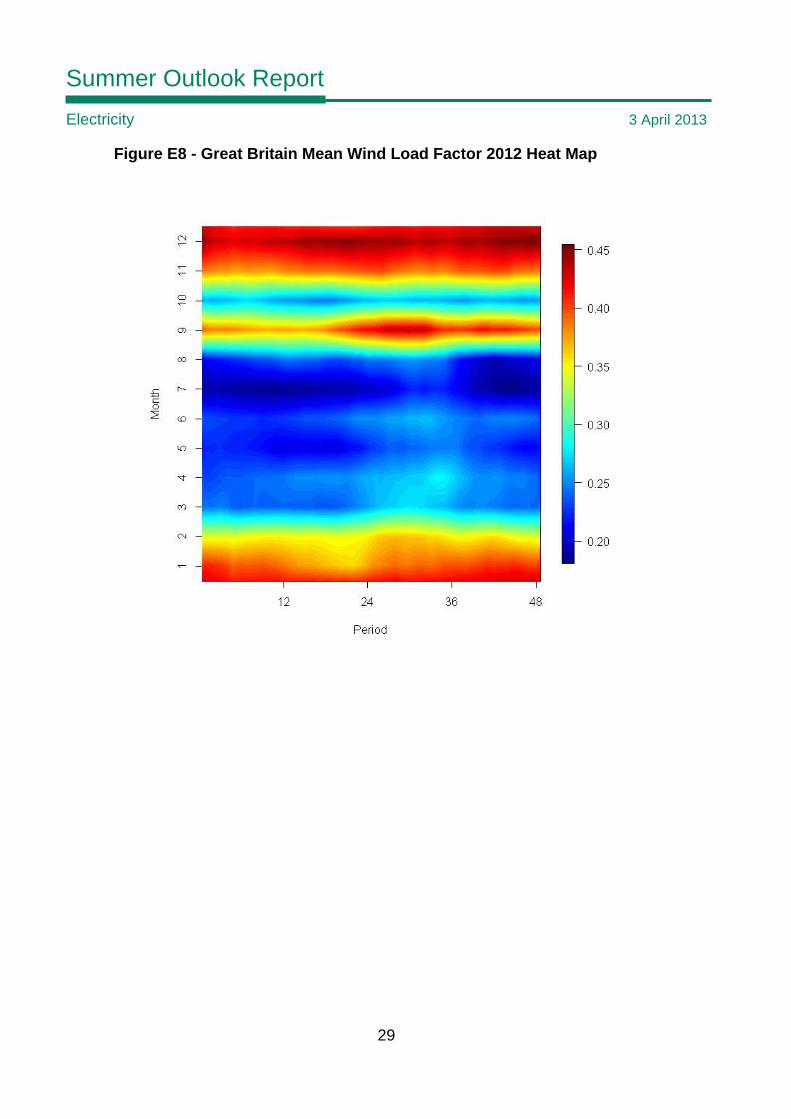
Generation Fuelled by Intermittent Power Sources 71. Figure E8 shows the mean load factor of wind generation by month and trading
period across 2012. The data is taken from directly connected wind farm operational metering. Month is plotted on the vertical axis and trading period on the horizontal axis, with Period 24 corresponding to the half hour ending at noon. The mean annual load factor for 2012 was 30%.
72. Seasonal mean load factors for 2012 are compared to mean load factors for 2009-2012 in Table E1. These figures are useful for comparison, but must be treated with caution. The nature of the wind fleet changed over the period 2009-2012, with more geographical spread and more offshore wind installed in 2012 compared to 2009.
Table E1 – Comparison of Seasonal Wind Load Factors
Mean Load Factor 2012 2009 - 2012
Winter 39% 32% Spring 24% 27% Summer 22% 19% Autumn 35% 33%
Summer Outlook Report
Electricity 3 April 2013
29
Figure E8 - Great Britain Mean Wind Load Factor 2012 Heat Map

Summer Outlook Report
Electricity 3 April 2013
30
73. Figure E9 shows historic wind farm load factor distribution during the daytime in high summer (June to August). The median wind load factor is 16%; based on this it is reasonable to assume that half of the time the load factor will be less than 16% during the day. Similarly there is a 20% chance that the load factor will be below 6.1% and a 10% chance that the load factor will be below 3.5% during the day. Another way of describing this is that in one of the next ten years the wind farm load factor is likely to be less than 3.5% at the summer demand peak.
Figure E9 - Wind Load Factor during Summer Daytime

Summer Outlook Report
Electricity 3 April 2013
31
74. The lowest average load factors occur overnight in the summer period. During 2012 the lowest summer overnight load factor was 0.001 (0.1%). However high winds do occur during periods of low overnight demand during summer. The lowest demands usually occur early on Sunday morning between mid-June and mid-August. Figure E10 shows the chance of the wind load exceeding a given value during at least one of these low demand periods. The median figure is a load factor of 47%. This represents the typical largest wind load factor expected during one of the low demand periods in any year and is used in the low demand scenario analysis later in this document.
Figure E10 – Chance of Wind Load Factor Exceeding Given Value on at least one of the Low Demand Points of the Summer
0.2 0.3 0.4 0.5 0.6 0.7
0
20
40
60
80
100
Wind Load Factor
Per
cent
age
chan
ce

Summer Outlook Report
Electricity 3 April 2013
32
75. Low winds do not just occur overnight, and low wind conditions can persist for several days according to prevailing weather patterns. The frequency of prolonged low wind conditions will be seasonal. However, as yet, we only have sufficient data to draw robust inferences at the yearly level. We have analysed wind generation during the period 2009-2012 to calculate the length of time that the wind load factor remained below several different specific levels: 25%, 20%, 15% 10% and 5% of installed capacity. We have shown these in Figure E11. For example five times a year the wind load factor is continuously below 10% of capacity for more than 48 hours and continuously below 20% for at least 120 hours. Once a year it is continuously below 5% of capacity for more than 48 hours and continuously below 25% for more than 230 hours.
Figure E11 – Frequency of Continuous Periods of Low wind Generation
76. Installation of solar photo-voltaic cells (PV) has increased dramatically over the past
two years. On 1 January 2011 there were 45 MW of installed PV. On 1 January 2012 there were 593 MW installed. As of 1 January 2013 this had risen to 1488 MW8. PV generation is not directly metered by National Grid, and so appears to the system as negative demand. The fluctuations in national demand caused by PV generation can now be detected in the variation of national demands. To produce the best possible transmission demand forecasts, from the start of British Summer Time 2013, National Grid’s demand forecasts will take account of forecasted PV generation.
8 https://www.renewablesandchp.ofgem.gov.uk/Public/ReportManager

Summer Outlook Report
Electricity 3 April 2013
33
Generator Availability
Generation Capacity 77. Figure E12 shows current capacity, which has dropped by 2.5 GW to 76.6GW since
the Winter Outlook Report. This is due to decreases resulting from the closure of Uskmouth 13, Cockenzie, Didcot A, Fawley and Kingsnorth. These decreases have been partially off set by increases due to the return of Medway, the commissioning of the first unit at West Burton B, the start up of the East-West Interconnector and additional wind generation added to the system. This capacity will change through the summer with the expected return of Shoreham, the continued commissioning of West Burton B and increasing wind farm capacity. The interconnector to Northern Ireland has been excluded from this analysis as over the summer the flows impact the amount of constrained generation in Scotland rather than the national surpluses.
Figure E12 - Generation Capacity - Summer 2013
9.6
21.0
29.0
3.51.15.7
1.71.1
2.71.2
0
10
20
30
40
50
60
70
80
90
Capacity
GW
CCGT
OCGT
PUMPED STORAGE
OIL
BIOMASS
COAL
WIND
HYDRO
INTERCONNECTORS
NUCLEAR
Generation Availability 78. As usual over the summer period there will be a significant generation outage
programme that will reduce the amount of available generation plant. Generation surplus, which is the excess of generation availability over demand and reserve requirements, is published on www.bmreports.com 9.
9 http://www.bmreports.com/bsp/BMRSSystemData.php?pT=WEEKFC
Summer Outlook Report
Electricity 3 April 2013
34
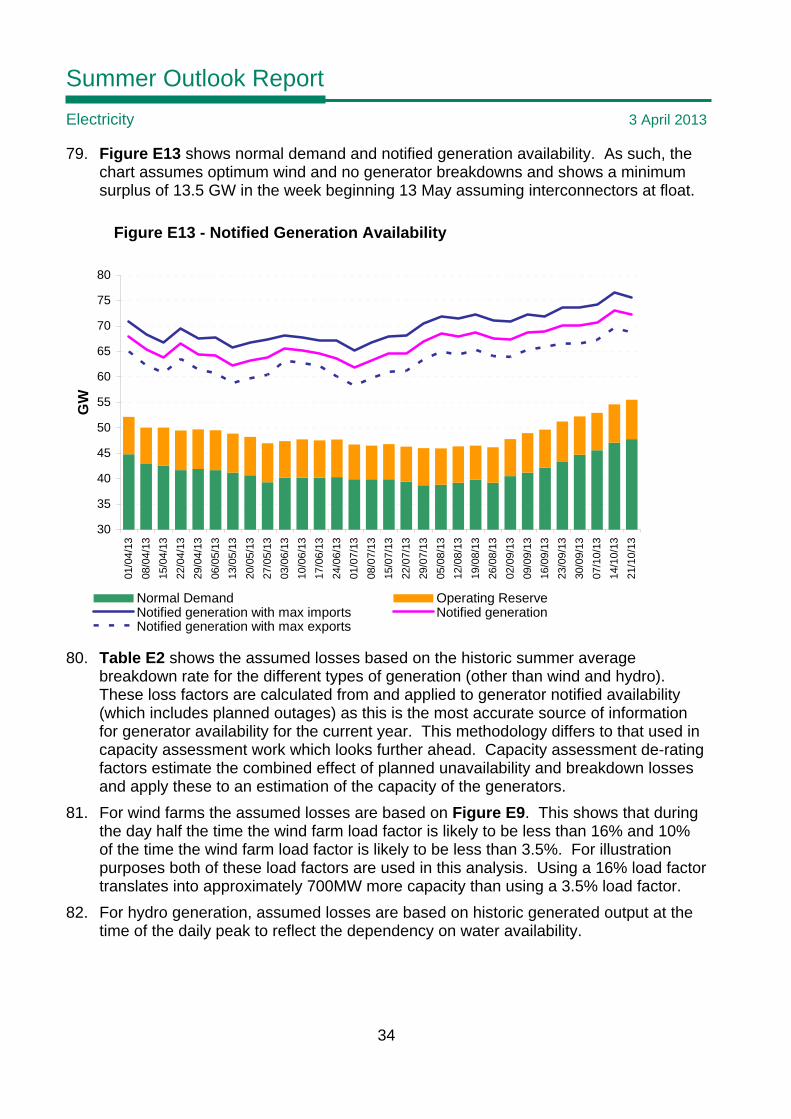
79. Figure E13 shows normal demand and notified generation availability. As such, the chart assumes optimum wind and no generator breakdowns and shows a minimum surplus of 13.5 GW in the week beginning 13 May assuming interconnectors at float.
Figure E13 - Notified Generation Availability
30
35
40
45
50
55
60
65
70
75
80
01/0
4/13
08/0
4/13
15/0
4/13
22/0
4/13
29/0
4/13
06/0
5/13
13/0
5/13
20/0
5/13
27/0
5/13
03/0
6/13
10/0
6/13
17/0
6/13
24/0
6/13
01/0
7/13
08/0
7/13
15/0
7/13
22/0
7/13
29/0
7/13
05/0
8/13
12/0
8/13
19/0
8/13
26/0
8/13
02/0
9/13
09/0
9/13
16/0
9/13
23/0
9/13
30/0
9/13
07/1
0/13
14/1
0/13
21/1
0/13
GW
Normal Demand Operating ReserveNotified generation with max imports Notified generationNotified generation with max exports
80. Table E2 shows the assumed losses based on the historic summer average breakdown rate for the different types of generation (other than wind and hydro). These loss factors are calculated from and applied to generator notified availability (which includes planned outages) as this is the most accurate source of information for generator availability for the current year. This methodology differs to that used in capacity assessment work which looks further ahead. Capacity assessment de-rating factors estimate the combined effect of planned unavailability and breakdown losses and apply these to an estimation of the capacity of the generators.
81. For wind farms the assumed losses are based on Figure E9. This shows that during the day half the time the wind farm load factor is likely to be less than 16% and 10% of the time the wind farm load factor is likely to be less than 3.5%. For illustration purposes both of these load factors are used in this analysis. Using a 16% load factor translates into approximately 700MW more capacity than using a 3.5% load factor.
82. For hydro generation, assumed losses are based on historic generated output at the time of the daily peak to reflect the dependency on water availability.

Summer Outlook Report
Electricity 3 April 2013
35
Table E2 - Assumed Losses of Generation Availability for Summer 2013
Power Station Type Assumed losses
Nuclear 13% Interconnectors 0% Hydro generation 60% Wind generation (median) 84% Wind generation (min) 96.5% Coal + biomass 22% Oil 15% Pumped storage 5% OCGT 15% CCGT 21% Total 25%
83. The assumed losses in Table E2 are applied to the notified availabilities declared to
National Grid by Generators under Grid Code Operating Code 2 (OC2) to calculate the assumed generation availability shown in Figure E14. The chart also superimposes notified French, BritNed and East-West Interconnector capabilities in both import and export directions. The interconnector to Northern Ireland has been excluded from this analysis as over the summer the flows impact the amount of constrained generation in Scotland rather than the national surpluses.
84. During high summer the minimum generating availability at the time of peak demand is 47.6GW in the week commencing 1 July. The minimum surplus falls in the same week at 3.5GW, assuming the interconnectors are at float and median wind. Outside of high summer the minimum surplus is 2.4GW in the week commencing 21st October
85. The reserve requirement is forecast to be a maximum of 5GW and is included in Figure E14 as operating reserve.

Summer Outlook Report
Electricity 3 April 2013
36
Figure E14 - Assumed Generation Availability
30
35
40
45
50
55
60
65
70
75
80
01/0
4/13
08/0
4/13
15/0
4/13
22/0
4/13
29/0
4/13
06/0
5/13
13/0
5/13
20/0
5/13
27/0
5/13
03/0
6/13
10/0
6/13
17/0
6/13
24/0
6/13
01/0
7/13
08/0
7/13
15/0
7/13
22/0
7/13
29/0
7/13
05/0
8/13
12/0
8/13
19/0
8/13
26/0
8/13
02/0
9/13
09/0
9/13
16/0
9/13
23/0
9/13
30/0
9/13
07/1
0/13
14/1
0/13
21/1
0/13
GW
Normal Demand Operating ReserveAssumed gen (min wind) with max imports Assumed gen (min wind) with max exportsAssumed gen (median wind) with I/Cs at float
86. If surpluses were eroded, system warnings, such as the Notification of Insufficient System Margin, would be issued to inform the market and to encourage an increase in available generation or reduction in demand. In addition, if necessary, trading may be undertaken on the interconnectors to reduce exports. Whilst Figure E14 is only indicative, it shows that currently margins are forecast to be adequate throughout the summer.
Interconnector Flows 87. Following the completion of valve replacement works on IFA which reduced capacity
last summer we expect to have full availability of interconnectors connecting to continental Europe this year, with the exception of a 19 day outage on the French interconnector in June. Curve prices indicate a strong spread in favour of flows to GB across both IFA and BritNed throughout the summer. We expect to see a reduction in imports, potentially even exports, during the morning pickup in continental Europe (05:00-07:00). Further increases in renewable penetration on both sides of the interconnectors mean that flows will become more dependant on renewable output in short term timescales.
88. With the commissioning of the EWIC there are now two connections between the GB market and Ireland’s Single Electricity market. Current commissioning plans indicate that EWIC will be fully available (+/-500MW) by the summer and we believe that Moyle will also return to full capability. We expect energy to be exported to Ireland across both interconnectors, however there are likely to be imports to GB during

Summer Outlook Report
Electricity 3 April 2013
37
periods of high winds in Ireland, due to the high penetration of this generation source on the island.
System Operation during Low Demand Periods 89. During periods of low demand a number of flexible generators are required to:
• Maintain sufficient frequency response10 to ensure that the system can withstand the largest generation or demand loss
• Maintain positive and negative regulating reserve levels to cater for demand forecast error, wind forecast error, generation and demand losses
90. In addition, during periods of low demand, two other factors may affect generator balancing decisions, in that we have to:
• Maintain the voltage profile across the country within specified limits
• Maintain sufficient system inertia11 91. The impact of these four issues in the coming summer is that it is likely that we will
need to take a number of actions during low demand periods on conventional and wind generators to keep the system secure. These issues are discussed in more detail below.
Regulating Reserve and Frequency Response 92. Generators which are currently less flexible include:
• Nuclear generation
• Combined Heat and Power (CHP) stations
• Some hydro generators which either have water level management obligations or have BELLA12 connection agreements
• Some wind farms, which either choose not to participate in the Balancing Mechanism or have BELLA connection agreements or are not large13.
93. Interconnectors provide a variety of frequency response services and, in some cases, limited System Operator to System Operator trading.
94. The remaining generators are more flexible, including most large wind farms. Most large wind farms are now participating in the Balancing Mechanism and some are providing the Ancillary Services required by the Grid Code (frequency response and
10 Frequency response requirements increase as the demand falls due to the relative size of the largest loss increasing and due to demand itself being slightly frequency sensitive 11 When there is an instantaneous demand or infeed loss inertia acts to slow down the rate of change of frequency in the timescales before frequency response takes effect 12 Bilateral Embedded Licence Exemptable Large Power Station Agreement http://www.nationalgrid.com/uk/Electricity/_OLDGettingConnected/dnoConnected/agreements/ 13 As defined by the Grid Code. Virtually all generators which are not large do not have a connection agreement (relationship) with National Grid. Small embedded generators meet local demand, reducing the amount of demand seen by the transmission system. Small wind farms are modelled explicitly as their output is not related to demand.

Summer Outlook Report
Electricity 3 April 2013
38
reactive power). We call on these services when more economic options have been used up.
95. We have modelled the amount of inflexible generation that we can reasonably expect to be running at the time of the weekly minimum demand to quantify the likelihood of us needing to ask less flexible generators to alter their output during these periods. Our assumptions on the load factors for the different categories of generator and interconnectors during low demand periods are shown in Table E3. Our assumed load factor for inflexible wind farms is based on Figure E10, which shows that for the days where we might reasonably expect the lowest demand to occur, we can expect the wind load factor to be 47% on at least one of these days.
Table E3 – Inflexible Load Factor Assumptions at Minimum Demand
Power Station Type Load Factor
Nuclear 0.89 Inflexible BM units (CHP) 0.90 Inflexible hydro 0.10 Inflexible wind 0.47 Irish Interconnectors -1.0 BritNed 0.70 Interconnector France Angleterre 0.75
96. Figure E15 shows the cumulative minimum output profile from less flexible
generators. This is based on the load factors in Table E3 and the generators’ OC2 availability submissions. This profile includes the synchronised plant required to meet our frequency response and reserve requirements. The weekly minimum demand profile is also shown, together with pumping demand at an assumed load factor of 50%.
97. Figure E15 shows that there should not be a requirement to ask inflexible generators to reduce their output this summer. However for several weeks the margins are small, with the smallest margin being 1.9GW in the weeks commencing 28 July and 4 August. Actual margins will depend on conditions and plant running on the day. We will keep these margins and assumptions under review during the summer and will inform and engage with inflexible generators if necessary.

Summer Outlook Report
Electricity 3 April 2013
39
Figure E15 – Weekly Minimum Demand and Generation Profiles
0
5
10
15
20
25
30
28-A
pr-1
3
05-M
ay-1
3
12-M
ay-1
3
19-M
ay-1
3
26-M
ay-1
3
02-J
un-1
3
09-J
un-1
3
16-J
un-1
3
23-J
un-1
3
30-J
un-1
3
07-J
ul-1
3
14-J
ul-1
3
21-J
ul-1
3
28-J
ul-1
3
04-A
ug-1
3
11-A
ug-1
3
18-A
ug-1
3
25-A
ug-1
3
01-S
ep-1
3
08-S
ep-1
3
15-S
ep-1
3
22-S
ep-1
3
29-S
ep-1
3
06-O
ct-1
3
13-O
ct-1
3
20-O
ct-1
3
27-O
ct-1
3
Week
GW
Nuclear Inflex BMUs (eg CHP) Inflex HydroI/C imports Plant providing Frequency Response Plant providing Requlating ReserveInflex Wind Minimum demand Min Demand + Pump Demand
98. With increasing installed wind capacity it has become economic to carry a proportion of regulating reserve on large wind farms when it is windy. This has resulted in the occasional short curtailment instruction being issued to wind farms over the last few months. The number of these short curtailment instructions given to wind farms is likely to increase as the demand drops towards the summer minimums and fewer flexible generators run overnight (historically the principal reason for curtailing wind output has been for transmission constraints – see section on Transmission Issues).
99. In Figure E16 flexible wind farm output has been added, assuming the same load factor of 47%. Figure E16 shows that if flexible wind did not contribute to meeting the frequency response requirement and the regulating reserve requirement there is a reasonable chance that it will be curtailed this summer for energy reasons. If wind did contribute to meeting the frequency response and regulating reserve requirement then the effect on this chart would be a reduction in the size of the flexible wind block, with the wind farms displacing some of the conventional generation providing these services. Initially high frequency response and negative regulating reserve are likely to be the most economic services for wind farms to provide as they don’t involve pre-emptively de-loading the generator. Provision of low frequency response and positive regulating reserve would involve de-loading the wind farm before it could provide the service.
100. We encourage those wind farms and generators that currently do not meet their obligation to provide frequency response to do so as it will help us manage these low demand periods more efficiently and economically. In addition we encourage the submission of cost reflective prices for the provision of frequency response. On an

Summer Outlook Report
Electricity 3 April 2013
40
hourly basis, currently it is cheaper to shutdown some generators and wind farms completely, rather than to carry frequency response on them.
Figure E16 – Weekly Minimum Demand and Generation Profiles Including Flexible Wind Output
0
5
10
15
20
25
30
28-A
pr-1
3
05-M
ay-1
3
12-M
ay-1
3
19-M
ay-1
3
26-M
ay-1
3
02-J
un-1
3
09-J
un-1
3
16-J
un-1
3
23-J
un-1
3
30-J
un-1
3
07-J
ul-1
3
14-J
ul-1
3
21-J
ul-1
3
28-J
ul-1
3
04-A
ug-1
3
11-A
ug-1
3
18-A
ug-1
3
25-A
ug-1
3
01-S
ep-1
3
08-S
ep-1
3
15-S
ep-1
3
22-S
ep-1
3
29-S
ep-1
3
06-O
ct-1
3
13-O
ct-1
3
20-O
ct-1
3
27-O
ct-1
3
Week
GW
Nuclear Inflex BMUs (eg CHP) Inflex HydroI/C imports Plant providing Frequency Response Plant providing Requlating ReserveInflex Wind Flex Wind Minimum demandMin Demand + Pump Demand
Voltage Profile and Inertia 101. In addition to the decrease in summer active power (MW) demand shown in Figure
E6 there has been a significant decrease in national reactive power (MVAr)14 demand during low demand periods. If the system operator did not take action to balance this decrease in reactive power demand then voltage levels would rise. Figure E17 shows the yearly minimum reactive to active power ratio since 2003. Figure E18 shows the outturn reactive power yearly minimum and the active power yearly minimum. It can clearly be seen that demand for reactive power has dropped away much more rapidly than demand for active power. Reasons for this are not at present clear and are under active investigation.
14 Electrical equipment has both real power (MW) and reactive power (MVar) components. The vector sum of these two components gives the apparent power (MVA).

Summer Outlook Report
Electricity 3 April 2013
41
Figure E17 – Yearly Minimum Reactive to Active Demand Ratio since 2003
0.00
0.05
0.10
0.15
0.20
0.25
0.30
0.35
0.40
2003
2004
2005
2006
2007
2008
2009
2010
2011
2012
Year
Rat
io o
f Rea
ctiv
e to
Act
ive
Pow
er
Ratio of Reactive to Active Power
Figure E18 – Yearly Minimum Reactive and Active Demand Outturn since 2003
0
1
2
3
4
5
6
7
8
9
10
2003
2004
2005
2006
2007
2008
2009
2010
2011
2012
Year
Rea
ctiv
e Po
wer
(GVA
r)
14
15
16
17
18
19
20
21
22
23
24
Act
ive
Pow
er (G
W)
Reactive Power Active Power
102. Figure E19 shows the geographical location of generation divided by fuel type, with 14% of the generation capacity in Scotland, 48% of the capacity in the North of England and Wales and 38% of the capacity in the South of England and Wales. If,

Summer Outlook Report
Electricity 3 April 2013
42
as forecast, the relative cost of generating electricity from coal is less than that from gas, it is likely that the South will see a greater proportion of its generator capacity two shifting overnight. This, combined with the declining reactive power demand, means that during low demand periods there may be import constraints to ensure that generation is synchronised to maintain the voltage profile in some parts of the country. We encourage those wind farms and generators that currently do not meet their obligation to provide reactive power to do so as this will help us manage these low demand periods more efficiently and economically.
Figure E19 – Geographic split of generation by fuel type
103. Most wind farms and interconnectors do not contribute to system inertia, due to electronic decoupling. Synchronous generators do contribute towards system inertia; their contribution reflects the physical design of the machine. Inertia acts to slow down the rate of change of frequency when there is an instantaneous demand or infeed loss in the timescales before frequency response takes effect. A Grid Code Working Group15 has been addressing this issue. During low demand periods when there are high levels of interconnector imports and high levels of wind farm output, there will be fewer conventional machines synchronised to the system. Should there be insufficient system inertia during these periods, additional synchronous machines will need to be synchronised to ensure the system remains secure.
15 http://www.nationalgrid.com/uk/Electricity/Codes/gridcode/workinggroups/freqresp/, http://www.nationalgrid.com/uk/Electricity/Codes/gridcode/workinggroups/freqrespTSG/
Summer Outlook Report
Electricity 3 April 2013
43
104. During low demand periods it may be that actions on one generator solves more than one of the four issues discussed above, for example: synchronising a generator in a particular region to support the local voltage profile may contribute to ensuring there are sufficient machines synchronised to meet the system inertia requirements. It may also be that actions are not taken on some generators for the same reason, for example: a number of conventional generators that had notified us that they planned to run overnight may be left running and a wind farm may be curtailed to resolve an energy imbalance because the conventional generators were carrying frequency response and the wind farm in question could not carry frequency response. We will take actions in economic order to operate the system securely and efficiently at all times.
Transmission Issues 105. 2013 sees the continuation of major works associated with the Transmission
Investment for Renewable Generation (TIRG) works. This work, being carried out by the relevant Transmission Owners, is to construct or rebuild major sections of the transmission system in Scotland and the North of England, to deliver additional transmission capacity to transport energy from new renewable generation (wind) in Scotland.
106. Additionally, significant outages are required for reinforcement works within South Wales, the South East, and the Flow South boundary primarily to facilitate generation connections.
107. The network outages to undertake the work will reduce the available transmission system capacity between Scotland and England, as well as between the North and South of England, and in the South East.
108. To manage the resulting constraint volumes, to resolve these constraints efficiently and effectively we will use a combination of:
• contracts to limit the output of certain power stations
• arming of intertrips to automatically disconnect generation in the event of a transmission fault
• actions on the day in the Balancing Mechanism
• trades These transmission system reinforcements form part of a substantial development of the networks to accommodate new generation and to replace assets to ensure the continued reliable performance of the GB transmission system. Details of planned reinforcements are shown in National Grid’s Electricity Ten Year Statement16.
109. The work being carried out by the relevant Transmission Owners to strengthen their transmission systems described above is being conducted in parallel with the ongoing connection of new generation. This brings forward the decarbonisation benefit of the renewable generators being connected, but means that it is likely that
16 http://www.nationalgrid.com/uk/Electricity/ten-year-statement/
Summer Outlook Report
Electricity 3 April 2013
44
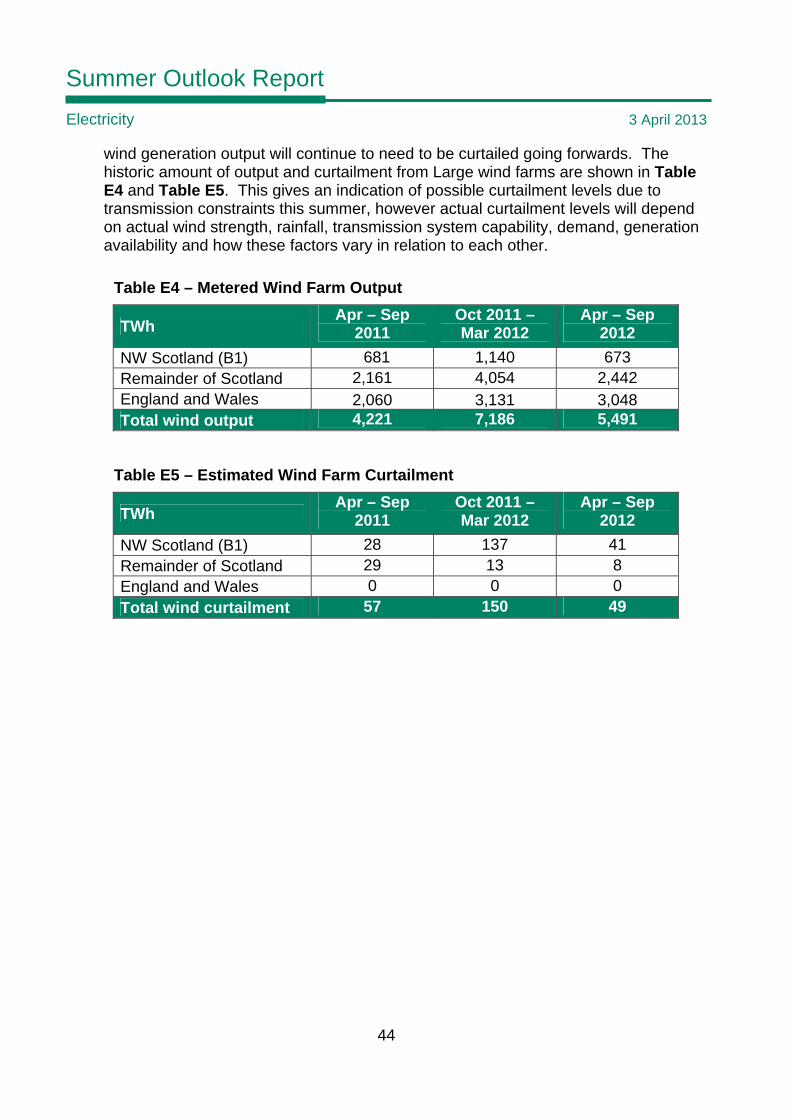
wind generation output will continue to need to be curtailed going forwards. The historic amount of output and curtailment from Large wind farms are shown in Table E4 and Table E5. This gives an indication of possible curtailment levels due to transmission constraints this summer, however actual curtailment levels will depend on actual wind strength, rainfall, transmission system capability, demand, generation availability and how these factors vary in relation to each other.
Table E4 – Metered Wind Farm Output
TWh Apr – Sep
2011 Oct 2011 – Mar 2012
Apr – Sep 2012
NW Scotland (B1) 681 1,140 673 Remainder of Scotland 2,161 4,054 2,442 England and Wales 2,060 3,131 3,048 Total wind output 4,221 7,186 5,491
Table E5 – Estimated Wind Farm Curtailment
TWh Apr – Sep
2011 Oct 2011 – Mar 2012
Apr – Sep 2012
NW Scotland (B1) 28 137 41 Remainder of Scotland 29 13 8 England and Wales 0 0 0 Total wind curtailment 57 150 49