summer internship project report
TRANSCRIPT

1
Chapter 1 - Introduction
1.1 Company Profile
Krishna Maruti Limited
KML entered the auto interior manufacturing business with a single product (seating system
for Maruti 800 CC Car) in year 1994.
The company manufactures 8 different products with over 100 different models.
India's First Total Auto Interior Group of Companies manufacturing all the requirements of
auto interiors including Seating Systems, Rear View Mirrors, Head Rest Assemblies, Arm
Rest Assemblies, Seat Trims (Covers), Injection Moulded Door Trims, Roof liners &
Moulded Carpets.
Figure 1.1.1
The company reached all this in short spans of time because they firmly practice the ' 6 - F'
principle throughout the organisation:
Focused: Focus towards customer delight, engineering infrastructure, cost
consciousness and continuous improvements through '5 - S', 'Kaizens', Quality Circle
Meetings and Suggestion Meetings.
Fast: Fast system & technological up - gradation and implementation.
Flexible: Flexible towards customer requirements.
Friendly: Creating friendly environment among customer, employees & vendors.
Firm: Firmly adhering to laid down policies & procedures &

2
Fun: Achieving the targets in stipulated time.
In order to be a leader in its field, a strong centralized R & D Centre (first of its kind in
country) was established with an investment of $ 1.5 Million. This centre is the best in the
country and is recognized by the Department of Scientific & Industrial Research, Ministry of
Science & Technology, and Govt. of India. This centre is capable of not only testing as per
International Standards but can also issue Test Certificates to other Seat manufacturers. This
test centre can also perform test for non - Automotive components for Endurance &
Repeatability.
Vision of the Company
Our Vision, Our Goals, Our Focus, Our Dreams, all these are very clear to us, that we have
to be a WORLD CLASS COMPANY and this, we must achieve.
To achieve this, Quality, Cost, Delivery& Development are the key factors and all of us I am
sure, recognize this.
To achieve anything, what is also very important is Discipline, Time Management, Systems
and Procedures and above all respect for individuals.
To recognize the respect for the individual, we need to get the FEAR, DOUBT &
INSECURITY out of everybody’s system as we all need to Learn and ultimately develop.
The need of the hour for success is to use every brain in the organization, as everybody has to
have something to contribute in terms of value addition.
Products
Seating Systems
KML started its operations with only 1 model and a production capability of 40 sets/day.
Today we manufacture 16 different models. Krishna Maruti Limited has a production
capacity of 400,000 Seating Systems/ annum.
Presently Krishna Maruti Limited produces 16 different Variants of seating systems of
following

3
Models: BALENO, ESTEEM, WAGON R, ZEN, OMNI, MARUTI 800cc & ALTO.
Krishna Maruti Limited has capabilities to Manufacture Seating Systems as an OE to
potential customers for their range of products.
Rear View Mirrors
Company produces a range of Outside & inside Rear View Mirror Assemblies for Maruti
Udyog Limited and Honda Siel Cars India Limited.
With 35% OE market share, Every Fifth Indian Car has Rear View Mirror Assembly
manufactured by Krishna Toyo Limited.
The range can easily be extended to suit the requirements of other Auto Manufacturers.
Head and Arm Rests
Krishna Pads Limited uses NC Controlled Puromat High - Pressure Foaming Machine for its
foaming application for producing Head Rest & Arm Rest Assemblies for all models of
Maruti's Car.
Seat Trims
Krishna Trims Limited is catering Krishna Maruti Limited's total requirement of trims. KPL
provides these items for the following cars:
Standard 800
Omni Van HR
Zen
Esteem
Wagon R
Baleno
Auditorium Seat
Krishna Quinette is a 50:50 Joint Venture Company of Krishna Maruti Limited with Quinette
Gallay of France.
Quinette Gallay is the World Leader in the field of Auditorium Seats with over 70% of its

4
total production servicing the Export Business. Quinette Gallay has presence in all the 6
Continents and installations in over 50 Countries.
Krishna Quinette produces special seating system for auditorium applications. The company
started its Commercial Operations since July 2003.
Injection Moulded Door Trims
This division manufacturer:
Door Trims
Roof Headliners
Carpets
For producing Injection Moulded Door Trims, we have Toshiba's (Japan) 1300 Tonne
Machines and for the Assembling of various plastic parts together, we use Branson's (USA)
Ultrasonic Welding Process.
For our Roof liners, we have Meyer's (Germany) Lamination Machine & Thermoforming
Machine. We are the only Indian Company to use Twin Head Robotic Water - Jet Cutting
Machine from ABB - IR Sweden.
The company is all set to use its specialty in Injection Moulding for producing components
for White Good Industry.
Roof Liners
The division was setup in July 2000 & the machines for lamination & thermo foaming was
commission in December 2000. The commercial production started in Feb 2001.This plant
can manufacture 2,00,000 Roof Headliners of various models per year.
For Lamination of Substrates, Fully Automatic & Continuous Lamination Machine from
Meyer - Germany is used. The Machine is capable of laminating up to five different materials
together in a single operation. For moulding the Laminated Substrates into the required
shape, the Thermoforming Press is used. This Press is High Capacity Single Acting
Hydraulic Machine with advance controllers governing accurate controls over required
parameters for consistent results.

5
The Twin Head Water Jet Cutting Machine from ABB IR - Sweden is the only machine of its
kind in India. This highly sophisticated machine is not only capable of cutting materials in an
very environmentally friendly & energy efficient way. The use of such an advance system
ensures very high degree of Accuracy, Precision & Repeatability.
Raw Materials Used in Production
At Krishna the basic raw materials used are:
Polyurethane raw materials to produce moulded cushion pads -Polygons &
Isocyanides.
CRCA sheet metal components.
Tubular lengths of various sizes.
Water soluble black paints & pre-treatment chemical.
PVC fabrics.
Laminated polyester & cotton fabrics.
Wire Spring
Polypropylene for injection moulded components.
Hardware items.
Various industrial consumables like mig wire, adhesives, safety items, spot welding
electrodes etc.
Seat adjuster mechanism assemblies.
Seat recliner mechanism assemblies.
Rear seat lock assemblies.
Automotive fabric.
Treads.
Substrate for roof head liner (rigid foam).
Mirror sheets.
Felt for moulded carpet.
Needles punch fabric for moulded carpet.
CRCE sheet.
Non - woven fabric.
Fasteners for various sizes.

6
1.2 Purpose of Study
Financial analysis of a company is conducted to judge the financial soundness and profits of
the company. It helps in evaluating the current position of the firm in terms of finances
available and suggesting the areas of improvement in it. The Research is to be conducted on
current years and last year’s financial reports which would help in analysing the company’s
current financial position and compare it with previous year’s financial position. A SWOT
analysis of company would also be conducted which would help in knowing the strengths,
weakness, opportunities and threats in context to the company. The research would also
provide an insight to the company’s management about the company’s financial position and
accordingly through the results obtained they can formulate and implement policies which
would help them to improve the financial position of the company if required.
1.3 Context of Study
Finance is an important part of any organization as major decisions in an organization are
taken with the amount of finances available with the company. Proper management of
finances helps the firms to grow and avoids undesired position for the firm to be in like
bankruptcy. Financial analysis of a company is conducted so as to be aware of the current
financial position of the company and the current resources available with the company with
its ability to meet the expenses of the company. It also suggests the areas in which
improvements and savings can be made. The financial analysis of a company provides the
management with the insight to know the position of finances of a company. With the help of
many ratios calculated and comparative analysis done the current financial position of the
company can be interpreted.
1.4 Significance of the Study
Research study would be conducted in an in depth way which would provide the management
a clear cut picture of the organization financial position which would help them to come up
with some different policies regarding handling finances of the company. The research study
would also help the teachers in evaluating the student’s understanding and interpretation of
the financial position of the company through usage of different methods and techniques for
arriving at a particular figure.

7
1.5 Theoretical Framework
In the research study various ratios would be calculated of the year 2011 and 2010 with the
help of company’s balance sheet and comparison of these ratios would be done to check
whether the company has become financially strong or not. The ratios would be calculated in
Microsoft excel and would be interpreted with the help of suitable charts. Subsequently in the
excel sheet comparative and common size balance sheet and income statement would be
created and they would be interpreted with the help of charts. Through this procedure we
would get to know that the firm was better in the financial year ending 2010 or in the
financial year ending 2011.

8
Chapter 2 – Review of Literature
2.1 Review of Literature
Upadhyay1 (2001) said that financial analysis should be adopted to appraise the financial
performance of the companies. Financial analysis basically included calculation of various
ratios which are also beneficial for the investor as he/she gets to know about the financial
position of the company. The limitations faced were that the companies on which the
financial analysis was performed had different method of calculations.
Prather2 (1999) mentioned that application of ratio analysis technique to personal financial
statements offers insight into the strengths and weaknesses of a family financial situation.
Ratios are calculated in assessing the general or specific financial position of a person. The
limitations faced in this article basically were that the household people generally don’t
reveal their original data in terms of expenses and incomes which they have for a financial
year.
Martikainen3 (1998) stated the core areas of research were considered to be financial ratios. It
is observed that it is typical of financial ratio analysis research that there are several
unexpectedly distinct lines with research traditions of their own. A common feature of all the
areas of financial ratio analysis research seems to be that while significant regularities can be
observed, they are not necessarily stable across the different ratios, industries, and time
periods. This leaves much space for the development of theoretical basis and for further
empirical research.
Fujii4 (2001) said that the financial system plays a fundamental role in the economic system
in facilitating the transfer of resources, liquidity and price information. Banks and financial
markets are two basic structures that consist of financial system and they are distinct in the
way they perform the financial functions. The analysis to be done with banks and financial
markets has to be done in a consolidated framework which would also provide a direction for
future research.

9
Altman5
(1998) mentioned the usage of traditional ratio analysis and discriminant analysis
used for prediction of corporate bankruptcy. Several types of models and calculations were
performed for the prediction purpose. The concluding remarks given in the article were that
traditional ratio analysis alone can predict the bankruptcy but if used jointly with discriminant
analysis it can be helpful in predicting the company’s bankruptcy. The limitation from the
above study was that the firms which were examined were all publicly held manufacturing
corporations for which comprehensive financial data were obtainable including market price
quotations.
Bravo6 (2006) mentioned in his research article that analysis is based on the existence of a
relationship of individual ratio. The article also used the data envelopment analysis
methodology for improving the efficiency in measurement.
Krivonozhko7 (2011) stated in this article the comparison of data analysis with data
envelopment analysis approach. It is shown that using ratio analysis implies that a one
multidimensional space is projected onto other subspaces many times. As a result, significant
distortion of the performance assessment of units takes place. The theoretical results are
validated by computational experiments on the data taken from financial accounts of Russian
banks.
Edmister8 (2009) wanted to study and test a number of methods of analysing financial ratios
to predict small business failure. Although not all of the methods and ratios are predictors of
failure, many ratio variables are found which do predict failure of Small Business. Using
step-wise multiple discriminant analysis on the simple correlation of the entering variable
with the included variables, a function of independent ratio variables, which is highly
accurate in classifying borrowers in the test sample, is developed. Methods of analysis found
useful are classification of a borrower's ratio into quartiles relative to other borrowers in the
sample, observation of an up- or down-trend for a three-year period this leads the author to
qualify his conclusion above with the provision that at least three consecutive financial
statements be available for analysis of a small business.

10
Singh9 (2002) mentioned in his article that financial ratios have always been a valuable tool
for lodging industry managers. Ratios allow the user to summarise and analyse related data to
provide meaningful information for making decisions. The purpose of the present study is to
identify commonly used ratios in the lodging industry and discover their importance level for
lodging financial executives. Operating and Profitability ratios clearly stand out as the most
important ratios for lodging managers. The study makes a contribution by educating
managers about the range of ratios and their relative importance.
Athanassopoulos10
(1994) mentioned in his article that the use of ratio analysis in itself is
insufficient for assessing performance, and that more advanced tools like data envelopment
analysis should be used to complement ratio analysis. Data envelopment analysis is used in
the paper to address a series of issues concerning the measurement of corporate performance,
which includes an assessment of sales' efficiency, the effects of economies of scale,
benchmarking of a firm's performance and the association between industry groups and
performance. The paper uses data drawn from the grocery industry in the UK.
Mr. Choi11
(1983) stated that financial ratios, which may be appropriate measures of financial
risk and return, are often misused when applied to foreign companies. This is due to
differences in international accounting principles. A more serious problem, however, is that
even when ratios are based on U.S. GAAP, they are misinterpreted because the U.S. investor
does not understand a particular foreign environment that influences all financial ratios in that
environment.
Salo12
(2010) stated that determination of ranking intervals, which indicate the best and worst
efficiency rankings that a DMU can attain relative to other DMUs and dominance relations,
which show what other DMUs a given DMU dominates in pairwise efficiency comparisons.
Unlike conventional efficiency scores, these results are insensitive to outlier DMUs. They
also show how the DMUs' efficiency ratios relate to each other for all feasible weights, rather
than for those weights only for which the data envelopment analysis (DEA) efficiency score
of some DMU is maximized.

11
Ahrendsen13
(2012) mentioned that the research is to evaluate the financial performance
measures calculated and reported by the Economic Resource Service (ERS) from ARMS
data. The evaluation includes the calculation method and the underlying assumptions used in
obtaining the reported values. The financial measures calculated and reported are compared
with those recommended by the Farm Financial Standards Council (FFSC). The values
reported by ERS are duplicated and alternative methods for calculating the financial
performance measures are considered. The values obtained from the various calculation
methods are compared and contrasted.
Royer14
(1991) stated that using the comparative ratio analysis through nonparametric
statistical methods provides no evidence to support the hypothesis that U.S. farmer
cooperatives generally are financially weaker than other firms. Although some cooperative
groups had lower current ratios than industry standards, most of these groups consisted of
marketing associations for which differences may be explained largely by the unique business
relationships between the associations. Comparisons of debt/equity ratios indicate that, except
for regional grain and farm supply associations, cooperatives generally are less leveraged
than other firms.
de15
(2011) stated that to reduce the number of financial ratios and to find out the categories
of financial ratios on the basis of empirical evidence, factor Analysis technique is being used
successfully by different researches during the last three decades. In this study Factor
Analysis has been applied over audited financial data of selected cement companies of India
for a period of 10 years. Initially 44 financial ratios grouped in 7 categories are selected for
the study. Before conducting Factor Analysis, variables having low inter-correlation with the
other variables are excluded.
Hsieh16
(2001) mentioned that ratio analysis is an excellent way of looking into a firm’s
financial status. In a multi-criteria decision-making framework, poor quality of criteria
selection, i.e. financial ratios, will consequently undermine the quality of evaluation. As each
sector of the industry is intrinsically unique, the set of critical ratios for different sectors will
certainly vary. The approach for finding useful financial ratios will not distinguish itself with
respect to the concerned sector rather than the purpose of analysis. The proposed approach
incorporates the concept of multi-criteria decision making and the entropy method. The
approach is demonstrated in a case study in which major property development firms in
Taiwan are evaluated.
12
Mr.Hsu17
(2010) stated that in today’s information technology world, real time financial data
is readily available via many financial websites, such as MSN Money, Google Finance etc.
The incorporation of computer technology in finance classes has become more popular than
ever in this information technology environment. Based on his experience as a finance
professor, he has summarized that his teaching note to demonstrate an alternative tool in
performing financial ratio analysis. The class assignment presented is designed to help
students learn how to assess the company’s overall operations and current financial standing
via an on-line database available in MSN Money website. It can be used in any corporate
finance class. He collected student feedback on the assignment, and the vast majority of the
survey participants perceived the assignment as a very good learning experience. The only
limitation is that online updating of the websites should be done on a regular basis.

13
Chapter 3 – Research Methods and Procedures
3.1 Research Objective
The primary objective of my project would be to provide a thorough analysis of two financial
years i.e. 2009 – 2010 and 2010 – 2011. This will be mainly accomplished by employing a
detailed ratio analysis on the financial data available for two years. In addition to this
comparative balance sheet would also be analysed which would help in better comparison of
the financial position of the company for two years. The report will also focus on the non –
financial aspect using a strategic planning tool known as SWOT analysis which focuses on
strength, weakness, opportunities and threats for the comp any. The main aims and objectives
of the report can be summarized as follows –
To analyse the strength, weakness, opportunities and threats which have resulted from
the adopted strategy and their impact on the company as a whole.
To analyse the Cash Position, liquidity, profitability and solvency position of the firm.
To perform a comparative balance sheet analyses, this would provide a better
understanding of the financial position of the firm.
To analyse the overall efficiency of the firm through calculation of ratios.
3.2 Research Design
The research design which has been used in my study is descriptive design as the current
information has been obtained through the current source of information i.e. annual reports of
the company and comparison design which basically includes comparison two financial years
of Krishna Maruti ltd.

14
3.3 Research Questions
These research conducted would be help us to answer the questions for which the research is
being conducted.
The basic questions included in my research design are –
1. In which year Krishna Maruti ltd. is performing better through the calculation of the
ratios?
2. In which year Krishna Maruti ltd. Have a better liquidity ratio?
3. In which year the Cash Position ratio of Krishna Maruti ltd. is better?
4. Are the expenses of the company under control?
3.4 Instruments Used
The main instruments used in my research study without which the research couldn’t have
been conducted are the respective company’s annual reports. These reports are the core
aspect of the respective study as many figures calculated in excel are done through them only
and the comparisons done is been through them only.
3.5 Techniques Used
Ratio Analysis
Ratio analysis is one of the main accounting techniques of financial analysis to evaluate the
financial position and performance of a company. It involves comparison and calculation of a
number of profitability, liquidity, efficiency and gearing ratios which in turn paint a thorough
picture of company’s performance over a period of time.
Ratio analysis helps in the following ways –
It helps in simplification of the financial statements of the business and also helps in
providing a complete picture of various changes in the financial condition of a
business.
It helps the management in making investment decisions by seeing at the various ratios
calculated.
The ratios calculated also helps in intercompany comparison.

15
Limitations of Ratio Analysis
Different Companies may adopt different accounting policies which are like different
methods of depreciation and which in turn lead to different figures.
The figures in company’s annual report is likely to be of several months out of date
and may not provide current and best indication of performance.
Careful interpretation of ratios calculated is very important so as to proper decisions
by the management can be taken; wrong interpretation of ratio analysis can make the
business suffer.
SWOT Analysis
A SWOT analysis is carried out in this Research Report as the main business technique used
to analyse internal and external factors which have an impact on the company. It carries out
an assessment of a company’s strengths and weaknesses. It also evaluates the opportunities
and threats that may arise in the future for the company. This involves an analysis of external
factors such as the economic environment and the industry.
Limitations of SWOT Analysis
One major shortcoming with the SWOT analysis is that although it emphasises the
importance of the four elements associated with the organisational and environmental
analysis, it does focus on how the company can identify the elements for their own company.
For example, what if a strength identified by the company is not truly strength? While a
company might believe its customer service is strong, they may be unaware of problems with
employees or the capabilities of other companies to provide a higher level of customer
service

16
Chapter 4 – Data Analysis and Interpretation
4.1 SWOT Analysis of Krishna Maruti ltd.
Strengths
Joint Venture
Krishna Maruti ltd. is a group which is in joint venture with Maruti Suzuki ltd. and it supplies
them the interior of their cars, so Krishna group has a fixed client and therefore the sales
expenditure of company is less in terms of searching of clients.
Stronger Brand Image
In this type of industry Krishna Maruti ltd. holds a very strong brand image as it also
manufactures seats for cinema hall like PVR movie halls. The reason for having a strong
brand image is because of its joint venture with Maruti Suzuki ltd. which has the maximum
number of Cars selling in India, so other car manufacturers company in India automatically
give them contracts of manufacturing car seating systems for their cars.
Weakness
Decline in Sales
The main client of Krishna Maruti ltd. is Maruti Suzuki ltd. so whenever there is a strike at
the plant of Maruti Suzuki ltd. the sales income of Krishna Maruti ltd. is heavily affected,
thus which leads to a high decline in the profits of the company too.
Shortage of Absolute Cash
The amount of absolute cash available with Krishna Maruti ltd. is quite less which is a
weakness for the company because to meet its daily expenses the company has to avail short
term loans or working capital loans, which in turns increases the interest expenses of the
company.
Opportunities
New Products
As Maruti Suzuki ltd. launches new product in the market like Ertiga, Krishna Maruti ltd.
also has to manufactures new product which increases the sales of the company and hence
also the profit margin of the company.

17
Threats
Risk of Losing Customer
Due to many companies now entering in this type of industry, competition is seeping through
this industry and the company has to work harder to maintain the customer base with them.
SWOT ANALYSIS IN A NUTSHELL
Figure 4.1.1
Strenghts • Joint Venture
• Stronger Brand Image
Weakness • Decline in Sales
• Shortage of Absolute Cash
Opportunities • New Products
Threats • Risk of Losing Customer

18
4.2 Data Analysis and Interpretation
Table of Ratios
Table No. 4.2.1
Type of Ratios Year Ending 2010 Year Ending 2011 Absolute Cash Ratio 0.08 0.05
Cash Position to Total Assets
Ratio
3.85 2.35
Interval Measure 5.75 3.29
Current Ratio 1.08 1.24
Quick Ratio 0.46 0.56
Debt – Equity Ratio 1.47 0.98
Proprietary Ratio 0.2 0.28
Total Liabilities to Net worth
Ratio
1.71 1.46
Gross Profit Ratio 13.1 14.75
Net Profit Ratio 1.78 1.85
Operating Profit Ratio 3.65 2.07
Return on Assets 0.045 0.058
Return on Capital Employed 0.17 0.12
Raw Material Expenses 86.2 85.4
Production Expenses 2.57 3.13
Administrative and Selling
Expenses
2.33 2.74
Assets Turnover Ratio 2.55 3.13
Fixed Assets Turnover Ratio 6.07 8.12
Working Capital Turnover
Ratio
60.54 29.91
Inventory Turnover Ratio for
Finished goods
29.26 32.83
Inventory Turnover Ratio for
Raw Materials
54.25 64.08
Inventory Holding
Period(Finished Goods)
12.47 11.11
Inventory Holding
Period(Raw Materials)
6.72 5.69
Fixed Charge Coverage Ratio 4.96 4.24
Overall Profitability Ratio 17.84 11.55

19
0
0.02
0.04
0.06
0.08
20102011
2010
2011
Ratio Analysis of Krishna Maruti ltd. for the year 2009 – 2010 & 2010 – 2011
Cash Position Ratios
Absolute Cash Ratio
It is basically the company’s ratio of current cash and cash equivalents to meet its current
liabilities. Ideal Ratio or the benchmark ratio in this case varies from industries to industries.
It basically helps to look into the figures of cash and readily convertible cash to the extent
which can meet the company’s current liabilities.
Figure 4.2.1
From the above Figure 4.2.1 the absolute cash ratio for the company in the year 2010 is 0.08
and for year 2011 is 0.05 so we can interpret that the ratio has decreased in year 2011 from
the previous year of 2010, which means the readily available cash with the company has also
decreased, but on other hand the good thing is that the current liabilities of the company for
the year 2011 has also decreased.

20
0
1
2
3
4
20102011
2010
2011
Cash Position to Total Assets Ratio
Cash position to total assets ratio indicates the proportion of liquid cash in the total assets of
the entity. This helps the company to analyse the liquid cash which is at present with the
company i.e. ready cash available.
Figure 4.2.2
From the Above figure 4.2.2 the cash position to total assets ratio in the year 2010 is 3.85 and
2011 is 2.35, so the ratio for the company has declined in the year 2011 as in comparison to
year 2010 not because that the amount of total assets increased in 2011 but due to sale of the
marketable investments of the company in the year 2011 so the amount of cash reservoir
decreased thus it also lead to decline in the cash position to total assets ratio.

21
0
1
2
3
4
5
6
20102011
2010
2011
Interval Measure
Interval Measure ratio helps to determine the number of days in which the company can
measure its expenses with the amount of cash liquidity available. The cash position which
should be maintained by the company should neither too low or neither too high. A high ratio
would indicate that the business is having idle cash and a too low ratio could land the
company into trouble as it might not be able to cover up its day to day expenses.
Figure 4.2.3
From the Above figure 4.2.3 the interval measure ratio in the year 2010 is 5.75 and 2011 is
3.29, which means that ratio was on a higher side in 2010 and the company had a good
amount of cash liquidity available to meet its day to day expenses, but for the next year the
liabilities also decreased, so the amount in liquid cash was also decreased and used for other
purpose. Company is doing optimum utilization of its funds.

22
1
1.05
1.1
1.15
1.2
1.25
20102011
2010
2011
Liquidity Ratios
Current Ratio
This ratio is basically calculated to give an idea of the company’s ability to pay its short term
liabilities with the use of short term assets. Higher the ratio means more ability of the
company to pay its liabilities. A ratio under 1 would mean that the company would be unable
to pay its current liabilities if they become due at that point of time. The Benchmark ratio for
current ratio is generally 2:1. A much higher ratio would indicate that the company is not able
to manage its current assets properly and fuller utilization of the assets is not taking place.
Figure 4.2.4
From the Above figure the current ratio in the year 2010 is 1.08 and 2011 is 1.24, which
means that the ratio in the year 2010 is closer to 1 and it is not a good sign for the company
because if the liabilities become due at that point, company would face problem in paying
them back but in the next financial year i.e. 2011 this ratio increased to 1.24 which means
that the company has improved its position to meet the current liabilities if they occur at that
point of time. The optimum ratio that should be maintained by the company is 2:1 as it shows
that adequate funds are with the company for meeting its current liabilities.

23
0
0.1
0.2
0.3
0.4
0.5
0.6
20102011
2010
2011
Quick Ratio
Quick Ratio is calculated to check the firm’s ability to meets its current liabilities with most
of its liquid assets. It basically takes into consideration the most liquid assets available with
the company and includes stock, bonds but it removes inventory from the liquid assets as
some companies have problem in converting their inventories instantly into cash. The
benchmark ratio in this is generally 1:1.
Figure 4.2.5
From the Above figure 4.2.5 the quick ratio for the company in the year 2010 is 0.46 and
2011 is 0.56, which means that the ratio for Krishna Maruti ltd. has increased from its
preceding year 2010 due to increase in the amount of the cash available with the company
basically. This is good sign for the company, more the ratio close to 1 it is better for the
company. The company in the year 2011 is in a more good position in terms of finances to
pay off its liabilities with its most liquid assets.

24
0
0.5
1
1.5
20102011
2010
2011
Capital Structure Ratios
Debt – Equity Ratio
Debt – Equity Ratio basically means the proportion of outside debt and equity in firm’s
capital. An optimum debt – equity capital structure is preferred by any organization because
excess of outside funds can increase the interest amount which has to be paid. Debt – Equity
majorly depends upon the industry in which the company is operating.
Figure 4.2.6
From the above figure 4.2.6 the debt - equity ratio for the company in the year 2010 is 1.47
and 2011 is 0.98, which means that the Debt – Equity ratio was on a higher side in 2010
because of higher proportion of debt in 2010 so more interest is being paid, but in 2011 there
was a subsequent fall in the debt – equity ratio which is due to repayment of loans which in
turns also lowers the total interest amount of loans and enhances the liquidity of the firm.

25
0
0.05
0.1
0.15
0.2
0.25
0.3
20102011
2010
2011
Proprietary ratio
It is the Proportion of shareholder’s funds to the total assets of the company. A higher ratio
basically indicates that the firm has sufficient amount of equity to support the functioning of
the business. The calculation of this ratio helps the creditors in evaluating the company. A
higher proprietary ratio indicates that the company has enough funds to pay to its creditors
and whereas a low ratio indicates less funds for repayment to creditors.
Figure 4.2.7
From the above figure 4.2.7 the proprietary ratio for the company in the year 2010 is 0.2 and
2011 is 0.28, which means that the proprietary ratio has marginally increased in 2011 from
2010 so it signifies that the company’s amount of equity has increased for supporting the
functioning of the business. It also indicates that the amount of funds the company has to pay
its creditors has also increased and repayment of these funds can be done faster.

26
1.3
1.4
1.5
1.6
1.7
1.8
20102011
2010
2011
Total Liabilities to Net Worth Ratio
It is calculated to depict the extent to which the net worth of the business can set of the
liabilities. A ratio greater than 1 indicates that the creditors have a greater risk in the business
than the owners as it shows the amount of liabilities in the business is higher.
Figure 4.2.8
From the above figure 4.2.8 the total liabilities to net worth ratio for the company in the year
2010 is 1.71 and 2011 is 1.46, which means that the ratio is a bit higher than 1 which is the
desirable ratio, but in fact in the year 2011 this ratio has been bought down to be more closer
than 1. Ratio being less than 1 is not a good sign for the company.

27
12
12.5
13
13.5
14
14.5
15
20102011
2010
2011
Profitability Ratio
Gross Profit Ratio
This ratio basically shows how efficiently a business is using its materials and labours in the
production process. It is the difference between Sales revenue and cost of making a product
before deducting taxes, interests. Higher the gross profit ratio it is much better.
Figure 4.2.9
From the above figure 4.2.9 the gross profit ratio for the company in the year 2010 is 13.1
and 2011 is 14.75, which means that the Gross Profit ratio has increased in 2011 and is a
good sign for the company as it reflects that efficient utilisation of raw materials and
production process is being taken place in the business and overall productivity of the
company is being enhanced.

28
1.74
1.76
1.78
1.8
1.82
1.84
1.86
20102011
2010
2011
Net Profit Ratio
The net profit percentage is the ratio of after-tax profits to net sales. It reveals the remaining
profit after all costs of production and administrations have been deducted from sales,
and income taxes recognized. Higher the net profit means higher is the earning of the
business.
Figure 4.2.10
From the above figure 4.2.10 the net profit ratio for the company in the year 2010 is 1.78 and
2011 is 1.85, which means that the net profits of the firm has shown an increase in the year
2011 from the preceding year 2010 and is a good sign for the business which is majorly due
to less payment of amount in deferred taxes in the year 2011 in comparison to the year 2010.
The lesser payment has eventually lead to an increase in the net profits of the company.

29
0
1
2
3
4
20102011
2010
2011
Operating Profit Ratio
The operating profit margin ratio indicates how much profit a company makes after paying
for variable costs of production such as wages, raw materials, etc. It is expressed as a
percentage of sales and shows the efficiency of a company controlling the costs and expenses
associated with business operations. Higher the operating profit ratio means the company is
more efficient in controlling the expenses.
Figure 4.2.11
From the above figure 4.2.11 the operating profit ratio for the company in the year 2010 is
3.65 and 2011 is 2.07, which clearly indicates that the ratio has declined in year 2011 from its
preceding year 2010 due to reason being increase in administrative and selling expenses i.e.
Repair and Maintenance, Conveyance and miscellaneous expenses (major amount increased
in these expenses) and cost of goods sold also showed an increase in the year 2011.

30
0
0.01
0.02
0.03
0.04
0.05
0.06
20102011
2010
2011
Return on Assets
It gives an idea about how efficient management is at using its assets to generate earnings.
Higher return on assets basically tells us that the company is earning large amount of money
on less investments. Main objective of Return on assets is to make large profits at lesser
investments.
Figure 4.2.12
From the above figure 4.2.12 the return on assets ratio for the company in the year 2010 is
0.045 and 2011 is 0.058, which means that the return on assets have increased in the year
2011 from the preceding year 2010, which is a good sign for the company as it shows that
assets are being properly managed in the company. With a higher return in the year 2011 it is
clearly indicating that the assets are being well managed by the management and producing
more results than its preceding year.

31
0
0.05
0.1
0.15
0.2
20102011
2010
2011
Return on Capital Employed
Capital employed is basically defined as the difference of total assets – total liabilities. It is
defined as the return which is provided to shareholders on the investment they have done.
Higher return means capital employed is being used more efficiently.
Figure 4.2.13
From the above figure 4.2.13 the return on capital employed ratio for the company in the year
2010 is 0.17 and 2011 is 0.12, which indicates that the return on the capital employed is
constant and is more or less the same for the two years i.e. 2010 and 2011. The return on
capital employed is not that high because not much of capital is employed by the company
from the outside sources.

32
85
85.2
85.4
85.6
85.8
86
86.2
20102011
2010
2011
Expenses Ratios
Direct Expenses Ratio –
Raw Materials Expenses
The calculation of this ratio basically helps us to know the increase/decrease in the
consumption of the raw materials in percentage form in respect to sales which lead to
increase in the expenses in the firm.
Figure 4.2.14
From the above figure 4.2.14 the raw material expenses ratio for the company in the year
2010 is 86.2 and 2011 is 85.4, which indicates that the raw materials expenses of the
company have decreased in the year 2011 in comparison to the year 2010. The raw materials
consumed in year 2011 is more than 2010 but the proportion of sales increase is also more
than 2010, which shows that the raw materials are being used in the company more
efficiently in 2011.

33
0
0.5
1
1.5
2
2.5
3
3.5
20102011
2010
2011
Production Expenses
By calculation of this ratio the analyst gets to know the increase/decrease in the production
expenses of the company in respect to the sales of the company.
Figure 4.2.15
From the above figure 4.2.15 the production expenses ratio for the company in the year 2010
is 2.57 and 2011 is 3.13, which indicates that the production expenses ratio have risen in the
year 2011 from 2010 because of a significant increase in all of the production expenses of the
company in comparison to the increase in the sales of the company, which in turn led has led
to an increase in the ratio of production expenses in respect to the sales of the company.

34
2.1
2.2
2.3
2.4
2.5
2.6
2.7
2.8
20102011
2010
2011
In - Direct Expenses Ratio –
Administrative and Selling Expenses Ratio
These are the expenses incurred by the company which are not related to the production
process of the company and hence are indirect expenses. These expenses incurred indirectly
leads to sales in a company.
Figure 4.2.16
From the above figure 4.2.16 the administrative and selling expenses ratio for the company in
the year 2010 is 2.33 and 2011 is 2.74, which means that expenses have also increased in a
larger proportion to the sales of the company, which has led to an increase in the ratio also.
Major Changes in administrative and sales expenses are seen in Travelling and Conveyance
Expenses, Repair and Maintenance Expenses and Selling and Distribution Expenses.

35
0
0.5
1
1.5
2
2.5
3
3.5
20102011
2010
2011
Turnover Ratios
Assets Turnover Ratio
This ratio basically measures a firm’s efficiency at using its assets in generating sales or
revenue. Higher the ratio is better for the company. Companies with low profit margin have
high assets turnover ratio and whereas companies with high profit margin have low assets
turnover ratio.
Figure 4.2.17
From the above figure 4.2.17 the assets turnover ratio for the company in the year 2010 is
2.55 and 2011 is 3.13, which indicates that the assets turnover ratio has increased from the
previous year because of the increase in the net sales and not much increase/decrease in the
assets side. The increase in the sales of the company has mainly lead to the increase in this
ratio overall.

36
0
2
4
6
8
10
20102011
2010
2011
Fixed Assets Turnover Ratio
It is defined as the company’s ability to generate net sales from the fixed assets investments
specifically property, plant and equipment. A higher fixed assets turnover reflects that the
company is being effective in using the investments in fixed assets to generate revenues.
Figure 4.2.18
From the above figure 4.2.18 the fixed assets turnover ratio for the company in the year 2010
is 6.07 and 2011 is 8.12, which indicates that the ratio has shown an increase in the year 2011
from the preceding year 2010 which is a good sign for the company representing efficiency
and effectiveness in usage of fixed assets investments. The higher ratio means that the
company is using the assets in an efficient manner.

37
0
10
20
30
40
50
60
70
20102011
2010
2011
Working Capital Turnover Ratio
This ratio is calculated to derive the depletion of working capital in order to get sales for the
business. Working capital is Current Assets - Current Liabilities. In general sense higher the
working capital turnover ratio is better because it then reflects that the company is generating
a higher amount of sales as compared to the money used to fund the sales. The working
capital also varies from industries to industries, some have a high working capital
requirement and some have a low requirement.
Figure 4.2.19
From the above figure 4.2.19 the working capital turnover ratio for the company in the year
2010 is 60.54 and 2011 is 29.91, which basically indicates that the working capital was more
efficiently used in 2010 to fund the sales, but in the year 2011 the amount invested in
working capital didn’t yield that much increased sales of the company, so there is a decline in
the ratio.
38
203040
20102011
2010 2011
InventoryTurnover(Finished
Goods)29.26 32.83
2010 2011
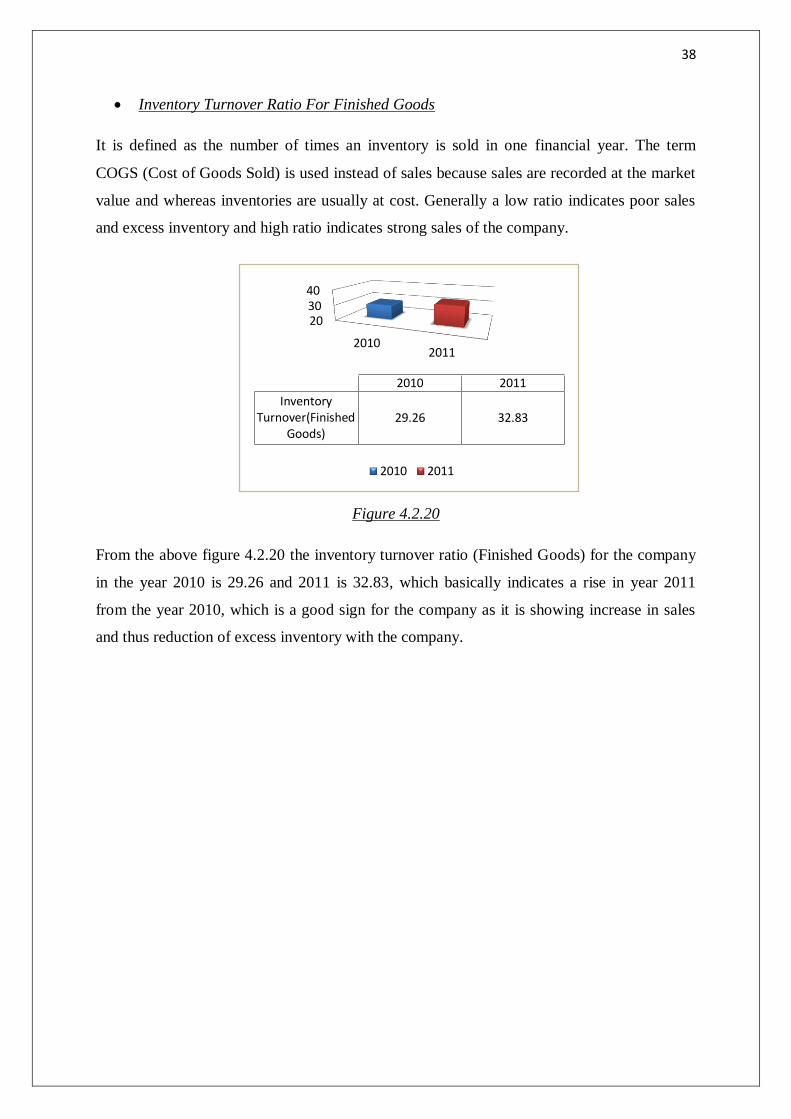
Inventory Turnover Ratio For Finished Goods
It is defined as the number of times an inventory is sold in one financial year. The term
COGS (Cost of Goods Sold) is used instead of sales because sales are recorded at the market
value and whereas inventories are usually at cost. Generally a low ratio indicates poor sales
and excess inventory and high ratio indicates strong sales of the company.
Figure 4.2.20
From the above figure 4.2.20 the inventory turnover ratio (Finished Goods) for the company
in the year 2010 is 29.26 and 2011 is 32.83, which basically indicates a rise in year 2011
from the year 2010, which is a good sign for the company as it is showing increase in sales
and thus reduction of excess inventory with the company.

39
45
50
55
60
65
20102011
2010
2011
Inventory Turnover Ratio For Raw Materials
This ratio is calculated so as to know the rate at which raw materials are being converted into
finished goods in a business. Higher side of this ratio reflects that more goods are being
produced which is leading to more sales and no excess of raw materials stock with the
company, but lower side of this ratio reflects excess stock of raw materials is lying idle with
the business. A company should try to analyse the market trends of demand of the goods and
should produce accordingly so as to minimize wastages of lying of excess stock of raw
materials.
Figure 4.2.21
From the above figure 4.2.21 the inventory turnover ratio (Raw Materials) for the company in
the year 2010 is 54.25 and 2011 is 64.08, which indicates an increase in the ratio from the
preceding year 2010, due to that the raw materials are being utilised more efficiently and
there is lying less of excess inventory of raw materials with the company. It is a good sign for
the company and the company should try and maintain this level.

40
10
10.5
11
11.5
12
12.5
20102011
2010
2011
Inventory Holding Period (Finished Goods)
This term basically means the number of days the finished goods inventory is being in
company’s warehouses. The company incurs various costs on holding of these finished
goods. A higher side of this ratio indicates that the company is holding the finished goods
stocks for a long time and it increases the company’s overall expenditure. A company
generally prefers lower inventory holding periods.
Figure 4.2.22
From the above figure 4.2.22 the inventory holding period (Finished Goods) for the company
in the year 2010 is 12.47 and 2011 is 11.11, which shows that the inventory holding period
for finished goods have decreased for the company, due to the sales of the company which
are increasing and the company is also able to lower its inventory holding costs.

41
5
5.5
6
6.5
7
20102011
2010
2011
Inventory Holding Period (Raw Materials)
It means the time when the raw materials are purchased and the time they are used in
production of the final goods. The time between purchasing of raw materials and using them
in production process is inventory holding period. A company always prefers that its raw
materials don’t remain idle and their purchases don’t go waste due to obsoleteness or by
getting spoiled.
Figure 4.2.23
From above figure 4.2.23 the inventory holding period (Raw Material) for the company in the
year 2010 is 6.72 and 2011 is 5.69, which indicates that the inventory holding period has
decreased in 2011 from 2010, and it’s a good sign for the company indicating lesser raw
materials getting spoiled and more utilization of raw materials in the company.
42
3.8
4
4.2
4.4
4.6
4.8
5
20102011
2010
2011
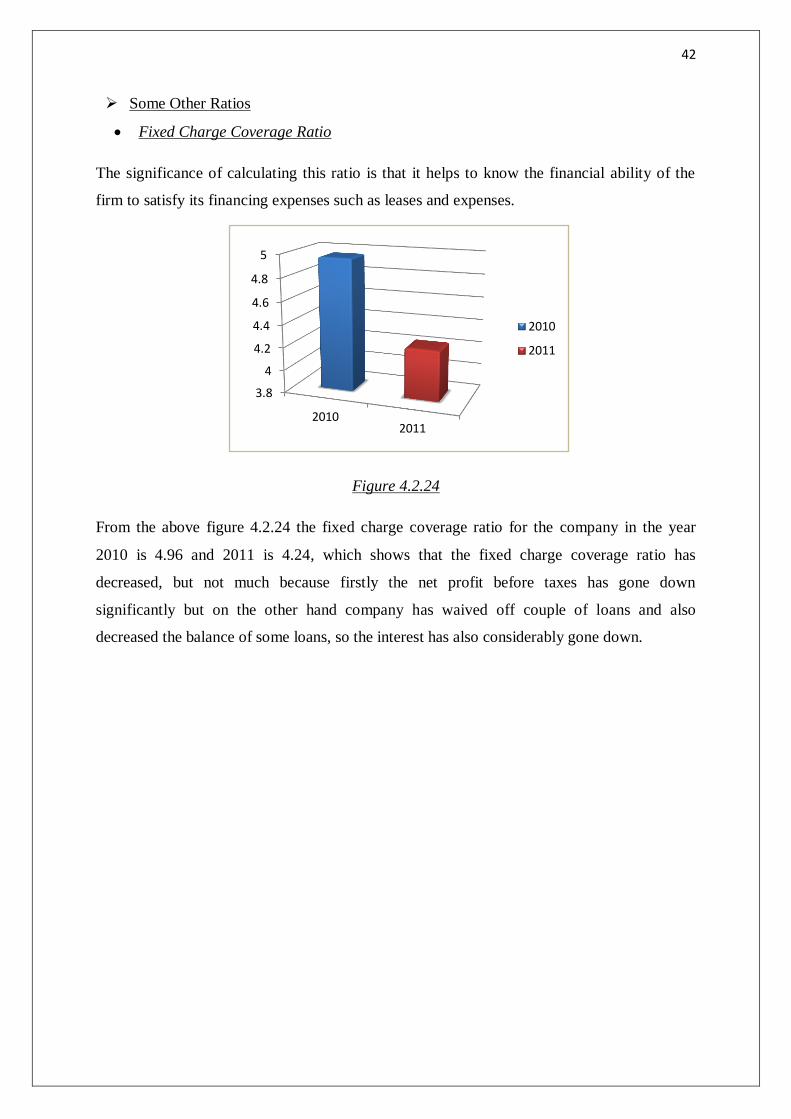
Some Other Ratios
Fixed Charge Coverage Ratio
The significance of calculating this ratio is that it helps to know the financial ability of the
firm to satisfy its financing expenses such as leases and expenses.
Figure 4.2.24
From the above figure 4.2.24 the fixed charge coverage ratio for the company in the year
2010 is 4.96 and 2011 is 4.24, which shows that the fixed charge coverage ratio has
decreased, but not much because firstly the net profit before taxes has gone down
significantly but on the other hand company has waived off couple of loans and also
decreased the balance of some loans, so the interest has also considerably gone down.

43
0
5
10
15
20
20102011
2010
2011
Over All Profitability Ratio
This ratio helps is deriving the overall profit that the business has been able to generate in the
financial year. It helps the comparison of the profit with the previous year or with some other
company.
Figure 4.2.25
From the above figure 4.2.25 the overall profitability ratio for the company in the year 2010
is 17.84 and 2011 is 11.55 and indicates that the ratio has decreased in the year 2011 from the
preceding year 2010, even though the net sales increased in the year 2011 but the amount of
expenditure was greater in 2011 so the operating before decreased and thus the profitability
of the business also went down. There was an increase in material and manufacturing
expenses, salaries and benefits and administrative and selling expenses. Expenditure should
be controlled in order to increase the operating profits.

44
4.3 Analysis of Comparative Balance Sheet of Krishna Maruti ltd.
As at As at Absolute Percentage 31.03.2011 (Rs. 31.03.2010 (Rs. Increase(Decrease) Increase(Decrease)
Particulars In Lacs) In Lacs) 2010-2011 2010-2011
A. Sources of Funds:
Shareholders’ Funds
Share Capital 424.10 424.10 0.00 0.00 Reserves and Surplus 8334.79 6543.15 1791.64 21.50
8758.89 6967.25 1791.64 20.46
Loan Funds
Secured Loans 8583.17 9998.97 -1415.80 -16.50 Unsecured Loans 0.00 300.00 -300.00 0.00
8583.17 10298.97 -1715.80 -19.99 Deferred Tax
Liability 514.47 544.65 -30.18 -5.87
TOTAL 17856.53 17810.87 45.66 0.26
B. Applications of Funds:
Fixed Assets
Gross Block 27031.18 27614.61 -583.43 -2.16 Less: Depreciation 15123.88 13310.44 1813.44 11.99
Net Block 11907.30 14304.17 -2396.87 -20.13 Capital work in
Progress 1858.88 1104.22 754.66 40.60
13766.18 15408.38 -1642.20 -11.93
Investments 341.99 967.32 -625.33 -182.85
Current Assets, Loans and Advances
Inventories 2620.30 2402.33 217.97 8.32 Sundry Debtors 7312.21 6169.52 1142.69 15.63 Cash and Bank
Balances 385.80 349.85 35.95 9.32 Loans and Advances 6440.38 8658.98 -2218.60 -34.45
16758.69 17580.69 -822.00 -4.90
Less: Current Liabilities and
Provisions
Current Liabilities &
Provisions 13010.32 16145.51 -3135.19 -24.10
Net Current Assets 3748.37 1435.18 2313.19 61.71
TOTAL 17856.54 17810.87 45.67 0.26

45
1. Share Capital
As from our Analysis, there has been neither increase nor decrease in the issuance of the
shares, therefore no issuance of shares have taken place.
2. Reserve and Surplus
From our Analysis, the amount of reserve and surplus increased in the year 2011 from the
preceding year 2010 because of the increase in the amount of profit and loss a/c. It is a good
sign for the company as it indicates that firm is making a good profit and has more of its own
funds which are being added to reserve and surplus account.
Absolute Increase/Decrease
(2010 – 2011)
0.00
Percentage Increase/Decrease
(2010 – 2011)
0.00%
Absolute Increase
(2010 – 2011)
1791.64
Percentage Increase
(2010 – 2011)
20.46%

46
3. Shareholder’s Funds
The shareholder’s funds have increased in the year 2011 due to increase in the amount of
reserve and surplus of the company.
4. Secured Loans
As from our analysis, the amount of secured loans has decreased in the year 2011 from the
preceding year 2010 because of repayment of loans done by the company like BCS –
CITIBANK Loan was finished by the company and repayment of term loans.
Absolute Increase
(2010 – 2011)
1791.64
Percentage Increase
(2010 – 2011)
20.46%
Absolute Decrease
(2010 – 2011)
-1415.80
Percentage Decrease
(2010 – 2011)
-16.50%

47
5. Unsecured Loans
From the analysis, the amount of unsecured loans has been finished in the year 2011 from its
preceding year 2010 in which some amount was available. This is a good step by the
company as it leads to lower interest amount payments.
6. Loan Funds
As from our analysis conducted, the loan’s figure of the company has gone down quite
drastically and it’s a good sign for the company. The percentage change in the figure of the
loan’s funds is also significant.
Absolute Decrease
(2010 – 2011)
-300.00
Percentage Decrease
(2010 – 2011)
0.00%
Absolute Decrease
(2010 – 2011)
-1715.80
Percentage Decrease
(2010 – 2011)
-19.99%

48
7. Deferred Tax Liability
As from the analysis done, the amount of Deferred Tax liability has decreased in the year
2011 from the preceding year 2010. It is a good sign for the company as the tax liability has
been decreased in the financial year 2011.
8. Fixed Assets
From the Analysis done, the amount of fixed assets in 2011 is less than preceding year 2010
reason being sale of fixed assets being done. Major Sales that took are of plant and machinery
present in the company. Little additions have been made in the company in terms of fixed
assets.
Absolute Decrease
(2010 – 2011)
-30.18
Percentage Decrease
(2010 – 2011)
-5.87%
Absolute Decrease
(2010 – 2011)
-583.43
Percentage Decrease
(2010 – 2011)
-2.16%

49
9. Depreciation
The amount of depreciation being higher because of rate of depreciation for plant and
machinery is high and it has increased in the financial years.
10. Net Block
The amount of net block would be less in 2011 as compared to 2010 because of the decrease
in the amount of fixed assets and increase in the amount of depreciation for the year ending
2011, the amount of net block is less than from the year 2010.
Absolute Increase
(2010 – 2011)
1813.44
Percentage Decrease
(2010 – 2011)
11.99%
Absolute Decrease
(2010 – 2011)
-2396.87
Percentage Decrease
(2010 – 2011)
-20.13%

50
11. Capital Work in Progress
From the analysis done, the working capital has increased in the business as from the annual
report we could also rectify that the amount has increased in the working capital for the year
2011 from the preceding year 2010.
12. Applications of Funds
The total funds of the company have decreased in the year 2011 from the preceding year
2010, Reason being higher rate of depreciation of the assets.
Absolute Increase
(2010 – 2011)
754.66
Percentage Increase
(2010 – 2011)
40.60%
Absolute Decrease
(2010 – 2011)
-1642.20
Percentage Decrease
(2010 – 2011)
-11.93%

51
13. Investments
The amount of investments for the company has decreased in the year 2011 from the year
2010, reason being sale of many current investments done by the company.
14. Inventories
From the analysis done, the amount of inventories has increased for the company in the year
2011 from the preceding year 2010, reason being increased sales of the company in the year
2011 so it leads to increasing the work in progress and goods in transit inventories.
Absolute Decrease
(2010 – 2011)
-625.33
Percentage Decrease
(2010 – 2011)
-182.25%
Absolute Increase
(2010 – 2011)
217.97
Percentage Increase
(2010 – 2011)
8.32%

52
15. Sundry Debtors
The amount of sundry debtors have risen in 2011 from the preceding year 2010, reason being
amount in debt outstanding for more than 6 months has increased and amount of others debt
has also increased.
16. Cash and Bank Balances
From the analysis conducted, the amount in cash and bank balances have increased in the
year 2011 from the preceding year 2010, reason being increase in the cheques in hand of the
company, increase of balance in current accounts and increase of interest accrued on fixed
deposits.
Absolute Increase
(2010 – 2011)
1142.69
Percentage Increase
(2010 – 2011)
15.63%
Absolute Increase
(2010 – 2011)
35.95
Percentage Increase
(2010 – 2011)
9.32%

53
17. Loans and Advances
The amount of loans and advances that the company has provided has decreased in the year
2011 from the previous year 2010 because of decrease in advance recoverable in cash or
kind, reduction in advance tax amount and reduction of balance in amount with central excise
authorities.
18. Current Assets
The amounts of current assets have decreased in the year 2011 from a marginal amount due
to decrease in amount of loans and advances which the company has provided to the other
parties and other sections of the current assets have increased.
Absolute Decrease
(2010 – 2011)
-2218.60
Percentage Increase
(2010 – 2011)
-34.45%
Absolute Decrease
(2010 – 2011)
-882.80
Percentage Increase
(2010 – 2011)
-4.90%

54
19. Current Liabilities and Provisions
As from the analysis conducted, the amount of current liabilities and provisions because of
amount due from micro and small enterprises, provision for gratuity amount and mark to
market forward contract have decreased.
20. Net Current Assets
As from the analysis conducted, the net current assets of the company have increased for the
year 2011 more in comparison to the year 2010. A good percentage increase can also be seen
which a good sign for the company’s growth.
Absolute Decrease
(2010 – 2011)
-3135.39
Percentage Increase
(2010 – 2011)
-24.10%
Absolute Increase
(2010 – 2011)
2313.19
Percentage Increase
(2010 – 2011)
61.71%

55
Chapter 5 - Conclusion
Summary of Findings
The Research conducted let to a number of findings which are of importance and are
summarised below in the following points:
The company currently has a low balance in readily cash available which means that if
daily expense emerges of a higher amount the company might have problem in
fulfilling it from the current resources available and might have to seek for some
external borrowing.
The debt – equity ratio has also decreased due to repayment of many long term loans
done be the company in the year ending 2010 which reflected less of debt in the year
2011.
The total liabilities of the company are still higher in comparison to the net worth of
the business.
Both the gross profit and net profit ratio of the company has increased which basically
reflects that proper use of production facilities by the company and proper payment of
taxes by the company.
The operating ratio has decreased which means that the expense of the company has
increased mainly administrative and selling expenses.
The expenses incurred in production process have been effectively handled by the
company as the ratio calculated and result derived is remarkable but on the other hand
the indirect expenses of the company has increased
The work capital ratio of the company has shown a much decline in the year 2011
which is not a good sign for the company.
The inventory being produced has increased for the company due to increase in sales
and effective use of raw materials is being taken place also which is seen through the
calculation of the ratios.
An Increase in the reserve and surplus of the company can be seen in the current year
ending 2011.
Company has sold many of its investments in the year ending 2011.
An increase in the debtors of the company can be seen due increased sales which
increase the debtor’s amount also.

56
Discussion of Research Question
1. The overall financial performance of Krishna Maruti ltd. is seen better in the year
ending 2011 due to repayment of loans and increase in the sales of the company in
comparison to the year ending 2010 but the amount of expenses in the year ending
2011 has also increased for Krishna Maruti ltd. which should be controlled by the
company in a proper manner.
2. The liquidity ratio can be seen better in the year 2011 for Krishna Maruti ltd. as due to
reduction in the liabilities of the company and increase in the income from the cash
generated from increased sales both the ratios i.e. current and quick ratio has shown a
rise from their previous year and are closer to the benchmark ratios.
3. The cash position for the company has shown a decline which is not a good sign for
the company because for supporting the cash needed the company has also took a step
and have sold off their investments but instead the company should try and maintain
sufficient cash for supporting their day to day activities.
4. Yes the expenses of the company which are directly related to the production of the
goods are under control and the ones which are not related to the production of goods
and are indirect expenses are not under controlled and have increased in the year
ending 2011.
Recommendations
The recommendations which I would like to provide from my side to the management is
that –
The company should able to maintain adequate amount of cash with them so that
the company can carry out its day to day activities without any hindrances.
The company should also try control its indirect expenses which are on a rise
mainly due to rise in the administrative expenses.
The company should also try and bring out its liabilities so that it is much closer to
the total net worth of the business and not greater than it.

57
Limitations
The limitations which I incurred in the research study are as follows –
The balance sheet audited for the company in the year 2010 was done by some
other firm in comparison to the balance sheet audited for the company in the year
2011, which basically leads to different calculations for amounts like depreciation
calculated and some variation can be seen in the ratios calculated.
58
References
1. Upadhyay, K.P (2001) , Nepalese Business Studies
2. Prather, Carol G (1999), Ratio analysis technique applied to personal Financial
Statements.
3. Martikainen, Teppo (1998), Journal of Business Economics.
4. Fujii, Mariko (2001), Research Centre for Advanced Economic Engineering.
5. Altman, Edward (1998), Journal of Finance.
6. Bravo, M I Gonzalez (2006), Journal of Operational Research Society.
7. Krivonozhko, V.E (2011), Journal of Management Mathematics.
8. Edmister, Robert O.(2009), Journal of Financial and Quantitative Analysis.
9. Singh, A.J (2002), Journal of Retail and leisure Property.
10. Athanassopoulos, Antreas D. (1994), Journal of Operational Research society.
11. Choi, D.S (1983), Journal of International Business Studies.
12. Salo, Ahti (2010), Journal of Management Sciences.
13. Ahrendsen, Bruce L. (2012), Agricultural Financial Review.
14. Royer, Jeffery S. (1991), Journal of Agricultural Cooperation.
15. De, Anupam (2011), Journal of Business Studies Quarterly.
16. Hsieh, Ting Ya (2001), Logistics Information Management.
17. Hsu, H. Christine (2010), Journal of College Teaching and Learning.
18. Irwin, Techniques of Financial Analysis
19. Gosh, T.P, Accounting and Finance for Managers

59
APPENDIX A – RATIO DEFINITIONS
Cash Position Ratios
Absolute Cash Ratio
Cash Reservoir
Current Liabilities
Cash Position to Total Assets Ratio
Cash Reservoir
*100
Total Assets
Interval Measure
Cash Reservoir
Average Daily Cash Expenses
Liquidity Ratios
Current Ratio
Current Assets
Current Liabilities
Quick Ratio
Quick Assets
Current Liabilities

60
Capital Structure Ratios
Debt – Equity Ratio
Debt
Equity
Proprietary ratio
Proprietary Funds
Total Assets
Total Liabilities to Net Worth Ratio
Total Liabilities
Net Worth
Profitability Ratio
Gross Profit Ratio
Gross Profit
*100
Sales
Net Profit Ratio
Net Profit
*100
Sales

61
Operating Profit Ratio
Operating Profit
*100
Sales
Return to Shareholders
Net Profit after Interest and Tax
Shareholder’s Fund
Return on Assets
Net Income
Total Assets
Return on Capital Employed
EBIT
Capital Employed
Expenses Ratios
Direct Expenses Ratio –
Raw Materials Expenses
Raw Materials Consumed
*100
Sales

62
Production Expenses
Production Expenses
*100
Sales
In - Direct Expenses Ratio –
Administrative and Selling Expenses Ratio
Administrative and Selling Expenses
*100
Sales
Turnover Ratios
Assets Turnover Ratio
Sales
Total Assets
Fixed Assets Turnover Ratio
Sales
Fixed Assets
Working Capital Turnover Ratio
Sales
Working Capital

63
Inventory Turnover Ratio For Finished Goods
Cost of Goods Sold
Average Inventory
Inventory Turnover Ratio For Raw Materials
Raw Materials Consumed
Average Inventory
Inventory Holding Period (Finished Goods)
365
Inventory Turnover Ratio
Inventory Holding Period (Raw Materials)
365
Inventory Turnover Ratio
Some Other Ratios
Fixed Charge Coverage Ratio
Net Profit before Interest and Tax
Interest Charges

64
Over All Profitability Ratio
Operating Profit
*100
Capital Employed

65
APPENDIX B – Excel Calculations
DATA 2010 (Rs. In Lacs) 2011 (Rs. In Lacs)
CASH RESERVOIR 1,317.17 727.79
CURRENT LIABILTIES 16145.51281 13,010.32
TOTAL ASSETS (CP RATIO) 34195.18605 31,033.23
AVERAGE DAILY CASH EXPENSES 255.641687 255.18
CURRENT ASSETS 17580.68846 16,758.69
QUICK ASSETS 7453.02212 7706.83
TOTAL DEBT 10298.97279 8,583.17
TOTAL EQUITY 6967.24825 8,758.89
TOTAL ASSETS 33956.38685 30,866.85
TOTAL LIABILITES 26989.1386 22,107.96
NET SALES 86,926.36 96,736.88
COST OF GOODS SOLD 75471.59592 82,460.06
GROSS PROFIT 11454.76408 14,276.82
NET PROFIT AFTER TAX 1547.52091 1,791.64
OPERATING PROFIT 3179.17119 2,003.46
EBIT 3179.17119 2,003.46
CAPITAL EMPLOYED 17810.87404 17,856.53
RAW MATERIALS CONSUMED 74995.34814 82,614.01
PRODUCTION EXPENSES 2237.03024 3,032.54
ADMINISTRATIVE & SELLING
EXPENSES
2033.88388 2,655.90
FIXED ASSETS 14304.16516 11,907.29
WORKING CAPITAL 1435.17565 3,748.37
AVERAGE INVENTORY 2579.32636 2511.315
AVERAGE INVENTORY(RAW
MATERIALS)
1382.31148 1289.17
INTEREST ON TERM LOAN 640.89055 472.32
TANGIBLE ASSETS 16706.49894 14527.59

66
TYPES OF RATIOS 2010 2011
CASH POSITION RATIOS
Absolute Cash Ratio = Cash Reservoir/Current Liabilities 0.081581181 0.06
Cash Position to Total Assets Ratio = Cash Reservoir/Total
Assets * 100
3.85191646 2.35
Interval Measure(Ability of Cash reservoir to meet Cash
Expenses) = Cash Reservoir/Average Daily Cash Expenses
5.152406932 2.85
LIQUIDITY RATIOS
Current Ratio = Current Assets/Current Liabilities 1.088890063 1.29
Quick Ratio = Quick Assets/Current Liabilities 0.461615695 0.59236283
2
CAPITAL STRUCTURE RATIOS
Debt - Equity Ratio = Debt/Equity 1.478198052 0.98
Proprietary Ratio = Proprietary Funds/Total Assets 0.205182262 0.28376364
9
Total Liabilities to Net Worth Ratio = Total Liabilities/Net
Worth
1.714756604 1.41
PROFITABILTY RATIOS
SHAREHOLDER'S EQUITY 6967.24825 8,758.89
INVESTMENTS 967.31648 341.99
NET WORTH 15739.34081 15,655.66

67
Gross Profit Ratio = Gross Profit/Sales * 100 13.17754946 14.7584044
5
Net Profit Ratio = Net Profit/Sales * 100 1.78026655 1.85207544
4
Operating Profit Ratio = Operating Profit/Sales * 100 3.657315445 2.07104053
8
Return to Shareholders = Net Profit After Interest and
Tax/Shareholder's Fund
0.222113646 0.20455103
3
Return on Assets = Net Income/Total Assets 0.04557378 0.05804414
8
Return on Capital Employed = EBIT/Capital Employed 0.17849608 0.11
EXPENSES RATIOS
Direct Expenses Ratio -
Raw Materials Consumed/Sales*100 86.27457556 85.40
Production Expenses/Sales*100 2.573477412 3.13483337
5
Indirect Expenses Ratio -
Administrative & Selling Expenses/Sales*100 2.339778037 2.74548858
7
TURNOVER RATIOS
Assets Turnover = Sales/Total Assets 2.559941386 3.13400557
6
Fixed Assets Turnover = Sales/Fixed Assets 6.076996387 8.12

68
Working Capital Turnover = Sales/Working Capital 60.5684468 25.8077190
9
Inventory Turnover(For Finished Goods) = Cost of Goods
Sold/Average Inventory
29.26019642 32.8354109
3
Inventory Turnover(For Raw Materials) = Raw Materials
Consumed/Average Inventory(For Raw Materials)
54.25358121 64.0830999
8
Inventory Holding Period(For Finished Goods) =
365/Inventory Turnover Ratio
12.474284 11.1160478
8
Inventory Holding Period(For Raw Materials) =
365/Inventory Turnover Ratio
6.727666485 5.69572945
3
Some Other Ratios
Fixed Charge Coverage Ratios = Net Profit Before Interest
and tax/Interest Charges
4.960552453 4.24174288
6
Over All Profitability Ratio = Operating Profit/Capital
Employed*100
17.84960796 11.2197610
6

69
COMPARATIVE BALANCE SHEET
Particulars As at
31.03.2011
(Rs. In Lacs)
As at
31.03.2010
(Rs. In Lacs)
Absolute
Increase(Decrease
) 2010-2011
Percentage
Increase(Decrease)
2010-2011
A. Sources of
Funds:
Shareholders’
Funds
Share Capital 424.10 424.10 0.00 0.00
Reserves and
Surplus
8334.79 6543.15 1791.64 21.50
8758.89 6967.25 1791.64 20.46
Loan Funds
Secured Loans 8583.17 9998.97 -1415.80 -16.50
Unsecured Loans 0.00 300.00 -300.00 0.00
8583.17 10298.97 -1715.80 -19.99
Deferred Tax
Liability
514.47 544.65 -30.18 -5.87
TOTAL 17856.53 17810.87 45.66 0.26
B. Applications
of Funds:
Fixed Assets
Gross Block 27031.18 27614.61 -583.43 -2.16
Less:
Depreciation
15123.88 13310.44 1813.44 11.99
Net Block 11907.30 14304.17 -2396.87 -20.13
Capital work in
Progress
1858.88 1104.22 754.66 40.60
13766.18 15408.38 -1642.20 -11.93

70
Investments 341.99 967.32 -625.33 -182.85
Current Assets,
Loans and
Advances
Inventories 2620.30 2402.33 217.97 8.32
Sundry Debtors 7312.21 6169.52 1142.69 15.63
Cash and Bank
Balances
385.80 349.85 35.95 9.32
Loans and
Advances
6440.38 8658.98 -2218.60 -34.45
16758.69 17580.69 -822.00 -4.90
Less: Current
Liabilities and
Provisions
Current
Liabilities &
Provisions
13010.32 16145.51 -3135.19 -24.10
Net Current
Assets
3748.37 1435.18 2313.19 61.71
TOTAL 17856.54 17810.87 45.67 0.26