summer fuels outlook - u.s. energy information … · 2017-04-11 · lower than last summer but...
TRANSCRIPT
U.S. Energy Information Administration | Summer Fuels Outlook April 2017 1
April 2017
Summer Fuels Outlook
This outlook focuses on prices and consumption for gasoline, diesel, and electricity (see Summer Fuels Outlook motor gasoline table and electricity table). The use of these fuels typically peaks during the summer months.
Gasoline and Diesel
U.S. motor gasoline. EIA considers the summer season for gasoline and diesel to run from April through September. EIA expects the retail price of regular-grade gasoline will average $2.46 per gallon (gal) during summer 2017, up from an average of $2.23/gal last summer. Gasoline prices are forecast to be higher this summer compared with last year primarily because of Brent crude oil prices, which are expected to average $8 per barrel (b) higher than during last summer. The forecast monthly average retail price of gasoline increases from $2.39/gal in April to $2.51/gal in July before falling to $2.43/gal in September.
Daily and weekly national average prices of gasoline can differ significantly from monthly and seasonal averages. There are also significant differences across regions, with monthly average prices in some areas exceeding the national average price by 40 cents/gal or more. Unplanned refinery outages or other disruptions to supply can also lead to regional product prices rising above forecast levels. EIA forecasts average summer retail gasoline prices to range from a high of $2.87/gal in Petroleum Administration for Defense District 5 (PADD 5) on the West Coast to a low of $2.21/gal in PADD 3 (Gulf Coast).
Because gasoline taxes and retail distribution costs are generally stable, movements in gasoline and diesel prices are primarily the result of changes in crude oil prices and wholesale margins.
The Brent crude oil price is forecast to average $54/b ($1.29/gal) this summer, compared with an average of $46/b ($1.09/gal) last summer. Any difference between actual crude oil prices and EIA’s forecast would likely be reflected in the retail price of fuel at the pump. Absent other factors specific to the gasoline and diesel fuel markets, each dollar per barrel of sustained price change in crude oil compared with the forecast translates into a 2.4-cent-per-gallon change in product prices.
EIA expects wholesale gasoline margins (the difference between the wholesale price of gasoline and the Brent crude oil price) will average 43 cents/gal this summer, which would be 2 cents/gal lower than last summer but equal to the previous five-summer average. Wholesale margins are forecast to be lower this summer compared with last summer primarily because of flattening gasoline demand growth after strong growth in the previous two years.

U.S. Energy Information Administration | Summer Fuels Outlook April 2017 2
The market’s expectation of uncertainty in monthly average gasoline prices is reflected in the pricing and implied volatility of futures and options contracts. New York Harbor reformulated blendstock for oxygenate blending (RBOB) futures contracts for July 2017 delivery that were traded over the five-day period ending April 6 averaged $1.70/gal. The probability that the RBOB futures price will exceed $2.00/gal (consistent with a U.S. average regular gasoline retail price above $2.75/gal) in July 2017 is 8%. The probability that the RBOB futures price will fall below $1.50/gal (consistent with a U.S. average regular gasoline retail price below $2.25/gal) in July 2017 is 17%.
For all of 2017, the average retail gasoline price is forecast to be $2.39/gal, which if realized would result in the average U.S. household spending about $200 more on transportation-related expenses in 2017 compared with 2016. Despite this expected increase in expenditures, average household transportation expenses are forecast to be about $300 lower this year compared with average annual expenditures from 2012-16.
For summer 2017, EIA forecasts motor gasoline consumption to average 9.5 million barrels per day (b/d), up about 20,000 b/d (0.3%) compared with last summer, which was a record high. Highway travel is forecast to be 1.4% higher than the level last summer. The effect of the increase in highway travel is expected to be partially offset by a 1.2% increase in fleet-wide vehicle fuel efficiency.
Finished motor gasoline is supplied by four sources: domestic refinery output, fuel ethanol blending, net imports of gasoline and gasoline blending components, and withdrawals from primary inventories. EIA expects that domestic refinery production, including gasoline blendstock output, will be about 20,000 b/d lower this summer than last summer. Fuel ethanol blending into gasoline this summer is projected to increase by almost 20,000 b/d from last summer’s level to 960,000 b/d, which is 10.1% of total gasoline consumption. Projected total gasoline net imports (including blending components) are expected to be up 50,000 b/d from last summer’s level, and the rate of gasoline stock withdrawals is projected to be about 20,000 b/d lower than last summer.
At the beginning of the summer driving season (April 1), total gasoline stocks were 238.7 million barrels, 4.7 million barrels lower than a year ago but 10.4 million barrels above the five-year average for beginning-of-season stocks. This summer, the total gasoline stock draw is projected to average over 60,000 b/d. Total gasoline inventories are projected to end the summer at 226.8 million barrels, almost the same as last year’s level at that time but 9.7 million barrels above the previous five-year average. Stock withdrawals have become an increasingly significant source of motor gasoline supply for the summer season in recent years, having averaged 60,000 b/d during the previous five summers and 90,000 b/d last summer, compared with an average of 30,000 b/d over the 10 summers from 2002-11.
Diesel fuel. Forecast consumption of distillate fuel, which includes diesel fuel and heating oil, averages 3.9 million b/d this summer. This level is 120,000 b/d (3.2%) higher than last summer’s consumption and closer to levels from summer 2015, as summer 2016 distillate consumption

U.S. Energy Information Administration | Summer Fuels Outlook April 2017 3
was down 3.4% from the summer of 2015. This growth is mainly driven by a combination of higher economic growth, industrial output, and international trade activity, all of which contribute to higher trucking activity. High oil and coal production also could contribute to diesel consumption growth. Increases in oil drilling activity leads to higher consumption of distillate fuel, which is used to operate and transport drilling rigs. Higher coal production leads to increased rail shipments, which consumes diesel fuel.
Distillate fuel is supplied by four sources: domestic refinery output, biodiesel blending, withdrawals from primary inventories, and net imports. EIA expects refinery output of distillate fuel to average 4.8 million b/d this summer, down about 20,000 b/d from last summer’s level. The production of biodiesel is forecast to average nearly 110,000 b/d this summer, up almost 6,000 b/d from last summer. Projected net exports of distillate fuel average just under 1.0 million b/d this summer, down from 1.2 million b/d last summer.
Distillate inventories are projected to start the summer at 152.2 million barrels. This level is down from the 160.6 million barrels recorded at the start of last summer but still 20.8 million barrels above the previous five-year average. Distillate inventories typically build during the summer season in preparation for the winter heating season. This summer, the build is forecast to average 49,000 b/d, up from a small draw recorded last summer and higher than the five-year average summer build of 45,000 b/d. Forecast end-of-summer stocks are 161.2 million barrels, down slightly from the 160.4 million barrels recorded at the end of last summer and 21.6 million barrels above the five-year end-of-summer average.
Forecast wholesale diesel fuel margins average 42 cents/gal this summer, 8 cents/gal above last summer’s level and equal to the previous five-summer average. Diesel margins are forecast to recover from weak levels seen last year as U.S. distillate consumption is forecast to increase by 3.2% this summer.
In 2016, diesel margins were pushed lower by a decline in U.S. consumption along with a continuing switch in the composition of economic activity in emerging markets (particularly China) away from diesel-intensive manufacturing, which reduced growth in distillate demand. However, in addition to forecast distillate consumption growth in the United States, relatively strong readings from global manufacturing indexes during the first quarter of 2017 suggest global distillate consumption growth could be higher than in 2016.
Although diesel margins are expected to increase this summer compared with last summer, a buildout of refinery capacity geared toward diesel production in the past several years is expected to provide for ample distillate fuel supplies and moderate any significant further upward pressure on distillate margins.
With higher wholesale diesel margins and crude oil prices, retail diesel prices are forecast to be higher this summer compared with last year. Diesel fuel retail prices are projected to average $2.70/gal this summer, up from an average of $2.34/gal last summer but still below the recent five-year average of $3.36/gal.

U.S. Energy Information Administration | Summer Fuels Outlook April 2017 4
Electricity
For electricity, EIA considers summer to run from June through August. Total retail sales of electricity in the United States typically peak in July or August, primarily because of air conditioning use by the residential and commercial sectors. In 2015, 87% of U.S. households used some form of air conditioning, up from 68% of households in 1993. Average U.S. population-weighted cooling degree days in the summer of 2016 reached the highest level since at least 1975. According to projections from the National Oceanic and Atmospheric Administration (NOAA), cooling degree days this summer are expected to be 10.5% lower than last summer and 1.2% below the previous 10-year summer average.
As a result of forecast cooler temperatures this summer, EIA expects the average U.S. residential customer will use about 5% less electricity this summer compared with last year. Lower forecast temperatures throughout the country contribute to a forecast of reduced electricity use in all regions of the United States, ranging from 1% lower electricity use in the West South Central states to 8% lower use in the Middle Atlantic states.
EIA expects the U.S. residential electricity price this summer to be 2.4% higher than last summer, primarily as a result of higher generation fuel costs. Prices are expected to be higher this summer in all regions of the country, except for the New England states where summer residential prices are expected to be almost 1% lower than last summer.
The reduction in expected electricity use offsets the expected increase in retail prices in most regions. EIA forecasts the average U.S. residential customer will spend 2.6% less on their summer electricity bill compared with last summer. Electricity bills are lower in most regions of the country except the West North Central and West South Central states, where forecast growth in electricity prices is greater than the expected drop in summer electricity consumption.
Milder summer temperatures contribute to lower forecast levels of U.S. total generation, averaging 12.6 terawatthours per day in June, July, and August, which is 2.4% below average U.S. generation last summer. Forecast coal-fired power generation in summer 2017 is 4.2% lower compared with last summer, and EIA expects natural gas-fired power generation will be 9.1% lower than last summer. Part of the large decline in natural gas-fired generation reflects higher forecast natural gas prices, which encourages generation from other types of fuels. Also, record levels of precipitation along the West Coast are expected to raise hydroelectric generation 28% above summer 2016 levels.
Changes in the mix of electricity generation is also driven in part by changes in the nation’s electric generating capacity. The U.S. electric power sector is now expanding its fleet of generators powered by natural gas, wind, and solar. Natural gas-fired generation capacity by the end of August 2017 is scheduled to grow by 10.5 gigawatts (GW), or 2%, from the capacity level last summer. The electric power sector plans to expand wind capacity by 9.2 GW (12%) and utility-scale solar capacity by 7.5 GW (45%) above the capacity at the end of summer 2016.
Q2 Q3 Season Q2 Q3 Season Q2 Q3 Season
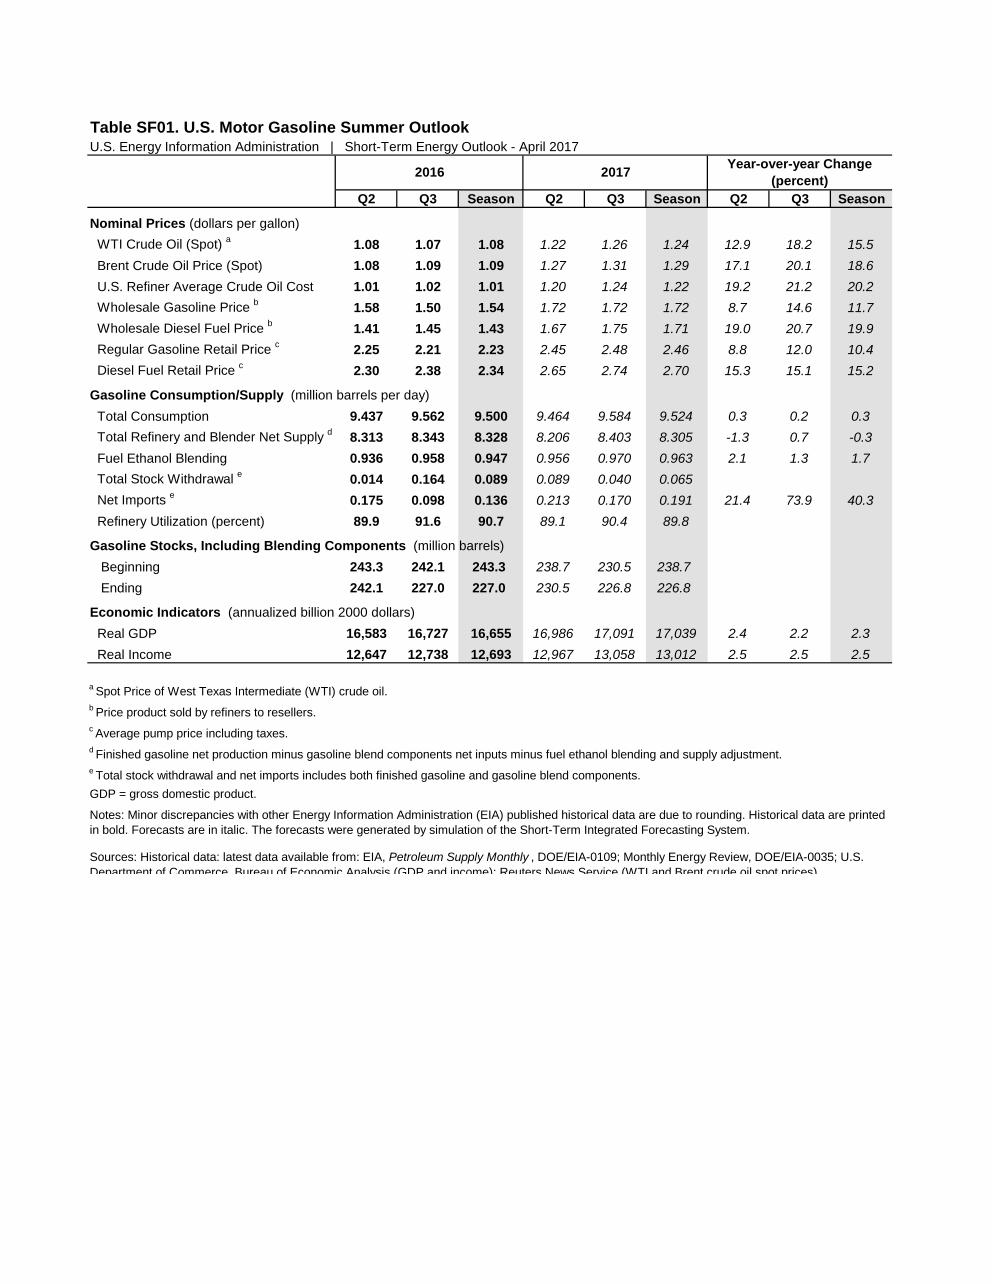
Nominal Prices (dollars per gallon) WTI Crude Oil (Spot) a 1.08 1.07 1.08 1.22 1.26 1.24 12.9 18.2 15.5 Brent Crude Oil Price (Spot) 1.08 1.09 1.09 1.27 1.31 1.29 17.1 20.1 18.6 U.S. Refiner Average Crude Oil Cost 1.01 1.02 1.01 1.20 1.24 1.22 19.2 21.2 20.2 Wholesale Gasoline Price b 1.58 1.50 1.54 1.72 1.72 1.72 8.7 14.6 11.7 Wholesale Diesel Fuel Price b 1.41 1.45 1.43 1.67 1.75 1.71 19.0 20.7 19.9 Regular Gasoline Retail Price c 2.25 2.21 2.23 2.45 2.48 2.46 8.8 12.0 10.4 Diesel Fuel Retail Price c 2.30 2.38 2.34 2.65 2.74 2.70 15.3 15.1 15.2
Gasoline Consumption/Supply (million barrels per day) Total Consumption 9.437 9.562 9.500 9.464 9.584 9.524 0.3 0.2 0.3 Total Refinery and Blender Net Supply d 8.313 8.343 8.328 8.206 8.403 8.305 -1.3 0.7 -0.3 Fuel Ethanol Blending 0.936 0.958 0.947 0.956 0.970 0.963 2.1 1.3 1.7 Total Stock Withdrawal e 0.014 0.164 0.089 0.089 0.040 0.065 Net Imports e 0.175 0.098 0.136 0.213 0.170 0.191 21.4 73.9 40.3 Refinery Utilization (percent) 89.9 91.6 90.7 89.1 90.4 89.8
Gasoline Stocks, Including Blending Components (million barrels) Beginning 243.3 242.1 243.3 238.7 230.5 238.7 Ending 242.1 227.0 227.0 230.5 226.8 226.8
Economic Indicators (annualized billion 2000 dollars) Real GDP 16,583 16,727 16,655 16,986 17,091 17,039 2.4 2.2 2.3 Real Income 12,647 12,738 12,693 12,967 13,058 13,012 2.5 2.5 2.5
Sources: Historical data: latest data available from: EIA, Petroleum Supply Monthly , DOE/EIA-0109; Monthly Energy Review, DOE/EIA-0035; U.S. Department of Commerce Bureau of Economic Analysis (GDP and income); Reuters News Service (WTI and Brent crude oil spot prices)
e Total stock withdrawal and net imports includes both finished gasoline and gasoline blend components.GDP = gross domestic product.
Notes: Minor discrepancies with other Energy Information Administration (EIA) published historical data are due to rounding. Historical data are printed in bold. Forecasts are in italic. The forecasts were generated by simulation of the Short-Term Integrated Forecasting System.
b Price product sold by refiners to resellers.c Average pump price including taxes.d Finished gasoline net production minus gasoline blend components net inputs minus fuel ethanol blending and supply adjustment.
Table SF01. U.S. Motor Gasoline Summer Outlook
2016 2017
U.S. Energy Information Administration | Short-Term Energy Outlook - April 2017
a Spot Price of West Texas Intermediate (WTI) crude oil.
Year-over-year Change(percent)

Forecast Change2012 2013 2014 2015 2016 2017 from 2016
United States
Usage (kWh) 3,354 3,130 3,038 3,165 3,316 3,153 ‐4.9%
Price (cents/kWh) 12.09 12.58 13.04 12.92 12.77 13.08 2.4%
Expenditures $405 $394 $396 $409 $423 $412 ‐2.6%
New England
Usage (kWh) 2,189 2,173 1,930 1,982 2,080 1,980 ‐4.8%
Price (cents/kWh) 15.50 16.04 17.63 18.65 18.44 18.29 ‐0.8%
Expenditures $339 $348 $340 $370 $384 $362 ‐5.6%
Mid‐Atlantic
Usage (kWh) 2,548 2,447 2,234 2,376 2,551 2,335 ‐8.4%
Price (cents/kWh) 15.63 16.39 16.90 16.37 15.99 16.72 4.6%
Expenditures $398 $401 $378 $389 $408 $391 ‐4.2%
East North Central
Usage (kWh) 3,048 2,618 2,505 2,565 2,903 2,703 ‐6.9%
Price (cents/kWh) 12.08 12.57 13.24 13.27 12.92 13.51 4.5%
Expenditures $368 $329 $332 $340 $375 $365 ‐2.6%
West North Central
Usage (kWh) 3,547 3,099 3,041 3,075 3,282 3,226 ‐1.7%
Price (cents/kWh) 11.50 12.25 12.42 12.65 12.78 13.09 2.4%
Expenditures $408 $380 $378 $389 $419 $422 0.7%
South Atlantic
Usage (kWh) 4,002 3,773 3,778 3,999 4,110 3,827 ‐6.9%
Price (cents/kWh) 11.65 11.76 12.09 12.04 11.88 12.20 2.7%
Expenditures $466 $444 $457 $482 $488 $467 ‐4.4%
East South Central
Usage (kWh) 4,468 4,079 4,034 4,279 4,435 4,164 ‐6.1%
Price (cents/kWh) 10.36 10.71 11.09 10.91 10.89 11.28 3.6%
Expenditures $463 $437 $447 $467 $483 $470 ‐2.7%
West South Central
Usage (kWh) 4,785 4,509 4,256 4,538 4,609 4,560 ‐1.1%
Price (cents/kWh) 10.27 10.94 11.46 11.03 10.55 10.75 1.9%
Expenditures $491 $493 $488 $501 $486 $490 0.8%
Mountain
Usage (kWh) 3,441 3,382 3,230 3,298 3,427 3,310 ‐3.4%
Price (cents/kWh) 11.55 11.97 12.32 12.33 12.08 12.30 1.8%
Expenditures $397 $405 $398 $407 $414 $407 ‐1.7%
Pacific
Usage (kWh) 2,079 2,038 2,090 2,051 2,092 2,016 ‐3.6%
Price (cents/kWh) 13.78 14.47 15.17 15.33 15.98 16.00 0.1%
Expenditures $286 $295 $317 $314 $334 $323 ‐3.5%
Table SF02. Average Summer Residential Electricity Usage, Prices and ExpendituresU.S. Energy Information Administration | Short‐Term Energy Outlook ‐ April 2017
Notes: kWh = kilowatthours. All data cover the 3‐month period of June‐August of each year. Usage amounts represent total residential retail
electricity sales per customer. Prices and expenditures are not adjusted for inflation.
Source: EIA Form‐861 and Form‐826 databases, Short‐Term Energy Outlook.
www.eia.govU.S. Energy Information Administration Independent Statistics & Analysis
April 11, 2017
2017 Summer Fuels Outlook

Key factors driving the short-term oil market outlook• Global oil supply and consumption are expected to be relatively balanced
in 2017, keeping oil prices relatively stable and near current levels
• Brent crude oil prices are forecast to average $54/b in summer 2017, $8/b higher than last summer
• However, there is significant price uncertainty. The current values of futures and options contracts suggest a 10% probability WTI prices could exceed $60 per barrel in July, and a 3% probability of exceeding $65 per barrel, with price uncertainty increasing further into the forecast period
• Global liquids production is forecast to grow by 1.1 million b/d in 2017, driven by increases in the United States and OPEC
• World liquid fuels consumption is forecast to increase by 1.5 million b/d in 2017
• With global consumption expected to grow more than supply in 2017, global inventory builds slow significantly from 2016 levels
22017 Summer Fuels Outlook

EIA forecast Brent crude oil prices to average $54 per barrel this summer (April-September), $8 per barrel (20 cents per gallon) higher than last summer
Source: Short-Term Energy Outlook, April 2017
3
0
20
40
60
80
100
120
140
160
Jan-13 Jan-14 Jan-15 Jan-16 Jan-17 Jan-18
Forecast
$45 per barrelJuly 2016
$55 per barrelJuly 2017
$107 per barrelJuly 2014
$57 per barrelJuly 2015
Brent crude oil spot price (monthly average)dollars per barrel
2017 Summer Fuels Outlook

0
20
40
60
80
100
120
Jan-16 Jul-16 Jan-17 Jul-17 Jan-18 Jul-18
Historical WTI Spot Price
STEO Forecast
Nymex futures price
95% confidence interval
Notes: Price probabilities are calculated using Nymex market data for the five trading days ending April 6, 2017. Values not calculated for months with sparse trading in near-the-money options contracts.
Source: Short-Term Energy Outlook, April 2017
42017 Summer Fuels Outlook
EIA expects WTI prices to remain in the mid $50-per-barrel range in the forecast– but the market-implied confidence band is wideWTI pricedollars per barrel

Market derived probabilities from futures and options values imply about a 10% chance WTI prices will exceed $60 per barrel in July
Source: Short-Term Energy Outlook, April 2017
52017 Summer Fuels Outlook
0%
10%
20%
30%
40%
50%
Jan-17 Apr-17 Jul-17 Oct-17 Jan-18 Apr-18 Jul-18 Oct-18
Price > $60 Price > $70 Price > $80
Notes: Price probabilities calculated using Nymex market data for the five trading days ending April 6, 2017.Values not calculated for months with little trading in close-to-the-money options contracts.
Futures contract date
Probability of WTI price exceeding price level

The global liquid fuels market is forecast to be relatively balanced in 2017, which is expected to contribute to stable prices
-3
-2
-1
0
1
2
3
4
5
6
82
84
86
88
90
92
94
96
98
100
102
2012Q1 2013Q1 2014Q1 2015Q1 2016Q1 2017Q1 2018Q1
Implied stock change and balance (right axis)
World production (left axis)
World consumption (left axis)
forecast
Source: Short-Term Energy Outlook, April 2017
62017 Summer Fuels Outlook
World liquid fuels balancemillion barrels per day
y-o-y changemillion barrels per day
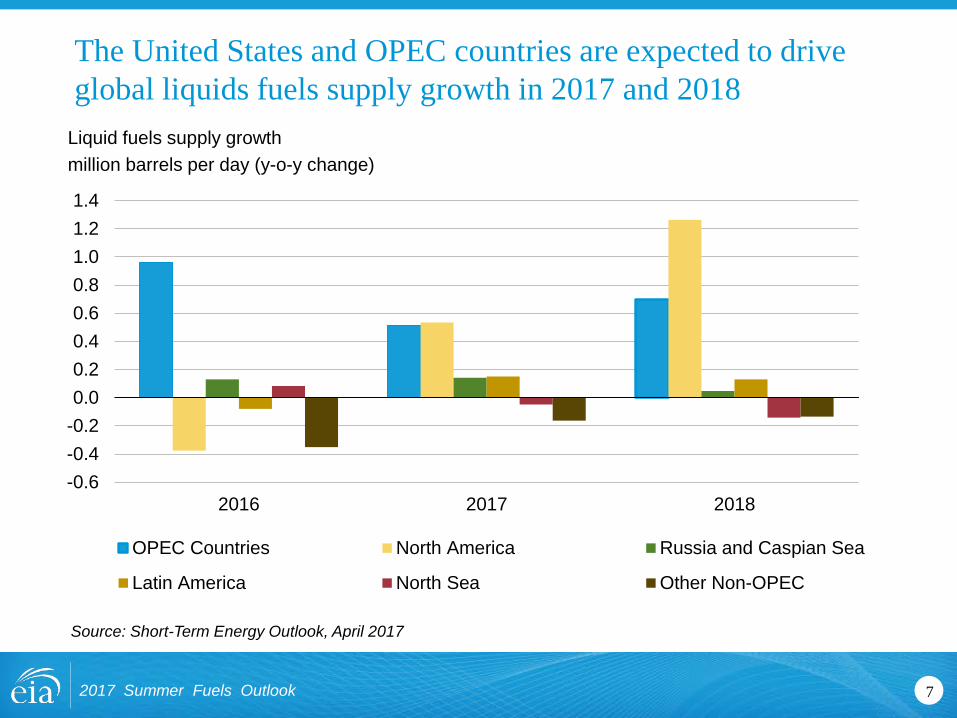
The United States and OPEC countries are expected to drive global liquids fuels supply growth in 2017 and 2018
-0.6-0.4-0.20.00.20.40.60.81.01.21.4
2016 2017 2018
OPEC Countries North America Russia and Caspian Sea
Latin America North Sea Other Non-OPEC
72017 Summer Fuels Outlook
Liquid fuels supply growthmillion barrels per day (y-o-y change)
Source: Short-Term Energy Outlook, April 2017

Global liquid fuels consumption is forecast to increase by 1.5 million b/d in 2017 and by 1.6 million b/d in 2018
82017 Summer Fuels Outlook
Liquid fuels consumptionmillion barrels per day
y-o-y changemillion barrels per day
forecast
-101234567891011
7880828486889092949698
100102
2010 2011 2012 2013 2014 2015 2016 2017 2018
Change in U.S. consumption (right axis)Change in China consumption (right axis)Change in other consumption (right axis)Total world consumption (left axis)
Source: Short-Term Energy Outlook, April 2017

Key takeaways for the summer 2017 (April-September) outlook for U.S. gasoline and diesel
• Higher Brent crude oil spot prices contribute to gasoline retail prices that average 23 cents/gallon higher than last summer and diesel prices that average 36 cents/gallon higher than last summer
• However, last summer’s retail gasoline prices were the lowest since 2004, and retail gasoline prices this summer are still expected to be 68 cents/gallon lower than the average price from the previous five summers of $3.15/gallon
• This summer, gasoline consumption is forecast to be 0.3% higher than last year’s record level summer consumption, as the effects of higher retail prices are more than offset by employment and income growth, which contribute to increasing highway travel
92017 Summer Fuels Outlook

Regular-grade gasoline retail price forecast averages $2.46 per gallon in summer 2017 compared with $2.23 per gallon last summer
102017 Summer Fuels Outlook
0
1
2
3
4
5
Jan-14 Jul-14 Jan-15 Jul-15 Jan-16 Jul-16 Jan-17 Jul-17 Jan-18
Retail - wholesale gasoline price difference
Wholesale gasoline - crude oil price difference
Brent crude oil price
Monthly retail price2014
Avg. $3.59
2015Avg. $2.63
2016Avg. $2.23
2017 ForecastAvg. $2.46
Summer average gasoline pricedollars per gallon
Source: Short-Term Energy Outlook, April 2017

Regular gasoline average summer retail prices vary by region
$2.18$2.44
$2.18 $2.39$2.00
$2.21$2.23 $2.42$2.65$2.87
0
1
2
3
4
5
2016 2017(Forecast)East Coast Midwest Gulf Coast Rocky Mountain West Coast
U.S. average = $2.23 U.S. average = $2.46
Source: Short-Term Energy Outlook, April 2017
112017 Summer Fuels Outlook
Regional summer average gasoline pricedollars per gallon
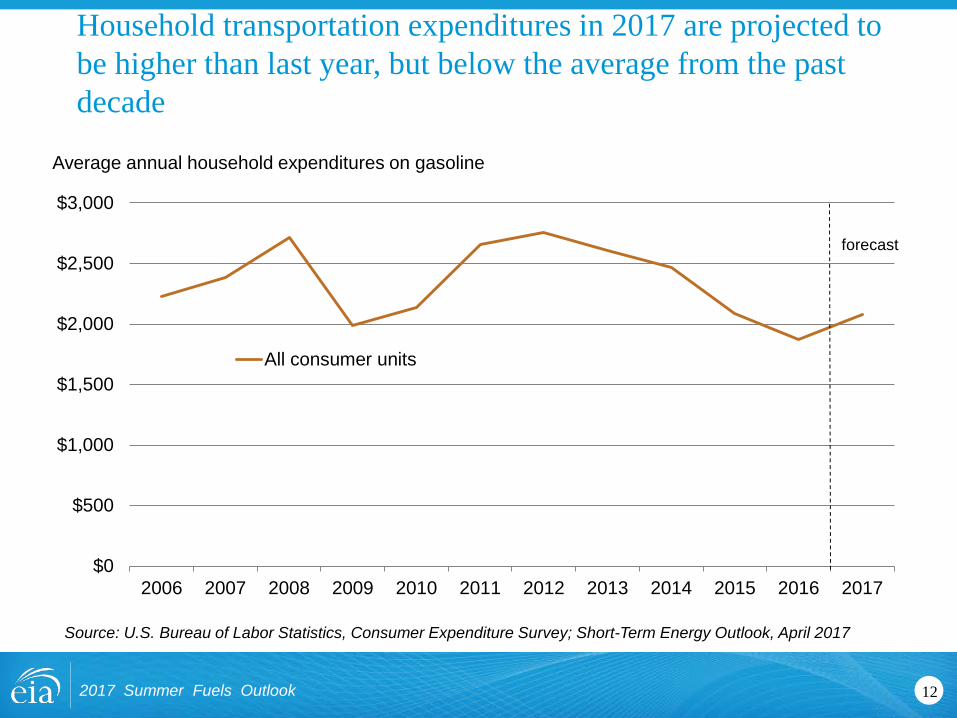
Household transportation expenditures in 2017 are projected to be higher than last year, but below the average from the past decade
Average annual household expenditures on gasoline
Source: U.S. Bureau of Labor Statistics, Consumer Expenditure Survey; Short-Term Energy Outlook, April 2017
122017 Summer Fuels Outlook
$0
$500
$1,000
$1,500
$2,000
$2,500
$3,000
2006 2007 2008 2009 2010 2011 2012 2013 2014 2015 2016 2017
All consumer units
forecast
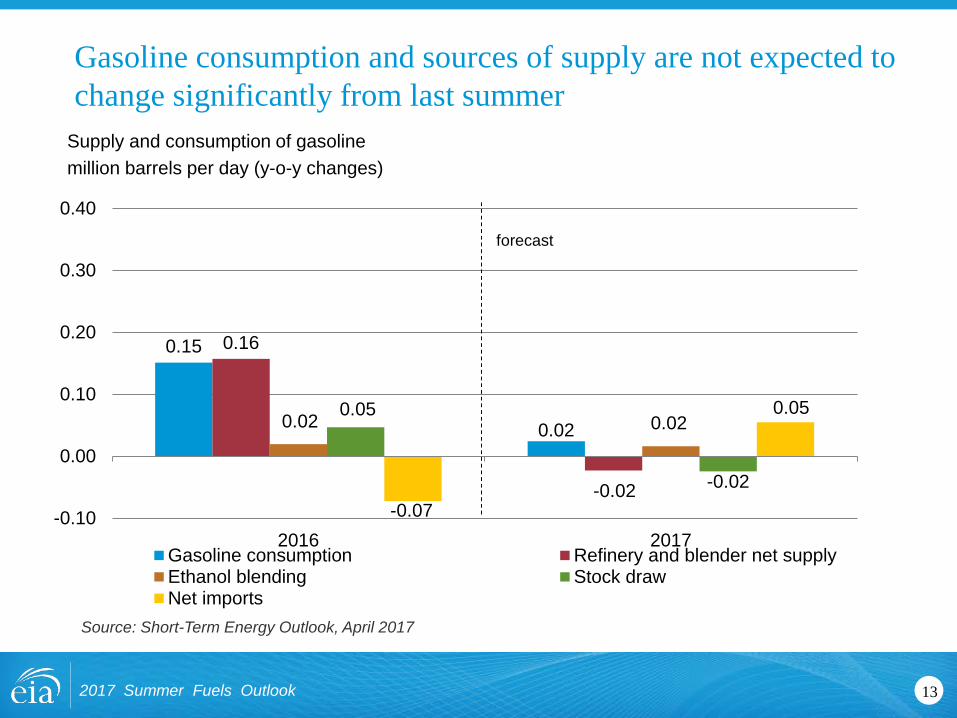
Gasoline consumption and sources of supply are not expected to change significantly from last summer
0.15
0.02
0.16
-0.02
0.02 0.020.05
-0.02-0.07
0.05
-0.10
0.00
0.10
0.20
0.30
0.40
2016 2017Gasoline consumption Refinery and blender net supplyEthanol blending Stock drawNet imports
forecast
Source: Short-Term Energy Outlook, April 2017
132017 Summer Fuels Outlook
Supply and consumption of gasolinemillion barrels per day (y-o-y changes)

Summer retail diesel price forecast averages $2.70 per gallon, up 36 cents per gallon from last summer
0
1
2
3
4
5
Jan-14 Jul-14 Jan-15 Jul-15 Jan-16 Jul-16 Jan-17 Jul-17 Jan-18
Retail - wholesale diesel price differenceWholesale diesel - crude oil price differenceBrent crude oil priceMonthly retail price
2014Avg. $3.89
2015Avg. $2.74
2016Avg. $2.34
2017 ForecastAvg. $2.70
Source: Short-Term Energy Outlook, April 2017
142017 Summer Fuels Outlook
Summer average diesel pricedollars per gallon

Summer temperatures are the main driver of residential electricity use
Source: Short-Term Energy Outlook, April 2017
152017 Summer Fuels Outlook
Average household electricity use (summer)kilowatthours
600
900
1,200
2,000
2,200
2,400
2,600
2,800
3,000
3,200
3,400
3,600
3,800
4,000
2012 2013 2014 2015 2016 2017
Summer average household electricity use (left axis)
U.S. summer cooling degree days (right axis)
forecast
cooling degree days
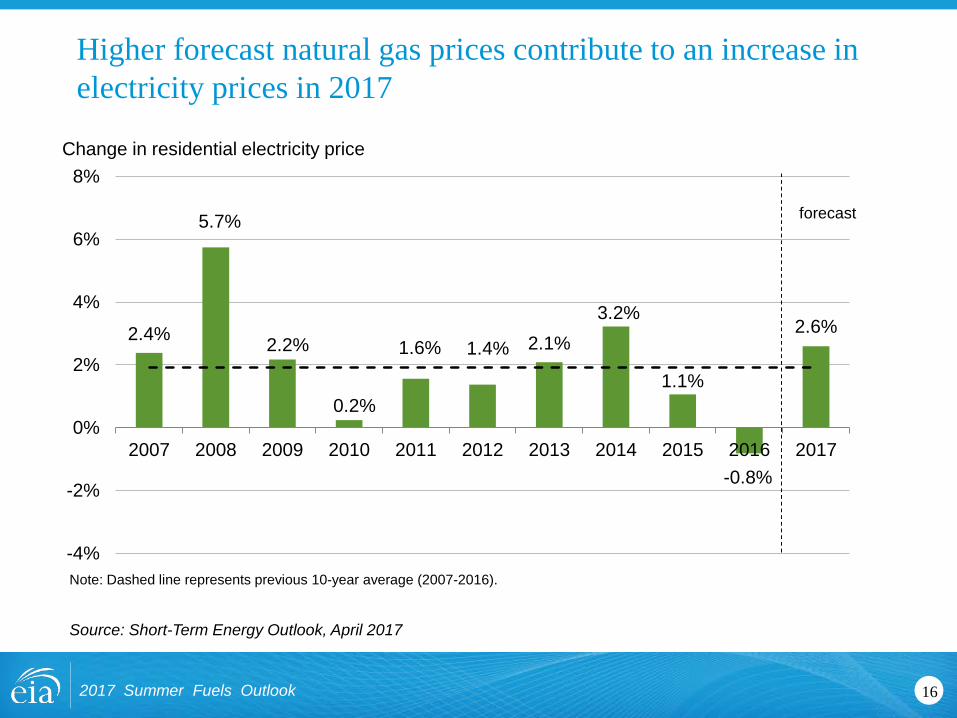
Higher forecast natural gas prices contribute to an increase in electricity prices in 2017
2.4%
5.7%
2.2%
0.2%
1.6% 1.4% 2.1%3.2%
1.1%
-0.8%
2.6%
-4%
-2%
0%
2%
4%
6%
8%
2007 2008 2009 2010 2011 2012 2013 2014 2015 2016 2017
forecast
Note: Dashed line represents previous 10-year average (2007-2016).
Source: Short-Term Energy Outlook, April 2017
162017 Summer Fuels Outlook
Change in residential electricity price

For more information
2017 Summer Fuels Outlook 17
U.S. Energy Information Administration home page | www.eia.gov
Short-Term Energy Outlook | www.eia.gov/steo
Annual Energy Outlook | www.eia.gov/aeo
International Energy Outlook | www.eia.gov/ieo
Monthly Energy Review | www.eia.gov/mer
Today in Energy | www.eia.gov/todayinenergy