summer diet of beluga whales inferred by fatty acid analysis of the eastern beaufort sea food web
TRANSCRIPT
Journal of Experimental Marine Biology and Ecology 374 (2009) 12–18
Contents lists available at ScienceDirect
Journal of Experimental Marine Biology and Ecology
j ourna l homepage: www.e lsev ie r.com/ locate / jembe
Summer diet of beluga whales inferred by fatty acid analysis of the eastern BeaufortSea food web
L.L. Loseto a,⁎, G.A. Stern b,c, T.L. Connelly d, D. Deibel d, B. Gemmill c, A. Prokopowicz e,L. Fortier e, S.H. Ferguson b,c
a School of Earth and Ocean Sciences, Bob Wright Centre A405, University of Victoria, Victoria BC, Canada V8W 3V6b Freshwater Institute/Fisheries and Oceans Canada, 501 University Cres., Winnipeg MB, Canada R3T 2N6c Department of Environment and Geography, University of Manitoba, 500 University Cres., Winnipeg MB, Canada R3T 2N2d Ocean Sciences Centre, Memorial University, St John's NL, Canada A1C 5S7e Department de Biologie, Université Laval, Pavillon Vachon, Quebec QC, Canada G1K 7P4
⁎ Corresponding author. Institute of Ocean Sciences (9860 West Saanich Rd, Sidney BC, Canada V8L 4B2. Tel.:363 6807.
E-mail address: [email protected] (L.L. Loset
0022-0981/$ – see front matter © 2009 Elsevier B.V. Adoi:10.1016/j.jembe.2009.03.015
a b s t r a c t
a r t i c l e i n f oArticle history:Received 26 November 2008Accepted 29 March 2009
Keywords:ArcticArctic codBenthicFeeding behaviourMarinePelagic
Beluga whales (Delphinapterus leucas) are the most abundant odontocetes in Arctic waters and are thusthought to influence food web structure and function. The diet of the Beaufort Sea beluga population is notwell known, partly due to the inherent difficulty of observing feeding behaviour in Arctic marine cetaceans.To determine which prey items are critical to the Beaufort Sea beluga diet we first examine and describe theMackenzie Delta and Beaufort Sea food web using fatty acid analyses. Fatty acid profiles effectivelypartitioned prey items into groups associated with their habitat and feeding ecology. Next, the relativecontribution of various prey items to beluga diet was investigated using fatty acids. Finally, beluga dietvariability was examined as a function of body size, a known correlate of habitat use. Beluga appeared to feedpredominantly on Arctic cod (Boreogadus saida) collected from near shore and offshore regions. Size relateddietary differences suggested larger sized beluga preferred offshore Arctic cod given the shared high levels oflong chain monounsaturates, whereas smaller sized beluga appeared to feed on prey in their near shorehabitats that included near shore Arctic cod. The presence of Arctic cod groups in shallow near shore anddeep offshore habitats may facilitate the behavioural segregation of beluga habitat use as it relates to theirsize and resource requirements. Given Arctic cod are a sea ice associated fish combined with the acceleratedsea ice loss in this region, beluga whales may need to adapt to new dietary regimes.
© 2009 Elsevier B.V. All rights reserved.
1. Introduction
Beluga whales (Delphinapterus leucas) are the most abundantodontocetes in Arctic waters (Brodie, 1989). As a result, they play acritical role in the Arctic marine food web structure and function.Arctic cod (Boreogadus saida) is thought to be an important foragespecies for some beluga populations (Dahl et al., 2000; Seaman et al.,1982; Welch et al., 1993); however, redfish (Sebastes marinus), halibut(Reinhardtius hippoglossoides), and shrimp (Pandalus borealis) werefound in Greenlandic beluga stomach contents (Heide-Jorgensen andTeilmann, 1994), whereas Pacific salmon (Oncorhynchus spp.) weredominant prey items for Alaskan beluga populations (Frost and Lowry,1981). These observations suggest beluga diet may be population andhabitat specific.
Fisheries and Oceans Canada),+1 250 363 6551; fax: +1 250
o).
ll rights reserved.
The diet of the Beaufort Sea beluga whale population is not wellknown partly due to the inherent difficulty of observing feedingbehaviour in Arctic marine cetaceans. Understanding the diet of thispopulation is of high priority to contaminant research, conservationmanagement and the local Inuvialuit communities who lead sub-sistent lifestyles. This population has had the highest mercurycontaminant loads in the Canadian Arctic (Lockhart et al., 2005),thus a comprehensive understanding of diet is required to identifycontaminant sources.
The Beaufort beluga population segregates with habitat use of seaice and bathymetry, varying with life stages (Loseto et al., 2006), acommon theme among marine mammals (Stevick et al., 2002). As aresult, sex and life stage are common factors driving differences in dietcomposition and feeding behaviour (e.g. the size dimorphic grey seal(Halichoerus grypus) (Beck et al., 2007)). The dietary biomarkers, fattyacids and stable isotopes, relate to beluga size and thus suggest dietdifferences among size classes and habitat use groups (Loseto et al.,2008a). However, fatty acids have not been used to determine preyitems in the diet of the Beaufort Sea belugas. Fatty acids havesuccessfully identified predator diets because they transfer from prey

Fig. 1. Study area of beluga and food web sampling regions: Amundsen Gulf, Franklin Bay, Mackenzie Delta, eastern Beaufort Sea. The 20 m isobath north of the Mackenzie outflow iswhere brackish water fish were collected, whereas the 200 m isobath separates the Mackenzie Shelf from the eastern Beaufort Sea. Hendrickson Island is the beluga harvest locationfor the community of Tuktoyaktuk, and Browns Harbour is the harvest location for the community of Paulatuk Northwest Territories, Canada.
Table 1Prey items for food web and beluga diet analysis, with abbreviations, sample size (n)and length (±SE) and sample location (M=Mackenzie, E.B.S.=eastern Beaufort Sea, F.Bay=Franklin Bay, Shelf N20 m isobath, Estuary b20misobath.
Prey item Abrev. n Length (cm) Sample Location
Arctic cisco ACS 31 31.1±0.6 M., EstuaryArctic cod (offshore) ACD 35 15.8±0.3 E.B.S., F. BayArctic cod (near shore) SACD 13 14.3±0.3 M., ShelfArctic flounder AFL 7 22.6±1.0 M., EstuaryLake white fish LWF 6 25.4±1.6 M., EstuaryLeast cisco LCS 10 28.5±0.8 M., EstuaryPacific herring PHR 20 20.7±0.2 M., ShelfRainbow smelt RST 9 20.3±1.6 M., EstuarySaffron cod SCD 12 28.0±1.1 M., ShelfStarry flounder SFL 14 24.7±1.3 M., EstuaryAcanthostephia malmgreni AMI 6 E.B.S., F. BayAnonyx spp. ANX 13 E.B.S., F. BayMysids MYS 31 E.B.S., F. BayShrimp SHP 19 E.B.S., F. BayThemisto libellula TLIB 32 E.B.S., F. Bay
13L.L. Loseto et al. / Journal of Experimental Marine Biology and Ecology 374 (2009) 12–18
to predator adipose or blubber tissue with little modification (Iverson,1993; Iverson et al., 2004). This biomarker approach has characterizedtrophic links within and among species (Budge et al., 2002; Iversonet al., 1997; Richoux et al., 2005; Stevens et al., 2004a; 2004b) as wellas determined predator diets in both marine and terrestrial mammals(Bradshaw et al., 2003; Iverson et al., 2001).
The biomarker δ15N along with the contaminant mercury, wereused to examine food webs and estimate the Beaufort Sea beluga dietas it related to their size and habitat use (Loseto et al., 2008b). Theymay feed on one or many of the available prey in the eastern BeaufortSea andMackenzie Delta that include several coastal, anadromous andmarine fish, in addition to invertebrates and bottom-feeding fish.Loseto et al. (2008b) hypothesized the following beluga sizedifferentiated diets based on habitat use: 1) smaller sized belugausing shallow, near shore open water habitats fed on near shoreestuarine prey in the Mackenzie Delta; 2) medium sized males andlarge females selecting ice edge habitats fed on offshore Arctic cod;and 3) largest male belugas selecting heavy sea ice concentrations indeep offshore waters, fed on the epibenthic food web. Although thesefeeding groups were supported by δ15N and mercury results, notenough information was available to validate the beluga diet.
To determine which prey items are important to the Beaufort Seabeluga diet we first investigate food web relationships among thepotential prey collected in the beluga summering region. Food webrelationships are evaluated using prey fatty acid profiles. Next, wedetermine which prey items are most important in the beluga dietusing a multivariate approach that combines beluga and prey fattyacid profiles, followed by an assessment of the relative importance ofprey items across the beluga body size range.
2. Materials and methods
2.1. Sample collection
2.1.1. BelugaBeluga blubber samples were collected during local harvests at
Hendrickson Island near the community of Tuktoyaktuk, and atBrowns Harbour near the community of Paulatuk, in NorthwestTerritories Canada (Fig. 1). A total of 43 samples were collected in July,from Tuktoyaktuk in 2004 (n=19) and 2005 (n=13) and from
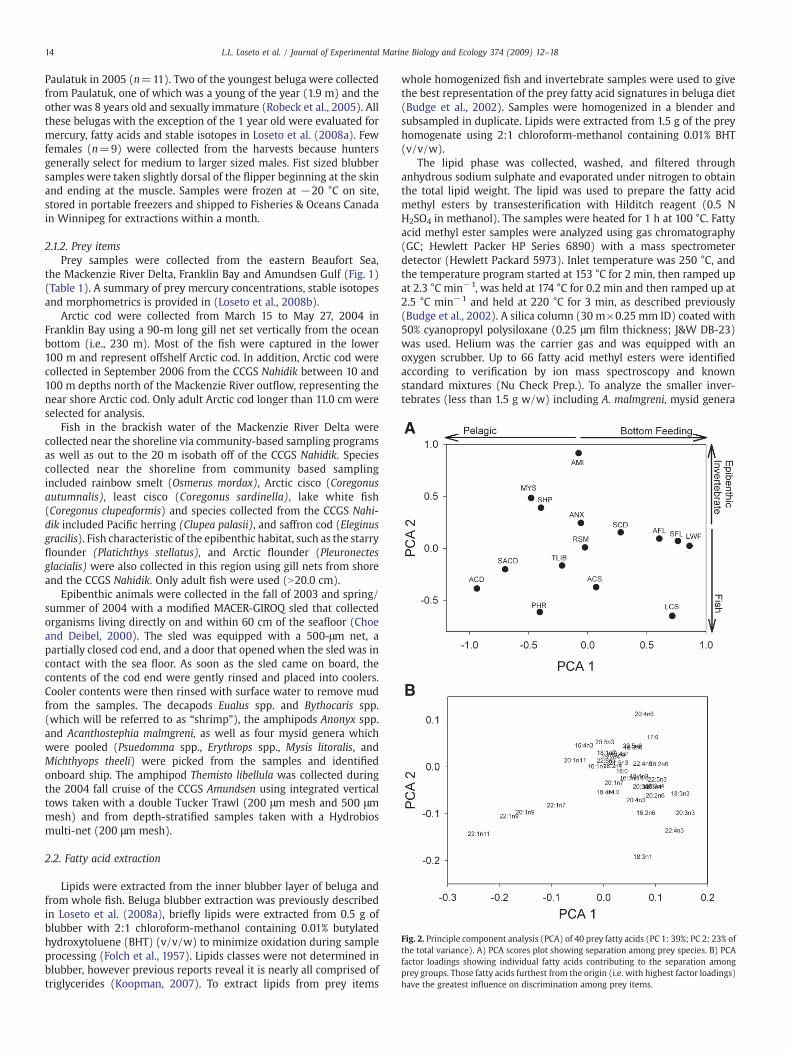
Fig. 2. Principle component analysis (PCA) of 40 prey fatty acids (PC 1: 39%; PC 2: 23% ofthe total variance). A) PCA scores plot showing separation among prey species. B) PCAfactor loadings showing individual fatty acids contributing to the separation amongprey groups. Those fatty acids furthest from the origin (i.e. with highest factor loadings)have the greatest influence on discrimination among prey items.
14 L.L. Loseto et al. / Journal of Experimental Marine Biology and Ecology 374 (2009) 12–18
Paulatuk in 2005 (n=11). Two of the youngest beluga were collectedfrom Paulatuk, one of which was a young of the year (1.9 m) and theother was 8 years old and sexually immature (Robeck et al., 2005). Allthese belugas with the exception of the 1 year old were evaluated formercury, fatty acids and stable isotopes in Loseto et al. (2008a). Fewfemales (n=9) were collected from the harvests because huntersgenerally select for medium to larger sized males. Fist sized blubbersamples were taken slightly dorsal of the flipper beginning at the skinand ending at the muscle. Samples were frozen at −20 °C on site,stored in portable freezers and shipped to Fisheries & Oceans Canadain Winnipeg for extractions within a month.
2.1.2. Prey itemsPrey samples were collected from the eastern Beaufort Sea,
the Mackenzie River Delta, Franklin Bay and Amundsen Gulf (Fig. 1)(Table 1). A summary of prey mercury concentrations, stable isotopesand morphometrics is provided in (Loseto et al., 2008b).
Arctic cod were collected from March 15 to May 27, 2004 inFranklin Bay using a 90-m long gill net set vertically from the oceanbottom (i.e., 230 m). Most of the fish were captured in the lower100 m and represent offshelf Arctic cod. In addition, Arctic cod werecollected in September 2006 from the CCGS Nahidik between 10 and100 m depths north of the Mackenzie River outflow, representing thenear shore Arctic cod. Only adult Arctic cod longer than 11.0 cm wereselected for analysis.
Fish in the brackish water of the Mackenzie River Delta werecollected near the shoreline via community-based sampling programsas well as out to the 20 m isobath off of the CCGS Nahidik. Speciescollected near the shoreline from community based samplingincluded rainbow smelt (Osmerus mordax), Arctic cisco (Coregonusautumnalis), least cisco (Coregonus sardinella), lake white fish(Coregonus clupeaformis) and species collected from the CCGS Nahi-dik included Pacific herring (Clupea palasii), and saffron cod (Eleginusgracilis). Fish characteristic of the epibenthic habitat, such as the starryflounder (Platichthys stellatus), and Arctic flounder (Pleuronectesglacialis) were also collected in this region using gill nets from shoreand the CCGS Nahidik. Only adult fish were used (N20.0 cm).
Epibenthic animals were collected in the fall of 2003 and spring/summer of 2004 with a modified MACER-GIROQ sled that collectedorganisms living directly on and within 60 cm of the seafloor (Choeand Deibel, 2000). The sled was equipped with a 500-μm net, apartially closed cod end, and a door that opened when the sled was incontact with the sea floor. As soon as the sled came on board, thecontents of the cod end were gently rinsed and placed into coolers.Cooler contents were then rinsed with surface water to remove mudfrom the samples. The decapods Eualus spp. and Bythocaris spp.(which will be referred to as “shrimp”), the amphipods Anonyx spp.and Acanthostephia malmgreni, as well as four mysid genera whichwere pooled (Psuedomma spp., Erythrops spp., Mysis litoralis, andMichthyops theeli) were picked from the samples and identifiedonboard ship. The amphipod Themisto libellula was collected duringthe 2004 fall cruise of the CCGS Amundsen using integrated verticaltows taken with a double Tucker Trawl (200 μm mesh and 500 μmmesh) and from depth-stratified samples taken with a Hydrobiosmulti-net (200 μm mesh).
2.2. Fatty acid extraction
Lipids were extracted from the inner blubber layer of beluga andfrom whole fish. Beluga blubber extraction was previously describedin Loseto et al. (2008a), briefly lipids were extracted from 0.5 g ofblubber with 2:1 chloroform-methanol containing 0.01% butylatedhydroxytoluene (BHT) (v/v/w) to minimize oxidation during sampleprocessing (Folch et al., 1957). Lipids classes were not determined inblubber, however previous reports reveal it is nearly all comprised oftriglycerides (Koopman, 2007). To extract lipids from prey items
whole homogenized fish and invertebrate samples were used to givethe best representation of the prey fatty acid signatures in beluga diet(Budge et al., 2002). Samples were homogenized in a blender andsubsampled in duplicate. Lipids were extracted from 1.5 g of the preyhomogenate using 2:1 chloroform-methanol containing 0.01% BHT(v/v/w).
The lipid phase was collected, washed, and filtered throughanhydrous sodium sulphate and evaporated under nitrogen to obtainthe total lipid weight. The lipid was used to prepare the fatty acidmethyl esters by transesterification with Hilditch reagent (0.5 NH2SO4 in methanol). The samples were heated for 1 h at 100 °C. Fattyacid methyl ester samples were analyzed using gas chromatography(GC; Hewlett Packer HP Series 6890) with a mass spectrometerdetector (Hewlett Packard 5973). Inlet temperature was 250 °C, andthe temperature program started at 153 °C for 2 min, then ramped upat 2.3 °C min−1, was held at 174 °C for 0.2 min and then ramped up at2.5 °C min−1 and held at 220 °C for 3 min, as described previously(Budge et al., 2002). A silica column (30 m×0.25 mm ID) coated with50% cyanopropyl polysiloxane (0.25 μm film thickness; J&W DB-23)was used. Helium was the carrier gas and was equipped with anoxygen scrubber. Up to 66 fatty acid methyl esters were identifiedaccording to verification by ion mass spectroscopy and knownstandard mixtures (Nu Check Prep.). To analyze the smaller inver-tebrates (less than 1.5 g w/w) including A. malmgreni, mysid genera
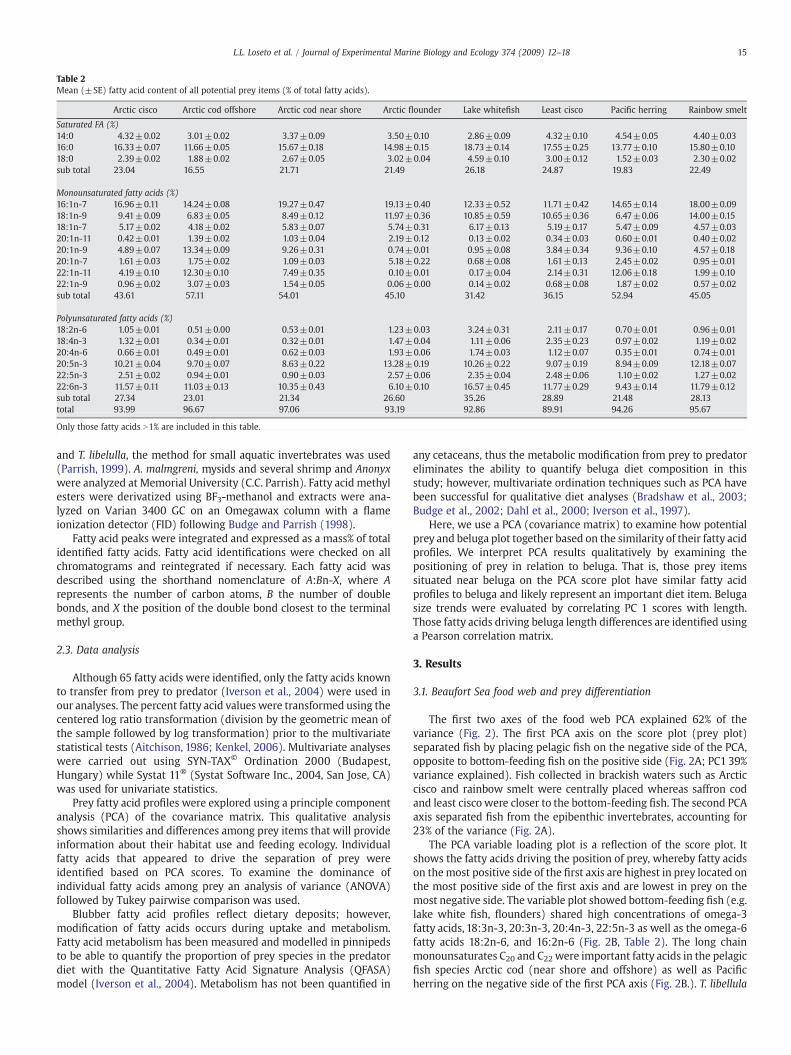
Table 2Mean (±SE) fatty acid content of all potential prey items (% of total fatty acids).
Arctic cisco Arctic cod offshore Arctic cod near shore Arctic flounder Lake whitefish Least cisco Pacific herring Rainbow smelt
Saturated FA (%)14:0 4.32±0.02 3.01±0.02 3.37±0.09 3.50±0.10 2.86±0.09 4.32±0.10 4.54±0.05 4.40±0.0316:0 16.33±0.07 11.66±0.05 15.67±0.18 14.98±0.15 18.73±0.14 17.55±0.25 13.77±0.10 15.80±0.1018:0 2.39±0.02 1.88±0.02 2.67±0.05 3.02±0.04 4.59±0.10 3.00±0.12 1.52±0.03 2.30±0.02sub total 23.04 16.55 21.71 21.49 26.18 24.87 19.83 22.49
Monounsaturated fatty acids (%)16:1n-7 16.96±0.11 14.24±0.08 19.27±0.47 19.13±0.40 12.33±0.52 11.71±0.42 14.65±0.14 18.00±0.0918:1n-9 9.41±0.09 6.83±0.05 8.49±0.12 11.97±0.36 10.85±0.59 10.65±0.36 6.47±0.06 14.00±0.1518:1n-7 5.17±0.02 4.18±0.02 5.83±0.07 5.74±0.31 6.17±0.13 5.19±0.17 5.47±0.09 4.57±0.0320:1n-11 0.42±0.01 1.39±0.02 1.03±0.04 2.19±0.12 0.13±0.02 0.34±0.03 0.60±0.01 0.40±0.0220:1n-9 4.89±0.07 13.34±0.09 9.26±0.31 0.74±0.01 0.95±0.08 3.84±0.34 9.36±0.10 4.57±0.1820:1n-7 1.61±0.03 1.75±0.02 1.09±0.03 5.18±0.22 0.68±0.08 1.61±0.13 2.45±0.02 0.95±0.0122:1n-11 4.19±0.10 12.30±0.10 7.49±0.35 0.10±0.01 0.17±0.04 2.14±0.31 12.06±0.18 1.99±0.1022:1n-9 0.96±0.02 3.07±0.03 1.54±0.05 0.06±0.00 0.14±0.02 0.68±0.08 1.87±0.02 0.57±0.02sub total 43.61 57.11 54.01 45.10 31.42 36.15 52.94 45.05
Polyunsaturated fatty acids (%)18:2n-6 1.05±0.01 0.51±0.00 0.53±0.01 1.23±0.03 3.24±0.31 2.11±0.17 0.70±0.01 0.96±0.0118:4n-3 1.32±0.01 0.34±0.01 0.32±0.01 1.47±0.04 1.11±0.06 2.35±0.23 0.97±0.02 1.19±0.0220:4n-6 0.66±0.01 0.49±0.01 0.62±0.03 1.93±0.06 1.74±0.03 1.12±0.07 0.35±0.01 0.74±0.0120:5n-3 10.21±0.04 9.70±0.07 8.63±0.22 13.28±0.19 10.26±0.22 9.07±0.19 8.94±0.09 12.18±0.0722:5n-3 2.51±0.02 0.94±0.01 0.90±0.03 2.57±0.06 2.35±0.04 2.48±0.06 1.10±0.02 1.27±0.0222:6n-3 11.57±0.11 11.03±0.13 10.35±0.43 6.10±0.10 16.57±0.45 11.77±0.29 9.43±0.14 11.79±0.12sub total 27.34 23.01 21.34 26.60 35.26 28.89 21.48 28.13total 93.99 96.67 97.06 93.19 92.86 89.91 94.26 95.67
Only those fatty acids N1% are included in this table.
15L.L. Loseto et al. / Journal of Experimental Marine Biology and Ecology 374 (2009) 12–18
and T. libelulla, the method for small aquatic invertebrates was used(Parrish, 1999). A. malmgreni, mysids and several shrimp and Anonyxwere analyzed at Memorial University (C.C. Parrish). Fatty acid methylesters were derivatized using BF3-methanol and extracts were ana-lyzed on Varian 3400 GC on an Omegawax column with a flameionization detector (FID) following Budge and Parrish (1998).
Fatty acid peaks were integrated and expressed as a mass% of totalidentified fatty acids. Fatty acid identifications were checked on allchromatograms and reintegrated if necessary. Each fatty acid wasdescribed using the shorthand nomenclature of A:Bn-X, where Arepresents the number of carbon atoms, B the number of doublebonds, and X the position of the double bond closest to the terminalmethyl group.
2.3. Data analysis
Although 65 fatty acids were identified, only the fatty acids knownto transfer from prey to predator (Iverson et al., 2004) were used inour analyses. The percent fatty acid values were transformed using thecentered log ratio transformation (division by the geometric mean ofthe sample followed by log transformation) prior to the multivariatestatistical tests (Aitchison, 1986; Kenkel, 2006). Multivariate analyseswere carried out using SYN-TAX© Ordination 2000 (Budapest,Hungary) while Systat 11® (Systat Software Inc., 2004, San Jose, CA)was used for univariate statistics.
Prey fatty acid profiles were explored using a principle componentanalysis (PCA) of the covariance matrix. This qualitative analysisshows similarities and differences among prey items that will provideinformation about their habitat use and feeding ecology. Individualfatty acids that appeared to drive the separation of prey wereidentified based on PCA scores. To examine the dominance ofindividual fatty acids among prey an analysis of variance (ANOVA)followed by Tukey pairwise comparison was used.
Blubber fatty acid profiles reflect dietary deposits; however,modification of fatty acids occurs during uptake and metabolism.Fatty acid metabolism has been measured and modelled in pinnipedsto be able to quantify the proportion of prey species in the predatordiet with the Quantitative Fatty Acid Signature Analysis (QFASA)model (Iverson et al., 2004). Metabolism has not been quantified in
any cetaceans, thus the metabolic modification from prey to predatoreliminates the ability to quantify beluga diet composition in thisstudy; however, multivariate ordination techniques such as PCA havebeen successful for qualitative diet analyses (Bradshaw et al., 2003;Budge et al., 2002; Dahl et al., 2000; Iverson et al., 1997).
Here, we use a PCA (covariance matrix) to examine how potentialprey and beluga plot together based on the similarity of their fatty acidprofiles. We interpret PCA results qualitatively by examining thepositioning of prey in relation to beluga. That is, those prey itemssituated near beluga on the PCA score plot have similar fatty acidprofiles to beluga and likely represent an important diet item. Belugasize trends were evaluated by correlating PC 1 scores with length.Those fatty acids driving beluga length differences are identified usinga Pearson correlation matrix.
3. Results
3.1. Beaufort Sea food web and prey differentiation
The first two axes of the food web PCA explained 62% of thevariance (Fig. 2). The first PCA axis on the score plot (prey plot)separated fish by placing pelagic fish on the negative side of the PCA,opposite to bottom-feeding fish on the positive side (Fig. 2A; PC1 39%variance explained). Fish collected in brackish waters such as Arcticcisco and rainbow smelt were centrally placed whereas saffron codand least cisco were closer to the bottom-feeding fish. The second PCAaxis separated fish from the epibenthic invertebrates, accounting for23% of the variance (Fig. 2A).
The PCA variable loading plot is a reflection of the score plot. Itshows the fatty acids driving the position of prey, whereby fatty acidson themost positive side of the first axis are highest in prey located onthe most positive side of the first axis and are lowest in prey on themost negative side. The variable plot showed bottom-feeding fish (e.g.lake white fish, flounders) shared high concentrations of omega-3fatty acids, 18:3n-3, 20:3n-3, 20:4n-3, 22:5n-3 as well as the omega-6fatty acids 18:2n-6, and 16:2n-6 (Fig. 2B, Table 2). The long chainmonounsaturates C20 and C22 were important fatty acids in the pelagicfish species Arctic cod (near shore and offshore) as well as Pacificherring on the negative side of the first PCA axis (Fig. 2B.). T. libellula

Fig. 3. Principle component analysis of the 40 dietary fatty acids in prey items andbelugas (PC 1: 52%; PC 2: 10%). A) PCA score plot of beluga (open unlabelled symbols)and prey (closed labelled symbols). B) Factor loadings of individual fatty acids drivingthe beluga and prey plot. The location of the fatty acids indicates the importance, thosein the centre have the lowest importance relative to those furthest from the origin.
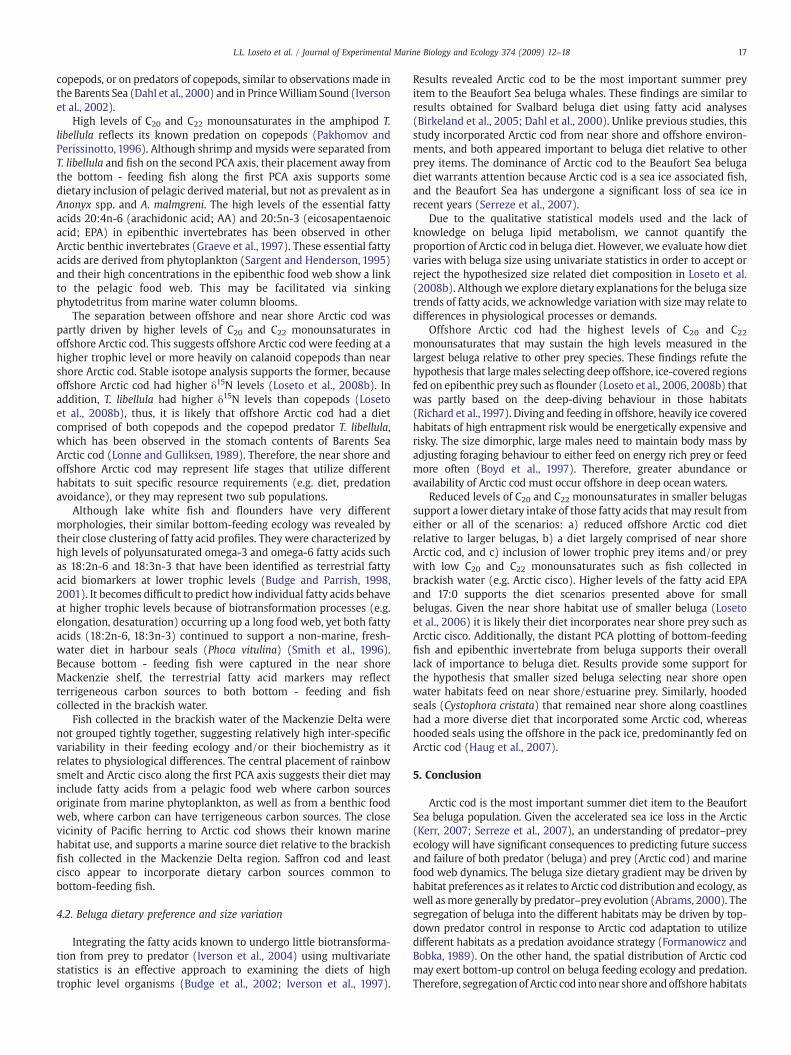
Fig. 4. Percent of the total fatty acid of 20:1n-9 (grey bars) and 20:5n-3 (black bars) inall prey items. These two fatty acids were found to have the most significant trends withbeluga length (r=0.6, −0.6, Pb0.0001, respectively). Offshore Arctic cod hadsignificantly higher levels of 20:1n9 relative to other prey and A. malmgreni had thelowest (Pb0.0001).
16 L.L. Loseto et al. / Journal of Experimental Marine Biology and Ecology 374 (2009) 12–18
did not group closelywith the epibenthic invertebrates likely owing tohigh proportions of the long chain monounsaturates C20 and C22 andlow fatty acids driving the separation of epibenthic invertebrates (eg.20:4n-6).
3.2. Beluga dietary preference and size relationships
Sixty-two percent of the variance in the prey and beluga fatty acidprofiles was explained by the first two PCA axes (PC 1: 52%, PC 2: 10%)(Fig. 3). The beluga plotted on the negative side of the first PCA axis andthe prey plotted on the positive side (Fig. 3A). The first PCA axis relatedto beluga length (r=0.5; pb0.001), like observations in the beluga PCAin Loseto et al. (2008a). The prey items conserved an inverteddistribution to the food web PCA (Figs. 2A and 3A). The variable plotof fatty acids was similar to the food web variable plot, where the longchain monosaturates C20 and C22 were on the negative end of the firstPCAaxis andomega-3 fattyacids suchas20:3n-3, 20:4n-3,18:3n, 3wereon the positive end (Fig. 3B).
Themost important feature of this PCA is the placement of both thenear shore and offshore Arctic cod into the cluster of beluga whalesdemonstrating strong similarities among their fatty acid profiles(Fig. 3A). All other prey items remain outside the vicinity of thebelugas. Prey items furthest from beluga were bottom-feeding fishsuch as lake white fish, least cisco and flounders, intermediately
placed were fish collected from the near shore and brackish waterssuch as Pacific herring, rainbow smelt, Arctic cisco, in addition to theamphipod T. libellula, and the epibenthic invertebrate shrimp andmysids.
The fatty acids that related most positively with beluga length were20:1(n-9) and 22:1n-11 (r=0.6; 0.5, Pb0.0001) and most negativelywere 20:5n-3 and 17:0 (r=−0.6; 0.5, Pb0.0001). Thus, larger whaleshad higher levels of fatty acids 20:1n-9 and 22:1n-11 and lower levels of20:5n-3 and17:0 relative to smallerwhales. Arctic cod andPacific herringhad the highest levels of 20:1n-9 and 22:1n-11 and lowest levels of20:5n-3 and 17:0 (Fig. 4; Table 2). The fatty acid 17:0 was at very lowlevels, less than 1% in all prey items. Offshore Arctic cod had significantlyhigher 20:1n-9 than near shore Arctic cod and Pacific herring(pb0.0001), but did not have significantly higher levels of 22:1n-11.Prey items with lowest levels of those monounsaturates were bottom-feeding fish; flounders and lakewhite fish (Fig. 4; Table 2). The fatty acid20:5n-3was lowest in near shore Arctic cod and Pacific herring, whereasoffshore Arctic cod had the lowest levels of 17:0, all three species did notsignificantly different from one another. The epibenthic invertebrate A.malmgreni had the highest levels of 20:5n-3, significantly higher than thehigh levels in shrimp and saffron cod (Fig. 4, Table 2).
4. Discussion
4.1. Beaufort Sea food web and prey differentiation
Results provide new information about the habitat use and feedingecology of poorly studied Arctic marine species collected from theeastern Beaufort Sea and Mackenzie Delta region. Prey items werepartitioned based on similarities and differences of their fatty acidprofiles. High levels of the long chain C20 and C22 monounsaturatesgrouping Arctic cod and Pacific herring away from other prey, suggestthey thrived on a copepod based foodweb. Those fatty acids, specifically20:1n-9 and 22:1n11, are well known indicators of calanoid copepoddiets (Kattner et al.,1989; Lee et al.,1971; Sargent andHenderson,1986)because copepods biosynthesize C20 and C22 monounsaturate fattyalcohols de novo that are subsequently incorporated into consumertissue as fatty acids (Kattner and Hagen, 1995; Sargent, 1976). The C20and C22 monounsaturates increase in relative concentration at eachtrophic level, and thus can be used as a biomarker of food webs basedupon pelagic herbivorous copepods (Dalsgaard et al., 2003). Alterna-tively, high levels may result from feeding heavily on copepods.Therefore, Arctic cod and Pacific herring either feed directly on calanoid
17L.L. Loseto et al. / Journal of Experimental Marine Biology and Ecology 374 (2009) 12–18
copepods, or on predators of copepods, similar to observations made inthe Barents Sea (Dahl et al., 2000) and in PrinceWilliam Sound (Iversonet al., 2002).
High levels of C20 and C22 monounsaturates in the amphipod T.libellula reflects its known predation on copepods (Pakhomov andPerissinotto, 1996). Although shrimp and mysids were separated fromT. libellula and fish on the second PCA axis, their placement away fromthe bottom - feeding fish along the first PCA axis supports somedietary inclusion of pelagic derivedmaterial, but not as prevalent as inAnonyx spp. and A. malmgreni. The high levels of the essential fattyacids 20:4n-6 (arachidonic acid; AA) and 20:5n-3 (eicosapentaenoicacid; EPA) in epibenthic invertebrates has been observed in otherArctic benthic invertebrates (Graeve et al., 1997). These essential fattyacids are derived from phytoplankton (Sargent and Henderson, 1995)and their high concentrations in the epibenthic food web show a linkto the pelagic food web. This may be facilitated via sinkingphytodetritus from marine water column blooms.
The separation between offshore and near shore Arctic cod waspartly driven by higher levels of C20 and C22 monounsaturates inoffshore Arctic cod. This suggests offshore Arctic cod were feeding at ahigher trophic level or more heavily on calanoid copepods than nearshore Arctic cod. Stable isotope analysis supports the former, becauseoffshore Arctic cod had higher δ15N levels (Loseto et al., 2008b). Inaddition, T. libellula had higher δ15N levels than copepods (Losetoet al., 2008b), thus, it is likely that offshore Arctic cod had a dietcomprised of both copepods and the copepod predator T. libellula,which has been observed in the stomach contents of Barents SeaArctic cod (Lonne and Gulliksen, 1989). Therefore, the near shore andoffshore Arctic cod may represent life stages that utilize differenthabitats to suit specific resource requirements (e.g. diet, predationavoidance), or they may represent two sub populations.
Although lake white fish and flounders have very differentmorphologies, their similar bottom-feeding ecology was revealed bytheir close clustering of fatty acid profiles. They were characterized byhigh levels of polyunsaturated omega-3 and omega-6 fatty acids suchas 18:2n-6 and 18:3n-3 that have been identified as terrestrial fattyacid biomarkers at lower trophic levels (Budge and Parrish, 1998,2001). It becomes difficult to predict how individual fatty acids behaveat higher trophic levels because of biotransformation processes (e.g.elongation, desaturation) occurring up a long food web, yet both fattyacids (18:2n-6, 18:3n-3) continued to support a non-marine, fresh-water diet in harbour seals (Phoca vitulina) (Smith et al., 1996).Because bottom - feeding fish were captured in the near shoreMackenzie shelf, the terrestrial fatty acid markers may reflectterrigeneous carbon sources to both bottom - feeding and fishcollected in the brackish water.
Fish collected in the brackish water of the Mackenzie Delta werenot grouped tightly together, suggesting relatively high inter-specificvariability in their feeding ecology and/or their biochemistry as itrelates to physiological differences. The central placement of rainbowsmelt and Arctic cisco along the first PCA axis suggests their diet mayinclude fatty acids from a pelagic food web where carbon sourcesoriginate from marine phytoplankton, as well as from a benthic foodweb, where carbon can have terrigeneous carbon sources. The closevicinity of Pacific herring to Arctic cod shows their known marinehabitat use, and supports a marine source diet relative to the brackishfish collected in the Mackenzie Delta region. Saffron cod and leastcisco appear to incorporate dietary carbon sources common tobottom-feeding fish.
4.2. Beluga dietary preference and size variation
Integrating the fatty acids known to undergo little biotransforma-tion from prey to predator (Iverson et al., 2004) using multivariatestatistics is an effective approach to examining the diets of hightrophic level organisms (Budge et al., 2002; Iverson et al., 1997).
Results revealed Arctic cod to be the most important summer preyitem to the Beaufort Sea beluga whales. These findings are similar toresults obtained for Svalbard beluga diet using fatty acid analyses(Birkeland et al., 2005; Dahl et al., 2000). Unlike previous studies, thisstudy incorporated Arctic cod from near shore and offshore environ-ments, and both appeared important to beluga diet relative to otherprey items. The dominance of Arctic cod to the Beaufort Sea belugadiet warrants attention because Arctic cod is a sea ice associated fish,and the Beaufort Sea has undergone a significant loss of sea ice inrecent years (Serreze et al., 2007).
Due to the qualitative statistical models used and the lack ofknowledge on beluga lipid metabolism, we cannot quantify theproportion of Arctic cod in beluga diet. However, we evaluate how dietvaries with beluga size using univariate statistics in order to accept orreject the hypothesized size related diet composition in Loseto et al.(2008b). Although we explore dietary explanations for the beluga sizetrends of fatty acids, we acknowledge variationwith size may relate todifferences in physiological processes or demands.
Offshore Arctic cod had the highest levels of C20 and C22
monounsaturates that may sustain the high levels measured in thelargest beluga relative to other prey species. These findings refute thehypothesis that largemales selecting deep offshore, ice-covered regionsfed on epibenthic prey such as flounder (Loseto et al., 2006, 2008b) thatwas partly based on the deep-diving behaviour in those habitats(Richard et al.,1997). Diving and feeding in offshore, heavily ice coveredhabitats of high entrapment risk would be energetically expensive andrisky. The size dimorphic, large males need to maintain body mass byadjusting foraging behaviour to either feed on energy rich prey or feedmore often (Boyd et al., 1997). Therefore, greater abundance oravailability of Arctic cod must occur offshore in deep ocean waters.
Reduced levels of C20 and C22 monounsaturates in smaller belugassupport a lower dietary intake of those fatty acids that may result fromeither or all of the scenarios: a) reduced offshore Arctic cod dietrelative to larger belugas, b) a diet largely comprised of near shoreArctic cod, and c) inclusion of lower trophic prey items and/or preywith low C20 and C22 monounsaturates such as fish collected inbrackish water (e.g. Arctic cisco). Higher levels of the fatty acid EPAand 17:0 supports the diet scenarios presented above for smallbelugas. Given the near shore habitat use of smaller beluga (Losetoet al., 2006) it is likely their diet incorporates near shore prey such asArctic cisco. Additionally, the distant PCA plotting of bottom-feedingfish and epibenthic invertebrate from beluga supports their overalllack of importance to beluga diet. Results provide some support forthe hypothesis that smaller sized beluga selecting near shore openwater habitats feed on near shore/estuarine prey. Similarly, hoodedseals (Cystophora cristata) that remained near shore along coastlineshad a more diverse diet that incorporated some Arctic cod, whereashooded seals using the offshore in the pack ice, predominantly fed onArctic cod (Haug et al., 2007).
5. Conclusion
Arctic cod is the most important summer diet item to the BeaufortSea beluga population. Given the accelerated sea ice loss in the Arctic(Kerr, 2007; Serreze et al., 2007), an understanding of predator–preyecology will have significant consequences to predicting future successand failure of both predator (beluga) and prey (Arctic cod) and marinefood web dynamics. The beluga size dietary gradient may be driven byhabitat preferences as it relates to Arctic cod distribution and ecology, aswell asmore generally by predator–prey evolution (Abrams, 2000). Thesegregation of beluga into the different habitats may be driven by top-down predator control in response to Arctic cod adaptation to utilizedifferent habitats as a predation avoidance strategy (Formanowicz andBobka, 1989). On the other hand, the spatial distribution of Arctic codmay exert bottom-up control on beluga feeding ecology and predation.Therefore, segregationof Arctic cod intonear shore andoffshore habitats
18 L.L. Loseto et al. / Journal of Experimental Marine Biology and Ecology 374 (2009) 12–18
may be crucial to the population processes of the Beaufort Sea beluga bysupporting the intra-specific energetic demands.
Acknowledgements
This project was supported by a Natural Science and EngineeringResearch Council–Industrial Post-Secondary Scholarship sponsored byDevon Corporation Canada to LL. Funding and project support wasprovided by CASES (Canadian Arctic Shelf Exchange Study), ArcticNet,Fisheries Joint Management Committee, Northern Students TrainingProgram, Northern Contaminants Program and by NSERC DiscoveryGrants to DD and SHF. We are grateful to N. Kenkel, M. Yunker forstatistical assistance.We thank S. Budge and A. Timmins for training andguidance on fatty acid techniques, J. DeLaronde, A. MacHutchon, D.Armstrong, A. Majewski, and J. Johnson for field and technical support.We are grateful for the support of science and technical crewof theCCGSAmundsen, and for partnerships and support of the Hunters andTrappers Committees of Inuvik, Aklavik and Tuktoyaktuk for the belugasample collection program. We thank J. Reist and the Tariq communitysampling program for fish samples. [SS]
References
Abrams, P.A., 2000. The evolution of predator–prey interactions: theory and evidence.Annu. Rev. Ecol. Syst. 31, 79–105.
Aitchison, J., 1986. The statistical analysis of compositional data, London, UK.Beck, C.A., Iverson, S.J., Bowen, W.D., 2007. Sex differences in grey seal diet reflect
seasonal variation in foraging behaviour and reproductive expenditure: evidencefrom quantitative fatty acid signature analysis. J. Anim. Ecol. 76, 490–502.
Birkeland, A., Kovacs, K.M., Lydersen, C., Grahl-Nielsen, O., 2005. Transfer of fatty acidsfrommothers to their calves during lactation inwhitewhales Delphinapterus leucas.Mar. Ecol. Prog. Ser. 298, 287–294.
Boyd, I.L., McCaffery, D.J., Walker, T.R., 1997. Variation in foraging effort by lactatingAntarctic fur seals: response to simulated foraging costs. Behav. Ecol. Sociobiol. 40,135–144.
Bradshaw, C.J.A., Hindell, M.A., Best, N.J., Phillips, K.L., Wilson, G., Nichols, P.D., 2003. Youare what you eat: describing the foraging ecology of southern elephant seals(Mirounga leonina) using blubber fatty acids. Proc. R. Soc. Lond. B 270, 1283–1292.
Brodie, P.F., 1989. The white whale, Delphinapterus leucas (Pallas, 1776). In: Ridgway, S.H.,Harrison, R.J. (Eds.), Handbook of marine mammals, vol. 4. Academic Press, London,pp. 119–144.
Budge, S.M., Parrish, C.C., 1998. Lipid biogeochemistry of plankton, settling matter andsediments in Trinity Bay, Newfoundland. II. Fatty acids. Org. Geochem. 29,1547–1559.
Budge, S.M., Parrish, C.C., 2001. Fatty acid composition of phytoplankton, settlingparticulate matter and sediments at a sheltered bivalve aquaculture site. Mar.Chem. 2001, 285–303.
Budge, S.M., Iverson, S.J., Bowen, W.D., Ackman, R.F., 2002. Among- and within-speciesvariability in fatty acid signatures of marine fish and invertebrates on the ScotianShelf, Georges Bank, and southern Gulf of St. Lawrence. Can. J. Fish. Aquat. Sci. 59,886–898.
Choe, N., Deibel, D., 2000. Seasonal vertical distribution and population dynamics of thechaetognath Parasagitta elegans in the water column and hyperbenthic zone ofConception Bay, Newfoundland. Mar. Biol. 137, 847–856.
Dahl, T.M., Lydersen, C., Kovacs, K.M., Falk-Petersen, S., Sargent, J., Gjertz, I., Gulliksen, B.,2000. Fatty acid composition of the blubber in white whales (Delphinapterusleucas). Pol. Biol. 23, 401–409.
Dalsgaard, J., St. John, M., Kattner, G., Muller-Navarra, D.C., Hagen, W., 2003. Fatty acidtrophic markers in the pelagic food marine environment. Adv. Mar. Biol. 46,227–340.
Folch, J., Lees, M., Stanley, S.G.H., 1957. A simple method for the isolation andpurification of total lipids from animal tissues. J. Biol. Chem 226, 497–509.
Formanowicz, J.D.R., Bobka, M.S., 1989. Predation risk and microhabitat preference: anexperimental study of the behavioural responses of prey and predator. Am. Midl.Nat. 121, 379–386.
Frost, K.J., Lowry, L.F., 1981. Trophic importance of some marine gadids in NorthernAlaska and their body-otolith size relationships. Fish Bull. 79, 187–192.
Graeve, M., Kattner, G., P iepenburg, 1997. Lipids in Arctic benthos: does the fatty acidand alcohol composition reflect feeding and trophic interactions. Pol. Biol. 18,53–61.
Haug, T., Nilssen, K.T., Lindblom, L., Lindstrom, U., 2007. Diets of hooded seals(Cystophora cristata) in coastal waters and drift ice waters along the east coast ofGreenland. Mar. Biol. Res. 3, 123–133.
Heide-Jorgensen, M.P., Teilmann, J., 1994. Growth, reproduction, age structure andfeeding habits of white whales (Delphinapterus leucas) in West Greenland waters.Meddr Gronland, Biosci. 39, 195–212.
Iverson, S.J., 1993. Milk secretion in marine mammals in relation to foraging: can milkfatty acids predict diet? Symp. Zool. Soc. Lond. 66, 509–516.
Iverson, S.J., Frost, K.J., Lowry, L.F., 1997. Fatty acid signatures reveal fine scale structureof foraging distribution of harbour seals and their prey in Prince William Sound,Alaska. Mar. Ecol. Prog. Ser. 151, 255–271.
Iverson, S.J., McDonald, J.E., Smith, L.H., 2001. Changes in diet of free-ranging black bearsin years of contrasting food availability revealed through milk fatty acids. Can. J.Zool. 79, 2268–2279.
Iverson, S.J., Frost, K.J., Lang, S.L.C., 2002. Fat content and fatty acid composition of foragefish and invertebrates in Prince William Sound, Alaska: factors contributing toamong and within species variability. Mar. Ecol. Prog. Ser. 241, 161–181.
Iverson, S.J., Field, C., Bowen, W.D., Blanchard, W., 2004. Quantitative fatty acidsignature analysis: a new method of estimating predator diets. Ecol. Monogr. 74,211–235.
Kattner, G., Hagen, W., 1995. Polar herbivorours copepods—different pathyways in lipidbiosynthesis. ICES J. Mar. Sci. 52, 329–335.
Kattner, G., Hirche, H.-J., Krause, M., 1989. Spatial variability in lipid composition ofcalanoid copepods from Fram Strait, the Arctic. Mar. Biol. 102, 473–480.
Kenkel, N.C., 2006. On selecting an appropriate multivariate analysis. Can. J. Plant Sci.86, 663–676.
Kerr, R.A., 2007. Is battered Arctic Sea ice down for the count? Science 317, 33–34.Koopman, H.N., 2007. Phylogenetic, ecological, and ontogenetic factors influencing the
biochemical structure of the blubber of odontocetes. Mar. Biol. 151, 277–291.Lee, R.F., Nevenzel, J.C., Paffenhoefer, G., 1971. Importance of wax esters and other lipids
in the marine food chain: phyotoplankton and copepods. Mar. Biol. 9, 99–108.Lockhart, L., Stern, G.A., Wagemann, R., Hunt, R.V., Metner, D.A., DeLaronde, J., Dunn, B.,
Stewart, R.E.A., Hyatt, C.K., Harwood, L.A., Mount, K., 2005. Concentrations ofmercury in tissues of beluga whales (Delphinapterus leucas) from severalcommunities in the Canadian Arctic from 1981–2002. Sci. Total Environ. 351–352,391–412.
Lonne, O.J., Gulliksen, B., 1989. Size, age and diet of polar cod, Boreogadus saida(Lepechin 1773) in ice covered waters. Pol. Biol. 9, 187–191.
Loseto, L.L., Richard, P., Stern, G.A., Orr, J., Ferguson, S.H., 2006. Segregation of BeaufortSea beluga whales during the open-water season. Can. J. Zool. 84, 1743–1751.
Loseto, L.L., Stern, G.A., Ferguson, S.H., 2008a. Size and biomagnification: how habitatselection explains beluga mercury levels. Environmental Science and Technology42, 3982–3988.
Loseto, L.L., Stern, G.A., Deibel, D., Connelly, T.L., Prokopowicz, A., Lean, D.R.S., Fortier, L.,Ferguson, S.H., 2008b. Linking mercury exposure to habitat and feeding behaviourin Beaufort Sea beluga whales. J. Mar. Syst. 74, 1012–1024.
Pakhomov, E.A., Perissinotto, R., 1996. Trophodynamics of the hyperiid amphipodThemisto gaudichaudii in the South Georgia region during late summer. Mar. Ecol.Prog. Ser. 134, 91–100.
Parrish, C.C., 1999. Determination of total lipid, lipid classes, and fatty acids in aquaticsamples. In: Arts, M.T., Wainman, B.C. (Eds.), Lipids in freshwater ecosystems.Springer-Verlag, New York, pp. 4–20.
Richard, P., Martin, A.R., Orr, J., 1997. Study of summer and fall movements and divebehaviour of Beaufort Sea belugas, using satellite telemetry: 1992–1995, Environ-mental Studies Research Funds No. 134, Calgary, pp. 26.
Richoux, N.B., Deibel, D., Thompson, R.J., Parrish, C.C., 2005. Seasonal and develop-mental variation in the fatty acid composition of Mysis mixta (Mysidacea) andAcanthostephia malmgreni (Amphipoda) from the hyperbenthos of a cold-oceanenvironment (Conception Bay, Newfoundland). J. Plankton Res. 27, 719–733.
Robeck, T.R., Monfort, S.L., Calle, P.P., Dunn, J.L., Jensen, E., Boehm, J.R., Young, S., Clark, S.T.,2005. Reproduction, growth and development in captive beluga (Delphinapterusleucas). Zoo Biol. 24, 29–49.
Sargent, J.R., 1976. The structure, metabolism and function of lipids in marineorganisms. In: DC, M., Sargent, J.R. (Eds.), Biochemical and biophysical perspectivesin marine biology. Academic Press, London, pp. 149–533.
Sargent, J.R., Henderson, R.J., 1986. Lipids. In: Corner, E.D.S., O'Hara , S. (Eds.), Biologicalchemistry of marine copepods. University Press, Oxford.
Sargent, J.R., Henderson, R.J., 1995. Marine (n-3) polyunsaturated fatty acids. In:Hamilton, R.J. (Ed.), Developments in oils and fats. Blackie Academic andProfessional, London, pp. 32–65.
Seaman, G.A., L.F., L., Frost, K.J., 1982. Foods of belukhawhales (Delphinapterus leucas) inwestern Alaska. Cetology 44, 1–19.
Serreze, M.C., Holland, M.M., Stroeve, J., 2007. Perspectives on the Arctic's shrinking sea-ice cover. Science 315, 1533–1536.
Smith, R.J., Hobson, K.A., Koopman, H.N., Lavigne, D.M., 1996. Distinguishing betweenpopulations of fresh-and salt-water harbour seals (Phoca vitulina) using stable-isotope ratios and fatty acid profiles. Can. J. Fish. Aquat. Sci. 53, 272–279.
Stevens, C.J., Deibel, D., Parrish, C.C., 2004a. Species-specific differences in lipidcomposition and omnivory indices in Arctic copepods collected in deep waterduring autumn (North Water Polynya). Mar. Biol. 144, 905–915.
Stevens, C.J., Deibel, D., Parrish, C.C., 2004b. Copepod ominivory in the North WaterPolynya (Baffin Bay) during autumn: spatial patterns in lipid composition. Deep-Sea Res. Pt I 51, 1637–1658.
Stevick, P.T., McConnell, B.J., Hammond, P.S., 2002. Patterns of movement. In: Hoelzel, A.R.(Ed.), Marine mammal biology: an evolutionary approach. Blackwell Science, Oxford,pp. 185–216.
Welch, H.E., Crawford, R.E., Hop, H., 1993. Occurrence of Arctic cod (boreogadus saida)schools and their vulnerability to predation in the Canadian High Arctic. Arctic 46,331–339.