summer 2010 remedial investigation report boeing auburn
TRANSCRIPT

950 Pacific Avenue, Suite 515 Tacoma, WA 98402
(253) 926-2493
November 19, 2010
Prepared for
The Boeing Company
Summer 2010 Remedial Investigation ReportBoeing Auburn Fabrication Division Facility
Auburn, Washington
11/19/10 Y:\025\164\R\RI REPORT\NOV 19TH DATA RESULTS REPORT\SUMMER 2010 RI_RPT.DOCX LANDAU ASSOCIATES ii
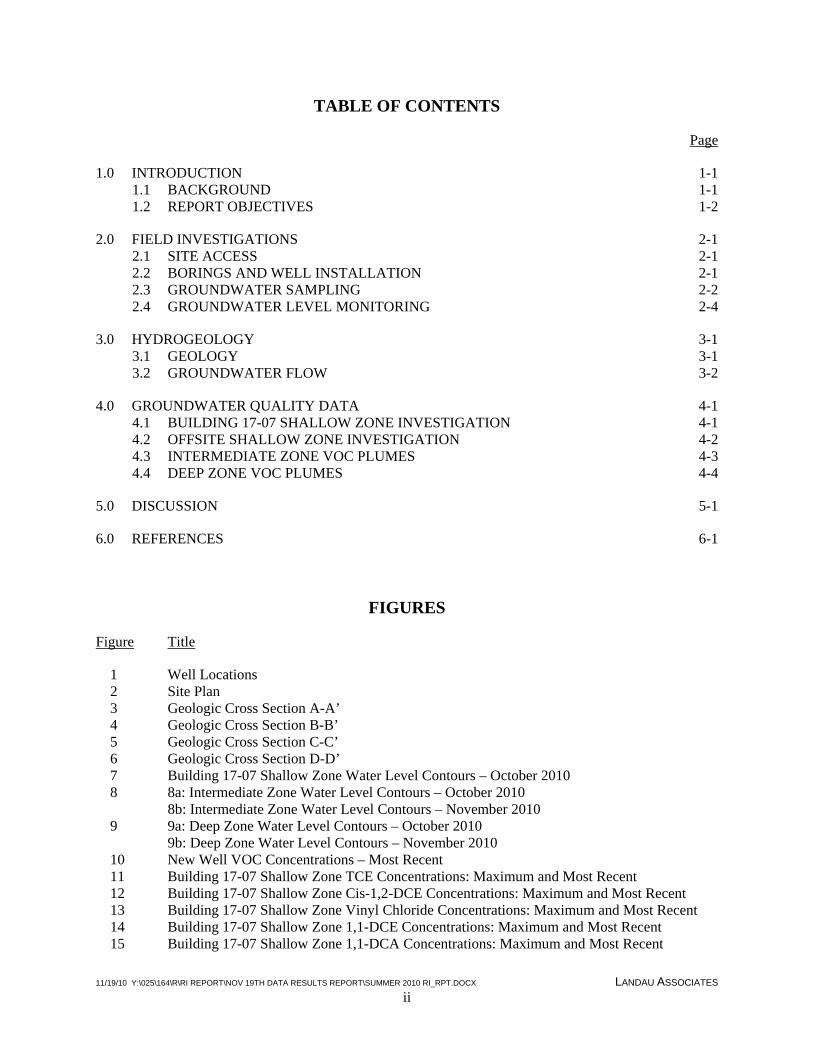
TABLE OF CONTENTS
Page
1.0 INTRODUCTION 1-1 1.1 BACKGROUND 1-1 1.2 REPORT OBJECTIVES 1-2
2.0 FIELD INVESTIGATIONS 2-1 2.1 SITE ACCESS 2-1 2.2 BORINGS AND WELL INSTALLATION 2-1 2.3 GROUNDWATER SAMPLING 2-2 2.4 GROUNDWATER LEVEL MONITORING 2-4
3.0 HYDROGEOLOGY 3-1 3.1 GEOLOGY 3-1 3.2 GROUNDWATER FLOW 3-2
4.0 GROUNDWATER QUALITY DATA 4-1 4.1 BUILDING 17-07 SHALLOW ZONE INVESTIGATION 4-1 4.2 OFFSITE SHALLOW ZONE INVESTIGATION 4-2 4.3 INTERMEDIATE ZONE VOC PLUMES 4-3 4.4 DEEP ZONE VOC PLUMES 4-4
5.0 DISCUSSION 5-1
6.0 REFERENCES 6-1
FIGURES
Figure Title
1 Well Locations 2 Site Plan 3 Geologic Cross Section A-A’ 4 Geologic Cross Section B-B’ 5 Geologic Cross Section C-C’ 6 Geologic Cross Section D-D’ 7 Building 17-07 Shallow Zone Water Level Contours – October 2010 8 8a: Intermediate Zone Water Level Contours – October 2010
8b: Intermediate Zone Water Level Contours – November 2010 9 9a: Deep Zone Water Level Contours – October 2010
9b: Deep Zone Water Level Contours – November 2010 10 New Well VOC Concentrations – Most Recent 11 Building 17-07 Shallow Zone TCE Concentrations: Maximum and Most Recent 12 Building 17-07 Shallow Zone Cis-1,2-DCE Concentrations: Maximum and Most Recent 13 Building 17-07 Shallow Zone Vinyl Chloride Concentrations: Maximum and Most Recent 14 Building 17-07 Shallow Zone 1,1-DCE Concentrations: Maximum and Most Recent 15 Building 17-07 Shallow Zone 1,1-DCA Concentrations: Maximum and Most Recent

11/19/10 Y:\025\164\R\RI REPORT\NOV 19TH DATA RESULTS REPORT\SUMMER 2010 RI_RPT.DOCX LANDAU ASSOCIATES iii
16 Intermediate Zone TCE Concentrations: Maximum and Most Recent 17 Intermediate Zone Cis-1,2-DCE Concentrations: Maximum and Most Recent 18 Intermediate Zone Vinyl Chloride Concentrations: Maximum and Most Recent 19 Deep Zone TCE Concentrations: Maximum and Most Recent 20 Deep Zone Cis-1,2-DCE Concentrations: Maximum and Most Recent 21 Deep Zone Vinyl Chloride Concentrations: Maximum and Most Recent
TABLES
Table Title
1 Drilling and Well Installation Matrix – Summer/Fall 2010 RI 2 Groundwater Analytical Results – Summer 2010 RI 3 Groundwater Analytical Results – Shallow Wells - 17-07 Building Area 4 Sample Matrix – Third Quarter 2010 5 Groundwater Sampling Event Results – Third Quarter 2010 6 Groundwater Sampling Event Results Detected Analytes Only – Third Quarter 2010
APPENDICES
Appendix Title
A Boring Logs B Laboratory Analytical Results (On CD)

11/19/10 Y:\025\164\R\RI REPORT\NOV 19TH DATA RESULTS REPORT\SUMMER 2010 RI_RPT.DOCX LANDAU ASSOCIATES 1-1
1.0 INTRODUCTION
The Boeing Company (Boeing) is currently undergoing corrective action at their Auburn
Fabrication Division facility (facility). Corrective action requirements are documented in an Agreed
Order (Order) (No. DE 01HWTRNR-3345) dated August 14, 2002 and the First Amended Agreed Order
dated February 21, 2006 both with Washington State Department of Ecology (Ecology). The Order
includes a requirement to conduct a remedial investigation (RI) at the facility. The facility is located at
700 15th Street Southwest in Auburn, Washington.
Since the summer 2009, Boeing has been implementing phased remedial investigation (RI)
activities to characterize the source, nature, and extent of offsite volatile organic compound (VOC)
plumes. The plumes consist of trichloroethene (TCE) and other VOCs in the groundwater. One plume
occurs predominantly north of Area 1 (the Area 1 plume); a second plume occurs predominantly north
and northwest of Building 17-07 and the Wastewater Pretreatment Plant (WWPTP) (the western plume).
As part of this phased characterization program, Boeing recently completed an additional supplemental RI
termed the summer 2010 RI.1 The summer 2010 RI provided additional data to define the source, nature,
and extent of the western plume and the nature and extent of the Area 1 plume. The approximate
locations of the plumes are shown on Figure 1.
1.1 BACKGROUND
Boeing completed the 2nd Revised Ecology Review Draft Remedial Investigation Report (2nd
Revised RI Report) on April 10, 2009. This report was a comprehensive document that addressed all
solid waste management units (SWMUs) and areas of concern (AOCs) at the facility. Ecology’s June 19,
2009 comments on the 2nd Revised RI identified an offsite groundwater quality data gap. The comments
included a request to complete offsite groundwater investigations north and northwest of the WWPTP and
Area 1 along Perimeter Road. This investigation was termed the fall 2009 RI and included installation of
seven intermediate and two deep wells (AGW143 through AGW152).2 TCE and vinyl chloride were
detected above screening levels (TCE, 0.49 µg/L; 0.029 µg/L, vinyl chloride) in both the intermediate and
deep groundwater zones in these new wells. At well AGW145(I), located along Perimeter Road
approximately 500 ft north of the WWPTP, TCE was detected at 15 µg/L. This result was the third
highest TCE concentration ever detected in the intermediate zone.3 The fall 2009 RI investigation was
1 RI activities extended from the end of May 2010 to early November 2010. 2 Well AGW153 was installed under the fall 2009 RI, but was south of the VOC plume areas. 3 Based on the RI database for groundwater that consists of data from 1995 to present. The highest TCE concentration was 21 µg/L from well AGW126(I). The second highest was 17 µg/L at injection well IW-5(I).

11/19/10 Y:\025\164\R\RI REPORT\NOV 19TH DATA RESULTS REPORT\SUMMER 2010 RI_RPT.DOCX LANDAU ASSOCIATES 1-2
documented in the Technical Memorandum: First Addendum to the 2nd Revised Ecology Review Draft
Remedial Investigation Report (Landau Associates 2009).
Based on the results of the fall 2009 RI, a second investigation phase was implemented. This
second phase was termed the winter 2010 RI and included three intermediate wells around the perimeter
of Building 17-07 (AGW154, AGW155 and AGW156) to characterize the source of the western plume.
The investigation also included two intermediate wells (AGW157 and AGW158) and one deep well
(AGW159) to characterize the offsite western plume; and three intermediate wells (AGW160, AGW161
and AGW162) to characterize the offsite Area 1 plume. Data from the winter 2010 RI indicated that TCE
concentrations exceeded screening levels in the intermediate and deep zones of the western plume in the
furthest downgradient wells. Similarly, the furthest downgradient well (AGW161) associated with the
Area 1 plume detected TCE at 3.1 µg/L. The results of the winter 2010 RI were summarized in the 1st
Quarterly Status Report (Landau Associates 2010a). The results were also presented at a meeting with
Ecology on May 26, 2010 at Ecology’s Northwest Regional Office.
Based on the results of the winter 2010 RI, a third investigation phase was implemented. This
third phase is the summer 2010 RI.
1.2 REPORT OBJECTIVES
The objectives of this report are to present the results of the summer 2010 RI and update the
current conceptual model related to the two offsite VOC plumes. A secondary objective is to present the
results of the 3rd quarter 2010 Phase IV groundwater sampling event. The collection of all groundwater
data associated with these two objectives was initiated in September 2010 and extended through
November 8, 2010 to accommodate drilling new wells. Consistent with the report objectives, data and
analysis presentations in this report are focused on the northern portion of the facility in three areas:
The shallow groundwater zone in the vicinity of Building 17-07
The shallow, intermediate, and deep groundwater zones associated with the western plume
The intermediate groundwater zone associated with the Area 1 plume.
11/19/10 Y:\025\164\R\RI REPORT\NOV 19TH DATA RESULTS REPORT\SUMMER 2010 RI_RPT.DOCX LANDAU ASSOCIATES 2-1
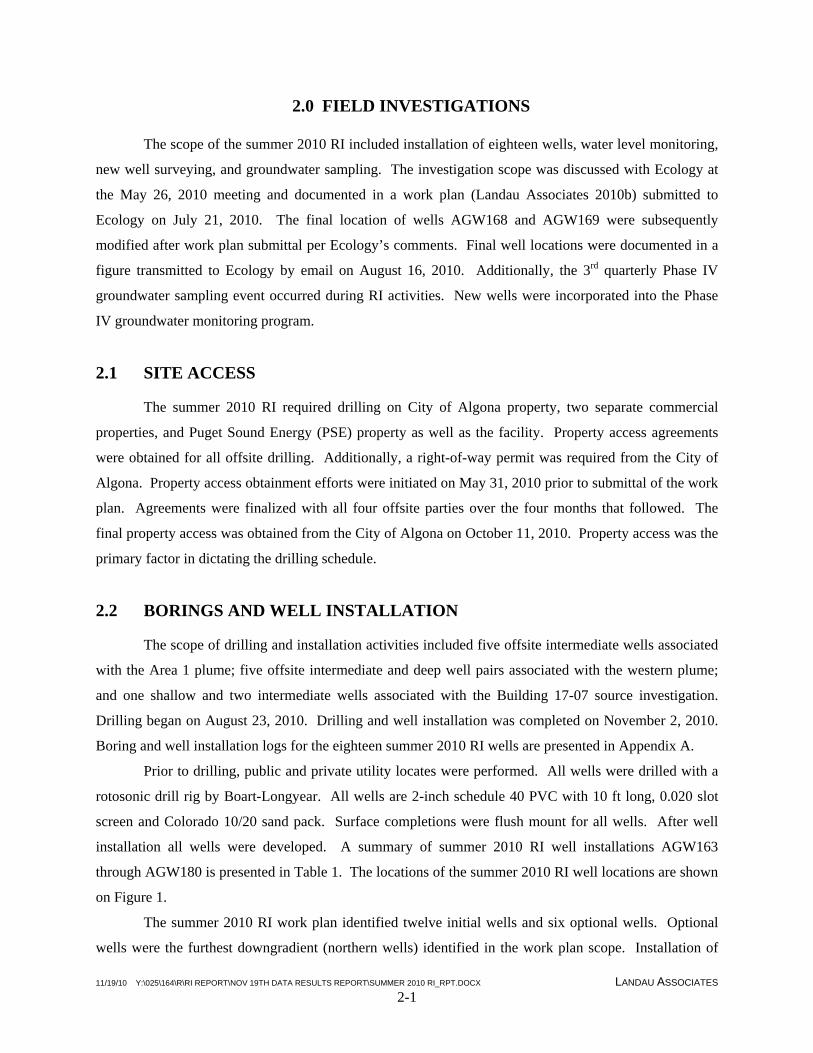
2.0 FIELD INVESTIGATIONS
The scope of the summer 2010 RI included installation of eighteen wells, water level monitoring,
new well surveying, and groundwater sampling. The investigation scope was discussed with Ecology at
the May 26, 2010 meeting and documented in a work plan (Landau Associates 2010b) submitted to
Ecology on July 21, 2010. The final location of wells AGW168 and AGW169 were subsequently
modified after work plan submittal per Ecology’s comments. Final well locations were documented in a
figure transmitted to Ecology by email on August 16, 2010. Additionally, the 3rd quarterly Phase IV
groundwater sampling event occurred during RI activities. New wells were incorporated into the Phase
IV groundwater monitoring program.
2.1 SITE ACCESS
The summer 2010 RI required drilling on City of Algona property, two separate commercial
properties, and Puget Sound Energy (PSE) property as well as the facility. Property access agreements
were obtained for all offsite drilling. Additionally, a right-of-way permit was required from the City of
Algona. Property access obtainment efforts were initiated on May 31, 2010 prior to submittal of the work
plan. Agreements were finalized with all four offsite parties over the four months that followed. The
final property access was obtained from the City of Algona on October 11, 2010. Property access was the
primary factor in dictating the drilling schedule.
2.2 BORINGS AND WELL INSTALLATION
The scope of drilling and installation activities included five offsite intermediate wells associated
with the Area 1 plume; five offsite intermediate and deep well pairs associated with the western plume;
and one shallow and two intermediate wells associated with the Building 17-07 source investigation.
Drilling began on August 23, 2010. Drilling and well installation was completed on November 2, 2010.
Boring and well installation logs for the eighteen summer 2010 RI wells are presented in Appendix A.
Prior to drilling, public and private utility locates were performed. All wells were drilled with a
rotosonic drill rig by Boart-Longyear. All wells are 2-inch schedule 40 PVC with 10 ft long, 0.020 slot
screen and Colorado 10/20 sand pack. Surface completions were flush mount for all wells. After well
installation all wells were developed. A summary of summer 2010 RI well installations AGW163
through AGW180 is presented in Table 1. The locations of the summer 2010 RI well locations are shown
on Figure 1.
The summer 2010 RI work plan identified twelve initial wells and six optional wells. Optional
wells were the furthest downgradient (northern wells) identified in the work plan scope. Installation of

11/19/10 Y:\025\164\R\RI REPORT\NOV 19TH DATA RESULTS REPORT\SUMMER 2010 RI_RPT.DOCX LANDAU ASSOCIATES 2-2
these wells was meant to be contingent on collecting initial groundwater samples from upgradient wells
directly after well installation but before development. The samples were submitted for VOC analysis on
a 24-hour turnaround; the results were compared to screening levels. If there was a screening level
exceedance in the initial well sample, the corresponding optional well was installed. Optional well OPT-
I3 was installed and renamed AGW176(I) based on initial sample results from well AGW173(I).4
Optional well OPT-I4 was installed and renamed AGW175(I) based on initial sample results from well
AGW174(I). The other four optional wells (OPT-I1, OPT-I2, OPT-D1 and OPT-D2) on the Fana
property directly south of 15th Avenue SW were installed without following this work plan protocol. This
was because sample results from AGW172(I) through AGW176(I) north of Area 1 indicated that it was
more likely that the western plume had migrated as far as these other optional wells. Another factor was
property access and schedule. Property access was gained on the Fana property prior to City of Algona
property access. Therefore, modification of the drilling program was required to expedite the overall
drilling program schedule.
In addition to well installation, well AGW140 was modified by raising the surface completion
approximately 3 inches. This well was located in a depression on the east side of Perimeter Road where
water would collect after rain events. Raising the surface completion helps keep the flush mount
monument above the surface of water that ponds in this depression. The PVC well was not modified;
therefore the well elevation was not resurveyed.
2.3 GROUNDWATER SAMPLING
Groundwater sampling during the summer 2010 RI can be segregated into five groups or events:
Borehole samples were collected from select new wells during drilling
Initial samples were collected from select new wells prior to well development
Samples were collected from six existing shallow wells adjacent to or in Building 17-07
Samples were collected from twelve summer 2010 RI wells installed during the 3rd quarter
2010 and existing wells as part of the Phase IV groundwater monitoring program 3rd quarter
sampling event
Samples were collected from the final six summer 2010 RI wells following their
development during the 4th quarter 2010 (i.e., after September 30, 2010).
All wells installed as part of the summer 2010 RI were automatically incorporated into the Phase
IV monitoring program.
4 Note that the initial sample result from AGW173(I) was 0.7 µg/L for TCE. Slightly above the screening level of 0.49 µg/L. Therefore the decision was made to install AGW176(I). After AGW173(I) was developed, sample results were non-detect for TCE.
11/19/10 Y:\025\164\R\RI REPORT\NOV 19TH DATA RESULTS REPORT\SUMMER 2010 RI_RPT.DOCX LANDAU ASSOCIATES 2-3
Shallow zone borehole samples were collected at all five western plume well pair locations
(AGW166-30, AGW168-29, AGW170-28.5, AG177-29, AGW179-30)5 and at the two Building 17-07
intermediate well locations (AGW163-28 and AGW164-29). Also, the shallow well at Building 17-07
was drilled into the intermediate zone to collect a borehole sample (AGW165-55). Sample results for
borehole samples are presented in Table 2.
At two well locations, samples were collected from the well prior to development as part of the
decision analysis for installation of optional wells (see Section 2-2 and the work plan). Samples
AGW173-50 and AGW174-59 collected on September 1 and August 23, 2010 respectively are initial well
samples collected in the final well screen prior to development. These samples are essentially collected
using the same protocols as borehole samples and are therefore given the same sample number
designation. These initial well sample data are presented in Table 2. Table 2 is a comprehensive table of
all collected groundwater data associated with the eighteen summer 2010 RI wells (AGW163 through
AGW180).
During an evaluation of potential TCE sources (Landau Associates 2010c) six shallow wells
(AGW028 and AGW046 through AGW050) were identified near the southern wall of Building 17-07
where TCE had been detected at elevated concentrations (e.g., 3.3 µg/L). Since the last sampling date
was in 1997, these wells were resampled as part of the evaluation of Building 17-07. The resample data
for these wells is presented in Table 3.
Each of the eighteen summer 2010 RI wells were sampled after well development. Of the
eighteen wells, only twelve wells were installed and sampled during the third quarter (AGW163 through
AGW165 and AGW172 through AGW180).6 The first sample collected from each of the twelve wells
was considered part of the 3rd quarter Phase IV groundwater monitoring program.7 Twelve other existing
wells were also sampled as part of this regularly scheduled quarterly sampling program. A sampling
matrix for all 3rd quarter Phase IV wells is presented in Table 4. All data for the 3rd quarter are presented
in Table 5. Detections only for the 3rd quarter are presented in Table 6.
Groundwater sample results go through an initial review after they are received from the lab.
Results from samples AGW173(I) and AGW176(I) initially appeared anomalous. Based on our working
conceptual model of groundwater flow, we anticipated that AGW173(I) would have a higher
concentration than AGW176(I) and this was not the case. Therefore, these wells were resampled on
5 The sample designation for borehole samples are the well name followed by the sample depth. For example, AGW177-29 is a borehole sample collected at 29 ft while drilling well AGW177. 6 The other six wells (AGW166 through AGW171) were not installed until November 2010 due to property access constraints on City of Algona right-of-way. Since these wells were first sampled in the 4th quarter 2010, they were not considered as part of the 3rd quarter sampling event. 7 Due to site access delays, wells AGW166 through AGW171 were installed and first sampled by November 8, 2010. The first official Phase IV monitoring program sampling event that these wells will be included in will be the 4th quarter 2010 (semi-annual) sampling event.

11/19/10 Y:\025\164\R\RI REPORT\NOV 19TH DATA RESULTS REPORT\SUMMER 2010 RI_RPT.DOCX LANDAU ASSOCIATES 2-4
October 6, 2010. The resampling confirmed the initial results. These data results are discussed in Section
4. The resample data is presented in Table 2.
2.4 GROUNDWATER LEVEL MONITORING
Groundwater level monitoring was completed on two occasions. On September 29 and October
1, 2010 all shallow wells in the vicinity of Building 17-07 were measured for groundwater levels as part
of the Building 17-07 evaluation. Measurements were collected at all existing wells in and adjacent to the
building as well as new well AGW165. During this event, all intermediate and deep wells in the northern
portion of the facility were also measured to assist with the evaluation of the Area 1 and western plumes.
The six intermediate and deep wells on City of Algona property were not installed during the
September/October groundwater level measurement event. Therefore intermediate and deep wells were
measured a second time on November 8 and 9, 2010 to incorporate the six City of Algona wells.
Groundwater level data is presented in Section 3.

11/19/10 Y:\025\164\R\RI REPORT\NOV 19TH DATA RESULTS REPORT\SUMMER 2010 RI_RPT.DOCX LANDAU ASSOCIATES 3-1
3.0 HYDROGEOLOGY
All summer 2010 RI borings were drilled using a rotosonic method. Prior to this investigation
phase, deep wells were drilled with air rotary, percussion (cable tool) or rotosonic method while shallow
and intermediate wells were drilled with hollow-stem auger. Rotosonic drilling returns a continuous core
of soil. This core in turn allows for a more detailed description of site geology. Geologic data was
summarized into a series of four south-to-north cross sections as part of an analysis to refine the site
hydrogeologic conceptual model. The cross sections also show the relative screen interval of existing
wells. This information is useful in evaluating spatial trends in water quality. Cross section locations are
shown on Figure 2. Cross sections are presented on Figures 3 through 6.
3.1 GEOLOGY
Spatial analysis of geologic data in the northern portion of the facility indicates a high degree of
variation in soil texture from the ground surface to the silt aquitard at about 80 to 100 ft depth below
ground surface (BGS). Most of the soil consists of poorly graded sand (USCS classification SP) and well
to poorly graded gravel (USCS classification GW to GP). In places the aquifer grades to a silty sand
(USCS classification SM), and occasional silt layers (USCS classification ML) are present. The high
degree of variation in soil texture is consistent with a relatively high energy alluvial environment of
deposition. The degree of variation is demonstrated on cross sections on Figures 3 through 6.
Review of soil samples from the eighteen summer 2010 RI borings did indicate that soil texture
appears to coarsen with depth. In general, the gravel content appeared to increase from the shallow to the
deep zone. This is potentially significant because it may indicate that the deep groundwater zone has a
higher hydraulic conductivity than the overlying groundwater zones. The relative increase in gravel
content is not necessarily evident based on the USCS soil classification symbol8 shown on the cross
sections but was evident in visual examination of the soil.
In certain areas the underlying aquitard was encountered at shallower depths than expected. This
occurred along Perimeter Road in the vicinity of the WWPTP at wells AGW034(D), AGW143(D) and
AGW146(D) (see Figure 3) and directly north of this area at wells AGW159(D), AGW171(D) and
AGW180(D) (see Figure 4). At these locations, the silt aquitard was encountered at about Elevation 0 to
Elevation -10 ft, MSL; consequently, the overall saturated thickness of the deep aquifer zone is less,
8 Well graded sand (USCS symbol SW) can have gravel content between 0 and 49 percent. Similarly, well graded gravel (GW) can have gravel content between 51 and 100 percent.
11/19/10 Y:\025\164\R\RI REPORT\NOV 19TH DATA RESULTS REPORT\SUMMER 2010 RI_RPT.DOCX LANDAU ASSOCIATES 3-2
possibly resulting in an area or ridge of lower overall aquifer transmissivity9 extending north from the
WWPTP.
3.2 GROUNDWATER FLOW
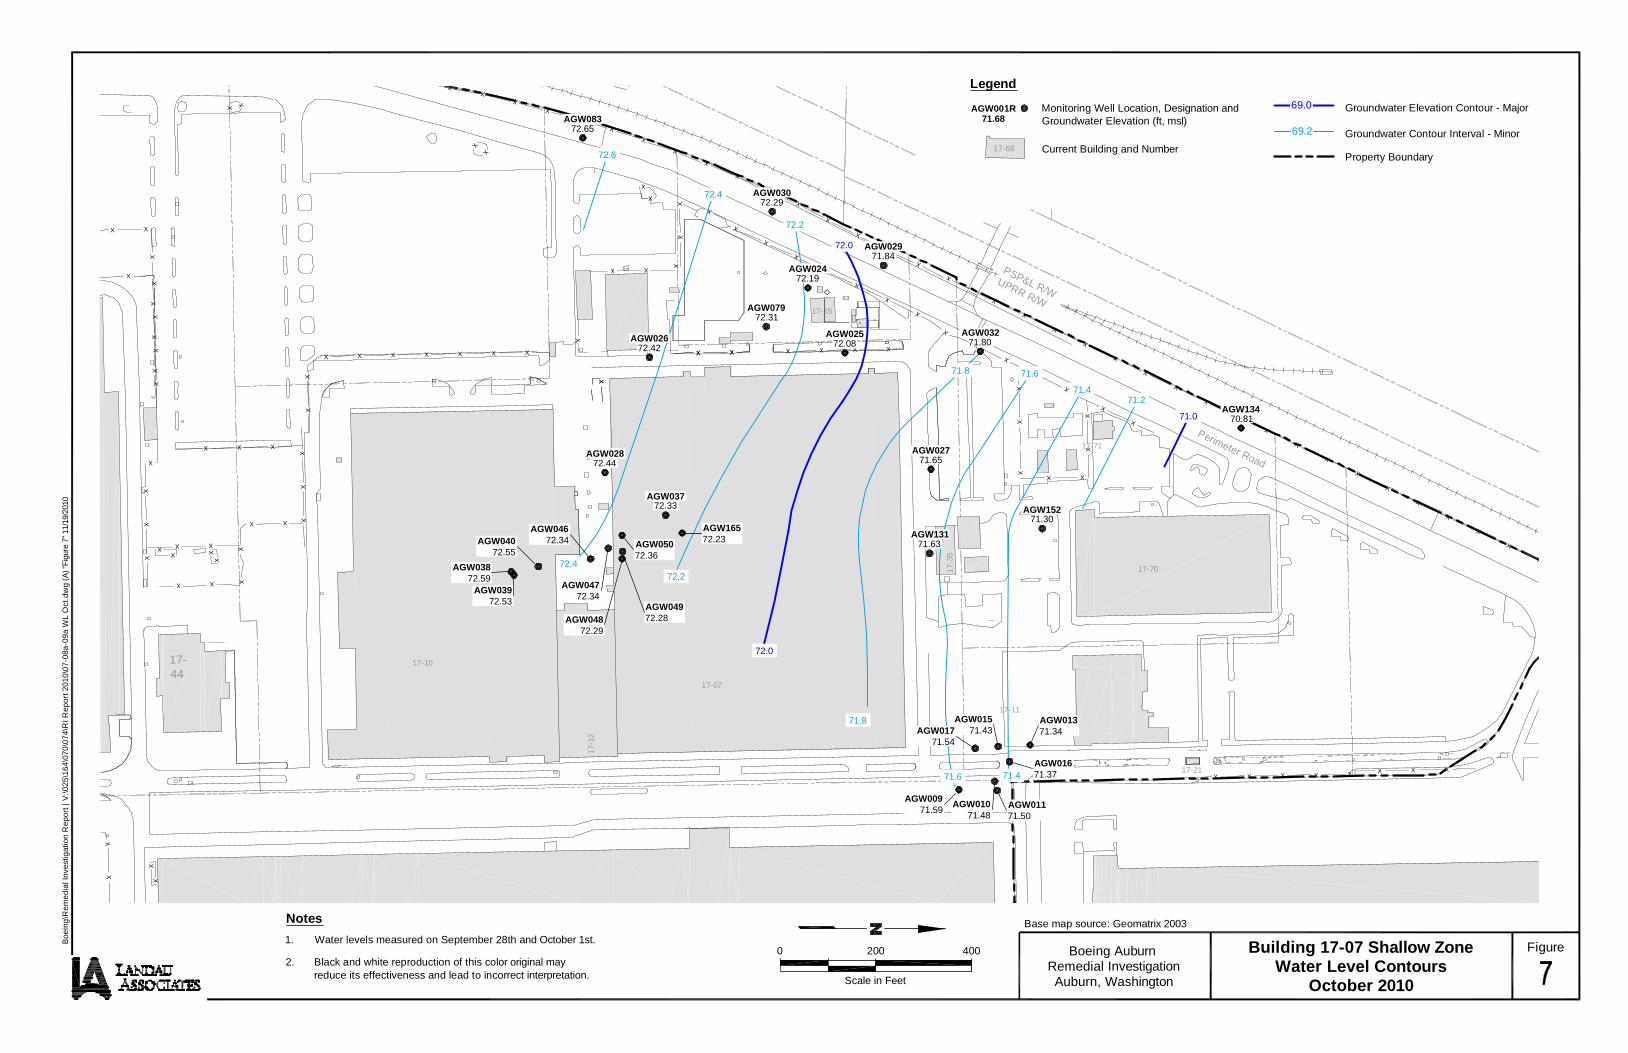
Groundwater levels were contoured to evaluate shallow groundwater flow direction in the vicinity
of Building 17-07 and intermediate and deep groundwater flow in the vicinity of the Area 1 and western
plumes.
Groundwater flow in the vicinity of Building 17-07 was characterized in the 2nd Revised RI
Report. Data presented in that report indicated that flow varied from north-northwestward in July 2008 to
north-northeastward in August 2008 and October 2008. During the summer 2010 RI, groundwater level
measurements from the late September and early October 2010 indicated that shallow groundwater flow
in the vicinity of Building 17-07 was northward with a slight northeast component. This characterization
is similar to the characterization from October 2008 presented in the 2nd Revised RI Report. Shallow
groundwater level contours associated with Building 17-07 from late September/early October 2010 are
presented on Figure 7.
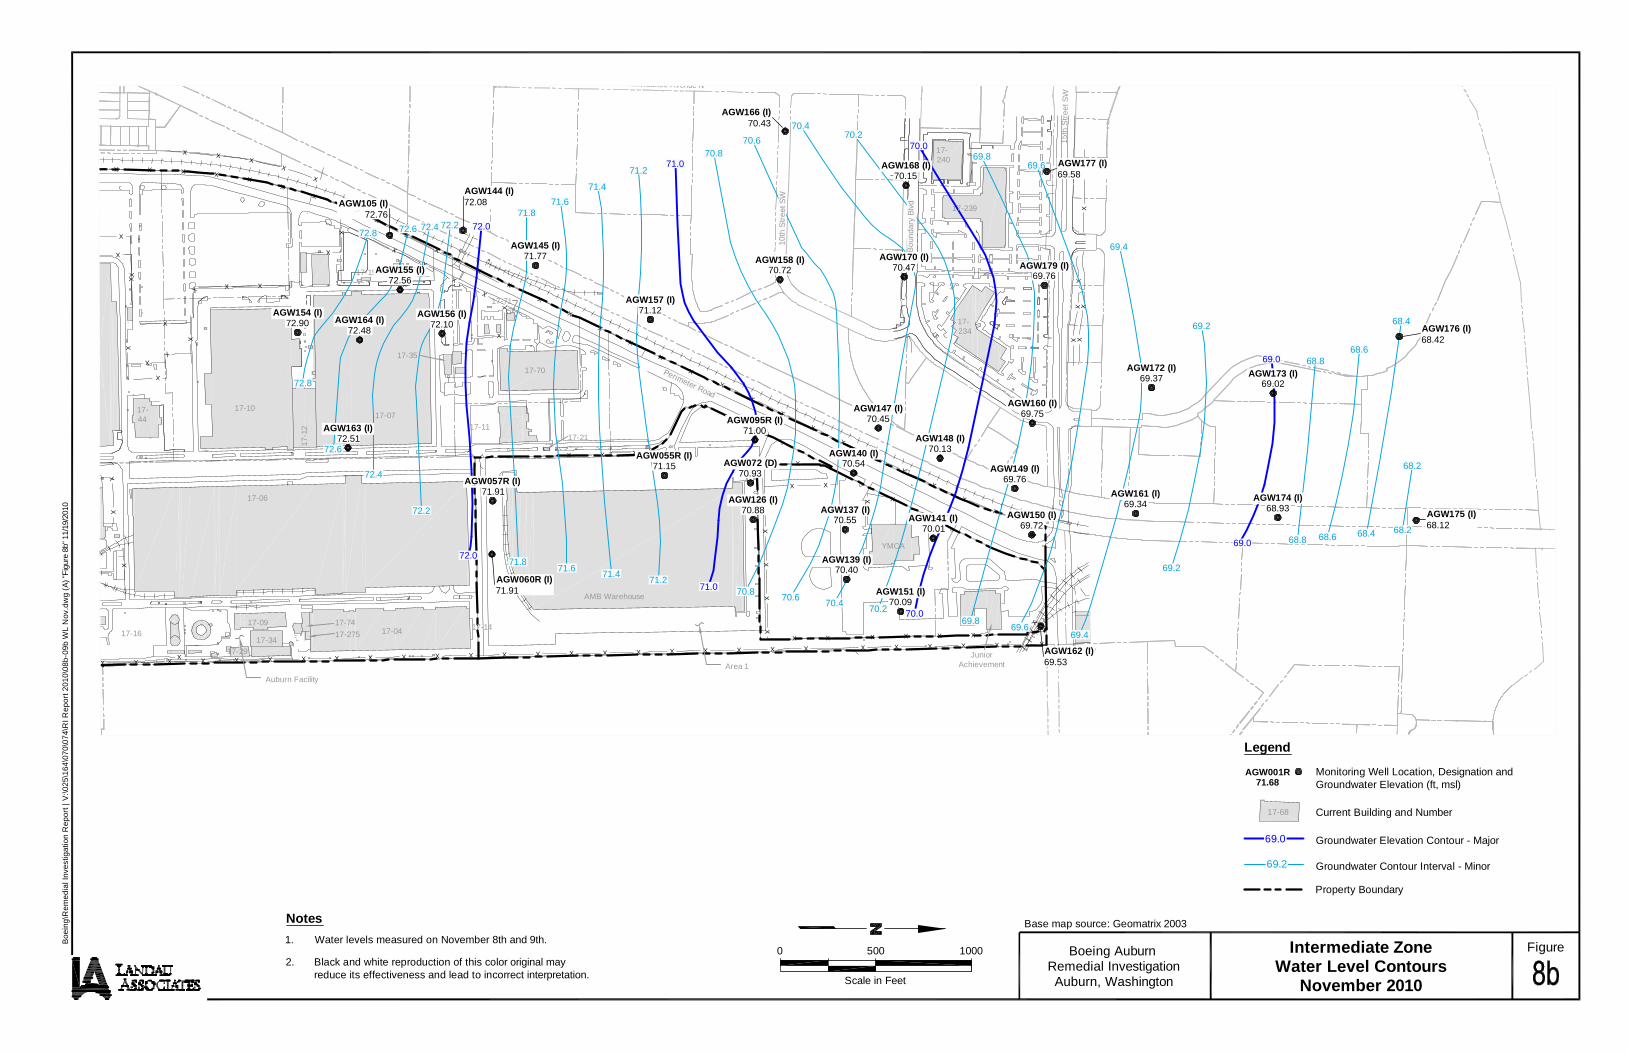
Intermediate and deep zone groundwater flow direction was characterized in the 2nd Revised RI
Report as being generally northward over the northern portion of the facility. However, contour plots
were based on limited information because of the limited number of intermediate and deep wells that
existed at the time the report was issued. At the completion of the winter 2010 RI, intermediate and deep
zone contours were prepared for March 2010 and submitted in the 1st Quarterly Status Report. These data
indicated that gradients were generally northward but with some variation particularly north of the
facility. During the summer 2010 RI, after installation of a number of new intermediate and deep wells,
groundwater level measurements were collected from late September/early October 2010 and early
November 2010. These data confirm the northward flow of groundwater in both the intermediate and
deep zones however gradients are not uniform throughout the area of the Area 1 and western plumes. For
example, it appears that the gradient shifts from slightly northwest south of 15th Avenue Southwest to
north or slightly northeast north of this road. Intermediate zone groundwater contours for
September/October and November are shown on Figures 8a and 8b respectively. Deep zone groundwater
contours for September/October and November are shown of Figures 9a and 9b respectively.
9 Transmissivity is the product of aquifer thickness and hydraulic conductivity. By definition, a smaller thickness would equate to a lower transmissivity all else being equal.

11/19/10 Y:\025\164\R\RI REPORT\NOV 19TH DATA RESULTS REPORT\SUMMER 2010 RI_RPT.DOCX LANDAU ASSOCIATES 4-1
4.0 GROUNDWATER QUALITY DATA
Groundwater quality data from the summer 2010 RI and the two previous offsite plume
investigation phases were evaluated to update the conceptual model associated with offsite plume source
and contaminant migration. The VOC constituents that were detected most consistently during these
investigations were TCE, cis-1,2-dichloroethene (cis-1,2-DCE) and vinyl chloride; these constituents are
all related in that cis-1,2-DCE and vinyl chloride are breakdown products of TCE. Other detected
constituents include 1,1-dichloroethene (1,1-DCE) and 1,1-dichloroethane (1,1-DCA); these constituents
are related in that they are breakdown products of 1,1,1-trichlorethane (TCA).10 A summary of the
summer 2010 RI results for these five constituents are presented on Figure 10 for reference.
Tetrachloroethene (PCE) was also detected intermittently at low concentrations. These data are not
included on figures since PCE was typically not considered a constituent of concern for Building 17-07
and Area 1 based on data presented in the 2nd Revised RI. PCE data however is included on tables and
discussed in the text as appropriate.
4.1 BUILDING 17-07 SHALLOW ZONE INVESTIGATION
A review (Landau Associates 2010c) was conducted of Building 17-07 historical practices and
infrastructure. This review indicated that Building 17-07 is a potential source of VOC contamination
mainly because of a former TCE degreaser (SWMU S-13a) that operated from 1966 to 1995 in the south
central portion of the building (Landau Associates 2010c). In addition to its use in the degreaser, TCE
was presumably stored adjacent to the SWMU S-13a degreaser.
The Building 17-07 TCE source investigation portion of the summer 2010 RI included shallow
borehole sampling at two intermediate well locations [AGW163(I) and AGW164(I)] and the sampling of
a shallow well (AGW165). Additionally, sampling of six shallow wells that are not part of the Phase IV
groundwater monitoring program was conducted since those locations had not been sampled in over a
decade.
Current concentrations of TCE in the shallow zone are very low everywhere at and near Building
17-07. The area where TCE is detected most consistently is near and south of the former TCE degreaser.
However, with the exception of TCE detected at 3.7 µg/L at well AGW037, all TCE concentrations are
currently below 2 µg/L. Well AGW037 was installed next to the former degreaser. New well AGW165,
was installed directly north (i.e., downgradient) of the chrome sump (SWMU S-34) located next to the
10 TCA was only detected twice during sampling events conducted between September and November 2010. TCA was detected at 0.2 µg/L at AGW160(I) and at 0.3 µg/L at AGW180(D). These two wells are adjacent to each other located directly south of 15th Street SW.

11/19/10 Y:\025\164\R\RI REPORT\NOV 19TH DATA RESULTS REPORT\SUMMER 2010 RI_RPT.DOCX LANDAU ASSOCIATES 4-2
former degreaser. TCE was detected at 1.9 µg/L at this well. Most recent TCE sampling data in and
around the WWPTP, adjacent to Building 17-07, did not exceed 1 µg/L. Historically, the highest shallow
zone TCE concentrations in the vicinity of Building 17-07 were detected near the northeast corner of the
building at wells installed for AOC A-01.11 The maximum concentration was 9.3 µg/L at well AGW009.
Concentrations have declined at this cluster of seven wells to where only one location has a TCE
detection based on most recent sample results (TCE is 1.3 µg/L at AGW017). A summary of shallow
zone TCE concentration data is presented on Figure 11.
Current concentrations of cis-1,2-DCE are also very low in the shallow zone. However the
pattern of detections is slightly different than TCE and more closely resembles the pattern for vinyl
chloride. Vinyl chloride is the VOC that has the highest detected shallow zone concentrations. Current
concentrations are elevated (i.e., greater than 5 µg/L) directly north of Building 17-07 at Building 17-35
(SWMU S-18) at two locations (boring ASB0145 and well AGW152). Vinyl chloride was also detected
at 6.1 µg/L at the shallow borehole sample at new well AGW164(I). Slightly elevated vinyl chloride
concentrations are also detected near the northwest corner of the building at well AGW025 (vinyl
chloride is 2.6 µg/L). A summary of cis-1,2-DCE and vinyl chloride concentration data is presented in
Figures 12 and 13 respectively.
Current concentrations of PCE, 1,1-DCE and 1,1-DCA are extremely low. These constituents
were only occasionally detected in the vicinity of Building 17-07. For example, 1,1-DCE was only
detected at three locations (AGW038, AGW040 and AGW131) based on most recent concentrations; the
maximum concentration is 0.078 µg/L. 1,1-DCA was also only detected at three locations (AGW038,
AGW039 and AGW079) based on most recent concentrations; the maximum concentration is 0.5 µg/L.
The maximum PCE concentration detected during the most recent sampling round is 0.068 µg/L at
AGW050. A summary of 1,1-DCE and 1,1-DCA concentration data is presented in Figures 14 and 15
respectively. The most recent PCE concentration data is presented in Table 2.
4.2 OFFSITE SHALLOW ZONE INVESTIGATION
As part of the western plume investigation conducted during the summer 2010 RI, borehole
groundwater samples were collected in the shallow zone at each of the intermediate well clusters
[AGW166(I), AGW168(I), AGW170(I), AGW177(I) and AGW179(I)]. All five of these well clusters are
located northwest of the site, west of Perimeter Road but south of 15th Avenue Southwest. VOCs were
detected at all locations. A summary of VOC detections at these well locations is included on Figure 10.
11 AOC A-01 consists of former gasoline and diesel underground storage tanks. These tanks are not suspected of being a source of TCE.

11/19/10 Y:\025\164\R\RI REPORT\NOV 19TH DATA RESULTS REPORT\SUMMER 2010 RI_RPT.DOCX LANDAU ASSOCIATES 4-3
TCE was detected in all of these borehole samples except AGW179(I) (30 ft-BHS). Detected
concentrations ranged from 3.0 µg/l to 8.6 µg/L. At AGW179(I) (30 ft-BHS) cis-1,2-DCE was detected
at 6.5 µg/L. Cis-1,2-DCE was also detected at the other four shallow zone borehole sample locations
between 1.9 µg/L and 6.4 µg/L. Vinyl chloride, 1,1-DCE, and 1,1-DCA were also detected at some of the
shallow borehole sample locations. PCE was detected at all five of the shallow borehole locations. The
maximum concentration was 0.12 µg/L at AGW170(I) (28.5 ft-BHS).
At AGW177(I) (29 ft-BHS) all six VOC constituents of interest were detected. TCE, cis-1,2-
DCE and 1,1-DCE were detected at concentrations that are higher than current concentrations in the
Building 17-07 area. The TCE concentration was 8.6 µg/L, which is higher than any other historical
shallow zone TCE detection at the facility12 with the exception of Area 1 and select wells at AOC A-01.
The occurrence of VOCs at this location in particular and shallow zone offsite groundwater in general
does not appear to be consistent with spatial shallow zone VOC concentration trends detected at the
facility.
4.3 INTERMEDIATE ZONE VOC PLUMES
The summer 2010 RI groundwater sample results helped define the nature and extent of
intermediate zone VOC plumes. The primary constituent in both the western plume and the Area 1 plume
is TCE though cis-1,2-DCE, vinyl chloride, PCE, 1,1-DCE and 1,1-DCA are also detected, particularly in
the western plume.
The western TCE plume appears to extend from the northern portion of Building 17-07
approximately 5,000 ft downgradient to AGW176(I). The plume is relatively dilute [i.e., the current
maximum concentration is 11 µg/L at AGW145(I)] and is long and relatively narrow. The plume appears
to flow slightly to the northwest before bending back toward the northeast downgradient of 15th Avenue
SW. The Area 1 TCE plume appears to show a similar pattern though offsite concentrations are slightly
lower. Approximate extents of intermediate zone TCE plumes are shown on Figure 16.
Cis-1,2-DCE and vinyl chloride are also detected in the intermediate zone plumes. During the
most recent sampling event, the maximum cis-1,2-DCE concentration is 7.5 µg/L at AGW145(I) located
north of the WWPTP; the maximum vinyl chloride concentration is 6.8 µg/L at AGW155(I) located on
the facility between the WWPTP and Building 17-07. The detections of these two constituents are shown
on Figures 17 and 18 respectively.
PCE, 1,1-DCE and 1,1-DCA were also occasionally detected at intermediate zone well locations
during the most recent sampling. The highest PCE concentration is 0.25 µg/L at AGW157(I) located on
12 Based on the RI database for groundwater that consists of data from 1995 to present.

11/19/10 Y:\025\164\R\RI REPORT\NOV 19TH DATA RESULTS REPORT\SUMMER 2010 RI_RPT.DOCX LANDAU ASSOCIATES 4-4
the facility north of Building 17-07 adjacent to Perimeter Road on the PSE Interurban Trail. The highest
1,1-DCE concentration is 0.4 µg/L at AGW147(I) located north of Area 1 adjacent to Perimeter Road on
the PSE Interurban Trail. The highest 1,1-DCA concentrations were 0.9 and 1.1 µg/L at AGW055R(I)
(located in Area 1) and AGW147(I) respectively.
4.4 DEEP ZONE VOC PLUMES
There appears to be a defined deep zone western TCE plume that follows a pattern similar to the
intermediate zone TCE plume. The highest TCE concentration based on most recent sampling data is 5.2
µg/L at AGW159(D) located on Boundary Boulevard northwest of the facility. TCE is also detected in
the deep zone within the footprint of the Area 1 intermediate zone plume, however concentrations are
very low; the highest TCE concentration based on most recent sampling data is 0.9 µg/L at AGW138(D).
The very low concentrations make it difficult to define a plume in the deep zone associated with Area 1.
Deep zone TCE concentrations are shown on Figure 19.
Cis-1,2-DCE and vinyl chloride were also detected in the deep zone western plume during the
most recent sampling event. Cis-1,2-DCE was detected at all deep western plume locations except
AGW143(D). The maximum cis-1,2-DCE concentration is 2.0 µg/L at AGW146(D). The maximum
vinyl chloride concentration is 0.36 at AGW146(D). The detections of these two constituents are shown
on Figures 20 and 21 respectively. During the most recent sampling round, PCE was detected at four
deep zone locations. The maximum concentration was 0.067 µg/L at AGW180(D). 1,1-DCE was not
detected. 1,1DCA was only detected at AGW180(D) at 0.3 µg/L.
11/19/10 Y:\025\164\R\RI REPORT\NOV 19TH DATA RESULTS REPORT\SUMMER 2010 RI_RPT.DOCX LANDAU ASSOCIATES 5-1
5.0 DISCUSSION
The summer 2010 RI provided additional information to define the hydrogeologic conceptual
model offsite to the north of the facility. Groundwater flow in this area is northward, however there is
some variation in horizontal gradients from northwestward to slightly northeastward. The variation in
gradients may be due to changes in aquifer transmissivity or variations in groundwater recharge or
discharge. Changes in aquifer transmissivity appear to occur due to changes in the elevation of the top of
the underlying aquitard. Recharge and discharge may be affected by the relative amount of impervious
surface or constructed wetland features that appear to be present north of the site (e.g., the property
directly west of the Fana property is a maintained wetland).
Additional data collected during the recent investigation helped further define two intermediate
zone VOC plumes that flow northward and beyond the facility boundary. The Area 1 and western plumes
are similar in that TCE is the major constituent and the plumes are fairly narrow with relatively low TCE
concentrations. However the western plume extends further vertically into the deep zone and contains
higher concentrations of secondary VOC constituents such as cis-1,2-DCE and vinyl chloride. Current
data indicate that the leading edge of both plumes extends beyond the northernmost wells. Additional
field investigations will be necessary to identify the extent of both the western and Area 1 plumes.
Also, relatively low, but significant concentrations of VOCs were detected in shallow borehole
samples at offsite western plume wells. During the 2nd Revised RI, shallow wells and borings were
installed along Perimeter Road that confirmed that shallow zone VOC contamination was not migrating
offsite northwest of Perimeter Road. The detections of VOCs in this area may be indicative of another
source of VOC contamination that is not part of the Boeing facility. Additional investigations will be
necessary to identify the source and nature and extent of offsite shallow zone VOC contamination.
11/19/10 Y:\025\164\R\RI REPORT\NOV 19TH DATA RESULTS REPORT\SUMMER 2010 RI_RPT.DOCX LANDAU ASSOCIATES 5-2
The source of the Area 1 plume was previously identified as SWMU S-12b (former TCE
degreaser) and AOC A-08 (former tank line). However the source of the western plume has not been
identified. Historically, TCE concentrations at Building 17-07 have been relatively low (i.e., less than 4
µg/L) and do not appear to be indicative of a source consistent with the nature and extent of the western
plume. The three additional wells installed in and around Building 17-07 during the summer 2010 RI
were consistent with historical data in that concentrations were low. Additional field investigations will
be required to identify the western plume source.
LANDAU ASSOCIATES, INC.
Eric F. Weber, L.G. Principal
EFW/jas

11/19/10 Y:\025\164\R\RI REPORT\NOV 19TH DATA RESULTS REPORT\SUMMER 2010 RI_RPT.DOCX LANDAU ASSOCIATES
6-1
6.0 REFERENCES
Landau Associates 2010a. Status Report: No. 30, January Through March 2010 Activity Period, Boeing Commercial Airplane Group, Auburn Plant, WAD 041337130, RCRA Corrective Action Agreed Order No. 01HWTRNR-3345. Letter from Eric Weber, Landau Associates to Robin Harrover, Ecology. April 15.
Landau Associates 2010b. Agency Review Draft Work Plan Boeing Auburn Remedial Investigation 700 15th Street Southwest Auburn, Washington. Prepared for the Boeing Company. July 21 Landau Associates, 2010c. Technical Memorandum: Building 17-07 TCE Source Evaluation. July 19. Landau Associates, 2009. 2nd Revised Ecology Review Draft Remedial Investigation Report – Boeing Auburn Fabrication Division Facility – Auburn, Washington. Prepared for the Boeing Company. April 2009.

Per
imet
er R
oad
Bou
ndar
y B
lvd
Milw
auk
ee A
venu
e N
10th Street SW
17-74
17-16
17-06
17-04
17-10
17-15
17-35
17-34
17-29
17-09
17-44
17-70
17-11
17-71
17-21
17-239
17-
17-234
17-12
240
PS
P&
L R
/WU
PR
R R
/W
AGW035 (D)
AGW034 (D)
AGW098R (D)
AGW138 (D)
AGW142 (D)
AGW073 (D)
AGW143 (D)
AGW146 (D)
AGW159 (D)
AGW165
3.0
5.0
AGW048AGW049
AGW050
AGW010
AGW015
AGW024 AGW025
AGW026
AGW027AGW029
AGW030
AGW032
AGW033
AGW037
AGW039
AGW041
AGW044
AGW064
AGW065
AGW068
AGW069
AGW079
AGW085
AGW115
AGW116AGW117
AGW118
AGW127
AGW129
AGW128
AGW130
AGW131
AGW134
AGW135
AGW152
AGW011
AGW012
AGW013
AGW014AGW016
AGW028
AGW042
AGW043
AGW046AGW047
AGW076AGW077
AGW082
AGW083AGW084
AGW104
AGW110R
AGW001R
AGW002R
AGW006R
AGW009
AGW017
AGW031R
AGW038
AGW040
AGW053R
AGW058R AGW059R
AGW066AGW067
AGW106R
AGW112R
AGW125
AGW136
AGW078
AGW086
AGW150 (I)
AGW105 (I)
AGW072 (I)
AGW055R (I)
AGW057R (I)AGW060R (I)
AGW095R (I)
AGW126 (I)
AGW137 (I)
AGW140 (I)
AGW141 (I)
AGW139 (I)
AGW144 (I)
AGW145 (I)
AGW147 (I)
AGW148 (I)
AGW149 (I)
AGW151 (I)
AGW154 (I)
AGW155 (I)
AGW156 (I)
AGW157 (I)
AGW158 (I)
AGW160 (I)
AGW161 (I)
AGW162 (I)
AGW163 (I)
AGW176 (I)
AGW175 (I)
AGW177 (I)
AGW178 (D)
AGW179 (I)
AGW180 (D)
AGW168 (I)
AGW169 (D)
AGW173 (I) AGW174 (I)
AGW170 (I)
AGW171 (D)
AGW164 (I)
AGW172 (I)
AGW166 (I)
AGW167 (D)
5.03.0
5.0
3.0
3.0
17-07
Fana
Glimcher
Area 1 Plume
Western Plume
15th Street SW
Junior Achievement
YMCA
AMB PropertyArea 1
GSA Property
WWPTP
0 500 1000
Scale in Feet
Boeing AuburnRemedial InvestigationAuburn, Washington
Well LocationsFigure
2010 RI Report | V:\025\164\070\074\RI Report 2010\01 Well Locations.dwg (A) "Figure 1" 11/19/2010
Base map source: Geometrix 2003; Aerial Photo Source: Google Earth Professional 2009; Parcel Data Source: King County GIS 2010
Notes
1. "AGW" Designates Required Wells.
2. "OPT" Designates Optional Wells.
3. Black and white reproduction of thiscolor original may reduce itseffectiveness and lead to incorrectinterpretation.
Area Shown
Boeing AuburnPlant Map
Legend
AGW001
New Shallow Well Location
New Intermediate Well Location
New Deep Well Location
Existing Shallow Well Location and Designation
Existing Intermediate Well Location and Designation
Existing Deep Well Location and Designation
AGW001(I)
AGW001(D)
Intermediate Zone TCE Concentration Contour ( g/L)3.0
King County Parcels (2010)
City Limits
City of Algona
City of Auburn
City
of
Alg
ona
City
of
Aub
urn
X
XX
X
XX X
X
X
X
X
X
X
X
X
X
X
X
X
X
XX
XXXX
X
X
X
X
X
X
X
X
X
X XX
X
X
X X X X XXXXXXXXXXXXXXXXXXXXXXX
X
X
X X X
X
X
X
X
X
X
X
X
X
X
X
X
X
X
X
X
X
X
X
X
X
X
XX
XX
XX
X X
XXX
XX
XX
X
X X X X X X
X
X X
17-275
17-7417-16
17-06
17-04
17-1017-07
17-29
17-34
17-09
17
-12
17-11
17-35
17-15
17-71
17-70
17-14
17-21
17-239
YMCA
AMB Warehouse
17-240
17-234
17-44
17-13
PSP&L R/WUPRR R/W
JuniorAchievement
Area 1
AGW048AGW049
AGW050
AGW010
AGW015
AGW024
AGW025AGW026
AGW027
AGW029AGW030
AGW032
AGW033AGW037
AGW039
AGW041
AGW044
AGW064
AGW065
AGW068AGW069
AGW079
AGW085
AGW115AGW116
AGW117
AGW118
AGW127
AGW129 AGW128AGW130
AGW131
AGW134
AGW135
AGW152
AGW011AGW012
AGW028
AGW042AGW043
AGW046
AGW047
AGW076
AGW077
AGW078
AGW082
AGW083
AGW084AGW086
AGW104
AGW110R
AGW001R
AGW002R
AGW006R
AGW009
AGW017 AGW031R
AGW040
AGW053R
AGW058R
AGW059R
AGW066
AGW067
AGW106R
AGW112R AGW125AGW136
AGW072 (I)AGW055R (I)
AGW057R (I)
AGW060R (I)
AGW095R (I)
AGW126 (I)
AGW137 (I)
AGW140 (I)
AGW141 (I)
AGW139 (I)
AGW151 (I)
AGW162 (I)
AGW165AGW035 (D)
AGW034 (D)
AGW098R (D)
AGW138 (D)
AGW142 (D)
AGW073 (D)
AGW143 (D)
AGW146 (D) AGW159 (D)
AGW178 (D)
AGW180 (D)
AGW105 (I)
AGW144 (I)
AGW145 (I)
AGW147 (I)
AGW148 (I)
AGW149 (I)
AGW150 (I)
AGW154 (I)
AGW155 (I)
AGW156 (I)AGW157 (I)
AGW158 (I)
AGW160 (I)
AGW161 (I)
AGW163 (I)
AGW164 (I)
AGW172 (I)AGW173 (I)
AGW174 (I) AGW175 (I)
AGW176 (I)
AGW177 (I)
AGW179 (I)
15
th S
tre
et S
W
Perimeter Road
Milwaukee Avenue N
Bo
un
da
ry B
lvd
10
th S
tre
et S
W
AGW168 (I)AGW169 (D)
AGW170 (I)
AGW171 (D)
AGW166 (I)
AGW167 (D)
0 500 1000
Scale in Feet
Base map source: Geomatrix 2003, King County GIS 2010
Boeing AuburnRemedial InvestigationAuburn, Washington
Site PlanFigure
Bo
ein
g\R
em
ed
ial I
nve
stig
atio
n R
ep
ort
| V
:\0
25
\16
4\0
70
\07
4\R
I Re
po
rt 2
01
0\0
2 S
ite P
lan
.dw
g (
A)
"Fig
ure
2"
11/1
9/20
10
Legend
17-68
AGW001R
Current Building and Number
Property Boundary
Shallow Monitoring Well LocationIntermediate Monitoring Well LocationDeep Monitoring Well Location
(I)
(D)
Cross Section Line

Ele
vatio
n in
ft
(NG
VD
29)
Ele
vatio
n in
ft
(NG
VD
29)
-25
-20
-15
-10
-5
0
5
10
15
20
25
30
35
40
45
50
55
60
65
70
75
80
85
90
95
100
105
110
0+00 2+00 4+00 6+00 8+00 10+00 12+00 14+00 16+00 18+00 20+00 22+00 24+00 26+00 28+00 30+00 32+00 34+00 36+00 38+00 40+00 42+00 44+00 46+00
A'South
ANorth
AGW178(D)(Offset 9' E)
AGW168(I)(Offset 68' E)
AGW167(D)(Offset 200' W)
AGW145(I)/AGW146(D)(Offset 142' E)
-25
-20
-15
-10
-5
0
5
10
15
20
25
30
35
40
45
50
55
60
65
70
75
80
85
90
95
100
105
110
AGW143(D)(Offset 88' W)
AGW034(D)(Offset 121' E)
AGW105(I)
AGW030
AGW083
GP-GM
SM
GP/GP-GM
SM
GM
SMGP-GM
SM
GP
SP
SM
GP-GM
SP
SM
GM
SM
SW
SP-SM
GP
SPSM
SP
SM
SW
ML
SP
SP
SP
ML
SM
GP
GW
CL
SP-SM
ML
SM
SP-SM
SP
SM
SP
GP
SM
SP
SP
ML
SMML
SP
ML
SP
GP
Shallow
Intermediate
Deep
SP-SM
GP
SM
AGW178(D)
TCE 4.5Date 9/29/10
AGW145(I)
TCE 11.0Date 9/1/10
AGW146(D)TCE 3.5Date 9/1/10
AGW144(I)TCE 0.9Date 9/1/10
AGW143(D)TCE 0.2UDate 9/1/10
AGW034(D)TCE 1.9Date 12/8/09
AGW105(I)
TCE 0.6Date 6/3/10
AGW030TCE 0.2UDate 12/7/09
AGW083TCE 0.2UDate 5/21/03
SM
SP
GP
SP
GP
SP
GP
10/1/10
AGW177(I)
TCE 5.2Date 9/29/10
SM
PT
SM
SP-SM
SP
GP
NR
GP
SP
GPSM
GP
PT
SM
NR
RS
SM
GM
GP
SP
SM
SP
TD=56.5'HSA
TD=95'RS
TD=60'RS
TD=60'RS
TD=60.5'RS
TD=95'RS
TD=95'RS
TD=55'HSA
TD=140'P
TD=56'HSA
TD=26.5'HSA
TD=21.5'HSA
AGW177(I)
AGW169(D)(Offset 80' E)
AGW166(I)(Offset 220' W)
AGW144(I)(Offset 121' W)
ML
CH
TD=95'
MLSM
TD=95'RS
SM
ML
15t
h S
tre
et S
W
Bou
nda
ry B
lvd
10t
h S
tre
et S
W
Inte
rurb
an
Tra
il
NRGP-GM
PTSM
PT
SM
SP-SM
SP
GP
SM
SP
NR
GM
SM
SP
GP
GP-GM
SP
SM
WDSP-SM
SP
SP-SM
SP
GP
SM
NR NRGPPT
SP-SM
SP
GP
SP
GP
SP
ML
SPSMSP
GP
SP
GP
SP
SMSP-SMGP
SP
GP
SP
AGW168(I)
TCE 4.0Date 11/8/10
AGW166(I)
TCE <0.2
Date 11/8/10
AGW169(D)
TCE 5.1Date 11/8/10
AGW167(D)
TCE 3.6Date 11/8/10
11/8/10 11/8/10 11/8/10
11/8/10
Boeing AuburnRemedial InvestigationAuburn, Washington
Geologic Cross Section A-A'Figure
20
10
RI R
ep
ort
| \\
TA
CO
MA
1\D
ata
\DA
TA
\PR
OJE
CT
\02
5\1
64
\T\R
I Wo
rk\S
pri
ng
_S
um
me
r 2
01
0 R
I Wo
rk\F
igu
res\
Cro
ss S
ect
ion
s\C
ross
Sec
tions
.dw
g (A
) "F
igur
e 3
" 11
/19/
2010
0 400 800
Horizontal Scale 1" = 400'Vertical Scale 1" = 20'
Legend
Groundwater Level (NGVD29)
Top of Exploration
Bottom of Exploration
Well Screen Interval
AGW034(D)(Offset 81' E) Offset Distance in Feet
and Direction
Exploration Designation
Aquifer Zone Break
Notes
Black and white reproduction ofthis color original may reduce itseffectiveness and lead to incorrectinterpretation.Groundwater elevations (NGVD29)were collected on September 28,2010 unless otherwise noted.Trichloroethene (TCE)concentrations are most recentand are in g/L.NR = No RecoveryHSA = Hollow Stem AugerRS = RotosonicP = Percussion
1.
2.
3.
4.
Total Depth of Boring (ft, BGS)TD=140'P Drilling Method
Aquitard

Ele
vatio
n in
ft
(NG
VD
29)
Ele
vatio
n in
ft
(NG
VD
29)
0+00 2+00 4+00 6+00 8+00 10+00 12+00 14+00 16+00 18+00 20+00 22+00 24+00 26+00 28+00 30+00 32+00 34+00 36+00 38+00
B'South
BNorth
AGW180(D)
-25
-20
-15
-10
-5
0
5
10
15
20
25
30
35
40
45
50
55
60
65
70
75
80
85
90
95
100
105
110
-25
-20
-15
-10
-5
0
5
10
15
20
25
30
35
40
45
50
55
60
65
70
75
80
85
90
95
100
105
110
AGW171(D)AGW159(D) AGW157(I)
(Offset 101' W)
AGW134
(Offset 98' E)
AGW152
(Offset 98' W)
AGW156(I)
40+00 42+00 44+00
AGW164(I) (Offset 128' E)
AGW165
(Offset 9' W)
AGW154(I)
SP
GP
SP
GP
SP
SM
GPOL
GP-GM
GP
SM
SP-SM
SP
GP
SP
GP
SP
SM
SP
GP
SP
SM
SP
GP
SP
SM
SP-SM
GP
SM
SP-SM
SP-SM
GP
SP
SMSM
SP-SM
SM
SPGP
GP
SP
GP
SPGP
SP
Shallow
Intermediate
DeepGP
SP
SP-SM
SP
GP
SP
SP-SM
SM
SPSM
GP-GM
GP
SP
SM
GP
SP
SP
GPSP
GP
GP-GM
ML
SP-SM
GP
SP
GP
AGW164(I)
TCE 1.4Date 9/15/10
AGW156(I)
TCE 5.0Date 9/1/10
AGW027TCE 0.2UDate 6/2/10AGW152
TCE 0.2UDate 6/2/10
AGW165TCE 1.9Date 9/15/10
AGW154(I)
TCE 0.4Date 9/1/10
AGW134TCE 0.2UDate 6/3/10
AGW157(I)
TCE 3.5Date 9/1/10
AGW159(D)
TCE 5.2Date 9/14/10
AGW180(D)
TCE 5.1Date 9/29/10
SM
PT
SM
SP-SM
SP
GPSP
GP
SM
SPMLSM
GP
SP
GP-GM
ML
AGW179(I)
TCE 1.2Date 9/29/10
SM
SP-SM
SP
SP-SM
SP
GP
SPGP
SP
GP
SP
GP
SM
SM
GP-GM
TD=90'RS
TD=60'RS
TD=60.2'RS
TD=60'RS
TD=60'RS
TD=60.5'HSA
RS
TD=60.5'HSA
TD=28'HSA TD=29.5'
HSA
TD=60.5'HSA
TD=26'HSA
TD=60.5'HSA
GM
SM
PTML
SP
6/2/10
AGW179(I)AGW170(I)
(Offset 78' W)
AGW027
NR
AGW158(I)
TCE 3.4Date 9/14/10
NR
SP
GP
SP
ML
NR
SP
NR
AGW158(I)(Offset 40' E)(Offset 81' W) (Offset 78' W)
(Offset 74' E)
?TD=95'
SP-SMMLSP
RSTD=95'
15t
h S
tre
et S
W
(Offset 30' W)
Bou
nda
ry B
lvd
10t
h S
tre
et S
W
Bui
ldin
g 1
7-07
NR
GP-GM
SM
SP
GP
SP
GP
NR
SP-SM
SP
GP
SP
GP
SP
GP
SP
GP
SM
SP-SM
AGW170(I)TCE 3.6Date 11/8/10
AGW171(D)
TCE 2.1Date 11/8/10
11/8/1011/8/10
Per
imet
er R
d
Boeing AuburnRemedial InvestigationAuburn, Washington
Geologic Cross Section B-B'Figure
20
10
RI R
ep
ort
| \\
TA
CO
MA
1\D
ata
\DA
TA
\PR
OJE
CT
\02
5\1
64
\T\R
I Wo
rk\S
pri
ng
_S
um
me
r 2
01
0 R
I Wo
rk\F
igu
res\
Cro
ss S
ect
ion
s\C
ross
Sec
tions
.dw
g (A
) "F
igur
e 4
" 11
/19/
2010
0 400 800
Horizontal Scale 1" = 400'Vertical Scale 1" = 20'
Legend
Groundwater Level (NGVD29)
Top of Exploration
Bottom of Exploration
Well Screen Interval
AGW134(Offset 76' W) Offset Distance in Feet
and Direction
Exploration Designation
Aquifer Zone Break
Notes
Black and white reproduction ofthis color original may reduce itseffectiveness and lead to incorrectinterpretation.Groundwater elevations (NGVD29)were collected on September 28,2010 unless otherwise noted.Trichloroethene (TCE)concentrations are most recentand are in g/L.NR = No RecoveryRS = RotosonicHSA = Hollow Stem Auger
1.
2.
3.
4.
Total Depth of Boring (ft, BGS)TD = 28'HSA Drilling Method
Aquitard

Ele
vatio
n in
ft
(NG
VD
29)
Ele
vatio
n in
ft
(NG
VD
29)
0+00 2+00 4+00 6+00 8+00 10+00 12+00 14+00 16+00 18+00 20+00 22+00 24+00 26+00 28+00 30+00 32+00 34+00 36+00 38+00 40+00 42+00 44+00 46+00 48+00 50+00
C'South
CNorth
AGW176(I)
SP-SM
10
15
20
25
30
35
40
45
50
55
60
65
70
75
80
85
90
95
10
15
20
25
30
35
40
45
50
55
60
65
70
75
80
85
90
95
(Offset 163' E)AGW173(I)
(Offset 70' W)AGW172(I) AGW160(I)
(Offset 72' E)AGW148(I)
(Offset 223' W)AGW147(I)
AGW140(I)
(Offset 110' W)AGW065
(Offset 90' W)AGW072(I)/AGW073(D)
(Offset 204' W)AGW055R(I)
AGW112RAGW110R
AGW106R
52+00 54+00 56+00
AGW057R(I)
58+00
AGW163(I)(Offset 132' W)
AGW009
5
0
-5
-10
-15
-20
-25
5
0
-5
-10
-15
-20
-25
GP
SP
SP-SMSP
GP
SP
SM
GP-GM
GP
SP
GP
NR
SM
SP
SM
SP-SM
ML
SP-SM
SM
GP-GM
SM
SM
ML
SP-SM
SP
SM
GP
SM
SW-SM
GW-GM
GW
SP
SP-SM
SP
GP-GM
SP
ML
SW-
GP-
SP
ML
SP
SW
SM
SP-SM
SW
GP
SM
GP-GM
SP
SP-SM
SPGM
SM
GP-GMSM
100
105
110
100
105
110
Shallow
Intermediate
Deep
SP
SP-SM
GPSP-SM
SP
GP
SP
SM
SP-SM
SM
GM
SP
SM
GP
SM
PT
SP
PT
SM
SP
GP
SPGP
SP
SM
GM
GP
SM
GPSP
GP
SP
GP
SP
GP
SM
GP
SM
PTSP-SMSM
SP-SM
GP
SP
GP
SP
GP
AGW176(I)
TCE 5.4Date 10/6/10
AGW173(I)
TCE 0.2UDate 10/6/10
AGW172(I)
TCE 3.4Date 9/16/10
AGW160(I)
TCE 4.7Date 9/14/10
AGW148(I)TCE 5.0Date 9/14/10
AGW147(I)
TCE 0.2UDate 9/14/10
AGW140(I)
TCE 5.4Date 9/14/10
AGW065TCE 0.2UDate 6/9/10
AGW072(I)TCE 2.2Date 6/7/10
AGW073(D)
TCE 0.3Date 6/7/10
AGW055R(I)
TCE 0.8Date 6/7/10
AGW112RTCE 2.0Date 6/8/10
AGW110RTCE 0.2UDate 6/8/10
AGW106RTCE 0.2UDate 6/8/10
AGW058RTCE 0.7Date 6/7/10
AGW057R(I)
TCE 2.0Date 6/7/10
AGW009TCE 0.2UDate 6/10/10
AGW163(I)
TCE 3.3Date 9/15/10
10/1/10
6/8/10 6/8/106/8/106/9/10
AGW006RTCE 0.9Date 6/7/10
TD=60'RS
TD=60'RS TD=60'
RS
TD=60'RSTD=60.5'
HSA
TD=55'HSA TD=56.5'
HSA
TD=46'RS
TD=27'HSA
TD=46.5'HSA
TD=35.5'HSA
TD=35'HSA
TD=35'HSA
TD=50.5'HSA
TD=25.5'HSA
TD=20'HSA
TD=26.5'HSA
SP-SM
SP
GP-GM
GP
SM
GP-GM6/7/10
GM
SM
(Offset 202' W)AGW006R AGW058R
NR
GP
CL/ML
ARTD=114'
15t
h S
tre
et S
W
Per
imet
er R
d
AM
B W
areh
ous
e
Bui
ldin
g 1
7-07
Boeing AuburnRemedial InvestigationAuburn, Washington
Geologic Cross Section C-C'Figure
20
10
RI R
ep
ort
| \\
TA
CO
MA
1\D
ata
\DA
TA
\PR
OJE
CT
\02
5\1
64
\T\R
I Wo
rk\S
pri
ng
_S
um
me
r 2
01
0 R
I Wo
rk\F
igu
res\
Cro
ss S
ect
ion
s\C
ross
Sec
tions
.dw
g (A
) "F
igur
e 5
" 11
/19/
2010
0 400 800
Horizontal Scale 1" = 400'Vertical Scale 1" = 20'
Legend
Groundwater Level (NGVD29)
Top of Exploration
Bottom of Exploration
Well Screen Interval
AGW173(I)(Offset 168' E) Offset Distance in Feet
and Direction
Exploration DesignationAquifer Zone Break
Notes
Black and white reproduction ofthis color original may reduce itseffectiveness and lead to incorrectinterpretation.Groundwater elevations (NGVD29)were collected on September 28,2010 unless otherwise noted.
1.
2.
Trichloroethene (TCE)concentrations are most recentand in in g/L.NR = No RecoveryRS = RotosonicHSA = Hollow Stem AugerAR = Air Rotary
3.
4.
Total Depth of Boring (ft, BGS)TD = 60'Total Depth of BoringRS
Aquitard
Ele
vatio
n in
ft
(NG
VD
29)
Ele
vatio
n in
ft
(NG
VD
29)
0+00 2+00 4+00 6+00 8+00 10+00 12+00 14+00 16+00 18+00 20+00 22+00 24+00 26+00 28+00 30+00 32+00 34+00 36+00 38+00 40+00 42+00 44+00 46+00 48+00 50+00
D'South
DNorth
AGW175(I)
SM
10
15
20
25
30
35
40
45
50
55
60
65
70
75
80
85
90
95
10
15
20
25
30
35
40
45
50
55
60
65
70
75
80
85
90
95
52+00
AGW174(I)AGW161(I)
AGW150(I)AGW141(I)
AGW136/AGW137(I)
AGW067 AGW001R
5
0
-5
-10
5
0
-5
-10
SM
SP-SM
SP
GP-GM
SP
GP-GM
SM
SP/SM
ML
SM
GP-GM
GP/SP
SP-SM
SP
SM
ML
SM
ML
SM
GP
SM
GP-GM
SP
GP
SP
GP
SM
GP
SM
GP
SM
GP
SP-SM
SMGP
GP-GM
SM
GM
GP
SM
GP
SP
SM
GP-GM
SM
SP-SM
GP
100
105
110
100
105
110
-15
-20
-25
-15
-20
-25
Shallow
Intermediate
Deep
SP
SP-SM
SM
NR
SP
SP-SM
SP
MLSM
GP-GM
SP
GP
SP-SM
SP
SP-SM
SP
SP-SM
SM
SP
SM
GPAGW175(I)
TCE 3.4Date 9/15/10
AGW174(I)
TCE 3.6Date 9/15/10
AGW161(I)
TCE 2.8Date 9/15/10
AGW150(I)
TCE 2.3Date 9/14/10
AGW142(D)
TCE 0.7Date 6/9/10
AGW138(D)TCE 0.9Date 6/9/10
AGW067TCE 5.9Date 6/7/10
AGW001RTCE 3.4Date 6/7/10
6/7/106/7/10
AGW141(I)
TCE 3.0Date 6/9/10
AGW136TCE 3.3Date 6/9/10
AGW137(I)
TCE 5.6Date 6/9/10
TD=60'RS
TD=60'RS
TD=60.4'HSA
TD=95'RS
TD=47'RS
TD=92'RS
TD=93'RS
TD=65'HSA
TD=45.5'HSA
TD=29'HSA
TD=25.5'HSA
SP
SP-SM
SP
SM
ML
SM
GP-GM
AGW142(D)
AGW138(D)
NR
GP
SM
SM
NR
NR
NR
NR
NR NR
SP-SMGP
15t
h S
tre
et S
W
Per
imet
er R
d
AM
B W
areh
ous
e
Boeing AuburnRemedial InvestigationAuburn, Washington
Geologic Cross Section D-D'Figure
20
10
RI R
ep
ort
| \\
TA
CO
MA
1\D
ata
\DA
TA
\PR
OJE
CT
\02
5\1
64
\T\R
I Wo
rk\S
pri
ng
_S
um
me
r 2
01
0 R
I Wo
rk\F
igu
res\
Cro
ss S
ect
ion
s\C
ross
Sec
tions
.dw
g (A
) "F
igur
e 6
" 11
/19/
2010
0 400 800
Horizontal Scale 1" = 400'Vertical Scale 1" = 20'
Legend
Groundwater Level (NGVD29)
Top of Exploration
Bottom of Exploration
Well Screen Interval
AGW175(I) Exploration Designation Aquifer Zone Break
Notes
Black and white reproduction ofthis color original may reduce itseffectiveness and lead to incorrectinterpretation.Groundwater elevations (NGVD29)were collected on September 28,2010 unless otherwise noted.
1.
2.
Trichloroethene (TCE)concentrations are most recentand in g/L.NR = No RecoveryHSA = Hollow Stem AugerRS = Rotosonic
3.
4.
Total Depth of Boring (ft, BGS)TD=60'Drilling MethodRS
X
X
X
X
X X
X
XX
X
XX
XX
XX
X X X X X X X
X
X
X
X
X
X
X
X
X
X
X
X
X
XX
X
XX
X
X
X X X X X X
X
X
X
X
X
X
X
X
X
X
X
X
X
X
XX
XX
XX
X
XX
X
X X X
XX
XX
X
XX
X
X
XX
XX
XXXX
XX
X
X
X X
XX
X
X
X X X X X X X X
X
X
X
X
X
X
X
X
X
X
X
X
X
X
X
X
X
X
X
X
X X
X X
X
17-10
17-07
17
-12
17-11
17
-35
17-15
17-71
17-70
17-21
17-44
71.0
71.271.4
71.4
71.6
71.6
71.8
71.8
72.2
72.2
72.4
72.4
72.6
AGW04872.29
AGW04972.28
AGW05072.36
AGW01071.48
AGW01571.43
AGW02472.19
AGW02572.08AGW026
72.42
AGW02771.65
AGW02971.84
AGW03072.29
AGW03271.80
AGW03772.33
AGW03972.53
AGW07972.31
AGW13470.81
AGW15271.30
AGW01171.50
AGW01371.34
AGW01671.37
AGW02872.44
AGW04672.34
AGW04772.34
AGW08372.65
AGW00971.59
AGW01771.54
AGW03872.59
AGW04072.55
AGW16572.23 AGW131
71.63
72.0
72.0
0 200 400
Scale in Feet
Base map source: Geomatrix 2003
Boeing AuburnRemedial InvestigationAuburn, Washington
Building 17-07 Shallow ZoneWater Level Contours
October 2010
Figure
Bo
ein
g\R
em
ed
ial I
nve
stig
atio
n R
ep
ort
| V
:\0
25
\16
4\0
70
\07
4\R
I Re
po
rt 2
01
0\0
7-0
8a
-09
a W
L O
ct.d
wg
(A
) "F
igur
e 7
" 11
/19/
2010
Legend
17-68
AGW001R
Current Building and NumberProperty Boundary
Monitoring Well Location, Designation andGroundwater Elevation (ft, msl)71.68
69.2
Groundwater Elevation Contour - Major
Groundwater Contour Interval - Minor
PSP&L R/WUPRR R/W
Notes
1. Water levels measured on September 28th and October 1st.
2. Black and white reproduction of this color original mayreduce its effectiveness and lead to incorrect interpretation.
Perimeter Road
69.0

Bo
un
da
ry B
lvd
10
th S
tre
et S
W
X
XX
X
XX X
X
X
X
X
X
X
X
X
X
X
X
X
X
XX
XXXX
X
X
X
X
X
X
X
X
X
X XX
X
X
X X X X XXXXXXXXXXXXXXXXXXXXXXX
X
X
X X X
X
X
X
X
X
X
X
X
X
X
X
X
X
X
X
X
X
X
X
X
X
X
XX
XX
XX
X X
XXX
XX
XX
X
X X X X X X
X
X X
68.0
68.0
69.0
69.0
70.0
70.0
71.0
71.0
72.0
67.4
67.4
67.6
67.6
67.8
67.8
68.2
68.2
68.4
68.4
68.668.8
68.8
69.269.2
69.269.4
69.6
69.6
69.8
69.8
70.2
70.2
70.4
70.4
70.6
70.6
70.8
70.870.8
71.2
71.4
71.6
71.8
17-275
17-7417-16
17-06
17-04
17-1017-07
17-29
17-34
17-09
17
-12 17-11
17-35
17-15
17-71
17-70
17-14
17-21
17-239
YMCA
17-240
17-234
17-44
15
th S
tre
et S
W
Perimeter Road
JuniorAchievement
AMB Warehouse
Area 1
72.2
69.4
Auburn Facility
71.871.2
68.6
72.2
AGW072 (D)70.26
AGW055R (I)70.51
AGW057R (I)71.34
AGW060R (I)71.29
AGW095R (I)70.34
AGW126 (I)70.19 AGW137 (I)
69.84
AGW140 (I)69.82
AGW141 (I)69.21
AGW139 (I)69.67
AGW151 (I)69.32 AGW162 (I)
68.68
AGW105 (I)72.11
AGW145 (I)71.18
AGW147 (I)69.95
AGW148 (I)69.44
AGW149 (I)69.00
AGW150 (I)68.90
AGW154 (I)72.35
AGW155 (I)71.97
AGW156 (I)71.52
AGW157 (I)70.57
AGW158 (I)70.12
AGW160 (I)68.93
AGW161 (I)68.50
AGW163 (I)71.80
AGW164 (I)72.04
AGW172 (I)68.50 AGW173 (I)
68.06
AGW174 (I)68.03
AGW175 (I)67.18
AGW176 (I)67.39
AGW177 (I)68.84
AGW179 (I)69.05
AGW144 (I)71.35
Milwaukee Avenue N
0 500 1000
Scale in Feet
Base map source: Geomatrix 2003
Boeing AuburnRemedial InvestigationAuburn, Washington
Intermediate ZoneWater Level Contours
October 2010
Figure
Bo
ein
g\R
em
ed
ial I
nve
stig
atio
n R
ep
ort
| V
:\0
25
\16
4\0
70
\07
4\R
I Re
po
rt 2
01
0\0
7-0
8a
-09
a W
L O
ct.d
wg
(A
) "F
igur
e 8
a" 1
1/19
/201
0
Legend
17-68
AGW001R
Current Building and Number
Property Boundary
Monitoring Well Location, Designation andGroundwater Elevation (ft, msl)71.68
69.2
Groundwater Elevation Contour - Major
Groundwater Contour Interval - Minor
69.0
Notes
1. Water levels measured on September 28th and October 1st.
2. Black and white reproduction of this color original mayreduce its effectiveness and lead to incorrect interpretation.
X
XX
X
XX X
X
X
X
X
X
X
X
X
X
X
X
X
X
XX
XXXX
X
X
X
X
X
X
X
X
X
X XX
X
X
X X X X XXXXXXXXXXXXXXXXXXXXXXX
X
X
X X X
X
X
X
X
X
X
X
X
X
X
X
X
X
X
X
X
X
X
X
X
X
X
XX
XX
XX
X X
XXX
XX
XX
X
X X X X X X
X
X X
17-275
17-7417-16
17-29
17-34
17-09
17-240
17-234
17-44
15
th S
tre
et S
W
JuniorAchievementArea 1
Auburn Facility
Milwaukee Avenue N
72.8 72.6 72.4 72.271.8
71.6
71.4
71.2
70.870.6
72.0
71.0
10
th S
tre
et S
W
72.4
72.2
71.871.6
71.471.2
70.870.6
70.470.2
69.869.6
69.4
72.0
71.0
70.0
70.470.2
69.869.6
69.4
70.0
AMB Warehouse
Perimeter Road
YMCA
17-239
17-21
17-14
17-70
17-71
17-35
17-11
17-07
17-04
Bo
un
da
ry B
lvd
72.8
72.6
17-15
17
-12
17-10
17-06
68.8 68.6 68.4 68.2
68.2
69.0
69.2
68.868.6
68.4
69.0
69.2
AGW072 (D)70.93
AGW055R (I)71.15
AGW057R (I)71.91
AGW060R (I)71.91
AGW095R (I)71.00
AGW126 (I)70.88 AGW137 (I)
70.55
AGW140 (I)70.54
AGW141 (I)70.01
AGW139 (I)70.40
AGW151 (I)70.09
AGW162 (I)69.53
AGW105 (I)72.76
AGW145 (I)71.77
AGW147 (I)70.45
AGW148 (I)70.13
AGW149 (I)69.76
AGW150 (I)69.72
AGW154 (I)72.90
AGW155 (I)72.56
AGW156 (I)72.10
AGW157 (I)71.12
AGW158 (I)70.72
AGW160 (I)69.75
AGW161 (I)69.34
AGW163 (I)72.51
AGW164 (I)72.48
AGW172 (I)69.37 AGW173 (I)
69.02
AGW174 (I)68.93
AGW175 (I)68.12
AGW176 (I)68.42
AGW177 (I)69.58
AGW179 (I)69.76
AGW144 (I)72.08
AGW168 (I)70.15
AGW170 (I)70.47
AGW166 (I)70.43
0 500 1000
Scale in Feet
Base map source: Geomatrix 2003
Boeing AuburnRemedial InvestigationAuburn, Washington
Intermediate ZoneWater Level Contours
November 2010
Figure
Bo
ein
g\R
em
ed
ial I
nve
stig
atio
n R
ep
ort
| V
:\0
25
\16
4\0
70
\07
4\R
I Re
po
rt 2
01
0\0
8b
-09
b W
L N
ov.
dw
g (
A)
"Fig
ure
8b"
11/
19/2
010
Legend
17-68
AGW001R
Current Building and Number
Property Boundary
Monitoring Well Location, Designation andGroundwater Elevation (ft, msl)71.68
69.2
Groundwater Elevation Contour - Major
Groundwater Contour Interval - Minor
69.0
Notes
1. Water levels measured on November 8th and 9th.
2. Black and white reproduction of this color original mayreduce its effectiveness and lead to incorrect interpretation.

Bo
un
da
ry B
lvd
10
th S
tre
et S
W
X
XX
X
XX X
X
X
X
X
X
X
X
X
X
X
X
X
X
XX
XXXX
X
X
X
X
X
X
X
X
X
X XX
X
X
X X X X XXXXXXXXXXXXXXXXXXXXXXX
X
X
X X X
X
X
X
X
X
X
X
X
X
X
X
X
X
X
X
X
X
X
X
X
X
X
XX
XX
XX
X X
XXX
XX
XX
X
X X X X X X
X
X X
17-275
17-7417-16
17-06
17-04
17-1017-07
17-29
17-34
17-09
17
-12 17-11
17-35
17-15
17-71
17-70
17-14
17-21
17-239
YMCA
17-240
17-234
17-44
15
th S
tre
et S
W
Perimeter Road
JuniorAchievement
AMB Warehouse
Area 1
Auburn Facility
AGW035 (D)70.66
AGW159 (D)70.19
AGW178 (D)68.93
AGW180 (D)69.14
69.0
70.0
70.0
71.0
71.0
69.2
69.4
69.6
69.6
69.8
70.2
70.270.270.2
70.470.6
70.8
70.8
71.2
71.2
71.4
71.6
70.4
69.2
71.6
AGW098R (D)70.26
AGW138 (D)69.83 AGW142 (D)
69.12
AGW073 (D)70.24
AGW143 (D)71.46
AGW146 (D)71.02
AGW034 (D)71.80
Milwaukee Avenue N
0 500 1000
Scale in Feet
Base map source: Geomatrix 2003
Boeing AuburnRemedial InvestigationAuburn, Washington
Deep ZoneWater Level Contours
October 2010
Figure
Bo
ein
g\R
em
ed
ial I
nve
stig
atio
n R
ep
ort
| V
:\0
25
\16
4\0
70
\07
4\R
I Re
po
rt 2
01
0\0
7-0
8a
-09
a W
L O
ct.d
wg
(A
) "F
igur
e 9
a" 1
1/19
/201
0
Legend
17-68
AGW001R
Current Building and Number
Property Boundary
Monitoring Well Location, Designation andGroundwater Elevation (ft, msl)71.68
69.2
Groundwater Elevation Contour - Major
Groundwater Contour Interval - Minor
69.0
Notes
1. Water levels measured on September 28th and October 1st.
2. Black and white reproduction of this color original mayreduce its effectiveness and lead to incorrect interpretation.

X
XX
X
XX X
X
X
X
X
X
X
X
X
X
X
X
X
X
XX
XXXX
X
X
X
X
X
X
X
X
X
X XX
X
X
X X X X XXXXXXXXXXXXXXXXXXXXXXX
X
X
X X X
X
X
X
X
X
X
X
X
X
X
X
X
X
X
X
X
X
X
X
X
X
X
XX
XX
XX
X X
XXX
XX
XX
X
X X X X X X
X
X X
17-275
17-7417-16
17-29
17-34
17-09
17-240
17-234
17-44
15
th S
tre
et S
W
JuniorAchievementArea 1
Auburn Facility
Milwaukee Avenue N
10
th S
tre
et S
W
AMB Warehouse
Perimeter Road
YMCA
17-239
17-21
17-14
17-70
17-71
17-35
17-11
17-07
17-04
Bo
un
da
ry B
lvd
17-15
17
-12
17-10
17-06
72.2
71.8
71.6
71.4
71.2
71.2
70.8
70.8
70.6
70.6
70.4
70.4
70.2
70.2
69.8
69.8
72.0
71.0
71.0
70.0
70.0
72.2
71.871.6
71.4
AGW035 (D)71.33
AGW159 (D)70.79
AGW178 (D)69.67
AGW180 (D)69.89
AGW098R (D)70.94
AGW138 (D)70.48
AGW142 (D)69.91
AGW073 (D)70.91
AGW143 (D)71.82
AGW146 (D)71.58
AGW034 (D)72.41
AGW169 (D)70.27
AGW171 (D)70.39
AGW167 (D)70.70
72.0
0 500 1000
Scale in Feet
Base map source: Geomatrix 2003
Boeing AuburnRemedial InvestigationAuburn, Washington
Deep ZoneWater Level Contours
November 2010
Figure
Bo
ein
g\R
em
ed
ial I
nve
stig
atio
n R
ep
ort
| V
:\0
25
\16
4\0
70
\07
4\R
I Re
po
rt 2
01
0\0
8b
-09
b W
L N
ov.
dw
g (
A)
"Fig
ure
9b"
11/
19/2
010
Legend
17-68
AGW001R
Current Building and Number
Property Boundary
Monitoring Well Location, Designation andGroundwater Elevation (ft, msl)71.68
69.2
Groundwater Elevation Contour - Major
Groundwater Contour Interval - Minor
69.0
Notes
1. Water levels measured on November 8th and 9th.
2. Black and white reproduction of this color original mayreduce its effectiveness and lead to incorrect interpretation.

X
XX
X
XX X
X
X
X
X
X
X
X
X
X
X
X
X
X
XX
XXXX
X
X
X
X
X
X
X
X
X
X XX
X
X
X X X X XXXXXXXXXXXXXXXXXXXXXXX
X
XX X X
X
X
X
X
X
X
X
X
X
X
X
X
X
X
X
X
X
X
X
X
X
X
XX
XX
XX
X XX
XX
XX
XX
X
X X X X X X
X
X X
17-275
17-7417-16
17-06
17-04
17-10
17-07
17-29
17-34
17-09
17
-12 17-11
17-35
17-15
17-71
17-70
17-14
17-21
17-239
YMCA
17-240
17-234
17-44
15
th S
tre
et S
W
Perimeter Road
JuniorAchievement
AMB Warehouse
Area 1
AGW110R
AGW001R
AGW002R
AGW006R
AGW031R
AGW053R
AGW058R
AGW059R
AGW066
AGW067
AGW106R AGW112RAGW125
AGW136
AGW072 (I)
AGW055R (I)
AGW057R (I)
AGW060R (I)
AGW095R (I)
AGW126 (I)
AGW137 (I)
AGW140 (I)
AGW141 (I)
AGW139 (I)
AGW151 (I)
AGW162 (I)
AGW035 (D)
AGW034 (D)
AGW098R (D)
AGW138 (D)AGW142 (D)
AGW073 (D)
AGW143 (D)
AGW146 (D) AGW159 (D)
AGW105 (I) AGW144 (I)
AGW145 (I)
AGW147 (I)
AGW148 (I)
AGW149 (I)
AGW150 (I)
AGW154 (I)
AGW155 (I)
AGW156 (I)
AGW157 (I)
AGW158 (I)
AGW160 (I)
AGW161 (I)
AGW048AGW049AGW050
AGW010
AGW015
AGW024
AGW025AGW026
AGW027
AGW029
AGW030
AGW032
AGW037
AGW039
AGW079
AGW134
AGW152
AGW011
AGW013
AGW016
AGW028
AGW046
AGW047
AGW083
AGW009
AGW017
AGW038
AGW040
AGW131
Bo
un
da
ry B
lvd
10
th S
tre
et S
W
Notes
1. All results shown in µg/L. Screeninglevels are as follows:
1,1-DCE 7.01,1-DCA 1600Cis-1,2-DCE 70TCE 0.49VC 0.029
2. ND = Compound Not Detected atIndicated Reporting Limit.
3. BHS = Borehole Sample.
4. "Max" concentration: For wells withnon-detect data, the lowest recordeddetection limit is used as the maximumhistorical concentration.
5. Black and white reproduction of this colororiginal may reduce its effectiveness andlead to incorrect interpretation .
0 500 1000
Scale in Feet
Base map source: Geomatrix 2003
Boeing AuburnRemedial InvestigationAuburn, Washington
New Well VOC ConcentrationsMost Recent
Figure
Bo
ein
g\R
em
ed
ial I
nve
stig
atio
n R
ep
ort
| V
:\0
25
\16
4\0
70
\07
4\R
I Re
po
rt 2
01
0\1
0 2
01
0 V
OC
s.d
wg
(A
) "F
igur
e 1
0" 1
1/19
/201
0
AGW163 (I)Constituent1,1-DCE1,1-DCACis-1,2-DCETCEVC
Date9/15/20109/15/20109/15/20109/15/20109/15/2010
<0.2<0.213.30.039
AGW164 (I)Constituent1,1-DCE1,1-DCACis-1,2-DCETCEVC
Date9/15/20109/15/20109/15/20109/15/20109/15/2010
<0.2<0.20.61.40.54
AGW165 (I)Constituent1,1-DCE1,1-DCACis-1,2-DCETCEVC
Date9/15/20109/15/20109/15/20109/15/20109/15/2010
<0.2<0.20.91.90.09
AGW172 (I)Constituent1,1-DCE1,1-DCACis-1,2-DCETCEVC
Date9/16/20109/16/20109/16/20109/16/20109/16/2010
<0.2<0.20.33.4<0.02
AGW173 (I)Constituent1,1-DCE1,1-DCACis-1,2-DCETCEVC
Date10/6/201010/6/201010/6/201010/6/201010/6/2010
<0.2<0.2<0.2<0.2<0.02
AGW174 (I)Constituent1,1-DCE1,1-DCACis-1,2-DCETCEVC
Date9/15/20109/15/20109/15/20109/15/20109/15/2010
<0.2<0.2<0.23.6<0.02
AGW175 (I)Constituent1,1-DCE1,1-DCACis-1,2-DCETCEVC
Date9/15/20109/15/20109/15/20109/15/20109/15/2010
<0.2<0.20.63.4<0.02
AGW176 (I)Constituent1,1-DCE1,1-DCACis-1,2-DCETCEVC
Date10/6/201010/6/201010/6/201010/6/201010/6/2010
<0.2<0.20.65.4<0.02
AGW177 (I)Constituent1,1-DCE1,1-DCACis-1,2-DCETCEVC
Date9/29/20109/29/20109/29/20109/29/20109/29/2010
<0.2<0.21.25.20.053
AGW178 (D)Constituent1,1-DCE1,1-DCACis-1,2-DCETCEVC
Date9/29/20109/29/20109/29/20109/29/20109/29/2010
<0.2<0.20.94.50.088
AGW179 (I)Constituent1,1-DCE1,1-DCACis-1,2-DCETCEVC
Date9/29/20109/29/20109/29/20109/29/20109/29/2010
0.30.67.21.20.1
AGW180 (D)Constituent1,1-DCE1,1-DCACis-1,2-DCETCEVC
Date9/29/20109/29/20109/29/20109/29/20109/29/2010
<0.20.30.95.1<0.02
AGW179 (I) (30ft-BHS)Constituent1,1-DCE1,1-DCACis-1,2-DCETCEVC
Date9/22/20109/22/20109/22/20109/22/20109/22/2010
<0.20.56.5<0.20.093
AGW177 (I) (29ft-BHS)Constituent1,1-DCE1,1-DCACis-1,2-DCETCEVC
Date9/21/20109/21/20109/21/20109/21/20109/21/2010
0.30.56.48.62
AGW174 (I) (59ft-BHS)Constituent1,1-DCE1,1-DCACis-1,2-DCETCEVC
Date8/23/20108/23/20108/23/20108/23/20108/23/2010
<0.2<0.2<0.21.1<0.2
AGW173 (I) (50ft-BHS)Constituent1,1-DCE1,1-DCACis-1,2-DCETCEVC
Date9/1/20109/1/20109/1/20109/1/20109/1/2010
<0.2<0.2<0.20.7<0.2
AGW165 (I) (55ft-BHS)Constituent1,1-DCE1,1-DCACis-1,2-DCETCEVC
Date8/25/20108/25/20108/25/20108/25/20108/25/2010
<0.2<0.20.20.60.4
AGW164 (I) (29ft-BHS)Constituent1,1-DCE1,1-DCACis-1,2-DCETCEVC
Date8/24/20108/24/20108/24/20108/24/20108/24/2010
<0.2<0.23.90.96.1
AGW163 (I) (28ft-BHS)Constituent1,1-DCE1,1-DCACis-1,2-DCETCEVC
Date8/26/20108/26/20108/26/20108/26/20108/26/2010
<0.2<0.2<0.20.8<0.02
AGW167 (D)Constituent1,1-DCE1,1-DCACis-1,2-DCETCEVC
Date11/08/201011/08/201011/08/201011/08/201011/08/2010
<0.2<0.22.43.60.3
AGW166 (I) (30ft-BHS)Constituent1,1-DCE1,1-DCACis-1,2-DCETCEVC
Date10/26/201010/26/201010/26/201010/26/201010/26/2010
<0.2<0.22.53.40.6
AGW166 (I)Constituent1,1-DCE1,1-DCACis-1,2-DCETCEVC
Date11/08/201011/08/201011/08/201011/08/201011/08/2010
<0.2<0.2<0.2<0.2<0.2
AGW168 (I)Constituent1,1-DCE1,1-DCACis-1,2-DCETCEVC
Date11/08/201011/08/201011/08/201011/08/201011/08/2010
<0.2<0.21.84.00.2
AGW169 (D)Constituent1,1-DCE1,1-DCACis-1,2-DCETCEVC
Date11/08/201011/08/201011/08/201011/08/201011/08/2010
<0.2<0.22.05.10.2
AGW168 (I) (29ft-BHS)Constituent1,1-DCE1,1-DCACis-1,2-DCETCEVC
Date10/28/201010/28/201010/28/201010/28/201010/28/2010
<0.2<0.21.23.00.076
AGW171 (D)Constituent1,1-DCE1,1-DCACis-1,2-DCETCEVC
Date11/08/201011/08/201011/08/201011/08/201011/08/2010
<0.2<0.20.32.1<0.2
AGW170 (I) (28.5ft-BHS)Constituent1,1-DCE1,1-DCACis-1,2-DCETCEVC
Date11/01/201011/01/201011/01/201011/01/201011/01/2010
0.20.31.93.60.069
AGW170 (I)Constituent1,1-DCE1,1-DCACis-1,2-DCETCEVC
Date11/08/201011/08/201011/08/201011/08/201011/08/2010
<0.2<0.21.03.6<0.2
TCE Detection = 3 < 5 g/LTCE Detection = 1 < 3 g/L
Current Building and Number
Property Boundary
Legend
17-68
TCE Detection = < 1 g/L
Monitoring Well LocationAGW026
(Color codes apply to most recent data only)
TCE Detection = 5 g/L

X
X
X
X
X X
X
XX
X
XX
XX
XX
X X X X X X X
X
X
X
X
X
X
X
X
X
X
X
X
X
XX
X
XX
X
X
X X X X X X
X
X
X
X
X
X
X
X
X
X
X
X
X
X
XX
XX
XX
X
XX
X
X X X
XX
XX
X
XX
X
X
XX
XX
XXXX
XX
X
X
X X
XX
X
X
X X X X X X X X
X
X
X
X
X
X
X
X
X
X
X
X
X
X
X
X
X
X
X
X
X X
X X
X
S-13aFormer TCEDegreaser
Perimeter Road
AGW007
PSP&L R/WUPRR R/W
17-06
17-10
17-07
17
-12
17-11
17
-35
17-15
17-71
17-70
17-21
17-44
0 200 400
Scale in Feet
Base map source: Geomatrix 2003
Boeing AuburnRemedial InvestigationAuburn, Washington
Building 17-07 Shallow ZoneTCE Concentrations
Maximum and Most Recent
Figure
Bo
ein
g\R
em
ed
ial I
nve
stig
atio
n R
ep
ort
| V
:\0
25
\16
4\0
70
\07
4\R
I Re
po
rt 2
01
0\1
1-1
3 1
7-0
7 V
OC
s.d
wg
(A
) "F
igur
e 1
1" 1
1/19
/201
0
Notes
1. All concentrations shown in µg/L, thescreening level for TCE is 0.49 µg/L.
2. ND = Compound Not Detected atIndicated Reporting Limit.
3. BHS = Borehole Sample.
4. "Max" concentration: For wells withnon-detect data, the lowest recordeddetection limit is used as themaximum historical concentration.
5. Black and white reproduction of thiscolor original may reduce itseffectiveness and lead to incorrectinterpretation.
AGW010ConstituentTCE
Max7.01
Max Date2/15/1994
Last<2.0
Last Date6/10/2010
AGW011ConstituentTCE
Max<1
Max Date3/20/1997
Last<1
Last Date3/20/1997
AGW013ConstituentTCE
Max1.33
Max Date2/16/1994
Last<1
Last Date3/21/1997
AGW015ConstituentTCE
Max1.5
Max Date3/24/1995
Last<0.2
Last Date6/9/2009
AGW016ConstituentTCE
Max<0.2
Max Date2/16/1999
Last<1
Last Date3/13/2000
AGW017ConstituentTCE
Max9.25
Max Date2/15/1994
Last1.3
Last Date6/9/2009
AGW024ConstituentTCE
Max<0.2
Max Date6/3/2010
Last<0.2
Last Date6/3/2010
AGW026ConstituentTCE
Max4.4
Max Date9/19/1992
Last0.7
Last Date6/2/2010
AGW027ConstituentTCE
Max3.7
Max Date11/24/1992
Last<0.2
Last Date6/2/2010
AGW030ConstituentTCE
Max<0.2
Max Date12/7/2009
Last<0.2
Last Date12/7/2009
AGW032ConstituentTCE
Max0.7
Max Date9/9/1997
Last<0.2
Last Date6/2/2010
AGW037ConstituentTCE
Max5.3
Max Date12/13/1996
Last3.2
Last Date6/10/2010
AGW038ConstituentTCE
Max3
Max Date2/22/1999
Last0.6
Last Date6/10/2009
AGW039ConstituentTCE
Max2
Max Date12/13/1996
Last1.4
Last Date12/11/2009
AGW040ConstituentTCE
Max4
Max Date12/13/1996
Last2.0
Last Date6/10/2009
AGW046ConstituentTCE
Max2.9
Max Date12/13/1996
Last1.2
Last Date9/29/2010
AGW047ConstituentTCE
Max3.3
Max Date3/19/1997
Last1
Last Date9/29/2010
AGW048ConstituentTCE
Max4.9
Max Date3/19/1997
Last1.1
Last Date9/29/2010
AGW049ConstituentTCE
Max1.6
Max Date9/29/2010
Last1.6
Last Date9/29/2010
AGW050ConstituentTCE
Max3.2
Max Date3/19/1997
Last1.1
Last Date9/29/2010
AGW079ConstituentTCE
Max<0.2
Max Date6/3/2010
Last<0.2
Last Date6/3/2010
AGW083ConstituentTCE
Max<0.2
Max Date5/21/2003
Last<0.2
Last Date11/30/2004
AGW131ConstituentTCE
Max0.7
Max Date10/1/2008
Last0.2
Last Date6/2/2010
AGW134ConstituentTCE
Max<0.2
Max Date6/3/2010
Last<0.2
Last Date6/3/2010
AGW152ConstituentTCE
Max<0.2
Max Date6/2/2010
Last<0.2
Last Date6/2/2010
AGW165ConstituentTCE
Max1.9
Max Date9/15/2010
Last1.9
Last Date9/15/2010
AGW028ConstituentTCE
Max3.1
Max Date6/20/1996
Last1.2
Last Date9/29/2010
AGW029ConstituentTCE
Max<0.2
Max Date6/3/2010
Last<0.2
Last Date6/3/2010
AGW009ConstituentTCE
Max9.3
Max Date8/31/1990
Last<2.0
Last Date6/10/2010
AGW163 (I) (28ft-BHS)ConstituentTCE
Max0.8
Max Date8/26/2010
Last0.8
Last Date8/26/2010
AGW164 (I) (29ft-BHS)ConstituentTCE
Max0.9
Max Date8/24/2010
Last0.9
Last Date8/24/2010
AGW025ConstituentTCE
Max0.2
Max Date6/3/2008
Last<0.2
Last Date6/2/2010
ASB0162<0.2 8/31/2004
<0.2 8/31/2004
ASB0157
ASB0161
<0.2 8/24/2004
ASB0145<0.2 5/4/2004
ASB0143<0.2 5/4/2004
ASB0144<0.2 5/4/2004
ASB0148<0.2 5/5/2004
ASB0147<0.2 5/5/2004
ASB0146<0.2 5/5/2004
ASB0135<0.2 3/22/2004
ASB0140<0.2 3/22/2004
ASB0138<0.2 3/22/2004
ASB0139<0.2 3/22/2004
ASB0141<0.2 5/4/2004
ASB0142<0.2 5/4/2004
ASB0136<0.2 3/22/2004
ASB0137<0.2 3/22/2004
TCE Detection = > 5 g/LTCE Detection = 3 < 5 g/LTCE Detection = 1 < 3 g/L
Current Building and Number
Property Boundary
Legend
17-68
TCE Detection = < 1 g/L
Monitoring Well Location
Soil Boring Location
AGW026
ASB0135<2 3/22/2004 Most Recent Sample Result & Date
(Color codes apply to most recent data only)
Solid Waste Management Unit (SWMU)S-13a
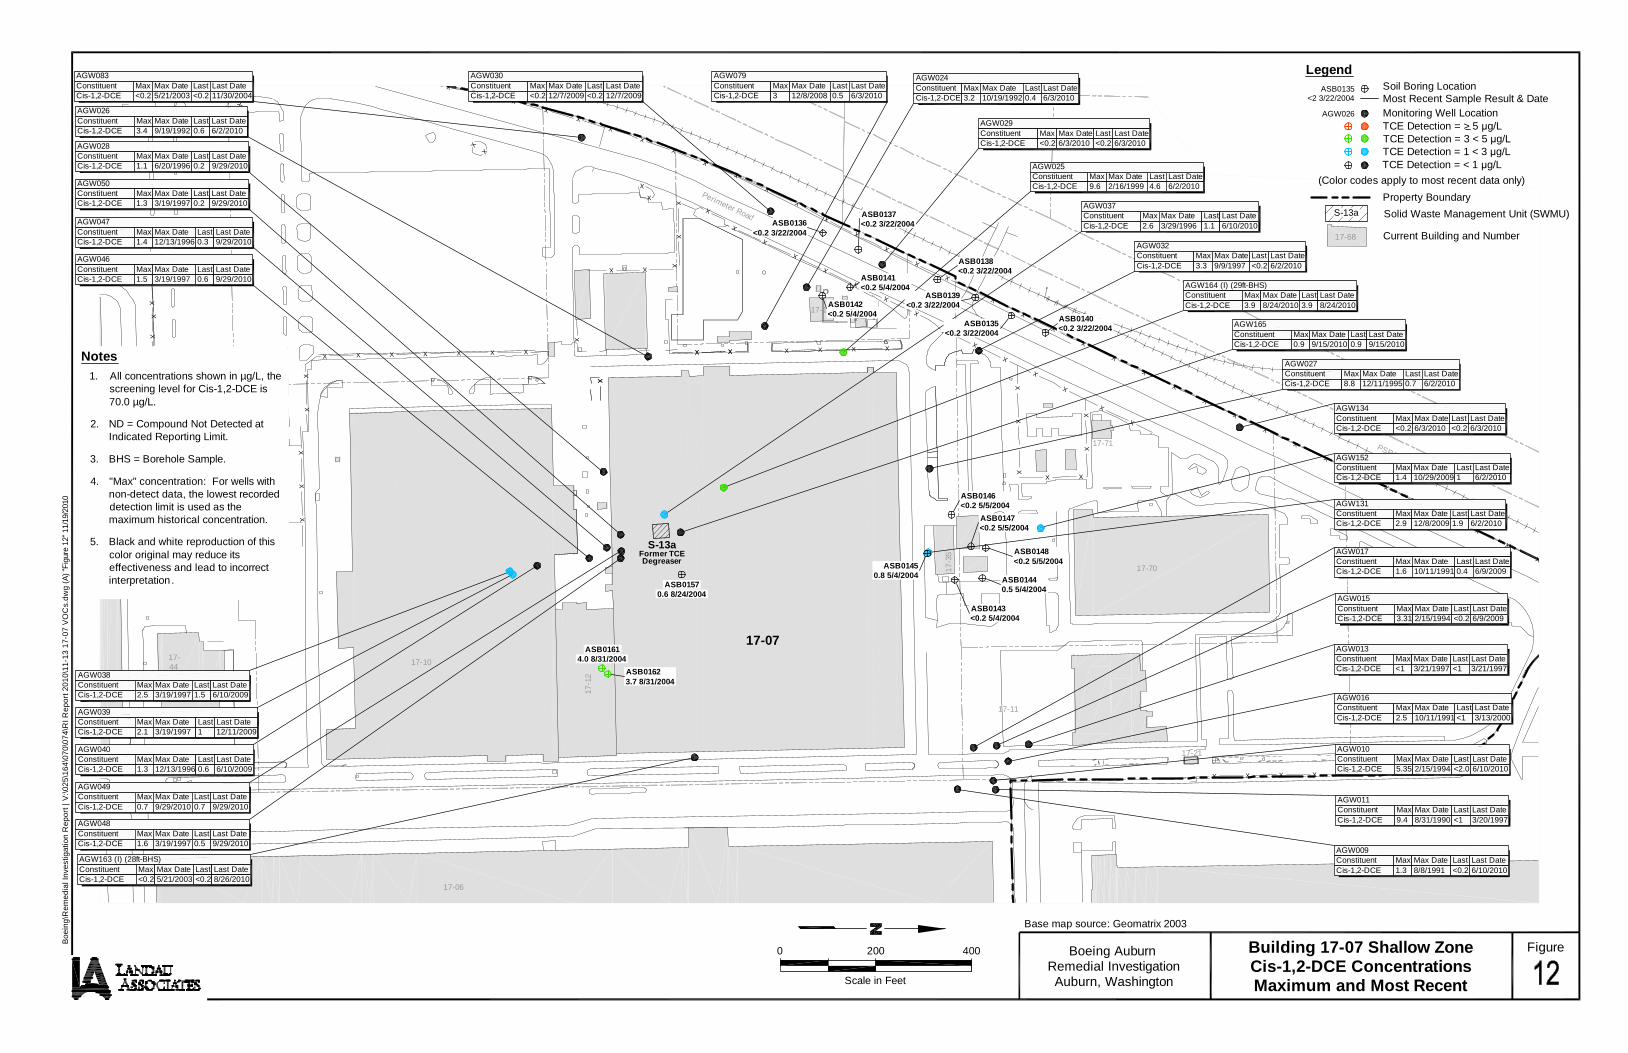
X
X
X
X
X X
X
XX
X
XX
XX
XX
X X X X X X X
X
X
X
X
X
X
X
X
X
X
X
X
X
XX
X
XX
X
X
X X X X X X
X
X
X
X
X
X
X
X
X
X
X
X
X
X
XX
X
XX
X
XX
X
X X X
XX
XX
X
XX
X
X
XX
XX
XXXX
XX
X
X
X X
XX
X
X
X X X X X X X X
X
X
X
X
X
X
X
X
X
X
X
X
X
X
X
X
X
X
X
X
X X
X X
X
S-13aFormer TCEDegreaser
Perimeter Road
AGW007
PSP&L R/WUPRR R/W
17-06
17-10
17-07
17
-12
17-11
17
-35
17-15
17-71
17-70
17-21
17-44
0 200 400
Scale in Feet
Base map source: Geomatrix 2003
Boeing AuburnRemedial InvestigationAuburn, Washington
Building 17-07 Shallow ZoneCis-1,2-DCE ConcentrationsMaximum and Most Recent
Figure
Bo
ein
g\R
em
ed
ial I
nve
stig
atio
n R
ep
ort
| V
:\0
25
\16
4\0
70
\07
4\R
I Re
po
rt 2
01
0\1
1-1
3 1
7-0
7 V
OC
s.d
wg
(A
) "F
igur
e 1
2" 1
1/19
/201
0
AGW010ConstituentCis-1,2-DCE
Max5.35
Max Date2/15/1994
Last<2.0
Last Date6/10/2010
AGW011ConstituentCis-1,2-DCE
Max9.4
Max Date8/31/1990
Last<1
Last Date3/20/1997
AGW013ConstituentCis-1,2-DCE
Max<1
Max Date3/21/1997
Last<1
Last Date3/21/1997
AGW015ConstituentCis-1,2-DCE
Max3.31
Max Date2/15/1994
Last<0.2
Last Date6/9/2009
AGW016ConstituentCis-1,2-DCE
Max2.5
Max Date10/11/1991
Last<1
Last Date3/13/2000
AGW017ConstituentCis-1,2-DCE
Max1.6
Max Date10/11/1991
Last0.4
Last Date6/9/2009
AGW026ConstituentCis-1,2-DCE
Max3.4
Max Date9/19/1992
Last0.6
Last Date6/2/2010
AGW027ConstituentCis-1,2-DCE
Max8.8
Max Date12/11/1995
Last0.7
Last Date6/2/2010
AGW030ConstituentCis-1,2-DCE
Max<0.2
Max Date12/7/2009
Last<0.2
Last Date12/7/2009
AGW032ConstituentCis-1,2-DCE
Max3.3
Max Date9/9/1997
Last<0.2
Last Date6/2/2010
AGW037ConstituentCis-1,2-DCE
Max2.6
Max Date3/29/1996
Last1.1
Last Date6/10/2010
AGW038ConstituentCis-1,2-DCE
Max2.5
Max Date3/19/1997
Last1.5
Last Date6/10/2009
AGW039ConstituentCis-1,2-DCE
Max2.1
Max Date3/19/1997
Last1
Last Date12/11/2009
AGW040ConstituentCis-1,2-DCE
Max1.3
Max Date12/13/1996
Last0.6
Last Date6/10/2009
AGW046ConstituentCis-1,2-DCE
Max1.5
Max Date3/19/1997
Last0.6
Last Date9/29/2010
AGW048ConstituentCis-1,2-DCE
Max1.6
Max Date3/19/1997
Last0.5
Last Date9/29/2010
AGW049ConstituentCis-1,2-DCE
Max0.7
Max Date9/29/2010
Last0.7
Last Date9/29/2010
AGW050ConstituentCis-1,2-DCE
Max1.3
Max Date3/19/1997
Last0.2
Last Date9/29/2010
AGW079ConstituentCis-1,2-DCE
Max3
Max Date12/8/2008
Last0.5
Last Date6/3/2010
AGW083ConstituentCis-1,2-DCE
Max<0.2
Max Date5/21/2003
Last<0.2
Last Date11/30/2004
AGW131ConstituentCis-1,2-DCE
Max2.9
Max Date12/8/2009
Last1.9
Last Date6/2/2010
AGW134ConstituentCis-1,2-DCE
Max<0.2
Max Date6/3/2010
Last<0.2
Last Date6/3/2010
AGW165ConstituentCis-1,2-DCE
Max0.9
Max Date9/15/2010
Last0.9
Last Date9/15/2010
AGW028ConstituentCis-1,2-DCE
Max1.1
Max Date6/20/1996
Last0.2
Last Date9/29/2010
AGW029ConstituentCis-1,2-DCE
Max<0.2
Max Date6/3/2010
Last<0.2
Last Date6/3/2010
AGW009ConstituentCis-1,2-DCE
Max1.3
Max Date8/8/1991
Last<0.2
Last Date6/10/2010
AGW163 (I) (28ft-BHS)ConstituentCis-1,2-DCE
Max<0.2
Max Date5/21/2003
Last<0.2
Last Date8/26/2010
AGW164 (I) (29ft-BHS)ConstituentCis-1,2-DCE
Max3.9
Max Date8/24/2010
Last3.9
Last Date8/24/2010
AGW047ConstituentCis-1,2-DCE
Max1.4
Max Date12/13/1996
Last0.3
Last Date9/29/2010
AGW024ConstituentCis-1,2-DCE
Max3.2
Max Date10/19/1992
Last0.4
Last Date6/3/2010
AGW152ConstituentCis-1,2-DCE
Max1.4
Max Date10/29/2009
Last1
Last Date6/2/2010
Notes
1. All concentrations shown in µg/L, thescreening level for Cis-1,2-DCE is70.0 µg/L.
2. ND = Compound Not Detected atIndicated Reporting Limit.
3. BHS = Borehole Sample.
4. "Max" concentration: For wells withnon-detect data, the lowest recordeddetection limit is used as themaximum historical concentration.
5. Black and white reproduction of thiscolor original may reduce itseffectiveness and lead to incorrectinterpretation.
AGW025ConstituentCis-1,2-DCE
Max9.6
Max Date2/16/1999
Last4.6
Last Date6/2/2010
ASB0136<0.2 3/22/2004
ASB0137<0.2 3/22/2004
ASB0142<0.2 5/4/2004
ASB0141<0.2 5/4/2004
ASB0139<0.2 3/22/2004
ASB0138<0.2 3/22/2004
ASB0140<0.2 3/22/2004
ASB0135<0.2 3/22/2004
ASB0146<0.2 5/5/2004
ASB0147<0.2 5/5/2004
ASB0148<0.2 5/5/2004
ASB01440.5 5/4/2004
ASB0143<0.2 5/4/2004
ASB01450.8 5/4/2004
ASB01623.7 8/31/2004
4.0 8/31/2004ASB0161
0.6 8/24/2004ASB0157
TCE Detection = > 5 g/LTCE Detection = 3 < 5 g/LTCE Detection = 1 < 3 g/L
Current Building and Number
Property Boundary
Legend
17-68
TCE Detection = < 1 g/L
Monitoring Well Location
Soil Boring Location
AGW026
ASB0135<2 3/22/2004 Most Recent Sample Result & Date
(Color codes apply to most recent data only)
Solid Waste Management Unit (SWMU)S-13a

X
X
X
X
X X
X
XX
X
XX
XX
XX
X X X X X X X
X
X
X
X
X
X
X
X
X
X
X
X
X
XX
X
XX
X
X
X X X X X X
X
X
X
X
X
X
X
X
X
X
X
X
X
X
XX
X
XX
X
XX
X
X X X
XX
XX
X
XX
X
X
XX
XX
XXXX
XX
X
X
X X
XX
X
X
X X X X X X X X
X
X
X
X
X
X
X
X
X
X
X
X
X
X
X
X
X
X
X
X
X X
X X
X
S-13aFormer TCEDegreaser
Perimeter Road
AGW007
PSP&L R/WUPRR R/W
17-06
17-10
17-07
17
-12
17-11
17
-35
17-15
17-71
17-70
17-21
17-44
0 200 400
Scale in Feet
Base map source: Geomatrix 2003
Boeing AuburnRemedial InvestigationAuburn, Washington
Building 17-07 Shallow ZoneVinyl Chloride Concentrations
Maximum and Most Recent
Figure
Bo
ein
g\R
em
ed
ial I
nve
stig
atio
n R
ep
ort
| V
:\0
25
\16
4\0
70
\07
4\R
I Re
po
rt 2
01
0\1
1-1
3 1
7-0
7 V
OC
s.d
wg
(A
) "F
igur
e 1
3" 1
1/19
/201
0
AGW010ConstituentVC
Max<0.02
Max Date5/24/2005
Last<0.02
Last Date6/10/2010
AGW011ConstituentVC
Max<2
Max Date3/20/1997
Last<2
Last Date3/20/1997
AGW013ConstituentVC
Max<2
Max Date3/21/1997
Last<2
Last Date3/21/1997
AGW015ConstituentVC
Max<0.02
Max Date5/24/2005
Last<0.02
Last Date6/9/2009
AGW016ConstituentVC
Max<0.2
Max Date2/16/1999
Last<1
Last Date3/13/2000
AGW017ConstituentVC
Max<0.02
Max Date6/9/2009
Last<0.02
Last Date6/9/2009
AGW024ConstituentVC
Max9.5
Max Date9/2/1998
Last0.58
Last Date6/3/2010
AGW026ConstituentVC
Max0.14
Max Date12/8/2008
Last0.027
Last Date6/2/2010
AGW027ConstituentVC
Max4.3
Max Date12/11/1995
Last0.18
Last Date6/2/2010
AGW030ConstituentVC
Max0.4
Max Date11/2/2001
Last<0.02
Last Date12/7/2009
AGW032ConstituentVC
Max5.2
Max Date8/30/1999
Last0.045
Last Date6/2/2010
AGW037ConstituentVC
Max0.13
Max Date12/15/2008
Last<0.02
Last Date6/10/2010
AGW038ConstituentVC
Max0.052
Max Date6/10/2009
Last0.052
Last Date6/10/2009
AGW039ConstituentVC
Max0.06
Max Date6/10/2009
Last0.03
Last Date12/11/2009
AGW040ConstituentVC
Max0.039
Max Date6/10/2009
Last0.039
Last Date6/10/2009
AGW049ConstituentVC
Max<0.02
Max Date9/29/2010
Last<0.02
Last Date9/29/2010
AGW079ConstituentVC
Max2.1
Max Date6/2/2009
Last1.9
Last Date6/3/2010
AGW083ConstituentVC
Max<0.02
Max Date11/30/2004
Last<0.02
Last Date11/30/2004
AGW131ConstituentVC
Max7.5
Max Date12/8/2009
Last4
Last Date6/2/2010
AGW134ConstituentVC
Max0.28
Max Date6/3/2009
Last<0.02
Last Date6/3/2010
AGW152ConstituentVC
Max6.8
Max Date12/8/2009
Last5.5
Last Date6/2/2010
AGW165ConstituentVC
Max0.4
Max Date8/25/2010
Last0.09
Last Date9/15/2010
AGW028ConstituentVC
Max<0.02
Max Date9/29/2010
Last<0.02
Last Date9/29/2010
AGW029ConstituentVC
Max0.5
Max Date12/5/2005
Last<0.02
Last Date6/3/2010
AGW009ConstituentVC
Max<0.02
Max Date6/10/2010
Last<0.02
Last Date6/10/2010
AGW164 (I) (29ft-BHS)ConstituentVC
Max6.1
Max Date8/24/2010
Last6.1
Last Date8/24/2010
AGW050ConstituentVC
Max<0.02
Max Date9/29/2010
Last<0.02
Last Date9/29/2010
AGW047ConstituentVC
Max<0.02
Max Date9/29/2010
Last<0.02
Last Date9/29/2010
AGW046ConstituentVC
Max<0.02
Max Date9/29/2010
Last<0.02
Last Date9/29/2010
AGW048ConstituentVC
Max<0.02
Max Date9/29/2010
Last<0.02
Last Date9/29/2010
AGW163 (I) (28ft-BHS)ConstituentVC
Max<0.02
Max Date8/26/2010
Last<0.02
Last Date8/26/2010
Notes
1. All concentrations shown in µg/L, thescreening level for Vinyl Chloride is0.029 µg/L.
2. ND = Compound Not Detected atIndicated Reporting Limit.
3. BHS = Borehole Sample.
4. "Max" concentration: For wells withnon-detect data, the lowest recordeddetection limit is used as themaximum historical concentration.
5. Black and white reproduction of thiscolor original may reduce itseffectiveness and lead to incorrectinterpretation.
AGW025ConstituentVC
Max9
Max Date10/19/1992
Last2.6
Last Date6/2/2010
ASB01360.083 3/22/2004
ASB0137<0.02 3/22/2004
ASB01420.4 5/4/2004
ASB0141<0.02 5/4/2004
ASB0139<0.02 3/22/2004
ASB0138<0.02 3/22/2004
ASB0140<0.02 3/22/2004
ASB0135<0.02 3/22/2004
ASB0146<0.02 5/5/2004
ASB01470.18 5/5/2004
ASB01484.7 5/5/2004
ASB01443.7 5/4/2004
ASB01430.75 5/4/2004
ASB01455.5 5/4/2004
ASB01620.15 8/31/2004
0.13 8/31/2004ASB0161
0.94 8/24/2004ASB0157
TCE Detection = > 5 g/LTCE Detection = 3 < 5 g/LTCE Detection = 1 < 3 g/L
Current Building and Number
Property Boundary
Legend
17-68
TCE Detection = < 1 g/L
Monitoring Well Location
Soil Boring Location
AGW026
ASB0135<2 3/22/2004 Most Recent Sample Result & Date
(Color codes apply to most recent data only)
Solid Waste Management Unit (SWMU)S-13a

X
X
X
X
X X
X
XX
X
XX
XX
XX
X X X X X X X
X
X
X
X
X
X
X
X
X
X
X
X
X
XX
X
XX
X
X
X X X X X X
X
X
X
X
X
X
X
X
X
X
X
X
X
XX
XX
X
XX
X
XX
X
X X X
XX
XX
X
XX
X
X
XX
XX
XXXX
XX
X
X
X X
XX
X
X
X X X X X X X X
X
X
X
X
X
X
X
X
X
X
X
X
X
X
X
X
X
X
X
X
X X
X X
X
17-06
17-10
17
-12
17-11
17-35
17-15
17-71
17-70
17-21
17-44
Perimeter Road
S-13aFormer TCEDegreaser
17-07
0 200 400
Scale in Feet
Base map source: Geomatrix 2003
Boeing AuburnRemedial InvestigationAuburn, Washington
Building 17-07 Shallow Zone1,1-DCE Concentrations: Maximum
and Most Recent
Figure
Bo
ein
g\R
em
ed
ial I
nve
stig
atio
n R
ep
ort
| V
:\0
25
\16
4\0
70
\07
4\R
I Re
po
rt 2
01
0\1
4-1
5 1
7-0
7.d
wg
(A
) "F
igur
e 1
4" 1
1/9/
2010
AGW010Constituent1,1-DCE
Max<0.02
Max Date6/9/2009
Last<0.02
Last Date6/9/2009
AGW011Constituent1,1-DCE
Max<1
Max Date3/20/1997
Last<1
Last Date3/20/1997
AGW013Constituent1,1-DCE
Max<1
Max Date3/21/1997
Last<1
Last Date3/21/1997
AGW015Constituent1,1-DCE
Max<0.02
Max Date6/2/2009
Last<0.2
Last Date6/9/2009
AGW016Constituent1,1-DCE
Max<0.2
Max Date2/16/1999
Last<1
Last Date3/12/2000
AGW017Constituent1,1-DCE
Max<0.02
Max Date6/9/2009
Last<0.02
Last Date6/9/2009
AGW024Constituent1,1-DCE
Max0.044
Max Date12/10/2008
Last<0.2
Last Date6/3/2010
AGW026Constituent1,1-DCE
Max0.036
Max Date12/8/2008
Last<0.2
Last Date6/2/2010
AGW027Constituent1,1-DCE
Max0.027
Max Date12/5/2006
Last<0.2
Last Date6/2/2010
AGW030Constituent1,1-DCE
Max<0.02
Max Date6/2/2009
Last<0.2
Last Date12/7/2009
AGW032Constituent1,1-DCE
Max0.027
Max Date12/10/2007
Last<0.2
Last Date6/2/2010
AGW037Constituent1,1-DCE
Max0.068
Max Date12/15/2008
Last<0.2
Last Date6/2/2010
AGW038Constituent1,1-DCE
Max0.061
Max Date6/10/2009
Last0.061
Last Date6/10/2009
AGW039Constituent1,1-DCE
Max0.11
Max Date12/15/2008
Last<0.2
Last Date12/11/2009
AGW040Constituent1,1-DCE
Max0.094
Max Date12/15/2008
Last0.078
Last Date6/10/2009
AGW049Constituent1,1-DCE
Max<0.02
Max Date9/29/2010
Last<0.02
Last Date9/29/2010
AGW079Constituent1,1-DCE
Max0.034
Max Date12/8/2008
Last<0.2
Last Date12/11/2009
AGW083Constituent1,1-DCE
Max<0.02
Max Date11/30/2004
Last<0.02
Last Date11/30/2004
AGW131Constituent1,1-DCE
Max0.13
Max Date12/4/2008
Last0.072
Last Date6/2/2009
AGW134Constituent1,1-DCE
Max<0.02
Max Date6/3/2009
Last<0.02
Last Date6/3/2009
AGW152Constituent1,1-DCE
Max0.025
Max Date10/29/2009
Last<0.2
Last Date6/2/2010
AGW165Constituent1,1-DCE
Max<0.02
Max Date9/15/2010
Last<0.02
Last Date9/15/2010
AGW028Constituent1,1-DCE
Max<0.02
Max Date9/29/2010
Last<0.02
Last Date9/29/2010
AGW029Constituent1,1-DCE
Max<0.02
Max Date6/2/2009
Last<0.2
Last Date6/3/2010
AGW009Constituent1,1-DCE
Max<0.02
Max Date6/10/2010
Last<0.2
Last Date6/10/2010
AGW164 (I) (29ft-BHS)Constituent1,1-DCE
Max<0.02
Max Date8/24/2010
Last<0.02
Last Date8/24/2010
AGW050Constituent1,1-DCE
Max<0.02
Max Date9/29/2010
Last<0.02
Last Date9/29/2010
AGW047Constituent1,1-DCE
Max<0.02
Max Date9/29/2010
Last<0.02
Last Date9/29/2010
AGW046Constituent1,1-DCE
Max<0.02
Max Date9/29/2010
Last<0.02
Last Date9/29/2010
AGW048Constituent1,1-DCE
Max<0.02
Max Date9/29/2010
Last<0.02
Last Date9/29/2010
AGW163 (I) (28ft-BHS)Constituent1,1-DCE
Max<0.02
Max Date8/26/2010
Last<0.02
Last Date8/26/2010
Notes
1. All concentrations shown inµg/L, the screening level for1,1-DCE is 7.0 µg/L.
2. ND = Compound Not Detectedat Indicated Reporting Limit.
3. BHS = Borehole Sample.
4. "Max" concentration: For wellswith non-detect data, the lowestrecorded detection limit is usedas the maximum historicalconcentration.
5. Black and white reproduction ofthis color original may reduce itseffectiveness and lead toincorrect interpretation .
AGW025Constituent1,1-DCE
Max0.063
Max Date12/4/2008
Last<0.2
Last Date6/2/2010
ASB0157<0.02 8/24/2004
ASB01610.059 8/31/2004
ASB01620.034 8/31/2004
ASB01450.044 5/4/2004
ASB0143<0.02 5/4/2004
ASB0144<0.02 5/4/2004
ASB0148<0.02 5/5/2004
ASB0147<0.02 5/5/2004
ASB0146<0.02 5/5/2004
ASB0135<0.02 3/22/2004
ASB0140<0.02 3/22/2004
ASB0138<0.02 3/22/2004
ASB0139<0.02 3/22/2004
ASB0141<0.02 5/4/2004
ASB0142<0.02 5/4/2004
ASB0137<0.02 3/22/2004ASB0136
<0.02 3/22/2004
TCE Detection = 3 < 5 g/LTCE Detection = 1 < 3 g/L
Current Building and Number
Property Boundary
Legend
17-68
TCE Detection = < 1 g/L
Monitoring Well Location
Soil Boring Location
AGW026
ASB0135<2 3/22/2004 Most Recent Sample Result & Date
(Color codes apply to most recent data only)
Solid Waste Management Unit (SWMU)S-13a
TCE Detection = 5 g/L
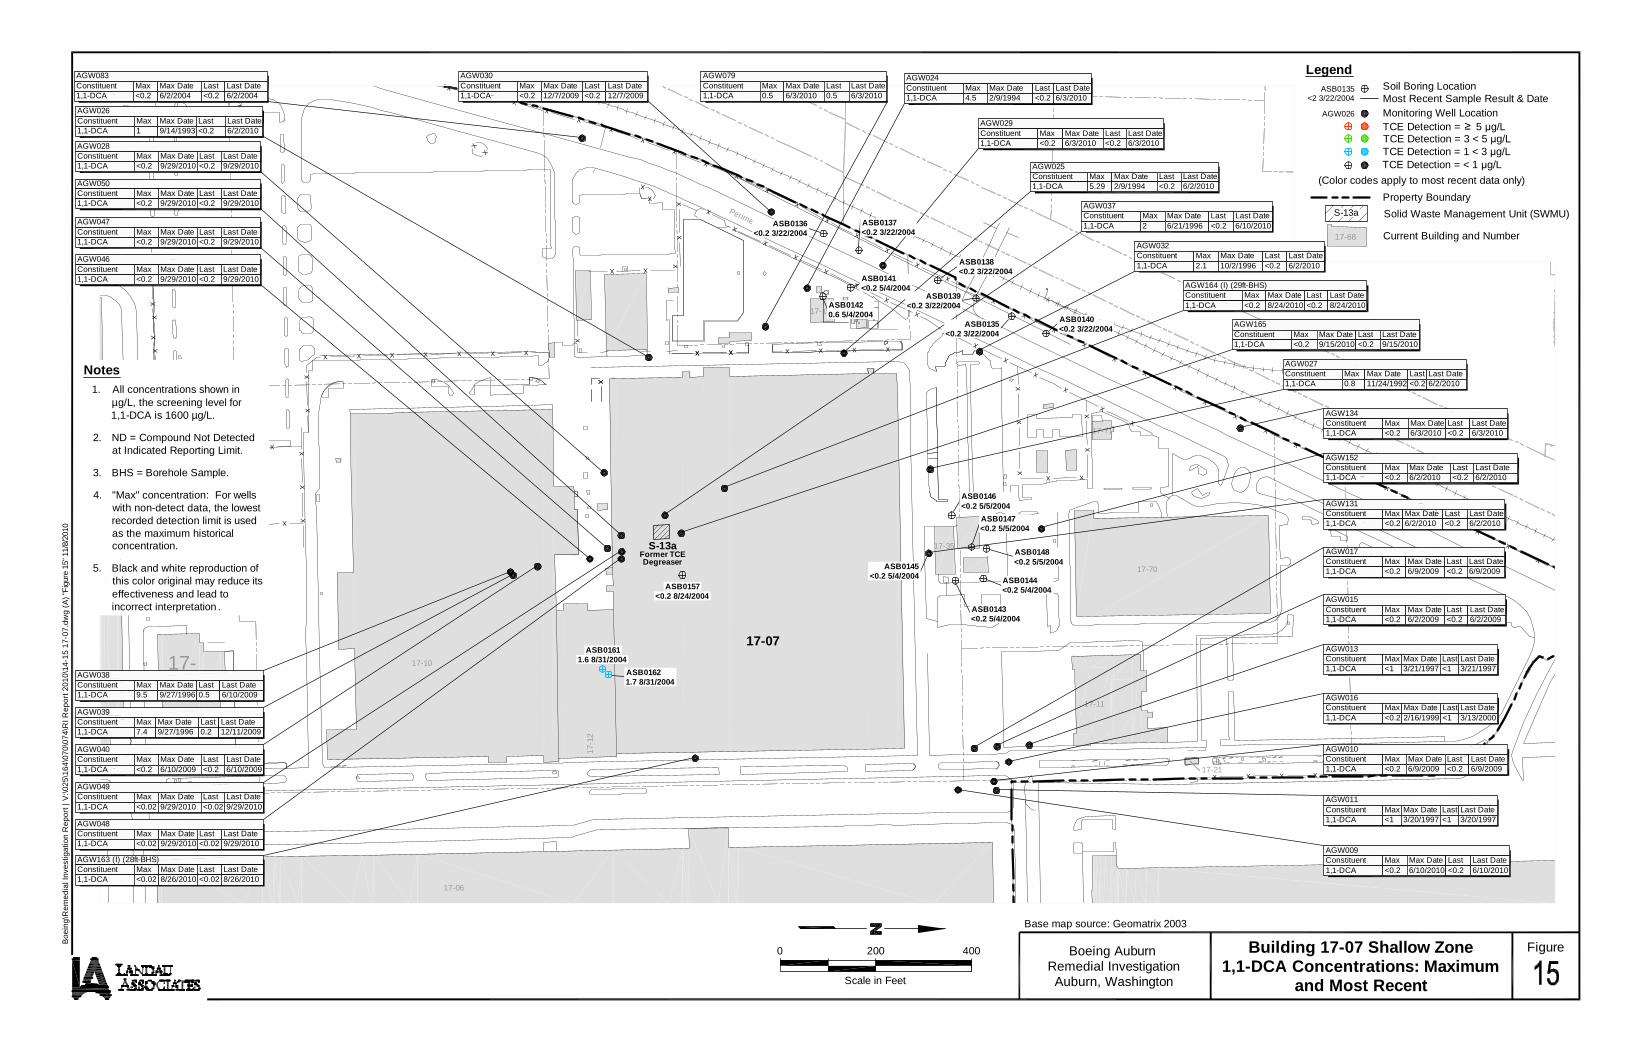
X
X
X
X
X X
X
XX
X
XX
XX
XX
X X X X X X X
X
X
X
X
X
X
X
X
X
X
X
X
X
XX
X
XX
X
X
X X X X X X
X
X
X
X
X
X
X
X
X
X
X
X
X
XX
XX
X
XX
X
XX
X
X X X
XX
XX
X
XX
X
X
XX
XX
XXXX
XX
X
X
X X
XX
X
X
X X X X X X X X
X
X
X
X
X
X
X
X
X
X
X
X
X
X
X
X
X
X
X
X
X X
X X
X
17-06
17-10
17
-12
17-11
17-35
17-15
17-71
17-70
17-21
17-44
Perimeter Road
S-13aFormer TCEDegreaser
17-07
0 200 400
Scale in Feet
Base map source: Geomatrix 2003
Boeing AuburnRemedial InvestigationAuburn, Washington
Building 17-07 Shallow Zone1,1-DCA Concentrations: Maximum
and Most Recent
Figure
Bo
ein
g\R
em
ed
ial I
nve
stig
atio
n R
ep
ort
| V
:\0
25
\16
4\0
70
\07
4\R
I Re
po
rt 2
01
0\1
4-1
5 1
7-0
7.d
wg
(A
) "F
igur
e 1
5" 1
1/8/
2010
AGW010Constituent1,1-DCA
Max<0.2
Max Date6/9/2009
Last<0.2
Last Date6/9/2009
AGW011Constituent1,1-DCA
Max<1
Max Date3/20/1997
Last<1
Last Date3/20/1997
AGW013Constituent1,1-DCA
Max<1
Max Date3/21/1997
Last<1
Last Date3/21/1997
AGW015Constituent1,1-DCA
Max<0.2
Max Date6/2/2009
Last<0.2
Last Date6/2/2009
AGW016Constituent1,1-DCA
Max<0.2
Max Date2/16/1999
Last<1
Last Date3/13/2000
AGW017Constituent1,1-DCA
Max<0.2
Max Date6/9/2009
Last<0.2
Last Date6/9/2009
AGW024Constituent1,1-DCA
Max4.5
Max Date2/9/1994
Last<0.2
Last Date6/3/2010
AGW026Constituent1,1-DCA
Max1
Max Date9/14/1993
Last<0.2
Last Date6/2/2010
AGW027Constituent1,1-DCA
Max0.8
Max Date11/24/1992
Last<0.2
Last Date6/2/2010
AGW030Constituent1,1-DCA
Max<0.2
Max Date12/7/2009
Last<0.2
Last Date12/7/2009
AGW032Constituent1,1-DCA
Max2.1
Max Date10/2/1996
Last<0.2
Last Date6/2/2010
AGW037Constituent1,1-DCA
Max2
Max Date6/21/1996
Last<0.2
Last Date6/10/2010
AGW038Constituent1,1-DCA
Max9.5
Max Date9/27/1996
Last0.5
Last Date6/10/2009
AGW039Constituent1,1-DCA
Max7.4
Max Date9/27/1996
Last0.2
Last Date12/11/2009
AGW040Constituent1,1-DCA
Max<0.2
Max Date6/10/2009
Last<0.2
Last Date6/10/2009
AGW049Constituent1,1-DCA
Max<0.02
Max Date9/29/2010
Last<0.02
Last Date9/29/2010
AGW079Constituent1,1-DCA
Max0.5
Max Date6/3/2010
Last0.5
Last Date6/3/2010
AGW083Constituent1,1-DCA
Max<0.2
Max Date6/2/2004
Last<0.2
Last Date6/2/2004
AGW131Constituent1,1-DCA
Max<0.2
Max Date6/2/2010
Last<0.2
Last Date6/2/2010
AGW134Constituent1,1-DCA
Max<0.2
Max Date6/3/2010
Last<0.2
Last Date6/3/2010
AGW152Constituent1,1-DCA
Max<0.2
Max Date6/2/2010
Last<0.2
Last Date6/2/2010
AGW165Constituent1,1-DCA
Max<0.2
Max Date9/15/2010
Last<0.2
Last Date9/15/2010
AGW028Constituent1,1-DCA
Max<0.2
Max Date9/29/2010
Last<0.2
Last Date9/29/2010
AGW029Constituent1,1-DCA
Max<0.2
Max Date6/3/2010
Last<0.2
Last Date6/3/2010
AGW009Constituent1,1-DCA
Max<0.2
Max Date6/10/2010
Last<0.2
Last Date6/10/2010
AGW164 (I) (29ft-BHS)Constituent1,1-DCA
Max<0.2
Max Date8/24/2010
Last<0.2
Last Date8/24/2010
AGW050Constituent1,1-DCA
Max<0.2
Max Date9/29/2010
Last<0.2
Last Date9/29/2010
AGW047Constituent1,1-DCA
Max<0.2
Max Date9/29/2010
Last<0.2
Last Date9/29/2010
AGW046Constituent1,1-DCA
Max<0.2
Max Date9/29/2010
Last<0.2
Last Date9/29/2010
AGW048Constituent1,1-DCA
Max<0.02
Max Date9/29/2010
Last<0.02
Last Date9/29/2010
AGW163 (I) (28ft-BHS)Constituent1,1-DCA
Max<0.02
Max Date8/26/2010
Last<0.02
Last Date8/26/2010
Notes
1. All concentrations shown inµg/L, the screening level for1,1-DCA is 1600 µg/L.
2. ND = Compound Not Detectedat Indicated Reporting Limit.
3. BHS = Borehole Sample.
4. "Max" concentration: For wellswith non-detect data, the lowestrecorded detection limit is usedas the maximum historicalconcentration.
5. Black and white reproduction ofthis color original may reduce itseffectiveness and lead toincorrect interpretation .
AGW025Constituent1,1-DCA
Max5.29
Max Date2/9/1994
Last<0.2
Last Date6/2/2010
ASB0157<0.2 8/24/2004
ASB01611.6 8/31/2004
ASB01621.7 8/31/2004
ASB0145<0.2 5/4/2004
ASB0143<0.2 5/4/2004
ASB0144<0.2 5/4/2004
ASB0148<0.2 5/5/2004
ASB0147<0.2 5/5/2004
ASB0146<0.2 5/5/2004
ASB0135<0.2 3/22/2004
ASB0140<0.2 3/22/2004
ASB0138<0.2 3/22/2004
ASB0139<0.2 3/22/2004
ASB0141<0.2 5/4/2004
ASB01420.6 5/4/2004
ASB0137<0.2 3/22/2004
ASB0136<0.2 3/22/2004
TCE Detection = 3 < 5 g/LTCE Detection = 1 < 3 g/L
Current Building and Number
Property Boundary
Legend
17-68
TCE Detection = < 1 g/L
Monitoring Well Location
Soil Boring Location
AGW026
ASB0135<2 3/22/2004 Most Recent Sample Result & Date
(Color codes apply to most recent data only)
Solid Waste Management Unit (SWMU)S-13a
TCE Detection = 5 g/L

X
XX
X
XX X
X
X
X
X
X
X
X
X
X
X
X
X
X
XX
XXXX
X
X
X
X
X
X
X
X
X
X XX
X
X
X X X X XXXXXXXXXXXXXXXXXXXXXXX
X
XX X X
X
X
X
X
X
X
X
X
X
X
X
X
X
X
X
X
X
X
X
X
X
X
XX
XX
XX
X XX
XX
XX
XX
X
X X X X X X
X
X X
17-275
17-7417-16
17-06
17-04
17-1017-07
17-29
17-34
17-09
17
-12 17-11
17-35
17-15
17-71
17-70
17-14
17-21
17-239
YMCA
17-240
17-234
17-44
15
th S
tre
et S
W
Perimeter Road
JuniorAchievement
AMB Warehouse
Area 1
Bo
un
da
ry B
lvd
10
th S
tre
et S
W
0 500 1000
Scale in Feet
Base map source: Geomatrix 2003
Boeing AuburnRemedial InvestigationAuburn, Washington
Intermediate ZoneTCE Concentrations
Maximum and Most Recent
Figure
Bo
ein
g\R
em
ed
ial I
nve
stig
atio
n R
ep
ort
| V
:\0
25
\16
4\0
70
\07
4\R
I Re
po
rt 2
01
0\1
6-1
8 S
W I
nte
r V
OC
s.d
wg
(A
) "F
igur
e 1
6" 1
1/19
/201
0
AGW057R (I)ConstituentTCE
Max3
Max Date6/11/2007
Last2
Last Date6/7/2010
AGW060R (I)ConstituentTCE
Max2.1
Max Date9/11/2007
Last1.2
Last Date6/7/2010
AGW055R (I)ConstituentTCE
Max2.5
Max Date6/11/2007
Last0.8
Last Date6/7/2010
AGW72 (I)ConstituentTCE
Max5
Max Date11/1/2001
Last2.2
Last Date6/7/2010
AGW126 (I)ConstituentTCE
Max21
Max Date6/11/2007
Last10
Last Date6/8/2010
AGW140 (I)ConstituentTCE
Max8.3
Max Date12/3/2009
Last5.4
Last Date9/14/2010
AGW137 (I)ConstituentTCE
Max7.3
Max Date10/30/2008
Last5.6
Last Date6/9/2010
AGW139 (I)ConstituentTCE
Max6.1
Max Date6/4/2009
Last5.2
Last Date6/9/2010
AGW151 (I)ConstituentTCE
Max1.2
Max Date10/28/2009
Last0.7
Last Date9/15/2010
AGW141 (I)ConstituentTCE
Max3.6
Max Date3/12/2009
Last3
Last Date6/9/2010
AGW149 (I)ConstituentTCE
Max5.2
Max Date6/10/2010
Last4.6
Last Date9/14/2010
AGW150 (I)ConstituentTCE
Max3.6
Max Date10/28/2009
Last2.3
Last Date9/14/2010
AGW162 (I)ConstituentTCE
Max1.2
Max Date6/9/2010
Last0.9
Last Date9/14/2010
AGW161 (I)ConstituentTCE
Max3.1
Max Date3/9/2010
Last2.8
Last Date9/15/2010
AGW174 (I)ConstituentTCE
Max3.6
Max Date9/15/2010
Last3.6
Last Date9/15/2010
AGW105 (I)ConstituentTCE
Max1.1
Max Date6/4/2007
Last0.6
Last Date6/3/2010
AGW155 (I)ConstituentTCE
Max0.6
Max Date6/2/2010
Last0.4
Last Date9/1/2010
AGW164 (I)ConstituentTCE
Max1.4
Max Date9/15/2010
Last1.4
Last Date9/15/2010
AGW163 (I)ConstituentTCE
Max3.3
Max Date9/15/2010
Last3.3
Last Date9/15/2010
AGW154 (I)ConstituentTCE
Max0.6
Max Date6/3/2010
Last0.4
Last Date9/1/2010
AGW095R (I)ConstituentTCE
Max3.3
Max Date6/11/2007
Last1.8
Last Date6/8/2010
AGW157 (I)ConstituentTCE
Max3.5
Max Date9/1/2010
Last3.5
Last Date9/1/2010
AGW145 (I)ConstituentTCE
Max15
Max Date12/7/2009
Last11
Last Date9/1/2010
AGW156 (I)ConstituentTCE
Max7.4
Max Date6/2/2010
Last5
Last Date9/1/2010
AGW144 (I)ConstituentTCE
Max0.9
Max Date9/1/2010
Last0.9
Last Date9/1/2010
AGW148 (I)ConstituentTCE
Max6.4
Max Date12/2/2009
Last5.0
Last Date9/14/2010
AGW179 (I)ConstituentTCE
Max1.2
Max Date9/29/2010
Last1.2
Last Date9/29/2010
AGW177 (I)ConstituentTCE
Max5.2
Max Date9/29/2010
Last5.2
Last Date9/29/2010
AGW166 (I)ConstituentTCE
Max<0.2
Max Date11/08/2010
Last<0.2
Last Date11/08/2010
AGW172 (I)ConstituentTCE
Max3.4
Max Date9/16/2010
Last3.4
Last Date9/16/2010
AGW173 (I)ConstituentTCE
Max0.7
Max Date9/1/2010
Last<0.2
Last Date10/6/2010
AGW175 (I)ConstituentTCE
Max3.4
Max Date9/15/2010
Last3.4
Last Date9/15/2010
AGW176 (I)ConstituentTCE
Max5.4
Max Date10/6/2010
Last5.4
Last Date10/6/2010
AGW165 (55ft-BHS)ConstituentTCE
Max0.6
Max Date8/25/2010
Last0.6
Last Date8/25/2010
AGW160 (I)ConstituentTCE
Max5.4
Max Date6/10/2010
Last4.7
Last Date9/14/2010
Notes
1. All concentrations shown in µg/L, thescreening level for TCE is 0.49 µg/L.
2. ND = Compound Not Detected atIndicated Reporting Limit.
3. BHS = Borehole Sample.
4. "Max" concentration: For wells withnon-detect data, the lowest recordeddetection limit is used as themaximum historical concentration.
5. Black and white reproduction of thiscolor original may reduce itseffectiveness and lead to incorrectinterpretation.
5.03.0
3.0
3.0
3.0
5.0
AGW158(I)ConstituentTCE
Max4.2
Max Date6/9/2010
Last3.4
Last Date9/14/2010
AGW168(I)ConstituentTCE
Max4.0
Max Date11/08/2010
Last4.0
Last Date11/08/2010
AGW170(I)ConstituentTCE
Max3.6
Max Date11/08/2010
Last3.6
Last Date11/08/2010
AGW147 (I)ConstituentTCE
Max<0.2
Max Date9/14/2010
Last<0.2
Last Date9/14/2010
5.0
VC Plume Contour5.03.0
TCE Detection = 3 < 5 g/LTCE Detection = 1 < 3 g/L
Current Building and Number
Property Boundary
Legend
17-68
TCE Detection = < 1 g/L
Monitoring Well Location
(Color codes apply to most recent data only)
TCE Detection = 5 g/L

X
XX
X
XX X
X
X
X
X
X
X
X
X
X
X
X
X
X
XX
XXXX
X
X
X
X
X
X
X
X
X
X XX
X
X
X X X X XXXXXXXXXXXXXXXXXXXXXXX
X
XX X X
X
X
X
X
X
X
X
X
X
X
X
X
X
X
X
X
X
X
X
X
X
X
XX
XX
XX
X XX
XX
XX
XX
X
X X X X X X
X
X X
17-275
17-7417-16
17-06
17-04
17-1017-07
17-29
17-34
17-09
17
-12 17-11
17-35
17-15
17-71
17-70
17-14
17-21
17-239
YMCA
17-240
17-234
17-44
15
th S
tre
et S
W
Perimeter Road
JuniorAchievement
AMB Warehouse
Area 1
Bo
un
da
ry B
lvd
10
th S
tre
et S
W
0 500 1000
Scale in Feet
Base map source: Geomatrix 2003
Boeing AuburnRemedial InvestigationAuburn, Washington
Intermediate ZoneCis-1,2-DCE ConcentrationsMaximum and Most Recent
Figure
Bo
ein
g\R
em
ed
ial I
nve
stig
atio
n R
ep
ort
| V
:\0
25
\16
4\0
70
\07
4\R
I Re
po
rt 2
01
0\1
6-1
8 S
W I
nte
r V
OC
s.d
wg
(A
) "F
igur
e 1
7" 1
1/19
/201
0
AGW057R (I)ConstituentCis-1,2-DCE
Max<0.2
Max Date6/7/2010
Last<0.2
Last Date6/7/2010
AGW060R (I)ConstituentCis-1,2-DCE
Max4
Max Date9/11/2007
Last2.9
Last Date6/7/2010
AGW055R (I)ConstituentCis-1,2-DCE
Max3
Max Date6/11/2007
Last1.6
Last Date6/7/2010
AGW72 (I)ConstituentCis-1,2-DCE
Max0.8
Max Date12/3/2004
Last0.3
Last Date6/7/2010
AGW126 (I)ConstituentCis-1,2-DCE
Max7.7
Max Date12/11/2007
Last4.9
Last Date6/8/2010
AGW140 (I)ConstituentCis-1,2-DCE
Max5.2
Max Date12/3/2009
Last3.4
Last Date9/14/2010
AGW137 (I)ConstituentCis-1,2-DCE
Max3.4
Max Date12/10/2008
Last2.4
Last Date6/9/2010
AGW139 (I)ConstituentCis-1,2-DCE
Max0.6
Max Date2/19/2009
Last0.4
Last Date6/9/2010
AGW151 (I)ConstituentCis-1,2-DCE
Max<0.2
Max Date9/15/2010
Last<0.2
Last Date9/15/2010
AGW141 (I)ConstituentCis-1,2-DCE
Max0.6
Max Date12/2/2009
Last0.4
Last Date6/9/2010
AGW149 (I)ConstituentCis-1,2-DCE
Max1
Max Date6/10/2010
Last0.8
Last Date9/14/2010
AGW150 (I)ConstituentCis-1,2-DCE
Max0.4
Max Date10/28/2009
Last<0.2
Last Date9/14/2010
AGW162 (I)ConstituentCis-1,2-DCE
Max<0.2
Max Date9/14/2010
Last<0.2
Last Date9/14/2010
AGW161 (I)ConstituentCis-1,2-DCE
Max0.2
Max Date3/9/2010
Last<0.2
Last Date9/15/2010
AGW174 (I)ConstituentCis-1,2-DCE
Max<0.2
Max Date9/15/2010
Last<0.2
Last Date9/15/2010
AGW105 (I)ConstituentCis-1,2-DCE
Max1.1
Max Date6/5/2006
Last0.7
Last Date6/3/2010
AGW155 (I)ConstituentCis-1,2-DCE
Max8.6
Max Date3/15/2010
Last6.2
Last Date9/1/2010
AGW164 (I)ConstituentCis-1,2-DCE
Max0.6
Max Date9/15/2010
Last0.6
Last Date9/15/2010
AGW163 (I)ConstituentCis-1,2-DCE
Max1
Max Date9/15/2010
Last1
Last Date9/15/2010
AGW154 (I)ConstituentCis-1,2-DCE
Max0.7
Max Date6/3/2010
Last0.6
Last Date9/1/2010
AGW095R (I)ConstituentCis-1,2-DCE
Max0.9
Max Date6/3/2009
Last0.8
Last Date6/8/2010
AGW157 (I)ConstituentCis-1,2-DCE
Max3
Max Date6/8/2008
Last2.7
Last Date9/1/2010
AGW145 (I)ConstituentCis-1,2-DCE
Max8.7
Max Date12/7/2009
Last7.5
Last Date9/1/2010
AGW156 (I)ConstituentCis-1,2-DCE
Max4.9
Max Date9/1/2010
Last4.9
Last Date9/1/2010
AGW144 (I)ConstituentCis-1,2-DCE
Max2.1
Max Date6/8/2010
Last1.9
Last Date9/1/2010
AGW148 (I)ConstituentCis-1,2-DCE
Max2.7
Max Date10/28/2009
Last2
Last Date9/14/2010
AGW179 (I)ConstituentCis-1,2-DCE
Max7.2
Max Date9/29/2010
Last7.2
Last Date9/29/2010
AGW177 (I)ConstituentCis-1,2-DCE
Max1.2
Max Date9/29/2010
Last1.2
Last Date9/29/2010
AGW158(I)ConstituentCis-1,2-DCE
Max1.4
Max Date3/9/2010
Last0.9
Last Date9/14/2010
AGW147 (I)ConstituentCis-1,2-DCE
Max6.6
Max Date3/9/2010
Last5.1
Last Date9/14/2010
AGW172 (I)ConstituentCis-1,2-DCE
Max0.3
Max Date9/16/2010
Last0.3
Last Date9/16/2010
AGW173 (I)ConstituentCis-1,2-DCE
Max<0.2
Max Date10/6/2010
Last<0.2
Last Date10/6/2010
AGW175 (I)ConstituentCis-1,2-DCE
Max0.6
Max Date9/15/2010
Last0.6
Last Date9/15/2010
AGW176 (I)ConstituentCis-1,2-DCE
Max0.6
Max Date10/6/2010
Last0.6
Last Date10/6/2010
AGW165 (55ft-BHS)ConstituentCis-1,2-DCE
Max0.2
Max Date8/25/2010
Last0.2
Last Date8/25/2010
AGW160 (I)ConstituentVinyl Chloride
Max0.8
Max Date3/9/2010
Last0.4
Last Date9/14/2010
Notes
1. All concentrations shown in µg/L, thescreening level for Cis-1,2-DCE is70.0 µg/L.
2. ND = Compound Not Detected atIndicated Reporting Limit.
3. BHS = Borehole Sample.
4. "Max" concentration: For wells withnon-detect data, the lowest recordeddetection limit is used as themaximum historical concentration.
5. Black and white reproduction of thiscolor original may reduce itseffectiveness and lead to incorrectinterpretation.
3.0
5.0
AGW166 (I)ConstituentCis-1,2-DCE
Max<0.2
Max Date11/08/2010
Last<0.2
Last Date11/08/2010
AGW168(I)ConstituentCis-1,2-DCE
Max1.8
Max Date11/08/2010
Last1.8
Last Date11/08/2010
AGW170(I)ConstituentCis-1,2-DCE
Max1.0
Max Date11/08/2010
Last1.0
Last Date11/08/2010
3.0
5.0
3.05.0
VC Plume Contour5.03.0
TCE Detection = 3 < 5 g/LTCE Detection = 1 < 3 g/L
Current Building and Number
Property Boundary
Legend
17-68
TCE Detection = < 1 g/L
Monitoring Well Location
(Color codes apply to most recent data only)
TCE Detection = 5 g/L
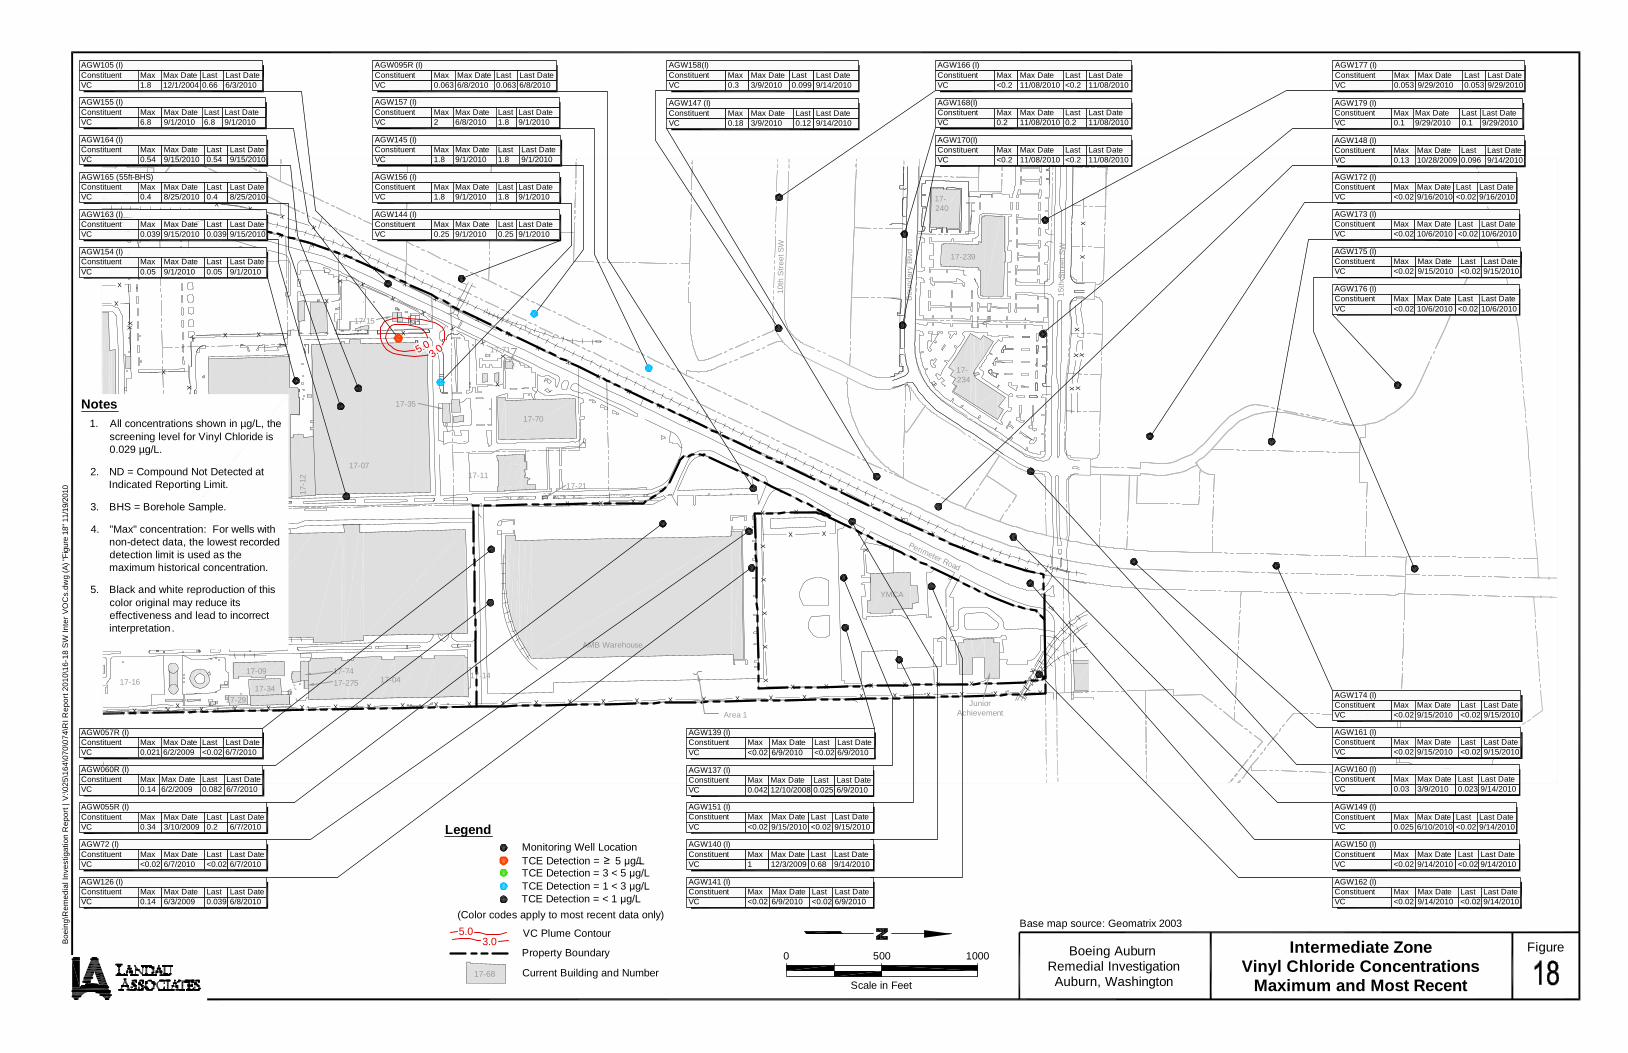
X
XX
X
XX X
X
X
X
X
X
X
X
X
X
X
X
X
X
XX
XXXX
X
X
X
X
X
X
X
X
X
X XX
X
X
X X X X XXXXXXXXXXXXXXXXXXXXXXX
X
XX X X
X
X
X
X
X
X
X
X
X
X
X
X
X
X
X
X
X
X
X
X
X
X
XX
XX
XX
X XX
XX
XX
XX
X
X X X X X X
X
X X
17-275
17-7417-16
17-06
17-04
17-1017-07
17-29
17-34
17-09
17
-12 17-11
17-35
17-15
17-71
17-70
17-14
17-21
17-239
YMCA
17-240
17-234
17-44
15
th S
tre
et S
W
Perimeter Road
JuniorAchievement
AMB Warehouse
Area 1
Bo
un
da
ry B
lvd
10
th S
tre
et S
W
0 500 1000
Scale in Feet
Base map source: Geomatrix 2003
Boeing AuburnRemedial InvestigationAuburn, Washington
Intermediate ZoneVinyl Chloride Concentrations
Maximum and Most Recent
Figure
Bo
ein
g\R
em
ed
ial I
nve
stig
atio
n R
ep
ort
| V
:\0
25
\16
4\0
70
\07
4\R
I Re
po
rt 2
01
0\1
6-1
8 S
W I
nte
r V
OC
s.d
wg
(A
) "F
igur
e 1
8" 1
1/19
/201
0
AGW057R (I)ConstituentVC
Max0.021
Max Date6/2/2009
Last<0.02
Last Date6/7/2010
AGW060R (I)ConstituentVC
Max0.14
Max Date6/2/2009
Last0.082
Last Date6/7/2010
AGW055R (I)ConstituentVC
Max0.34
Max Date3/10/2009
Last0.2
Last Date6/7/2010
AGW72 (I)ConstituentVC
Max<0.02
Max Date6/7/2010
Last<0.02
Last Date6/7/2010
AGW126 (I)ConstituentVC
Max0.14
Max Date6/3/2009
Last0.039
Last Date6/8/2010
AGW140 (I)ConstituentVC
Max1
Max Date12/3/2009
Last0.68
Last Date9/14/2010
AGW137 (I)ConstituentVC
Max0.042
Max Date12/10/2008
Last0.025
Last Date6/9/2010
AGW139 (I)ConstituentVC
Max<0.02
Max Date6/9/2010
Last<0.02
Last Date6/9/2010
AGW151 (I)ConstituentVC
Max<0.02
Max Date9/15/2010
Last<0.02
Last Date9/15/2010
AGW141 (I)ConstituentVC
Max<0.02
Max Date6/9/2010
Last<0.02
Last Date6/9/2010
AGW149 (I)ConstituentVC
Max0.025
Max Date6/10/2010
Last<0.02
Last Date9/14/2010
AGW150 (I)ConstituentVC
Max<0.02
Max Date9/14/2010
Last<0.02
Last Date9/14/2010
AGW162 (I)ConstituentVC
Max<0.02
Max Date9/14/2010
Last<0.02
Last Date9/14/2010
AGW161 (I)ConstituentVC
Max<0.02
Max Date9/15/2010
Last<0.02
Last Date9/15/2010
AGW174 (I)ConstituentVC
Max<0.02
Max Date9/15/2010
Last<0.02
Last Date9/15/2010
AGW105 (I)ConstituentVC
Max1.8
Max Date12/1/2004
Last0.66
Last Date6/3/2010
AGW155 (I)ConstituentVC
Max6.8
Max Date9/1/2010
Last6.8
Last Date9/1/2010
AGW164 (I)ConstituentVC
Max0.54
Max Date9/15/2010
Last0.54
Last Date9/15/2010
AGW163 (I)ConstituentVC
Max0.039
Max Date9/15/2010
Last0.039
Last Date9/15/2010
AGW154 (I)ConstituentVC
Max0.05
Max Date9/1/2010
Last0.05
Last Date9/1/2010
AGW095R (I)ConstituentVC
Max0.063
Max Date6/8/2010
Last0.063
Last Date6/8/2010
AGW157 (I)ConstituentVC
Max2
Max Date6/8/2010
Last1.8
Last Date9/1/2010
AGW145 (I)ConstituentVC
Max1.8
Max Date9/1/2010
Last1.8
Last Date9/1/2010
AGW156 (I)ConstituentVC
Max1.8
Max Date9/1/2010
Last1.8
Last Date9/1/2010
AGW144 (I)ConstituentVC
Max0.25
Max Date9/1/2010
Last0.25
Last Date9/1/2010
AGW148 (I)ConstituentVC
Max0.13
Max Date10/28/2009
Last0.096
Last Date9/14/2010
AGW179 (I)ConstituentVC
Max0.1
Max Date9/29/2010
Last0.1
Last Date9/29/2010
AGW177 (I)ConstituentVC
Max0.053
Max Date9/29/2010
Last0.053
Last Date9/29/2010
AGW158(I)ConstituentVC
Max0.3
Max Date3/9/2010
Last0.099
Last Date9/14/2010
AGW147 (I)ConstituentVC
Max0.18
Max Date3/9/2010
Last0.12
Last Date9/14/2010
AGW172 (I)ConstituentVC
Max<0.02
Max Date9/16/2010
Last<0.02
Last Date9/16/2010
AGW173 (I)ConstituentVC
Max<0.02
Max Date10/6/2010
Last<0.02
Last Date10/6/2010
AGW175 (I)ConstituentVC
Max<0.02
Max Date9/15/2010
Last<0.02
Last Date9/15/2010
AGW165 (55ft-BHS)ConstituentVC
Max0.4
Max Date8/25/2010
Last0.4
Last Date8/25/2010
AGW176 (I)ConstituentVC
Max<0.02
Max Date10/6/2010
Last<0.02
Last Date10/6/2010
AGW160 (I)ConstituentVC
Max0.03
Max Date3/9/2010
Last0.023
Last Date9/14/2010
Notes
1. All concentrations shown in µg/L, thescreening level for Vinyl Chloride is0.029 µg/L.
2. ND = Compound Not Detected atIndicated Reporting Limit.
3. BHS = Borehole Sample.
4. "Max" concentration: For wells withnon-detect data, the lowest recordeddetection limit is used as themaximum historical concentration.
5. Black and white reproduction of thiscolor original may reduce itseffectiveness and lead to incorrectinterpretation.
VC Plume Contour5.03.0
3.05.0
AGW166 (I)ConstituentVC
Max<0.2
Max Date11/08/2010
Last<0.2
Last Date11/08/2010
AGW168(I)ConstituentVC
Max0.2
Max Date11/08/2010
Last0.2
Last Date11/08/2010
AGW170(I)ConstituentVC
Max<0.2
Max Date11/08/2010
Last<0.2
Last Date11/08/2010
TCE Detection = 3 < 5 g/LTCE Detection = 1 < 3 g/L
Current Building and Number
Property Boundary
Legend
17-68
TCE Detection = < 1 g/L
Monitoring Well Location
(Color codes apply to most recent data only)
TCE Detection = 5 g/L
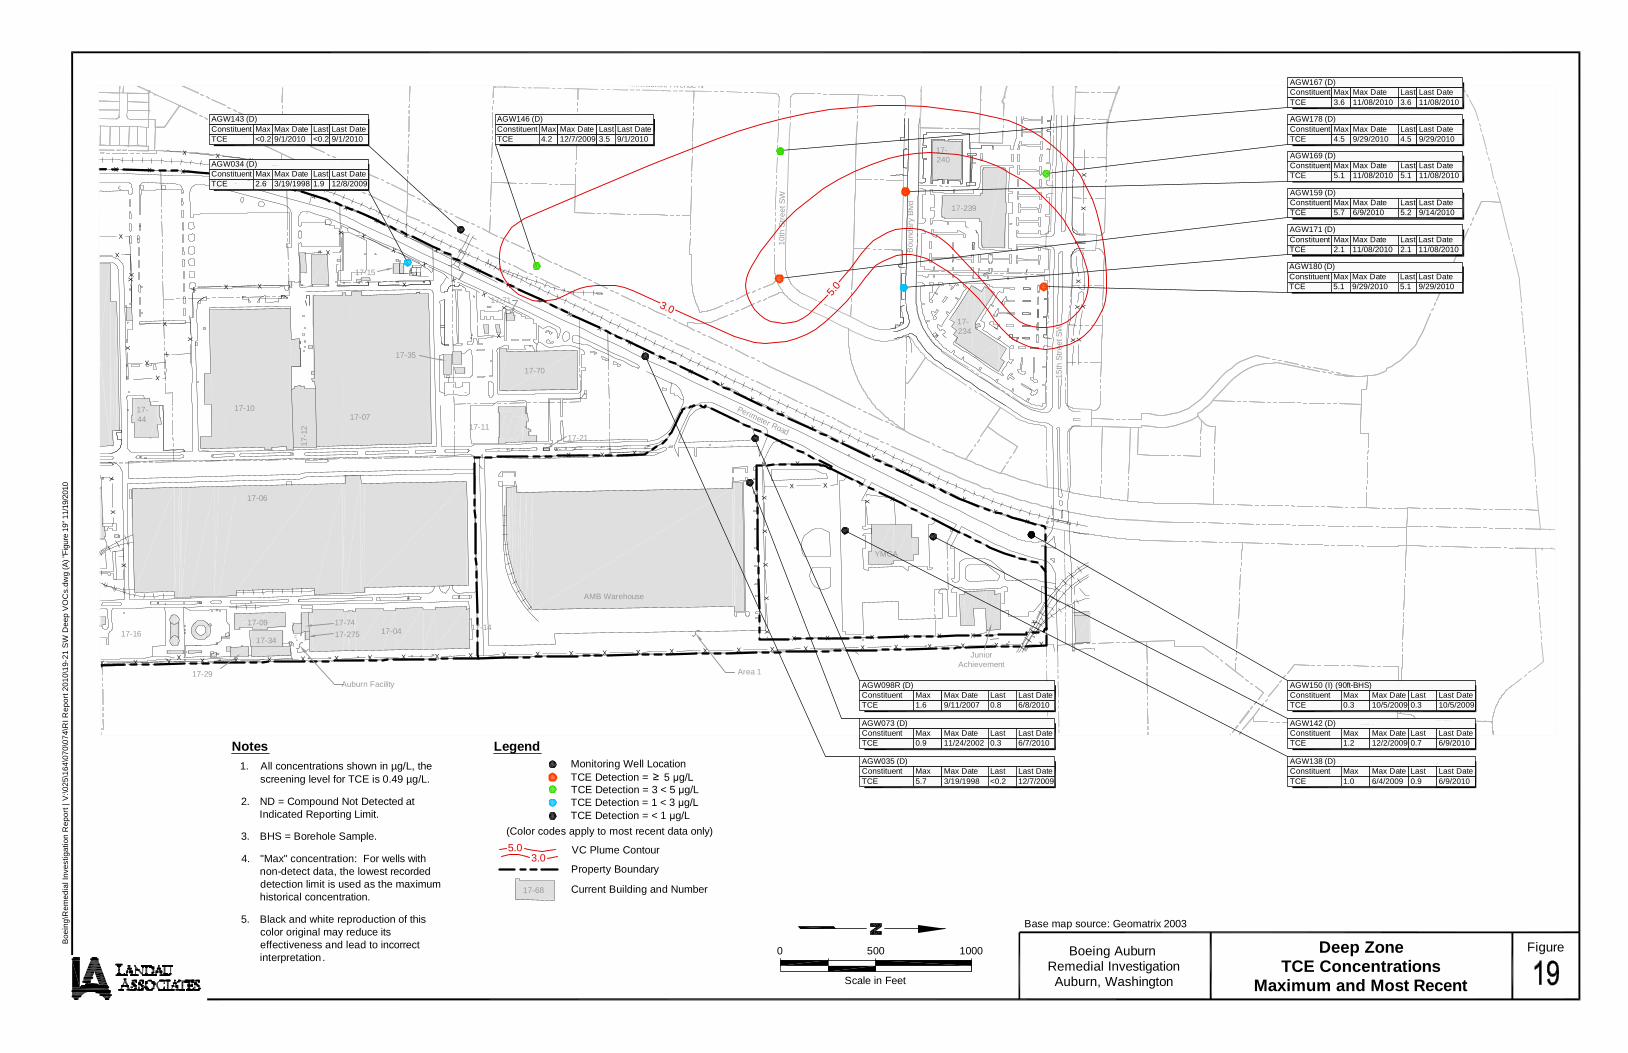
X
XX
X
X X X
X
X
X
X
X
X
X
X
X
X
X
X
X
XX
XXXX
X
X
X
X
X
X
X
X
X
X XX
X
X
X X X X XXXXXXXXXXXXXXXXXXXXXXX
X
X
X X X
X
X
X
X
X
X
X
X
X
X
X
X
X
X
X
X
X
X
X
X
X
X
XX
XX
XX
X X
XXX
XX
XX
X
X X X X X X
X
X X
17-275
17-74
17-16
17-06
17-04
17-1017-07
17-29
17-34
17-09
17
-12 17-11
17-35
17-15
17-71
17-70
17-14
17-21
17-239
YMCA
17-240
17-234
17-44
JuniorAchievement
AMB Warehouse
Area 1
15
th S
tre
et S
W
Perimeter Road
Auburn Facility
Milwaukee Avenue N
Bo
un
da
ry B
lvd
10
th S
tre
et S
W
Notes
1. All concentrations shown in µg/L, thescreening level for TCE is 0.49 µg/L.
2. ND = Compound Not Detected atIndicated Reporting Limit.
3. BHS = Borehole Sample.
4. "Max" concentration: For wells withnon-detect data, the lowest recordeddetection limit is used as the maximumhistorical concentration.
5. Black and white reproduction of thiscolor original may reduce itseffectiveness and lead to incorrectinterpretation.
0 500 1000
Scale in Feet
Base map source: Geomatrix 2003
Boeing AuburnRemedial InvestigationAuburn, Washington
Deep ZoneTCE Concentrations
Maximum and Most Recent
Figure
Bo
ein
g\R
em
ed
ial I
nve
stig
atio
n R
ep
ort
| V
:\0
25
\16
4\0
70
\07
4\R
I Re
po
rt 2
01
0\1
9-2
1 S
W D
ee
p V
OC
s.d
wg
(A
) "F
igur
e 1
9" 1
1/19
/201
0
AGW150 (I) (90ft-BHS)ConstituentTCE
Max0.3
Max Date10/5/2009
Last0.3
Last Date10/5/2009
AGW143 (D)ConstituentTCE
Max<0.2
Max Date9/1/2010
Last<0.2
Last Date9/1/2010
AGW034 (D)ConstituentTCE
Max2.6
Max Date3/19/1998
Last1.9
Last Date12/8/2009
AGW178 (D)ConstituentTCE
Max4.5
Max Date9/29/2010
Last4.5
Last Date9/29/2010
AGW171 (D)ConstituentTCE
Max2.1
Max Date11/08/2010
Last2.1
Last Date11/08/2010
AGW035 (D)ConstituentTCE
Max5.7
Max Date3/19/1998
Last<0.2
Last Date12/7/2009
AGW159 (D)ConstituentTCE
Max5.7
Max Date6/9/2010
Last5.2
Last Date9/14/2010
AGW146 (D)ConstituentTCE
Max4.2
Max Date12/7/2009
Last3.5
Last Date9/1/2010
AGW167 (D)ConstituentTCE
Max3.6
Max Date11/08/2010
Last3.6
Last Date11/08/2010
AGW169 (D)ConstituentTCE
Max5.1
Max Date11/08/2010
Last5.1
Last Date11/08/2010
AGW180 (D)ConstituentTCE
Max5.1
Max Date9/29/2010
Last5.1
Last Date9/29/2010
3.0
5.0
VC Plume Contour5.03.0
TCE Detection = 3 < 5 g/LTCE Detection = 1 < 3 g/L
Current Building and Number
Property Boundary
Legend
17-68
TCE Detection = < 1 g/L
Monitoring Well Location
(Color codes apply to most recent data only)
TCE Detection = 5 g/L
AGW073 (D)ConstituentTCE
Max0.9
Max Date11/24/2002
Last0.3
Last Date6/7/2010
AGW142 (D)ConstituentTCE
Max1.2
Max Date12/2/2009
Last0.7
Last Date6/9/2010
AGW138 (D)ConstituentTCE
Max1.0
Max Date6/4/2009
Last0.9
Last Date6/9/2010
AGW098R (D)ConstituentTCE
Max1.6
Max Date9/11/2007
Last0.8
Last Date6/8/2010

X
XX
X
X X X
X
X
X
X
X
X
X
X
X
X
X
X
X
XX
XXXX
X
X
X
X
X
X
X
X
X
X XX
X
X
X X X X XXXXXXXXXXXXXXXXXXXXXXX
X
X
X X X
X
X
X
X
X
X
X
X
X
X
X
X
X
X
X
X
X
X
X
X
X
X
XX
XX
XX
X X
XXX
XX
XX
X
X X X X X X
X
X X
17-275
17-74
17-16
17-06
17-04
17-1017-07
17-29
17-34
17-09
17
-12 17-11
17-35
17-15
17-71
17-70
17-14
17-21
17-239
YMCA
17-240
17-234
17-44
JuniorAchievement
AMB Warehouse
Area 1
15
th S
tre
et S
W
Perimeter Road
Auburn Facility
Milwaukee Avenue N
Bo
un
da
ry B
lvd
10
th S
tre
et S
W
Notes
1. All concentrations shown in µg/L, thescreening level for Cis-1,2-DCE is 70.0 µg/L.
2. ND = Compound Not Detected at IndicatedReporting Limit.
3. BHS = Borehole Sample.
4. "Max" concentration: For wells withnon-detect data, the lowest recordeddetection limit is used as the maximumhistorical concentration.
5. Black and white reproduction of this colororiginal may reduce its effectiveness andlead to incorrect interpretation .
0 500 1000
Scale in Feet
Base map source: Geomatrix 2003
Boeing AuburnRemedial InvestigationAuburn, Washington
Deep ZoneCis-1,2-DCE ConcentrationsMaximum and Most Recent
Figure
Bo
ein
g\R
em
ed
ial I
nve
stig
atio
n R
ep
ort
| V
:\0
25
\16
4\0
70
\07
4\R
I Re
po
rt 2
01
0\1
9-2
1 S
W D
ee
p V
OC
s.d
wg
(A
) "F
igur
e 2
0" 1
1/19
/201
0
AGW178 (D)ConstituentCis-1,2-DCE
Max0.9
Max Date9/29/2010
Last0.9
Last Date9/29/2010
AGW180 (D)ConstituentCis-1,2-DCE
Max0.3
Max Date9/29/2010
Last0.3
Last Date9/29/2010
AGW035 (D)ConstituentCis-1,2-DCE
Max0.6
Max Date9/3/1998
Last<0.2
Last Date12/7/2009
AGW159 (D)ConstituentCis-1,2-DCE
Max1.6
Max Date6/9/2010
Last1.3
Last Date9/14/2010
AGW150 (I) (90ft-BHS)ConstituentCis-1,2-DCE
Max<0.2
Max Date10/5/2009
Last<0.2
Last Date10/5/2009
AGW143 (D)ConstituentCis-1,2-DCE
Max<0.2
Max Date9/1/2010
Last<0.2
Last Date9/1/2010
AGW034 (D)ConstituentCis-1,2-DCE
Max0.9
Max Date3/19/1998
Last0.4
Last Date12/8/2009
AGW146 (D)ConstituentCis-1,2-DCE
Max2.5
Max Date12/7/2009
Last2
Last Date9/1/2010
AGW171 (D)ConstituentCis-1,2-DCE
Max0.3
Max Date11/08/2010
Last0.3
Last Date11/08/2010
AGW167 (D)ConstituentCis-1,2-DCE
Max2.4
Max Date11/08/2010
Last2.4
Last Date11/08/2010
AGW169 (D)ConstituentCis-1,2-DCE
Max2.0
Max Date11/08/2010
Last2.0
Last Date11/08/2010
VC Plume Contour5.03.0
TCE Detection = 3 < 5 g/LTCE Detection = 1 < 3 g/L
Current Building and Number
Property Boundary
Legend
17-68
TCE Detection = < 1 g/L
Monitoring Well Location
(Color codes apply to most recent data only)
TCE Detection = 5 g/L
AGW073 (D)ConstituentCis-1,2-DCE
Max<0.2
Max Date6/7/2010
Last<0.2
Last Date6/7/2010
AGW142 (D)ConstituentCis-1,2-DCE
Max<0.2
Max Date6/9/2010
Last<0.2
Last Date6/9/2010
AGW138 (D)ConstituentCis-1,2-DCE
Max<0.2
Max Date6/9/2010
Last<0.2
Last Date6/9/2010
AGW098R (D)ConstituentCis-1,2-DCE
Max<0.2
Max Date6/8/2010
Last<0.2
Last Date6/8/2010

X
XX
X
X X X
X
X
X
X
X
X
X
X
X
X
X
X
X
XX
XXXX
X
X
X
X
X
X
X
X
X
X XX
X
X
X X X X XXXXXXXXXXXXXXXXXXXXXXX
X
X
X X X
X
X
X
X
X
X
X
X
X
X
X
X
X
X
X
X
X
X
X
X
X
X
XX
XX
XX
X X
XXX
XX
XX
X
X X X X X X
X
X X
17-275
17-74
17-16
17-06
17-04
17-1017-07
17-29
17-34
17-09
17
-12 17-11
17-35
17-15
17-71
17-70
17-14
17-21
17-239
YMCA
17-240
17-234
17-44
JuniorAchievement
AMB Warehouse
Area 1
15
th S
tre
et S
W
Perimeter Road
Auburn Facility
Milwaukee Avenue N
Bo
un
da
ry B
lvd
10
th S
tre
et S
W
0 500 1000
Scale in Feet
Base map source: Geomatrix 2003
Boeing AuburnRemedial InvestigationAuburn, Washington
Deep ZoneVinyl Chloride Concentrations
Maximum and Most Recent
Figure
Bo
ein
g\R
em
ed
ial I
nve
stig
atio
n R
ep
ort
| V
:\0
25
\16
4\0
70
\07
4\R
I Re
po
rt 2
01
0\1
9-2
1 S
W D
ee
p V
OC
s.d
wg
(A
) "F
igur
e 2
1" 1
1/19
/201
0
AGW178 (D)ConstituentVC
Max0.088
Max Date9/29/2010
Last0.088
Last Date9/29/2010
AGW180 (D)ConstituentVC
Max<0.02
Max Date9/29/2010
Last<0.02
Last Date9/29/2010
AGW073 (D)ConstituentVC
Max<0.02
Max Date6/7/2010
Last<0.02
Last Date6/7/2010
AGW159 (D)ConstituentVC
Max0.3
Max Date6/9/2010
Last0.2
Last Date9/14/2010
AGW142 (D)ConstituentVC
Max<0.02
Max Date6/9/2010
Last<0.02
Last Date6/9/2010
AGW143 (D)ConstituentVC
Max<0.02
Max Date9/1/2010
Last<0.02
Last Date9/1/2010
AGW034 (D)ConstituentVC
Max0.026
Max Date6/8/2004
Last<0.02
Last Date12/8/2009
AGW146 (D)ConstituentVC
Max0.36
Max Date9/1/2010
Last0.36
Last Date9/1/2010
Notes
1. All concentrations shown in µg/L, thescreening level for Vinyl Chloride is 0.029 µg/L.
2. ND = Compound Not Detected at IndicatedReporting Limit.
3. BHS = Borehole Sample.
4. "Max" concentration: For wells with non-detectdata, the lowest recorded detection limit isused as the maximum historical concentration.
5. Black and white reproduction of this colororiginal may reduce its effectiveness and leadto incorrect interpretation .
AGW171 (D)ConstituentVC
Max<0.2
Max Date11/08/2010
Last<0.2
Last Date11/08/2010
AGW167 (D)ConstituentVC
Max0.3
Max Date11/08/2010
Last0.3
Last Date11/08/2010
AGW169 (D)ConstituentVC
Max0.2
Max Date11/08/2010
Last0.2
Last Date11/08/2010
VC Plume Contour5.03.0
TCE Detection = 3 < 5 g/LTCE Detection = 1 < 3 g/L
Current Building and Number
Property Boundary
Legend
17-68
TCE Detection = < 1 g/L
Monitoring Well Location
(Color codes apply to most recent data only)
TCE Detection = 5 g/L
AGW150 (I) (90ft-BHS)ConstituentVC
Max<0.02
Max Date10/5/2009
Last<0.02
Last Date10/5/2009
AGW138 (D)ConstituentVC
Max<0.02
Max Date6/9/2010
Last<0.02
Last Date6/9/2010
AGW098R (D)ConstituentVC
Max<0.02
Max Date6/8/2010
Last<0.02
Last Date6/8/2010
AGW035 (D)ConstituentVC
Max<0.02
Max Date12/7/2009
Last<0.02
Last Date12/7/2009

TABLE 1DRILLING AND WELL INSTALLATION MATRIX
SUMMER/FALL 2010 RIBOEING AUBURN
Page 1 of 1
Date ofNorthing Easting Installation
AGW163Intermediate (East of
Building 17-07) 107361.2 1291162.6 8/26/201057.4 1 28
AGW164Intermediate (Inside
Building 17-07) 107422.3 1290598.6 8/25/201059.6 1 29
AGW165Shallow (inside Building
17-07) 107332.1 1290692.4 8/25/201028 1 55
AGW166 Intermediate 109620.7 1289600.4 10/26/2010 59.6 1 30
AGW167 Deep 109619.9 1289612.4 10/27/2010 95 0 NA
AGW168 Intermediate 110289.5 1289780.5 10/28/2010 60.5 1 29
AGW169 Deep 110289.7 1289797.1 10/29/2010 93.8 0 NA
AGW170 Intermediate 110281.9 1290219.0 11/1/2010 60.2 1 28.5
AGW171 Deep110281.4 1290255.9
11/2/2010 82.7 0 NADue to presence of fine grained
material, permanent screen was set at 82.7 ft; see boring log
AGW172 Intermediate 111557.3 1290848.4 9/2/2010 59.5 0 NA
AGW173 Intermediate
112192.1 1290877.2 9/1/2010
50.9 1 50
Due to presence of fine grained material, permanent screen was set at
50.9 ft; see boring log; Rush 24-hr sample to determine need for
AGW176
AGW174 Intermediate112216.7 1291525.9 8/23/2010
59.2 1 59Rush 24-hr sample to determine need
for AGW175
AGW175 Intermediate 112939.2 1291540.5 8/27/2010 58.2 0 NA
AGW176 Intermediate 112850.9 1290581.4 9/3/2010 59 0 NA
AGW177 Intermediate 111009.6 1289719.3 9/21/2010 58.5 1 29
AGW178 Deep 111009.5 1289729.7 9/22/2010 95 0 NA
AGW179 Intermediate
110997.7 1290314.2 9/23/2010
51 1 30Due to presence of fine grained
material, permanent screen was set at 51 ft; see boring log
AGW180 Deep
110997.4 1290320.6 9/23/2010
80.8 0 NADue to presence of fine grained
material, permanent screen was set at 80.8 ft; see boring log
ATD = At time of drilling
NA = Not applicableCoordinate System and Zone: Washington State Plane, North Zone CoordinatesHorizontal Datum: NAD 83(91), North Zone, US FEET.Vertical Datum: NGVD29, US FEET.
To convert elevations shown hereon to NAVD88 elevations please add 3.49 feet.
BGS = Below ground surface
Well Permanent Screen Depth BGS (bottom) (ft)
Borehole Sample depth
ATD NotesWell ID Description
CoordinatesNumber of
Water Samples
ATD
11/12/2010 Y:\025\164\R\RI Report\Nov 19th Data Results Report\Tables\Tbl1_Drilling Matrix_11-11-10 Landau Associates

TABLE 2GROUNDWATER ANALYTICAL RESULTS
SUMMER 2010 RIBOEING AUBURN
Page 1 of 5
AGW163-28 AGW163 AGW164-29 AGW164 AGW165-55 AGW165 AGW166-30RK90C RM88A RK90A RM88B RK90B RM88C RT87A
8/26/2010 9/15/2010 8/24/2010 9/15/2010 8/25/2010 9/15/2010 10/26/2010
VOLATILES (µg/L)Method SW8260CChloromethane 0.6 J 0.5 U 0.5 U 0.5 U 0.6 J 0.5 U 0.5 UBromomethane 1.0 U 1.0 U 1.0 U 1.0 U 1.0 U 1.0 U 1.0 UVinyl Chloride 0.2 U 0.2 U 4.5 J 0.5 0.4 J 0.2 U 0.6Chloroethane 0.2 U 0.2 U 0.2 U 0.2 U 0.2 U 0.2 U 0.2 UMethylene Chloride 0.5 U 0.5 U 0.5 U 0.5 U 0.5 U 0.5 U 0.5 UAcetone 5.0 U 5.0 U 5.9 5.0 U 7.2 5.0 U 5.0 UCarbon Disulfide 0.2 U 0.2 U 0.8 0.2 U 2.3 0.2 U 0.2 U1,1-Dichloroethene 0.2 U 0.2 U 0.2 U 0.2 U 0.2 U 0.2 U 0.2 U1,1-Dichloroethane 0.2 U 0.2 U 0.2 U 0.2 U 0.2 U 0.2 U 0.2 Utrans-1,2-Dichloroethene 0.2 U 0.2 U 0.2 0.2 U 0.2 U 0.2 U 0.2cis-1,2-Dichloroethene 0.2 U 1.0 3.9 0.6 0.2 0.9 2.5Chloroform 0.2 U 0.2 U 0.2 U 0.2 U 0.2 U 0.2 U 0.2 U1,2-Dichloroethane 0.2 U 0.2 U 0.2 U 0.2 U 0.2 U 0.2 U 0.2 U2-Butanone 5.0 U 5.0 U 5.0 U 5.0 U 5.0 U 5.0 U 5.0 U1,1,1-Trichloroethane 0.2 U 0.2 U 0.2 U 0.2 U 0.2 U 0.2 U 0.2 UCarbon Tetrachloride 0.2 U 0.2 U 0.2 U 0.2 U 0.2 U 0.2 U 0.2 UVinyl Acetate 1.0 UJ 1.0 U 1.0 UJ 1.0 U 1.0 UJ 1.0 U 1.0 UBromodichloromethane 0.2 U 0.2 U 0.2 U 0.2 U 0.2 U 0.2 U 0.2 U1,2-Dichloropropane 0.2 U 0.2 U 0.2 U 0.2 U 0.2 U 0.2 U 0.2 Ucis-1,3-Dichloropropene 0.2 U 0.2 U 0.2 U 0.2 U 0.2 U 0.2 U 0.2 UTrichloroethene 0.8 3.3 0.9 1.4 0.6 1.9 3.4Dibromochloromethane 0.2 U 0.2 U 0.2 U 0.2 U 0.2 U 0.2 U 0.2 U1,1,2-Trichloroethane 0.2 U 0.2 U 0.2 U 0.2 U 0.2 U 0.2 U 0.2 UBenzene 0.2 U 0.2 U 0.2 U 0.2 U 0.2 U 0.2 U 0.2 Utrans-1,3-Dichloropropene 0.2 U 0.2 U 0.2 U 0.2 U 0.2 U 0.2 U 0.2 U2-Chloroethylvinylether 1.0 U 1.0 U 1.0 U 1.0 U 1.0 U 1.0 U 1.0 UBromoform 0.2 U 0.2 U 0.2 U 0.2 U 0.2 U 0.2 U 0.2 U4-Methyl-2-Pentanone (MIBK) 5.0 UJ 5.0 U 5.0 UJ 5.0 U 5.0 UJ 5.0 U 5.0 U2-Hexanone 5.0 U 5.0 U 5.0 U 5.0 U 5.0 U 5.0 U 5.0 UTetrachloroethene 0.3 0.2 U 0.2 U 0.2 U 0.2 U 0.2 U 0.2 U1,1,2,2-Tetrachloroethane 0.3 0.2 U 0.2 U 0.2 U 0.2 U 0.2 U 0.2 UToluene 0.2 U 0.2 U 0.2 U 0.2 U 0.2 U 0.2 U 0.2 UChlorobenzene 0.2 U 0.2 U 0.2 U 0.2 U 0.2 U 0.2 U 0.2 UEthylbenzene 0.2 U 0.2 U 0.2 U 0.2 U 0.2 U 0.2 U 0.2 UStyrene 0.2 U 0.2 U 0.2 U 0.2 U 0.2 U 0.2 U 0.2 UTrichlorofluoromethane 0.2 U 0.2 U 0.2 U 0.2 U 0.2 U 0.2 U 0.2 U1,1,2-Trichloro-1,2,2-trifluoroethane 0.2 U 0.2 U 0.2 U 0.2 U 0.2 U 0.2 U 0.2 Um, p-Xylene 0.4 U 0.4 U 0.4 U 0.4 U 0.4 U 0.4 U 0.4 Uo-Xylene 0.2 U 0.2 U 0.2 U 0.2 U 0.2 U 0.2 U 0.2 U
VOLATILES (µg/L)Method SW8260CSIMVinyl Chloride 0.020 U 0.039 6.1 E 0.54 0.29 J 0.090 0.47Tetrachloroethene 0.30 0.055 0.020 U 0.020 U 0.020 U 0.068 0.089
11/12/2010 Y:\025\164\R\RI Report\Nov 19th Data Results Report\Tables\Tbl2 & 3_Summer 2010 RI Data Table 2 Landau Associates

TABLE 2GROUNDWATER ANALYTICAL RESULTS
SUMMER 2010 RIBOEING AUBURN
Page 2 of 5
VOLATILES (µg/L)Method SW8260CChloromethaneBromomethaneVinyl ChlorideChloroethaneMethylene ChlorideAcetoneCarbon Disulfide1,1-Dichloroethene1,1-Dichloroethanetrans-1,2-Dichloroethenecis-1,2-DichloroetheneChloroform1,2-Dichloroethane2-Butanone1,1,1-TrichloroethaneCarbon TetrachlorideVinyl AcetateBromodichloromethane1,2-Dichloropropanecis-1,3-DichloropropeneTrichloroetheneDibromochloromethane1,1,2-TrichloroethaneBenzenetrans-1,3-Dichloropropene2-ChloroethylvinyletherBromoform4-Methyl-2-Pentanone (MIBK)2-HexanoneTetrachloroethene1,1,2,2-TetrachloroethaneTolueneChlorobenzeneEthylbenzeneStyreneTrichlorofluoromethane1,1,2-Trichloro-1,2,2-trifluoroethanem, p-Xyleneo-Xylene
VOLATILES (µg/L)Method SW8260CSIMVinyl ChlorideTetrachloroethene
AGW166 AGW167 AGW168-29 AGW168 AGW169 AGW170-28.5 AGW170RV47A (a) RV47B (a) RT87B RV47C (a) RV47D(a) RU39A RV47E (a)11/08/2010 11/08/2010 10/28/2010 11/08/2010 11/08/2010 11/01/2010 11/08/2010
0.5 U 0.5 U 0.5 U 0.5 U 0.5 U 0.5 U 0.5 U1.0 U 1.0 U 1.0 U 1.0 U 1.0 U 1.0 U 1.0 U0.2 U 0.3 0.2 U 0.2 0.2 0.2 U 0.2 U0.2 U 0.2 U 0.2 U 0.2 U 0.2 U 0.2 U 0.2 U0.5 U 0.5 U 0.5 U 0.5 U 0.5 U 0.5 U 0.5 U5.0 U 5.0 U 5.1 5.0 U 5.0 U 5.0 U 5.0 U0.2 U 0.2 U 0.2 U 0.2 U 0.2 U 0.2 U 0.2 U0.2 U 0.2 U 0.2 U 0.2 U 0.2 U 0.2 U 0.2 U0.2 U 0.2 U 0.2 U 0.2 U 0.2 U 0.3 0.2 U0.2 U 0.2 0.2 U 0.2 U 0.2 U 0.2 U 0.2 U0.2 U 2.4 1.2 1.8 2.0 1.9 1.00.2 U 0.2 U 0.2 U 0.2 U 0.2 U 0.2 U 0.2 U0.2 U 0.2 U 0.2 U 0.2 U 0.2 U 0.2 U 0.2 U5.0 U 5.0 U 5.0 U 5.0 U 5.0 U 5.0 U 5.0 U0.2 U 0.2 U 0.2 U 0.2 U 0.2 U 0.2 U 0.2 U0.2 U 0.2 U 0.2 U 0.2 U 0.2 U 0.2 U 0.2 U1.0 U 1.0 U 1.0 U 1.0 U 1.0 U 1.0 U 1.0 U0.2 U 0.2 U 0.2 U 0.2 U 0.2 U 0.2 U 0.2 U0.2 U 0.2 U 0.2 U 0.2 U 0.2 U 0.2 U 0.2 U0.2 U 0.2 U 0.2 U 0.2 U 0.2 U 0.2 U 0.2 U0.2 U 3.6 3.0 4.0 5.1 3.6 3.60.2 U 0.2 U 0.2 U 0.2 U 0.2 U 0.2 U 0.2 U0.2 U 0.2 U 0.2 U 0.2 U 0.2 U 0.2 U 0.2 U0.2 U 0.2 U 0.2 U 0.2 U 0.2 U 0.2 U 0.2 U0.2 U 0.2 U 0.2 U 0.2 U 0.2 U 0.2 U 0.2 U1.0 U 1.0 U 1.0 U 1.0 U 1.0 U 1.0 U 1.0 U0.2 U 0.2 U 0.2 U 0.2 U 0.2 U 0.2 U 0.2 U5.0 U 5.0 U 5.0 U 5.0 U 5.0 U 5.0 U 5.0 U5.0 U 5.0 U 5.0 U 5.0 U 5.0 U 5.0 U 5.0 U0.2 U 0.2 U 0.2 U 0.2 U 0.2 U 0.2 U 0.2 U0.2 U 0.2 U 0.2 U 0.2 U 0.2 U 0.2 U 0.2 U0.2 U 0.2 U 0.2 U 0.2 U 0.2 U 0.2 U 0.2 U0.2 U 0.2 U 0.2 U 0.2 U 0.2 U 0.2 U 0.2 U0.2 U 0.2 U 0.2 U 0.2 U 0.2 U 0.2 U 0.2 U0.2 U 0.2 U 0.2 U 0.2 U 0.2 U 0.2 U 0.2 U0.2 U 0.2 U 0.2 U 0.2 U 0.2 U 0.2 U 0.2 U0.2 U 0.2 U 0.2 U 0.2 U 0.2 U 0.2 U 0.2 U0.4 U 0.4 U 0.4 U 0.4 U 0.4 U 0.4 U 0.4 U0.2 U 0.2 U 0.2 U 0.2 U 0.2 U 0.2 U 0.2 U
0.076 0.0690.085 0.12
11/12/2010 Y:\025\164\R\RI Report\Nov 19th Data Results Report\Tables\Tbl2 & 3_Summer 2010 RI Data Table 2 Landau Associates
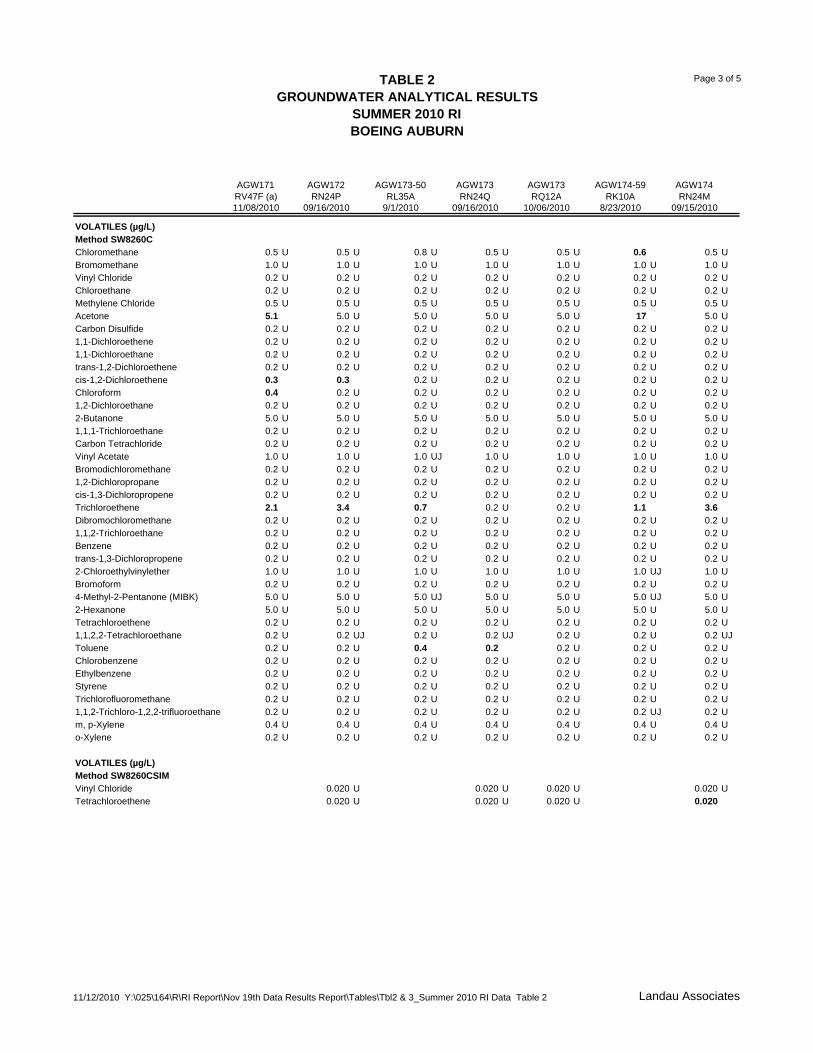
TABLE 2GROUNDWATER ANALYTICAL RESULTS
SUMMER 2010 RIBOEING AUBURN
Page 3 of 5
VOLATILES (µg/L)Method SW8260CChloromethaneBromomethaneVinyl ChlorideChloroethaneMethylene ChlorideAcetoneCarbon Disulfide1,1-Dichloroethene1,1-Dichloroethanetrans-1,2-Dichloroethenecis-1,2-DichloroetheneChloroform1,2-Dichloroethane2-Butanone1,1,1-TrichloroethaneCarbon TetrachlorideVinyl AcetateBromodichloromethane1,2-Dichloropropanecis-1,3-DichloropropeneTrichloroetheneDibromochloromethane1,1,2-TrichloroethaneBenzenetrans-1,3-Dichloropropene2-ChloroethylvinyletherBromoform4-Methyl-2-Pentanone (MIBK)2-HexanoneTetrachloroethene1,1,2,2-TetrachloroethaneTolueneChlorobenzeneEthylbenzeneStyreneTrichlorofluoromethane1,1,2-Trichloro-1,2,2-trifluoroethanem, p-Xyleneo-Xylene
VOLATILES (µg/L)Method SW8260CSIMVinyl ChlorideTetrachloroethene
AGW171 AGW172 AGW173-50 AGW173 AGW173 AGW174-59 AGW174RV47F (a) RN24P RL35A RN24Q RQ12A RK10A RN24M11/08/2010 09/16/2010 9/1/2010 09/16/2010 10/06/2010 8/23/2010 09/15/2010
0.5 U 0.5 U 0.8 U 0.5 U 0.5 U 0.6 0.5 U1.0 U 1.0 U 1.0 U 1.0 U 1.0 U 1.0 U 1.0 U0.2 U 0.2 U 0.2 U 0.2 U 0.2 U 0.2 U 0.2 U0.2 U 0.2 U 0.2 U 0.2 U 0.2 U 0.2 U 0.2 U0.5 U 0.5 U 0.5 U 0.5 U 0.5 U 0.5 U 0.5 U5.1 5.0 U 5.0 U 5.0 U 5.0 U 17 5.0 U0.2 U 0.2 U 0.2 U 0.2 U 0.2 U 0.2 U 0.2 U0.2 U 0.2 U 0.2 U 0.2 U 0.2 U 0.2 U 0.2 U0.2 U 0.2 U 0.2 U 0.2 U 0.2 U 0.2 U 0.2 U0.2 U 0.2 U 0.2 U 0.2 U 0.2 U 0.2 U 0.2 U0.3 0.3 0.2 U 0.2 U 0.2 U 0.2 U 0.2 U0.4 0.2 U 0.2 U 0.2 U 0.2 U 0.2 U 0.2 U0.2 U 0.2 U 0.2 U 0.2 U 0.2 U 0.2 U 0.2 U5.0 U 5.0 U 5.0 U 5.0 U 5.0 U 5.0 U 5.0 U0.2 U 0.2 U 0.2 U 0.2 U 0.2 U 0.2 U 0.2 U0.2 U 0.2 U 0.2 U 0.2 U 0.2 U 0.2 U 0.2 U1.0 U 1.0 U 1.0 UJ 1.0 U 1.0 U 1.0 U 1.0 U0.2 U 0.2 U 0.2 U 0.2 U 0.2 U 0.2 U 0.2 U0.2 U 0.2 U 0.2 U 0.2 U 0.2 U 0.2 U 0.2 U0.2 U 0.2 U 0.2 U 0.2 U 0.2 U 0.2 U 0.2 U2.1 3.4 0.7 0.2 U 0.2 U 1.1 3.60.2 U 0.2 U 0.2 U 0.2 U 0.2 U 0.2 U 0.2 U0.2 U 0.2 U 0.2 U 0.2 U 0.2 U 0.2 U 0.2 U0.2 U 0.2 U 0.2 U 0.2 U 0.2 U 0.2 U 0.2 U0.2 U 0.2 U 0.2 U 0.2 U 0.2 U 0.2 U 0.2 U1.0 U 1.0 U 1.0 U 1.0 U 1.0 U 1.0 UJ 1.0 U0.2 U 0.2 U 0.2 U 0.2 U 0.2 U 0.2 U 0.2 U5.0 U 5.0 U 5.0 UJ 5.0 U 5.0 U 5.0 UJ 5.0 U5.0 U 5.0 U 5.0 U 5.0 U 5.0 U 5.0 U 5.0 U0.2 U 0.2 U 0.2 U 0.2 U 0.2 U 0.2 U 0.2 U0.2 U 0.2 UJ 0.2 U 0.2 UJ 0.2 U 0.2 U 0.2 UJ0.2 U 0.2 U 0.4 0.2 0.2 U 0.2 U 0.2 U0.2 U 0.2 U 0.2 U 0.2 U 0.2 U 0.2 U 0.2 U0.2 U 0.2 U 0.2 U 0.2 U 0.2 U 0.2 U 0.2 U0.2 U 0.2 U 0.2 U 0.2 U 0.2 U 0.2 U 0.2 U0.2 U 0.2 U 0.2 U 0.2 U 0.2 U 0.2 U 0.2 U0.2 U 0.2 U 0.2 U 0.2 U 0.2 U 0.2 UJ 0.2 U0.4 U 0.4 U 0.4 U 0.4 U 0.4 U 0.4 U 0.4 U0.2 U 0.2 U 0.2 U 0.2 U 0.2 U 0.2 U 0.2 U
0.020 U 0.020 U 0.020 U 0.020 U0.020 U 0.020 U 0.020 U 0.020
11/12/2010 Y:\025\164\R\RI Report\Nov 19th Data Results Report\Tables\Tbl2 & 3_Summer 2010 RI Data Table 2 Landau Associates

TABLE 2GROUNDWATER ANALYTICAL RESULTS
SUMMER 2010 RIBOEING AUBURN
Page 4 of 5
VOLATILES (µg/L)Method SW8260CChloromethaneBromomethaneVinyl ChlorideChloroethaneMethylene ChlorideAcetoneCarbon Disulfide1,1-Dichloroethene1,1-Dichloroethanetrans-1,2-Dichloroethenecis-1,2-DichloroetheneChloroform1,2-Dichloroethane2-Butanone1,1,1-TrichloroethaneCarbon TetrachlorideVinyl AcetateBromodichloromethane1,2-Dichloropropanecis-1,3-DichloropropeneTrichloroetheneDibromochloromethane1,1,2-TrichloroethaneBenzenetrans-1,3-Dichloropropene2-ChloroethylvinyletherBromoform4-Methyl-2-Pentanone (MIBK)2-HexanoneTetrachloroethene1,1,2,2-TetrachloroethaneTolueneChlorobenzeneEthylbenzeneStyreneTrichlorofluoromethane1,1,2-Trichloro-1,2,2-trifluoroethanem, p-Xyleneo-Xylene
VOLATILES (µg/L)Method SW8260CSIMVinyl ChlorideTetrachloroethene
AGW175 AGW176 AGW176 AGW177-29 AGW177 AGW178 AGW179-30RN24N RN24A RQ12B RO29A RP15D RP15C RO29B
09/15/2010 09/14/2010 10/06/2010 09/21/2010 09/29/2010 09/29/2010 09/22/2010
0.5 U 0.5 U 0.5 U 0.5 0.5 U 0.5 U 0.51.0 U 1.0 U 1.0 U 1.0 U 1.0 U 1.0 U 1.0 U0.2 U 0.2 U 0.2 U 2.0 0.2 U 0.2 U 0.2 U0.2 U 0.2 U 0.2 U 0.2 U 0.2 U 0.2 U 0.2 U0.5 U 0.5 U 0.5 U 0.5 U 0.7 U 0.5 U 0.5 U5.0 U 5.0 U 5.0 U 5.0 U 5.0 U 5.0 U 5.0 U0.2 U 0.2 1.0 0.2 U 0.2 U 0.2 U 0.20.2 U 0.2 U 0.2 U 0.3 0.2 U 0.2 U 0.2 U0.2 U 0.2 U 0.2 U 0.5 0.2 U 0.2 U 0.50.2 U 0.2 U 0.2 U 0.2 0.2 U 0.2 U 0.2 U0.6 0.5 0.6 6.4 1.2 0.9 6.50.2 U 0.2 U 0.2 U 0.2 U 0.2 U 0.2 U 0.2 U0.2 U 0.2 U 0.2 U 0.2 U 0.2 U 0.2 U 0.2 U5.0 U 5.0 U 5.0 U 5.0 U 5.0 U 5.0 U 5.0 U0.2 U 0.2 U 0.2 U 0.2 U 0.2 U 0.2 U 0.2 U0.2 U 0.2 U 0.2 U 0.2 U 0.2 U 0.2 U 0.2 U1.0 U 1.0 U 1.0 U 1.0 U 1.0 U 1.0 U 1.0 U0.2 U 0.2 U 0.2 U 0.2 U 0.2 U 0.2 U 0.2 U0.2 U 0.2 U 0.2 U 0.2 U 0.2 U 0.2 U 0.2 U0.2 U 0.2 U 0.2 U 0.2 U 0.2 U 0.2 U 0.2 U3.4 4.7 5.4 8.6 5.2 4.5 0.2 U0.2 U 0.2 U 0.2 U 0.2 U 0.2 U 0.2 U 0.2 U0.2 U 0.2 U 0.2 U 0.2 U 0.2 U 0.2 U 0.2 U0.2 U 0.2 U 0.2 U 0.2 U 0.2 U 0.2 U 0.2 U0.2 U 0.2 U 0.2 U 0.2 U 0.2 U 0.2 U 0.2 U1.0 U 1.0 U 1.0 U 1.0 U 1.0 U 1.0 U 1.0 U0.2 U 0.2 U 0.2 U 0.2 U 0.2 U 0.2 U 0.2 U5.0 U 5.0 U 5.0 U 5.0 U 5.0 U 5.0 U 5.0 U5.0 U 5.0 U 5.0 U 5.0 U 5.0 U 5.0 U 5.0 U0.2 U 0.2 U 0.2 U 0.2 U 0.2 U 0.2 U 0.2 U0.2 UJ 0.2 U 0.2 U 0.2 U 0.2 U 0.2 U 0.2 U0.2 U 0.2 U 0.2 U 0.2 U 0.2 U 0.2 U 0.2 U0.2 U 0.2 U 0.2 U 0.2 U 0.2 U 0.2 U 0.2 U0.2 U 0.2 U 0.2 U 0.2 U 0.2 U 0.2 U 0.2 U0.2 U 0.2 U 0.2 U 0.2 U 0.2 U 0.2 U 0.2 U0.2 U 0.2 U 0.2 U 0.2 U 0.2 U 0.2 U 0.2 U0.2 U 0.2 U 0.2 U 0.2 U 0.2 U 0.2 U 0.2 U0.4 U 0.4 U 0.4 U 0.4 U 0.4 U 0.4 U 0.4 U0.2 U 0.2 U 0.2 U 0.2 U 0.2 U 0.2 U 0.2 U
0.020 U 0.020 U 0.020 U 2.0 0.053 0.088 0.0930.020 U 0.020 U 0.020 U 0.072 0.15 0.057 0.020 U
11/12/2010 Y:\025\164\R\RI Report\Nov 19th Data Results Report\Tables\Tbl2 & 3_Summer 2010 RI Data Table 2 Landau Associates

TABLE 2GROUNDWATER ANALYTICAL RESULTS
SUMMER 2010 RIBOEING AUBURN
Page 5 of 5
VOLATILES (µg/L)Method SW8260CChloromethaneBromomethaneVinyl ChlorideChloroethaneMethylene ChlorideAcetoneCarbon Disulfide1,1-Dichloroethene1,1-Dichloroethanetrans-1,2-Dichloroethenecis-1,2-DichloroetheneChloroform1,2-Dichloroethane2-Butanone1,1,1-TrichloroethaneCarbon TetrachlorideVinyl AcetateBromodichloromethane1,2-Dichloropropanecis-1,3-DichloropropeneTrichloroetheneDibromochloromethane1,1,2-TrichloroethaneBenzenetrans-1,3-Dichloropropene2-ChloroethylvinyletherBromoform4-Methyl-2-Pentanone (MIBK)2-HexanoneTetrachloroethene1,1,2,2-TetrachloroethaneTolueneChlorobenzeneEthylbenzeneStyreneTrichlorofluoromethane1,1,2-Trichloro-1,2,2-trifluoroethanem, p-Xyleneo-Xylene
VOLATILES (µg/L)Method SW8260CSIMVinyl ChlorideTetrachloroethene
AGW179 AGW180RP15B RP15A
09/29/2010 09/29/2010
0.5 U 0.5 U1.0 U 1.0 U0.2 U 0.2 U0.2 U 0.2 U0.5 U 0.5 U5.0 U 5.0 U0.2 U 0.2 U0.3 0.2 U0.6 0.30.2 U 0.2 U7.2 0.90.2 U 0.2 U0.2 U 0.2 U5.0 U 5.0 U0.2 U 0.30.2 U 0.2 U1.0 U 1.0 U0.2 U 0.2 U0.2 U 0.2 U0.2 U 0.2 U1.2 5.10.2 U 0.2 U0.2 U 0.2 U0.2 U 0.2 U0.2 U 0.2 U1.0 U 1.0 U0.2 U 0.2 U5.0 U 5.0 U5.0 U 5.0 U0.2 U 0.2 U0.2 U 0.2 U0.2 U 0.2 U0.2 U 0.2 U0.2 U 0.2 U0.2 U 0.2 U0.2 U 0.2 U0.2 U 0.2 U0.4 U 0.4 U0.2 U 0.2 U
0.10 0.020 U0.020 U 0.067
(a) Well was sampled in November 2010 outside of the 3rd quarter due to permit issuance delays.U = Indicates the compound was undetected at the reported concentration.J = Indicates the analyte was positively identified; the associated numerical value is the approximate concentration of the analyte in the sample.UJ = The analyte was not detected in the sample; the reported sample reporting limit is an estimate.E = The concentration indicated for this analyte is an estimated value above the calibration range of the instrument. This value is considered an estimate. See the SW8260C analysis result.Bold = Detected compound.
11/12/2010 Y:\025\164\R\RI Report\Nov 19th Data Results Report\Tables\Tbl2 & 3_Summer 2010 RI Data Table 2 Landau Associates

TABLE 3GROUNDWATER ANALYTICAL RESULTS
SHALLOW WELLS - 17-07 BUILDING AREABOEING AUBURN
Page 1 of 1
AGW028 AGW046 AGW047 AGW048 AGW049 AGW050RP15E RP15F RP15G RP15H RP15I RP15J
09/29/2010 09/29/2010 09/29/2010 09/29/2010 09/29/2010 09/29/2010
VOLATILES (µg/L)Method SW8260CChloromethane 0.5 U 0.5 U 0.5 U 0.5 U 0.5 U 0.7Bromomethane 1.0 U 1.0 U 1.0 U 1.0 U 1.0 U 1.0 UVinyl Chloride 0.2 U 0.2 U 0.2 U 0.2 U 0.2 U 0.2 UChloroethane 0.2 U 0.2 U 0.2 U 0.2 U 0.2 U 0.2 UMethylene Chloride 0.5 U 0.5 U 0.9 U 0.5 U 0.5 U 0.5 UAcetone 5.0 U 5.0 U 5.0 U 5.0 U 5.0 U 6.8Carbon Disulfide 0.2 U 0.2 U 0.2 U 0.2 U 0.2 U 0.2 U1,1-Dichloroethene 0.2 U 0.2 U 0.2 U 0.2 U 0.2 U 0.2 U1,1-Dichloroethane 0.2 U 0.2 U 0.2 U 0.2 U 0.2 U 0.2 Utrans-1,2-Dichloroethene 0.2 U 0.2 U 0.2 U 0.2 U 0.2 U 0.2 Ucis-1,2-Dichloroethene 0.2 0.6 0.3 0.5 0.7 0.2Chloroform 0.2 U 0.2 U 0.2 U 0.2 U 0.2 U 0.2 U1,2-Dichloroethane 0.2 U 0.2 U 0.2 U 0.2 U 0.2 U 0.2 U2-Butanone 5.0 U 5.0 U 5.0 U 5.0 U 5.0 U 5.0 U1,1,1-Trichloroethane 0.2 U 0.2 U 0.2 U 0.2 U 0.2 U 0.2 UCarbon Tetrachloride 0.2 U 0.2 U 0.2 U 0.2 U 0.2 U 0.2 UVinyl Acetate 1.0 U 1.0 U 1.0 U 1.0 U 1.0 U 1.0 UBromodichloromethane 0.2 U 0.2 U 0.2 U 0.2 U 0.2 U 0.2 U1,2-Dichloropropane 0.2 U 0.2 U 0.2 U 0.2 U 0.2 U 0.2 Ucis-1,3-Dichloropropene 0.2 U 0.2 U 0.2 U 0.2 U 0.2 U 0.2 UTrichloroethene 1.2 1.2 1.0 1.1 1.6 1.1Dibromochloromethane 0.2 U 0.2 U 0.2 U 0.2 U 0.2 U 0.2 U1,1,2-Trichloroethane 0.2 U 0.2 U 0.2 U 0.2 U 0.2 U 0.2 UBenzene 0.2 U 0.2 U 0.2 U 0.2 U 0.2 U 0.2 Utrans-1,3-Dichloropropene 0.2 U 0.2 U 0.2 U 0.2 U 0.2 U 0.2 U2-Chloroethylvinylether 1.0 U 1.0 U 1.0 U 1.0 U 1.0 U 1.0 UBromoform 0.2 U 0.2 U 0.2 U 0.2 U 0.2 U 0.2 U4-Methyl-2-Pentanone (MIBK) 5.0 U 5.0 U 5.0 U 5.0 U 5.0 U 5.0 U2-Hexanone 5.0 U 5.0 U 5.0 U 5.0 U 5.0 U 5.0 UTetrachloroethene 0.2 U 0.2 U 0.2 U 0.2 U 0.2 U 0.2 U1,1,2,2-Tetrachloroethane 0.2 U 0.2 U 0.2 U 0.2 U 0.2 U 0.2 UToluene 0.2 U 0.2 U 0.2 U 0.2 U 0.2 U 0.2 UChlorobenzene 0.2 U 0.2 U 0.2 U 0.2 U 0.2 U 0.2 UEthylbenzene 0.2 U 0.2 U 0.2 U 0.2 U 0.2 U 0.2 UStyrene 0.2 U 0.2 U 0.2 U 0.2 U 0.2 U 0.2 UTrichlorofluoromethane 0.2 U 0.2 U 0.2 U 0.2 U 0.2 U 0.2 U1,1,2-Trichloro-1,2,2-trifluoroethane 0.2 U 0.2 U 0.2 U 0.2 U 0.2 U 0.2 Um, p-Xylene 0.4 U 0.4 U 0.4 U 0.4 U 0.4 U 0.4 Uo-Xylene 0.2 U 0.2 U 0.2 U 0.2 U 0.2 U 0.2 U
VOLATILES (µg/L)Method SW8260CSIMVinyl Chloride 0.020 U 0.020 U 0.020 U 0.020 U 0.020 U 0.020 UTetrachloroethene 0.049 0.054 0.062 0.058 0.064 0.068
U = Indicates the compound was undetected at the reported concentration.UJ = The analyte was not detected in the sample; the reported sample reporting limit is an estimate.E = The concentration indicated for this analyte is an estimated value above the calibration range of the instrument. This value is considered an estimate. See the SW8260C analysis result.Bold = Detected compound.
11/12/2010 Y:\025\164\R\RI Report\Nov 19th Data Results Report\Tables\Tbl2 & 3_Summer 2010 RI Data Table 3 Landau Associates

TABLE 4SAMPLE MATRIX
THIRD QUARTER 2010BOEING AUBURN
Page 1 of 1
SampleLocation Lab ID Date VOCs VOC-SIM
AGW140 RN24H 9/14/2010 x x
AGW143 RL49E 9/1/2010 x x
AGW144 RL49D 9/1/2010 x x
AGW145 RL49C 9/1/2010 x x
AGW146 RL49B 9/1/2010 x x
AGW147 RN24I 9/14/2010 x x
AGW148 RN24J 9/14/2010 x x
AGW149 RN24K 9/14/2010 x x
AGW150 RN24G 9/14/2010 x x
AGW151 RN24O 9/15/2010 x x
AGW154 RL49H 9/1/2010 x x
AGW155 RL49G 9/1/2010 x x
AGW155-Dup RL49I 9/1/2010 x x
AGW156 RL49F 9/1/2010 x x
AGW157 RL49A 9/1/2010 x x
AGW158 RN24E 9/14/2010 x x
AGW159 RN24D 9/14/2010 x x
AGW160 RN24B 9/14/2010 x x
AGW161 RN24L 9/15/2010 x x
AGW162 RN24F 9/14/2010 x x
AGW163 RM88A 9/15/2010 x x
AGW164 RM88B 9/15/2010 x x
AGW165 RM88C 9/15/2010 x x
AGW172 RN24P 9/16/2010 x x
AGW173 RN24Q 9/16/2010 x x
AGW174 RN24M 9/15/2010 x x
AGW175 RN24N 9/15/2010 x x
AGW176 RN24A 9/14/2010 x x
AGW177 RP15D 9/29/2010 x x
AGW178 RP15C 9/29/2010 x x
AGW179 RP15B 9/29/2010 x x
AGW180 RP15A 9/29/2010 x x
AGW999 RN24C 9/14/2010 x x
11/12/2010 Y:\025\164\R\RI Report\Nov 19th Data Results Report\Tables\Tbl4,5, & 6_3Q10 Summary 3Q10 Sample Matrix Landau Associates

TABLE 5GROUNDWATER SAMPLING EVENT RESULTS
THIRD QUARTER 2010BOEING AUBURN
Page 1 of 8
AGW140 AGW143 AGW144 AGW145 AGW146 AGW147 AGW148 AGW149 AGW150RN24H RL49E RL49D RL49C RL49B RN24I RN24J RN24K RN24G
09/14/2010 9/1/2010 9/1/2010 9/1/2010 9/1/2010 09/14/2010 09/14/2010 09/14/2010 09/14/2010
VOLATILES (µg/L)Method SW8260CChloromethane 0.5 U 0.5 U 0.5 U 0.5 U 0.5 U 0.5 U 0.5 U 0.5 U 0.5 UBromomethane 1.0 U 1.0 U 1.0 U 1.0 U 1.0 U 1.0 U 1.0 U 1.0 U 1.0 UVinyl Chloride 0.7 0.2 U 0.2 1.4 0.3 0.2 U 0.2 U 0.2 U 0.2 UChloroethane 0.2 U 0.2 U 0.2 U 0.2 U 0.2 U 0.2 U 0.2 U 0.2 U 0.2 UMethylene Chloride 0.5 U 0.5 U 0.5 U 0.5 U 0.5 U 0.5 U 0.5 U 0.5 U 0.5 UAcetone 5.0 U 5.0 U 5.0 U 5.0 U 5.0 U 5.4 5.0 U 5.0 U 5.0 UCarbon Disulfide 0.2 U 0.2 U 0.2 U 0.2 U 0.2 U 0.2 U 0.2 U 0.2 U 0.2 U1,1-Dichloroethene 0.3 0.2 U 0.2 U 0.2 U 0.2 U 0.4 0.3 0.2 U 0.2 U1,1-Dichloroethane 0.4 0.2 U 0.2 U 0.2 U 0.2 U 1.1 0.4 0.2 U 0.2 Utrans-1,2-Dichloroethene 0.2 U 0.2 U 0.5 1.2 0.2 0.2 U 0.2 U 0.2 U 0.2 Ucis-1,2-Dichloroethene 3.4 0.2 U 1.9 7.5 2.0 5.1 2.0 0.8 0.2 UChloroform 0.2 U 0.2 U 0.2 U 0.2 U 0.2 U 0.2 U 0.2 U 0.2 U 0.2 U1,2-Dichloroethane 0.2 U 0.2 U 0.2 U 0.2 U 0.2 U 0.2 U 0.2 U 0.2 U 0.2 U2-Butanone 5.0 U 5.0 U 5.0 U 5.0 U 5.0 U 5.0 U 5.0 U 5.0 U 5.0 U1,1,1-Trichloroethane 0.2 U 0.2 U 0.2 U 0.2 U 0.2 U 0.2 U 0.2 U 0.2 U 0.2 UCarbon Tetrachloride 0.2 U 0.2 U 0.2 U 0.2 U 0.2 U 0.2 U 0.2 U 0.2 U 0.2 UVinyl Acetate 1.0 U 1.0 U 1.0 U 1.0 U 1.0 U 1.0 U 1.0 U 1.0 U 1.0 UBromodichloromethane 0.2 U 0.2 U 0.2 U 0.2 U 0.2 U 0.2 U 0.2 U 0.2 U 0.2 U1,2-Dichloropropane 0.2 U 0.2 U 0.2 U 0.2 U 0.2 U 0.2 U 0.2 U 0.2 U 0.2 Ucis-1,3-Dichloropropene 0.2 U 0.2 U 0.2 U 0.2 U 0.2 U 0.2 U 0.2 U 0.2 U 0.2 UTrichloroethene 5.4 0.2 U 0.9 11 3.5 0.2 U 5.0 4.6 2.3Dibromochloromethane 0.2 U 0.2 U 0.2 U 0.2 U 0.2 U 0.2 U 0.2 U 0.2 U 0.2 U1,1,2-Trichloroethane 0.2 U 0.2 U 0.2 U 0.2 U 0.2 U 0.2 U 0.2 U 0.2 U 0.2 UBenzene 0.2 U 0.2 U 0.2 U 0.2 U 0.2 U 0.2 U 0.2 U 0.2 U 0.2 Utrans-1,3-Dichloropropene 0.2 U 0.2 U 0.2 U 0.2 U 0.2 U 0.2 U 0.2 U 0.2 U 0.2 U2-Chloroethylvinylether 1.0 U 1.0 U 1.0 U 1.0 U 1.0 U 1.0 U 1.0 U 1.0 U 1.0 UBromoform 0.2 U 0.2 U 0.2 U 0.2 U 0.2 U 0.2 U 0.2 U 0.2 U 0.2 U4-Methyl-2-Pentanone (MIBK) 5.0 U 5.0 U 5.0 U 5.0 U 5.0 U 5.0 U 5.0 U 5.0 U 5.0 U2-Hexanone 5.0 U 5.0 U 5.0 U 5.0 U 5.0 U 5.0 U 5.0 U 5.0 U 5.0 UTetrachloroethene 0.2 U 0.2 U 0.2 U 0.2 U 0.2 U 0.2 U 0.2 U 0.2 U 0.2 U1,1,2,2-Tetrachloroethane 0.2 U 0.2 U 0.2 U 0.2 U 0.2 U 0.2 U 0.2 UJ 0.2 UJ 0.2 UToluene 0.2 U 0.2 U 0.2 U 0.2 U 0.2 U 0.2 U 0.2 U 0.2 U 0.2 UChlorobenzene 0.2 U 0.2 U 0.2 U 0.2 U 0.2 U 0.2 U 0.2 U 0.2 U 0.2 UEthylbenzene 0.2 U 0.2 U 0.2 U 0.2 U 0.2 U 0.2 U 0.2 U 0.2 U 0.2 UStyrene 0.2 U 0.2 U 0.2 U 0.2 U 0.2 U 0.2 U 0.2 U 0.2 U 0.2 UTrichlorofluoromethane 0.2 U 0.2 U 0.2 U 0.2 U 0.2 U 0.2 U 0.2 U 0.2 U 0.2 U1,1,2-Trichloro-1,2,2-trifluoroethane 0.2 U 0.2 U 0.2 U 0.2 U 0.2 U 0.2 U 0.2 U 0.2 U 0.2 Um,p-Xylene 0.4 U 0.4 U 0.4 U 0.4 U 0.4 U 0.4 U 0.4 U 0.4 U 0.4 Uo-Xylene 0.2 U 0.2 U 0.2 U 0.2 U 0.2 U 0.2 U 0.2 U 0.2 U 0.2 U
11/12/2010 Y:\025\164\R\RI Report\Nov 19th Data Results Report\Tables\Tbl4,5, & 6_3Q10 Summary 3Q10 All Data Landau Associates

TABLE 5GROUNDWATER SAMPLING EVENT RESULTS
THIRD QUARTER 2010BOEING AUBURN
Page 2 of 8
AGW140 AGW143 AGW144 AGW145 AGW146 AGW147 AGW148 AGW149 AGW150RN24H RL49E RL49D RL49C RL49B RN24I RN24J RN24K RN24G
09/14/2010 9/1/2010 9/1/2010 9/1/2010 9/1/2010 09/14/2010 09/14/2010 09/14/2010 09/14/2010
VOLATILES (µg/L)Method 8260C SIMVinyl Chloride 0.68 0.020 U 0.25 J 1.8 J 0.36 J 0.12 0.096 0.020 U 0.020 UTetrachloroethene 0.020 U 0.020 U 0.020 U 0.020 U 0.020 U 0.020 U 0.027 0.029 0.046
11/12/2010 Y:\025\164\R\RI Report\Nov 19th Data Results Report\Tables\Tbl4,5, & 6_3Q10 Summary 3Q10 All Data Landau Associates

TABLE 5GROUNDWATER SAMPLING EVENT RESULTS
THIRD QUARTER 2010BOEING AUBURN
Page 3 of 8
VOLATILES (µg/L)Method SW8260CChloromethaneBromomethaneVinyl ChlorideChloroethaneMethylene ChlorideAcetoneCarbon Disulfide1,1-Dichloroethene1,1-Dichloroethanetrans-1,2-Dichloroethenecis-1,2-DichloroetheneChloroform1,2-Dichloroethane2-Butanone1,1,1-TrichloroethaneCarbon TetrachlorideVinyl AcetateBromodichloromethane1,2-Dichloropropanecis-1,3-DichloropropeneTrichloroetheneDibromochloromethane1,1,2-TrichloroethaneBenzenetrans-1,3-Dichloropropene2-ChloroethylvinyletherBromoform4-Methyl-2-Pentanone (MIBK)2-HexanoneTetrachloroethene1,1,2,2-TetrachloroethaneTolueneChlorobenzeneEthylbenzeneStyreneTrichlorofluoromethane1,1,2-Trichloro-1,2,2-trifluoroethanem,p-Xyleneo-Xylene
AGW151 AGW154 AGW155 AGW155-Dup AGW156 AGW157 AGW158 AGW159 AGW160RN24O RL49H RL49G RL49I RL49F RL49A RN24E RN24D RN24B
09/15/2010 9/1/2010 9/1/2010 9/1/2010 9/1/2010 9/1/2010 09/14/2010 09/14/2010 09/14/2010
0.5 U 0.5 U 0.5 U 0.5 U 0.5 U 0.5 U 0.5 U 0.5 U 0.5 U1.0 U 1.0 U 1.0 U 1.0 U 1.0 U 1.0 U 1.0 U 1.0 U 1.0 U0.2 U 0.2 U 5.0 5.1 1.4 1.5 0.2 U 0.2 0.2 U0.2 U 0.2 U 0.2 U 0.2 U 0.2 U 0.2 U 0.2 U 0.2 U 0.2 U0.5 U 0.5 U 0.5 U 0.5 U 0.5 U 0.5 U 0.5 U 0.5 U 0.5 U5.0 U 5.0 U 5.0 U 5.0 U 5.0 U 5.0 U 5.0 U 5.0 U 5.0 U0.2 U 0.2 U 0.2 U 0.2 U 0.2 U 0.2 U 0.2 U 0.2 U 0.2 U0.2 U 0.2 U 0.2 U 0.2 U 0.2 U 0.2 U 0.2 U 0.2 U 0.2 U0.2 U 0.2 U 0.2 U 0.2 U 0.2 U 0.2 U 0.2 U 0.2 U 0.20.2 U 0.2 U 0.8 0.9 0.5 0.2 0.2 U 0.2 U 0.2 U0.2 U 0.6 6.2 6.3 4.9 2.7 0.9 1.3 0.40.2 U 0.2 U 0.2 U 0.2 U 0.2 U 0.2 U 0.2 U 0.2 U 0.2 U0.2 U 0.2 U 0.2 U 0.2 U 0.2 U 0.2 U 0.2 U 0.2 U 0.2 U5.0 U 5.0 U 5.0 U 5.0 U 5.0 U 5.0 U 5.0 U 5.0 U 5.0 U0.2 U 0.2 U 0.2 U 0.2 U 0.2 U 0.2 U 0.2 U 0.2 U 0.20.2 U 0.2 U 0.2 U 0.2 U 0.2 U 0.2 U 0.2 U 0.2 U 0.2 U1.0 U 1.0 U 1.0 U 1.0 U 1.0 U 1.0 U 1.0 U 1.0 U 1.0 U0.2 U 0.2 U 0.2 U 0.2 U 0.2 U 0.2 U 0.2 U 0.2 U 0.2 U0.2 U 0.2 U 0.2 U 0.2 U 0.2 U 0.2 U 0.2 U 0.2 U 0.2 U0.2 U 0.2 U 0.2 U 0.2 U 0.2 U 0.2 U 0.2 U 0.2 U 0.2 U0.7 0.4 0.4 0.4 5.0 3.5 3.4 5.2 4.70.2 U 0.2 U 0.2 U 0.2 U 0.2 U 0.2 U 0.2 U 0.2 U 0.2 U0.2 U 0.2 U 0.2 U 0.2 U 0.2 U 0.2 U 0.2 U 0.2 U 0.2 U0.2 U 0.2 U 0.2 U 0.2 U 0.2 U 0.2 U 0.2 U 0.2 U 0.2 U0.2 U 0.2 U 0.2 U 0.2 U 0.2 U 0.2 U 0.2 U 0.2 U 0.2 U1.0 U 1.0 U 1.0 U 1.0 U 1.0 U 1.0 U 1.0 U 1.0 U 1.0 U0.2 U 0.2 U 0.2 U 0.2 U 0.2 U 0.2 U 0.2 U 0.2 U 0.2 U5.0 U 5.0 U 5.0 U 5.0 U 5.0 U 5.0 U 5.0 U 5.0 U 5.0 U5.0 U 5.0 U 5.0 U 5.0 U 5.0 U 5.0 U 5.0 U 5.0 U 5.0 U0.2 U 0.2 U 0.2 U 0.2 U 0.2 U 0.2 U 0.2 0.2 U 0.2 U0.2 UJ 0.2 U 0.2 U 0.2 U 0.2 U 0.2 U 0.2 U 0.2 U 0.2 U0.2 U 0.2 U 0.2 U 0.2 U 0.2 U 0.2 U 0.2 U 0.2 U 0.2 U0.2 U 0.2 U 0.2 U 0.2 U 0.2 U 0.2 U 0.2 U 0.2 U 0.2 U0.2 U 0.2 U 0.2 U 0.2 U 0.2 U 0.2 U 0.2 U 0.2 U 0.2 U0.2 U 0.2 U 0.2 U 0.2 U 0.2 U 0.2 U 0.2 U 0.2 U 0.2 U0.2 U 0.2 U 0.2 U 0.2 U 0.2 U 0.2 U 0.2 U 0.2 U 0.2 U0.2 U 0.2 U 0.2 U 0.2 U 0.2 U 0.2 U 0.2 U 0.2 U 0.2 U0.4 U 0.4 U 0.4 U 0.4 U 0.4 U 0.4 U 0.4 U 0.4 U 0.4 U0.2 U 0.2 U 0.2 U 0.2 U 0.2 U 0.2 U 0.2 U 0.2 U 0.2 U
11/12/2010 Y:\025\164\R\RI Report\Nov 19th Data Results Report\Tables\Tbl4,5, & 6_3Q10 Summary 3Q10 All Data Landau Associates

TABLE 5GROUNDWATER SAMPLING EVENT RESULTS
THIRD QUARTER 2010BOEING AUBURN
Page 4 of 8
VOLATILES (µg/L)Method 8260C SIMVinyl ChlorideTetrachloroethene
AGW151 AGW154 AGW155 AGW155-Dup AGW156 AGW157 AGW158 AGW159 AGW160RN24O RL49H RL49G RL49I RL49F RL49A RN24E RN24D RN24B
09/15/2010 9/1/2010 9/1/2010 9/1/2010 9/1/2010 9/1/2010 09/14/2010 09/14/2010 09/14/2010
0.020 U 0.050 J 6.8 EJ 6.5 EJ 1.8 J 1.8 J 0.099 0.20 0.0230.020 U 0.020 U 0.020 U 0.020 U 0.020 U 0.032 J 0.25 0.058 0.020
11/12/2010 Y:\025\164\R\RI Report\Nov 19th Data Results Report\Tables\Tbl4,5, & 6_3Q10 Summary 3Q10 All Data Landau Associates

TABLE 5GROUNDWATER SAMPLING EVENT RESULTS
THIRD QUARTER 2010BOEING AUBURN
Page 5 of 8
VOLATILES (µg/L)Method SW8260CChloromethaneBromomethaneVinyl ChlorideChloroethaneMethylene ChlorideAcetoneCarbon Disulfide1,1-Dichloroethene1,1-Dichloroethanetrans-1,2-Dichloroethenecis-1,2-DichloroetheneChloroform1,2-Dichloroethane2-Butanone1,1,1-TrichloroethaneCarbon TetrachlorideVinyl AcetateBromodichloromethane1,2-Dichloropropanecis-1,3-DichloropropeneTrichloroetheneDibromochloromethane1,1,2-TrichloroethaneBenzenetrans-1,3-Dichloropropene2-ChloroethylvinyletherBromoform4-Methyl-2-Pentanone (MIBK)2-HexanoneTetrachloroethene1,1,2,2-TetrachloroethaneTolueneChlorobenzeneEthylbenzeneStyreneTrichlorofluoromethane1,1,2-Trichloro-1,2,2-trifluoroethanem,p-Xyleneo-Xylene
AGW160-Dup AGW161 AGW162 AGW163 AGW164 AGW165 AGW172 AGW173 AGW174 AGW175RN24C RN24L RN24F RM88A RM88B RM88C RN24P RN24Q RN24M RN24N
09/14/2010 09/15/2010 09/14/2010 9/15/2010 9/15/2010 9/15/2010 09/16/2010 09/16/2010 09/15/2010 09/15/2010
0.5 U 0.5 U 0.5 U 0.5 U 0.5 U 0.5 U 0.5 U 0.5 U 0.5 U 0.5 U1.0 U 1.0 U 1.0 U 1.0 U 1.0 U 1.0 U 1.0 U 1.0 U 1.0 U 1.0 U0.2 U 0.2 U 0.2 U 0.2 U 0.5 0.2 U 0.2 U 0.2 U 0.2 U 0.2 U0.2 U 0.2 U 0.2 U 0.2 U 0.2 U 0.2 U 0.2 U 0.2 U 0.2 U 0.2 U0.5 U 0.5 U 0.5 U 0.5 U 0.5 U 0.5 U 0.5 U 0.5 U 0.5 U 0.5 U5.0 U 5.0 U 5.0 U 5.0 U 5.0 U 5.0 U 5.0 U 5.0 U 5.0 U 5.0 U0.2 U 0.2 U 0.2 U 0.2 U 0.2 U 0.2 U 0.2 U 0.2 U 0.2 U 0.2 U0.2 U 0.2 U 0.2 U 0.2 U 0.2 U 0.2 U 0.2 U 0.2 U 0.2 U 0.2 U0.2 0.2 U 0.2 U 0.2 U 0.2 U 0.2 U 0.2 U 0.2 U 0.2 U 0.2 U0.2 U 0.2 U 0.2 U 0.2 U 0.2 U 0.2 U 0.2 U 0.2 U 0.2 U 0.2 U0.5 0.2 U 0.2 U 1.0 0.6 0.9 0.3 0.2 U 0.2 U 0.60.2 U 0.2 U 0.2 U 0.2 U 0.2 U 0.2 U 0.2 U 0.2 U 0.2 U 0.2 U0.2 U 0.2 U 0.2 U 0.2 U 0.2 U 0.2 U 0.2 U 0.2 U 0.2 U 0.2 U5.0 U 5.0 U 5.0 U 5.0 U 5.0 U 5.0 U 5.0 U 5.0 U 5.0 U 5.0 U0.2 0.2 U 0.2 U 0.2 U 0.2 U 0.2 U 0.2 U 0.2 U 0.2 U 0.2 U0.2 U 0.2 U 0.2 U 0.2 U 0.2 U 0.2 U 0.2 U 0.2 U 0.2 U 0.2 U1.0 U 1.0 U 1.0 U 1.0 U 1.0 U 1.0 U 1.0 U 1.0 U 1.0 U 1.0 U0.2 U 0.2 U 0.2 U 0.2 U 0.2 U 0.2 U 0.2 U 0.2 U 0.2 U 0.2 U0.2 U 0.2 U 0.2 U 0.2 U 0.2 U 0.2 U 0.2 U 0.2 U 0.2 U 0.2 U0.2 U 0.2 U 0.2 U 0.2 U 0.2 U 0.2 U 0.2 U 0.2 U 0.2 U 0.2 U4.8 2.8 0.9 3.3 1.4 1.9 3.4 0.2 U 3.6 3.40.2 U 0.2 U 0.2 U 0.2 U 0.2 U 0.2 U 0.2 U 0.2 U 0.2 U 0.2 U0.2 U 0.2 U 0.2 U 0.2 U 0.2 U 0.2 U 0.2 U 0.2 U 0.2 U 0.2 U0.2 U 0.2 U 0.2 U 0.2 U 0.2 U 0.2 U 0.2 U 0.2 U 0.2 U 0.2 U0.2 U 0.2 U 0.2 U 0.2 U 0.2 U 0.2 U 0.2 U 0.2 U 0.2 U 0.2 U1.0 U 1.0 U 1.0 U 1.0 U 1.0 U 1.0 U 1.0 U 1.0 U 1.0 U 1.0 U0.2 U 0.2 U 0.2 U 0.2 U 0.2 U 0.2 U 0.2 U 0.2 U 0.2 U 0.2 U5.0 U 5.0 U 5.0 U 5.0 U 5.0 U 5.0 U 5.0 U 5.0 U 5.0 U 5.0 U5.0 U 5.0 U 5.0 U 5.0 U 5.0 U 5.0 U 5.0 U 5.0 U 5.0 U 5.0 U0.2 U 0.2 U 0.2 U 0.2 U 0.2 U 0.2 U 0.2 U 0.2 U 0.2 U 0.2 U0.2 U 0.2 UJ 0.2 U 0.2 U 0.2 U 0.2 U 0.2 UJ 0.2 UJ 0.2 UJ 0.2 UJ0.2 U 0.2 U 0.2 U 0.2 U 0.2 U 0.2 U 0.2 U 0.2 0.2 U 0.2 U0.2 U 0.2 U 0.2 U 0.2 U 0.2 U 0.2 U 0.2 U 0.2 U 0.2 U 0.2 U0.2 U 0.2 U 0.2 U 0.2 U 0.2 U 0.2 U 0.2 U 0.2 U 0.2 U 0.2 U0.2 U 0.2 U 0.2 U 0.2 U 0.2 U 0.2 U 0.2 U 0.2 U 0.2 U 0.2 U0.2 U 0.2 U 0.2 U 0.2 U 0.2 U 0.2 U 0.2 U 0.2 U 0.2 U 0.2 U0.2 U 0.2 U 0.2 U 0.2 U 0.2 U 0.2 U 0.2 U 0.2 U 0.2 U 0.2 U0.4 U 0.4 U 0.4 U 0.4 U 0.4 U 0.4 U 0.4 U 0.4 U 0.4 U 0.4 U0.2 U 0.2 U 0.2 U 0.2 U 0.2 U 0.2 U 0.2 U 0.2 U 0.2 U 0.2 U
11/12/2010 Y:\025\164\R\RI Report\Nov 19th Data Results Report\Tables\Tbl4,5, & 6_3Q10 Summary 3Q10 All Data Landau Associates

TABLE 5GROUNDWATER SAMPLING EVENT RESULTS
THIRD QUARTER 2010BOEING AUBURN
Page 6 of 8
VOLATILES (µg/L)Method 8260C SIMVinyl ChlorideTetrachloroethene
AGW160-Dup AGW161 AGW162 AGW163 AGW164 AGW165 AGW172 AGW173 AGW174 AGW175RN24C RN24L RN24F RM88A RM88B RM88C RN24P RN24Q RN24M RN24N
09/14/2010 09/15/2010 09/14/2010 9/15/2010 9/15/2010 9/15/2010 09/16/2010 09/16/2010 09/15/2010 09/15/2010
0.023 0.020 U 0.020 U 0.039 0.54 0.090 0.020 U 0.020 U 0.020 U 0.020 U0.021 0.048 0.021 0.055 0.020 U 0.068 0.020 U 0.020 U 0.020 0.020 U
11/12/2010 Y:\025\164\R\RI Report\Nov 19th Data Results Report\Tables\Tbl4,5, & 6_3Q10 Summary 3Q10 All Data Landau Associates

TABLE 5GROUNDWATER SAMPLING EVENT RESULTS
THIRD QUARTER 2010BOEING AUBURN
Page 7 of 8
VOLATILES (µg/L)Method SW8260CChloromethaneBromomethaneVinyl ChlorideChloroethaneMethylene ChlorideAcetoneCarbon Disulfide1,1-Dichloroethene1,1-Dichloroethanetrans-1,2-Dichloroethenecis-1,2-DichloroetheneChloroform1,2-Dichloroethane2-Butanone1,1,1-TrichloroethaneCarbon TetrachlorideVinyl AcetateBromodichloromethane1,2-Dichloropropanecis-1,3-DichloropropeneTrichloroetheneDibromochloromethane1,1,2-TrichloroethaneBenzenetrans-1,3-Dichloropropene2-ChloroethylvinyletherBromoform4-Methyl-2-Pentanone (MIBK)2-HexanoneTetrachloroethene1,1,2,2-TetrachloroethaneTolueneChlorobenzeneEthylbenzeneStyreneTrichlorofluoromethane1,1,2-Trichloro-1,2,2-trifluoroethanem,p-Xyleneo-Xylene
AGW176 AGW177 AGW178 AGW179 AGW180RN24A RP15D RP15C RP15B RP15A
09/14/2010 09/29/2010 09/29/2010 09/29/2010 09/29/2010
0.5 U 0.5 U 0.5 U 0.5 U 0.5 U1.0 U 1.0 U 1.0 U 1.0 U 1.0 U0.2 U 0.2 U 0.2 U 0.2 U 0.2 U0.2 U 0.2 U 0.2 U 0.2 U 0.2 U0.5 U 0.7 U 0.5 U 0.5 U 0.5 U5.0 U 5.0 U 5.0 U 5.0 U 5.0 U0.2 0.2 U 0.2 U 0.2 U 0.2 U0.2 U 0.2 U 0.2 U 0.3 0.2 U0.2 U 0.2 U 0.2 U 0.6 0.30.2 U 0.2 U 0.2 U 0.2 U 0.2 U0.5 1.2 0.9 7.2 0.90.2 U 0.2 U 0.2 U 0.2 U 0.2 U0.2 U 0.2 U 0.2 U 0.2 U 0.2 U5.0 U 5.0 U 5.0 U 5.0 U 5.0 U0.2 U 0.2 U 0.2 U 0.2 U 0.30.2 U 0.2 U 0.2 U 0.2 U 0.2 U1.0 U 1.0 U 1.0 U 1.0 U 1.0 U0.2 U 0.2 U 0.2 U 0.2 U 0.2 U0.2 U 0.2 U 0.2 U 0.2 U 0.2 U0.2 U 0.2 U 0.2 U 0.2 U 0.2 U4.7 5.2 4.5 1.2 5.10.2 U 0.2 U 0.2 U 0.2 U 0.2 U0.2 U 0.2 U 0.2 U 0.2 U 0.2 U0.2 U 0.2 U 0.2 U 0.2 U 0.2 U0.2 U 0.2 U 0.2 U 0.2 U 0.2 U1.0 U 1.0 U 1.0 U 1.0 U 1.0 U0.2 U 0.2 U 0.2 U 0.2 U 0.2 U5.0 U 5.0 U 5.0 U 5.0 U 5.0 U5.0 U 5.0 U 5.0 U 5.0 U 5.0 U0.2 U 0.2 U 0.2 U 0.2 U 0.2 U0.2 U 0.2 U 0.2 U 0.2 U 0.2 U0.2 U 0.2 U 0.2 U 0.2 U 0.2 U0.2 U 0.2 U 0.2 U 0.2 U 0.2 U0.2 U 0.2 U 0.2 U 0.2 U 0.2 U0.2 U 0.2 U 0.2 U 0.2 U 0.2 U0.2 U 0.2 U 0.2 U 0.2 U 0.2 U0.2 U 0.2 U 0.2 U 0.2 U 0.2 U0.4 U 0.4 U 0.4 U 0.4 U 0.4 U0.2 U 0.2 U 0.2 U 0.2 U 0.2 U
11/12/2010 Y:\025\164\R\RI Report\Nov 19th Data Results Report\Tables\Tbl4,5, & 6_3Q10 Summary 3Q10 All Data Landau Associates

TABLE 5GROUNDWATER SAMPLING EVENT RESULTS
THIRD QUARTER 2010BOEING AUBURN
Page 8 of 8
VOLATILES (µg/L)Method 8260C SIMVinyl ChlorideTetrachloroethene
AGW176 AGW177 AGW178 AGW179 AGW180RN24A RP15D RP15C RP15B RP15A
09/14/2010 09/29/2010 09/29/2010 09/29/2010 09/29/2010
0.020 U 0.053 0.088 0.10 0.020 U0.020 U 0.15 0.057 0.020 U 0.067
U = Indicates the compound was undetected at the reported concentration.J = Indicates the analyte was positively identified; the associated numerical value is the approximate concentration of the analyte in the sample.UJ = The analyte was not detected in the sample; the reported sample reporting limit is an estimate.E = The concentration indicated for this analyte is an estimated value above the calibration range of the instrument. This value is considered an estimate. See the SW8260C analysis result.Bold = Detected compound.
11/12/2010 Y:\025\164\R\RI Report\Nov 19th Data Results Report\Tables\Tbl4,5, & 6_3Q10 Summary 3Q10 All Data Landau Associates

TABLE 6GROUNDWATER SAMPLING EVENT RESULTS
DETECTED ANALYTES ONLYTHIRD QUARTER 2010
BOEING AUBURN
Page 1 of 4
AGW140 AGW143 AGW144 AGW145 AGW146 AGW147 AGW148 AGW149 AGW150RN24H RL49E RL49D RL49C RL49B RN24I RN24J RN24K RN24G
09/14/2010 9/1/2010 9/1/2010 9/1/2010 9/1/2010 09/14/2010 09/14/2010 09/14/2010 09/14/2010
VOLATILES (µg/L)
Method SW8260C
Vinyl Chloride 0.7 0.2 U 0.2 1.4 0.3 0.2 U 0.2 U 0.2 U 0.2 U
Carbon Disulfide 0.2 U 0.2 U 0.2 U 0.2 U 0.2 U 0.2 U 0.2 U 0.2 U 0.2 U
1,1-Dichloroethene 0.3 0.2 U 0.2 U 0.2 U 0.2 U 0.4 0.3 0.2 U 0.2 U
1,1-Dichloroethane 0.4 0.2 U 0.2 U 0.2 U 0.2 U 1.1 0.4 0.2 U 0.2 U
trans-1,2-Dichloroethene 0.2 U 0.2 U 0.5 1.2 0.2 0.2 U 0.2 U 0.2 U 0.2 U
cis-1,2-Dichloroethene 3.4 0.2 U 1.9 7.5 2.0 5.1 2.0 0.8 0.2 U
1,1,1-Trichloroethane 0.2 U 0.2 U 0.2 U 0.2 U 0.2 U 0.2 U 0.2 U 0.2 U 0.2 U
Trichloroethene 5.4 0.2 U 0.9 11 3.5 0.2 U 5.0 4.6 2.3
Tetrachloroethene 0.2 U 0.2 U 0.2 U 0.2 U 0.2 U 0.2 U 0.2 U 0.2 U 0.2 U
Toluene 0.2 U 0.2 U 0.2 U 0.2 U 0.2 U 0.2 U 0.2 U 0.2 U 0.2 U
VOLATILES (µg/L)
Method 8260C SIM
Vinyl Chloride 0.68 0.020 U 0.25 J 1.8 J 0.36 J 0.12 0.096 0.020 U 0.020 U
Tetrachloroethene 0.020 U 0.020 U 0.020 U 0.020 U 0.020 U 0.020 U 0.027 0.029 0.046
11/12/2010 Y:\025\164\R\RI Report\Nov 19th Data Results Report\Tables\Tbl4,5, & 6_3Q10 Summary 3Q10 Detects Landau Associates
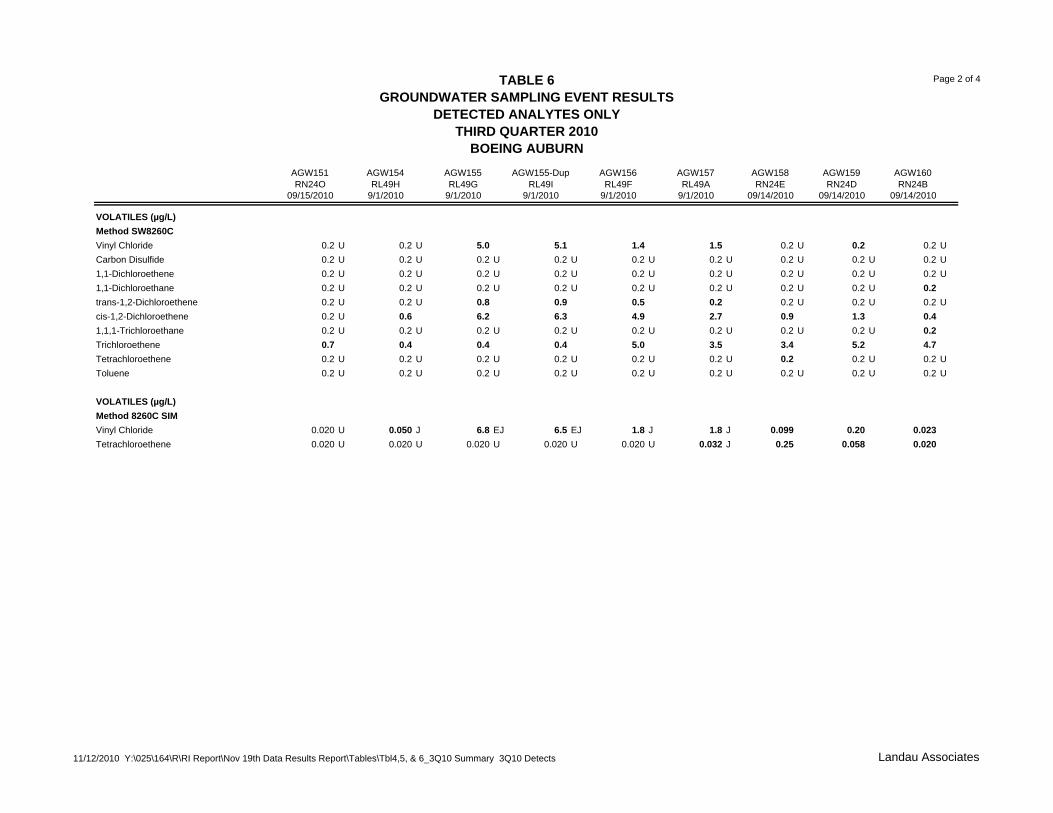
TABLE 6GROUNDWATER SAMPLING EVENT RESULTS
DETECTED ANALYTES ONLYTHIRD QUARTER 2010
BOEING AUBURN
Page 2 of 4
VOLATILES (µg/L)
Method SW8260C
Vinyl Chloride
Carbon Disulfide
1,1-Dichloroethene
1,1-Dichloroethane
trans-1,2-Dichloroethene
cis-1,2-Dichloroethene
1,1,1-Trichloroethane
Trichloroethene
Tetrachloroethene
Toluene
VOLATILES (µg/L)
Method 8260C SIM
Vinyl Chloride
Tetrachloroethene
AGW151 AGW154 AGW155 AGW155-Dup AGW156 AGW157 AGW158 AGW159 AGW160RN24O RL49H RL49G RL49I RL49F RL49A RN24E RN24D RN24B
09/15/2010 9/1/2010 9/1/2010 9/1/2010 9/1/2010 9/1/2010 09/14/2010 09/14/2010 09/14/2010
0.2 U 0.2 U 5.0 5.1 1.4 1.5 0.2 U 0.2 0.2 U
0.2 U 0.2 U 0.2 U 0.2 U 0.2 U 0.2 U 0.2 U 0.2 U 0.2 U
0.2 U 0.2 U 0.2 U 0.2 U 0.2 U 0.2 U 0.2 U 0.2 U 0.2 U
0.2 U 0.2 U 0.2 U 0.2 U 0.2 U 0.2 U 0.2 U 0.2 U 0.2
0.2 U 0.2 U 0.8 0.9 0.5 0.2 0.2 U 0.2 U 0.2 U
0.2 U 0.6 6.2 6.3 4.9 2.7 0.9 1.3 0.4
0.2 U 0.2 U 0.2 U 0.2 U 0.2 U 0.2 U 0.2 U 0.2 U 0.2
0.7 0.4 0.4 0.4 5.0 3.5 3.4 5.2 4.7
0.2 U 0.2 U 0.2 U 0.2 U 0.2 U 0.2 U 0.2 0.2 U 0.2 U
0.2 U 0.2 U 0.2 U 0.2 U 0.2 U 0.2 U 0.2 U 0.2 U 0.2 U
0.020 U 0.050 J 6.8 EJ 6.5 EJ 1.8 J 1.8 J 0.099 0.20 0.023
0.020 U 0.020 U 0.020 U 0.020 U 0.020 U 0.032 J 0.25 0.058 0.020
11/12/2010 Y:\025\164\R\RI Report\Nov 19th Data Results Report\Tables\Tbl4,5, & 6_3Q10 Summary 3Q10 Detects Landau Associates

TABLE 6GROUNDWATER SAMPLING EVENT RESULTS
DETECTED ANALYTES ONLYTHIRD QUARTER 2010
BOEING AUBURN
Page 3 of 4
VOLATILES (µg/L)
Method SW8260C
Vinyl Chloride
Carbon Disulfide
1,1-Dichloroethene
1,1-Dichloroethane
trans-1,2-Dichloroethene
cis-1,2-Dichloroethene
1,1,1-Trichloroethane
Trichloroethene
Tetrachloroethene
Toluene
VOLATILES (µg/L)
Method 8260C SIM
Vinyl Chloride
Tetrachloroethene
AGW160-Dup AGW161 AGW162 AGW163 AGW164 AGW165 AGW172 AGW173 AGW174 AGW175RN24C RN24L RN24F RM88A RM88B RM88C RN24P RN24Q RN24M RN24N
09/14/2010 09/15/2010 09/14/2010 9/15/2010 9/15/2010 9/15/2010 09/16/2010 09/16/2010 09/15/2010 09/15/2010
0.2 U 0.2 U 0.2 U 0.2 U 0.5 0.2 U 0.2 U 0.2 U 0.2 U 0.2 U
0.2 U 0.2 U 0.2 U 0.2 U 0.2 U 0.2 U 0.2 U 0.2 U 0.2 U 0.2 U
0.2 U 0.2 U 0.2 U 0.2 U 0.2 U 0.2 U 0.2 U 0.2 U 0.2 U 0.2 U
0.2 0.2 U 0.2 U 0.2 U 0.2 U 0.2 U 0.2 U 0.2 U 0.2 U 0.2 U
0.2 U 0.2 U 0.2 U 0.2 U 0.2 U 0.2 U 0.2 U 0.2 U 0.2 U 0.2 U
0.5 0.2 U 0.2 U 1.0 0.6 0.9 0.3 0.2 U 0.2 U 0.6
0.2 0.2 U 0.2 U 0.2 U 0.2 U 0.2 U 0.2 U 0.2 U 0.2 U 0.2 U
4.8 2.8 0.9 3.3 1.4 1.9 3.4 0.2 U 3.6 3.4
0.2 U 0.2 U 0.2 U 0.2 U 0.2 U 0.2 U 0.2 U 0.2 U 0.2 U 0.2 U
0.2 U 0.2 U 0.2 U 0.2 U 0.2 U 0.2 U 0.2 U 0.2 0.2 U 0.2 U
0.023 0.020 U 0.020 U 0.039 0.54 0.090 0.020 U 0.020 U 0.020 U 0.020 U
0.021 0.048 0.021 0.055 0.020 U 0.068 0.020 U 0.020 U 0.020 0.020 U
11/12/2010 Y:\025\164\R\RI Report\Nov 19th Data Results Report\Tables\Tbl4,5, & 6_3Q10 Summary 3Q10 Detects Landau Associates

TABLE 6GROUNDWATER SAMPLING EVENT RESULTS
DETECTED ANALYTES ONLYTHIRD QUARTER 2010
BOEING AUBURN
Page 4 of 4
VOLATILES (µg/L)
Method SW8260C
Vinyl Chloride
Carbon Disulfide
1,1-Dichloroethene
1,1-Dichloroethane
trans-1,2-Dichloroethene
cis-1,2-Dichloroethene
1,1,1-Trichloroethane
Trichloroethene
Tetrachloroethene
Toluene
VOLATILES (µg/L)
Method 8260C SIM
Vinyl Chloride
Tetrachloroethene
AGW176 AGW177 AGW178 AGW179 AGW180RN24A RP15D RP15C RP15B RP15A
09/14/2010 09/29/2010 09/29/2010 09/29/2010 09/29/2010
0.2 U 0.2 U 0.2 U 0.2 U 0.2 U
0.2 0.2 U 0.2 U 0.2 U 0.2 U
0.2 U 0.2 U 0.2 U 0.3 0.2 U
0.2 U 0.2 U 0.2 U 0.6 0.3
0.2 U 0.2 U 0.2 U 0.2 U 0.2 U
0.5 1.2 0.9 7.2 0.9
0.2 U 0.2 U 0.2 U 0.2 U 0.3
4.7 5.2 4.5 1.2 5.1
0.2 U 0.2 U 0.2 U 0.2 U 0.2 U
0.2 U 0.2 U 0.2 U 0.2 U 0.2 U
0.020 U 0.053 0.088 0.10 0.020 U
0.020 U 0.15 0.057 0.020 U 0.067
U = Indicates the compound was undetected at the reported concentration.
J = Indicates the analyte was positively identified; the associated numerical value is the approximate concentration
of the analyte in the sample.
UJ = The analyte was not detected in the sample; the reported sample reporting limit is an estimate.
E = The concentration indicated for this analyte is an estimated value above the calibration range of the instrument.
This value is considered an estimate. See the SW8260C analysis result.
Bold = Detected compound.
11/12/2010 Y:\025\164\R\RI Report\Nov 19th Data Results Report\Tables\Tbl4,5, & 6_3Q10 Summary 3Q10 Detects Landau Associates

APPENDIX A
Boring Logs

A-1(1 of 2)
Boeing AuburnRemedial InvestigationAuburn, Washington
1. USCS letter symbols correspond to symbols used by the Unified Soil Classification System and ASTM classification methods. Dual letter symbols (e.g.,SP-SM for sand or gravel) indicate soil with an estimated 5-15% fines. Multiple letter symbols (e.g., ML/CL) indicate borderline or multiple soil classifications.
2. Soil descriptions are based on the general approach presented in the Standard Practice for Description and Identification of Soils (Visual-Manual Procedure),outlined in ASTM D 2488. Where laboratory index testing has been conducted, soil classifications are based on the Standard Test Method for Classificationof Soils for Engineering Purposes, as outlined in ASTM D 2487.
3. Soil description terminology is based on visual estimates (in the absence of laboratory test data) of the percentages of each soil type and is defined as follows:
NOTES:
> 30% and <> 15% and <> 5% and <
<
50% - "GRAVEL," "SAND," "SILT," "CLAY," etc. 50% - "very gravelly," "very sandy," "very silty," etc. 30% - "gravelly," "sandy," "silty," etc. 15% - "with gravel," "with sand," "with silt," etc. 5% - "trace gravel," "trace sand," "trace silt," etc., or not noted.
> _ _ _ _
Primary Constituent:Secondary Constituents:
Additional Constituents:
GRAVEL ANDGRAVELLY SOIL
SP
MH
(Liquid limit greater than 50)
(Little or no fines)
GRAVEL WITH FINES(Appreciable amount of
fines)
(Little or no fines)CLEAN SAND
SAND WITH FINES(Appreciable amount of
fines)
SM
SC
CL
GW
CH
SILT AND CLAY
(More than 50% ofcoarse fraction retained
on No. 4 sieve)
(More than 50% ofcoarse fraction passedthrough No. 4 sieve)
GRAPHICSYMBOL
GP
Soil Classification System
SILT AND CLAY
Poorly graded sand; gravelly sand; little or no fines
Silty sand; sand/silt mixture(s)
Clayey sand; sand/clay mixture(s)
MAJORDIVISIONS
Silty gravel; gravel/sand/silt mixture(s)
Clayey gravel; gravel/sand/clay mixture(s)GC
SW
ML
HIGHLY ORGANIC SOIL
CLEAN GRAVEL
Inorganic clay of low to medium plasticity; gravelly clay; sandyclay; silty clay; lean clay
Organic silt; organic, silty clay of low plasticity
Inorganic clay of high plasticity; fat clay
WOOD
DEBRIS
Peat; humus; swamp soil with high organic content
OL
CO
AR
SE
-GR
AIN
ED
SO
IL(M
ore
than
50%
of m
ater
ial i
sla
rger
than
No.
200
sie
ve s
ize) Poorly graded gravel; gravel/sand mixture(s); little or no fines
Inorganic silt; micaceous or diatomaceous fine sand
Well-graded sand; gravelly sand; little or no fines
(Liquid limit less than 50)
Well-graded gravel; gravel/sand mixture(s); little or no fines
(Mor
e th
an 5
0% o
f mat
eria
lis
sm
alle
r th
an N
o. 2
00 s
ieve
size
)
FIN
E-G
RA
INE
D S
OIL
Inorganic silt and very fine sand; rock flour; silty or clayey finesand or clayey silt with slight plasticity
PT
OH
SAND ANDSANDY SOIL
GM
Organic clay of medium to high plasticity; organic silt
TYPICALDESCRIPTIONS (2)(3)
USCSLETTER
SYMBOL(1)
Rock (See Rock Classification)
Wood, lumber, wood chips
Construction debris, garbage
PAVEMENT
WD
OTHER MATERIALS TYPICAL DESCRIPTIONS
ROCK
GRAPHICSYMBOL
Asphalt concrete pavement or Portland cement pavement
DB
AC or PC
RK
LETTERSYMBOL
Soil Classification System and KeyFigure
. 11
/12/
10 Y
:\025
\164
\T\A
UB
UR
N B
OR
ING
S A
ND
WE
LLS
\BO
RIN
G A
ND
WE
LL L
OG
S\0
2516
4 -
MA
ST
ER
FIL
E.G
PJ
SC
S W
SD
OT
1O
F2

A-1(2 of 2)
Boeing AuburnRemedial InvestigationAuburn, Washington
Well Log Graphics
Bentonite Chips
Above-GroundMonument
Groundwater
Sample Depth Interval
Recovery Depth Interval
Sample Identification Number
Code Description Code
PVC Screen(0.010-inch Slot Size)
Description
Pocket Penetrometer, tsfTorvane, tsfPhotoionization Detector VOC screening, ppmMoisture Content, %Dry Density, pcfMaterial smaller than No. 200 sieve, %Grain Size - See separate figure for dataAtterberg Limits - See separate figure for dataVane Shear TestOther Geotechnical TestingChemical Analysis
Approximate water elevation at time of drilling (ATD).
Note:
Approximate water elevation at other time(s). When multiple water levels are obtainedother than ATD, only a representative range is shown. See text for additionalinformation.
1
Flush-MountMonument
10-20 Sand PVC Blank Casing
PP = 1.0TV = 0.5
PID = 100W = 10D = 120
-200 = 60GSAL
VSTGTCA
Groundwater levels can fluctuate due to precipitation, seasonal conditions, and otherfactors.
Slough Backfill
Bentonite Grout
End Cap
SAMPLER TYPE SAMPLE NUMBER & INTERVAL
3.25-inch O.D., 2.42-inch I.D. Split Spoon2.00-inch O.D., 1.50-inch I.D. Split SpoonShelby TubeGrab SampleSingle-Tube Core BarrelDouble-Tube Core BarrelOther - See text if applicable300-lb Hammer, 30-inch Drop140-lb Hammer, 30-inch DropPushedRotosonicAir Rotary (Rock)Wash Rotary (Rock)Other - See text if applicable
abcdefg1234567
Field and Lab Test DataDrilling and Sampling Key
Portion of Sample Retainedfor Archive or Analysis
VWP
Soil Classification System and KeyFigure
. 11
/12/
10 Y
:\025
\164
\T\A
UB
UR
N B
OR
ING
S A
ND
WE
LLS
\BO
RIN
G A
ND
WE
LL L
OG
S\0
2516
4 -
MA
ST
ER
FIL
E.G
PJ
SC
S W
SD
OT
2O
F2

d
i4
d
d
i4d
d
i4
d
d
ACSP
SP-SM
GP
SP-SM
GP
SP
SP
GP
SP
SP
4-inches asphalt concrete pavement
Gray, very gravelly, fine to coarse SANDwith trace silt (medium dense, damp)
Gray, very gravelly, fine to coarse SANDwith silt (medium dense, damp)
Brown, very sandy, fine GRAVEL with tracesilt (medium dense, damp)
Dark gray, very gravelly, fine to coarseSAND with silt (medium dense, moist)
Grayish-brown, fine to coarse GRAVEL withsand (medium dense, wet)
Brown, fine to coarse SAND (mediumdense, wet)
- grades with trace gravel
Dark gray, gravelly, medium to coarseSAND (medium dense, wet)
Dark gray, sandy, fine to coarse GRAVEL(medium dense, wet)
- grades brown
Brownish-gray, fine to medium SAND(medium dense, wet)
Dark gray, fine to coarse SAND with tracesilt (medium dense, wet)
- with trace gravel
S-1
Run 1
S-2
S-3
Run 2S-4
S-5
Run 3
S-6
S-7
SPT N-Value
10 20 30 40
Moisture Content (%)
5 10 15 20
Fines Content (%)
5 10 15 20
(DO
E#:
BB
P23
5)W
EL
L D
ET
AIL
0
5
10
15
20
25
30
35
Ele
vatio
n (f
t)
85
80
75
70
65
60
55
Notes:
Sam
pler
Typ
e
Blo
ws/
Foo
t
Tes
t D
ata
LiquidLimit
Sam
ple
Num
ber
& I
nter
val
Non-Standard N-Value
Gra
phic
Sym
bol
Dep
th (
ft)
US
CS
Sym
bol
Drilled By:
SOIL PROFILE
Ground Elevation (ft):
Drilling Method:
Boart Longyear
SAMPLE DATA
Rotosonic
PlasticLimit
1. Stratigraphic contacts are based on field interpretations and are approximate.2. Reference to the text of this report is necessary for a proper understanding of subsurface conditions.3. Refer to "Soil Classification System and Key" figure for explanation of graphics and symbols.4. DOE Unique Well Number: BBP235
0251
64.
11/1
2/1
0 Y
:\025
\164
\T\A
UB
UR
N B
OR
ING
S A
ND
WE
LLS
\BO
RIN
G A
ND
WE
LL L
OG
S\0
2516
4 -
MA
ST
ER
FIL
E.G
PJ
SO
IL B
OR
ING
LO
G W
ITH
GR
AP
H
AGW163
86.40
Log of Boring AGW163 A-2(1 of 2)
Figure
0251
64.
11/1
2/1
0 Y
:\025
\164
\T\A
UB
UR
N B
OR
ING
S A
ND
WE
LLS
\BO
RIN
G A
ND
WE
LL L
OG
S\0
2516
4 -
MA
ST
ER
FIL
E.G
PJ
SO
IL B
OR
ING
LO
G W
ITH
GR
AP
H
Boeing AuburnRemedial InvestigationAuburn, Washington
AT
D

d
i4
d
d
i4
d
SP
GP
SM
SP-SM
SM
GM
SP
SM
Dark gray, fine to coarse SAND with tracesilt (medium dense, wet)
- grades gravelly
Brown, fine to coarse GRAVEL with tracesand (dense, wet)
Gray, very silty, fine SAND (medium dense,wet)
Gray, fine SAND with silt (medium dense,wet)
Gray, very silty, fine SAND (medium dense,wet)
Brownish-gray, silty, sandy, fine to coarseGRAVEL (dense, wet)
- grades with iron oxide staining
Brown, fine to coarse SAND with gravel(dense, wet)
Brown, silty, gravelly, fine to coarse SAND(dense, wet)
S-8
Run 4
S-9
S-10
Run 5
S-11
Boring Completed 08/26/10. Total Depth of Boring = 60.0 ft.Monitoring Well Completed 08/26/10Total Depth of Monitoring Well = 57.4 ft.
SPT N-Value
10 20 30 40
Moisture Content (%)
5 10 15 20
Fines Content (%)
5 10 15 20
(DO
E#:
BB
P23
5)W
EL
L D
ET
AIL
35
40
45
50
55
60
65
70
Ele
vatio
n (f
t)
50
45
40
35
30
Notes:
Sam
pler
Typ
e
Blo
ws/
Foo
t
Tes
t D
ata
LiquidLimit
Sam
ple
Num
ber
& I
nter
val
Non-Standard N-Value
Gra
phic
Sym
bol
Dep
th (
ft)
US
CS
Sym
bol
Drilled By:
SOIL PROFILE
Ground Elevation (ft):
Drilling Method:
Boart Longyear
SAMPLE DATA
Rotosonic
PlasticLimit
1. Stratigraphic contacts are based on field interpretations and are approximate.2. Reference to the text of this report is necessary for a proper understanding of subsurface conditions.3. Refer to "Soil Classification System and Key" figure for explanation of graphics and symbols.4. DOE Unique Well Number: BBP235
0251
64.
11/1
2/1
0 Y
:\025
\164
\T\A
UB
UR
N B
OR
ING
S A
ND
WE
LLS
\BO
RIN
G A
ND
WE
LL L
OG
S\0
2516
4 -
MA
ST
ER
FIL
E.G
PJ
SO
IL B
OR
ING
LO
G W
ITH
GR
AP
H
AGW163
86.40
Log of Boring AGW163 A-2(2 of 2)
Figure
0251
64.
11/1
2/1
0 Y
:\025
\164
\T\A
UB
UR
N B
OR
ING
S A
ND
WE
LLS
\BO
RIN
G A
ND
WE
LL L
OG
S\0
2516
4 -
MA
ST
ER
FIL
E.G
PJ
SO
IL B
OR
ING
LO
G W
ITH
GR
AP
H
Boeing AuburnRemedial InvestigationAuburn, Washington

d
i4
d
i4
d
i4
d
i4d
d
PC
SMGPSP-SM
SP
GP
SP
SP
MLSP
Portland concrete cement
Grayish-brown, silty, fine to medium SAND(medium dense, damp)
Gray, coarse GRAVEL (medium dense,damp)
Brown, gravelly, fine to coarse SAND withsilt (dense, moist)
Brown, fine to medium SAND with trace silt(dense, moist)
Brown, sandy to very sandy, fine to coarseGRAVEL (dense, moist)
- grades wet
Dark gray, fine to medium SAND with verysandy silt lenses (dense, wet)
- grades without silt lenses, wet
- grades gravelly
- grades very gravelly, fine to coarse SAND
Dark gray, gravelly, fine to coarse SANDwith trace silt (dense, wet)
- grades without gravel
Dark gray, sandy SILT (very stiff, wet)
S-1
Run 1
S-2
Run 2
S-3
Run 3
S-4
Run 4S-5
S-6
SPT N-Value
10 20 30 40
Moisture Content (%)
5 10 15 20
Fines Content (%)
5 10 15 20
(DO
E#:
BB
P23
3)W
EL
L D
ET
AIL
0
5
10
15
20
25
30
35
Ele
vatio
n (f
t)
85
80
75
70
65
60
55
Notes:
Sam
pler
Typ
e
Blo
ws/
Foo
t
Tes
t D
ata
LiquidLimit
Sam
ple
Num
ber
& I
nter
val
Non-Standard N-Value
Gra
phic
Sym
bol
Dep
th (
ft)
US
CS
Sym
bol
Drilled By:
SOIL PROFILE
Ground Elevation (ft):
Drilling Method:
Boart Longyear
SAMPLE DATA
Rotosonic
PlasticLimit
1. Stratigraphic contacts are based on field interpretations and are approximate.2. Reference to the text of this report is necessary for a proper understanding of subsurface conditions.3. Refer to "Soil Classification System and Key" figure for explanation of graphics and symbols.4. DOE Unique Well Number: BBP233
0251
64.
11/1
2/1
0 Y
:\025
\164
\T\A
UB
UR
N B
OR
ING
S A
ND
WE
LLS
\BO
RIN
G A
ND
WE
LL L
OG
S\0
2516
4 -
MA
ST
ER
FIL
E.G
PJ
SO
IL B
OR
ING
LO
G W
ITH
GR
AP
H
AGW164
86.52
Log of Boring AGW164 A-3(1 of 2)
Figure
0251
64.
11/1
2/1
0 Y
:\025
\164
\T\A
UB
UR
N B
OR
ING
S A
ND
WE
LLS
\BO
RIN
G A
ND
WE
LL L
OG
S\0
2516
4 -
MA
ST
ER
FIL
E.G
PJ
SO
IL B
OR
ING
LO
G W
ITH
GR
AP
H
Boeing AuburnRemedial InvestigationAuburn, Washington
AT
D

d
i4
d
d
d
i4
d
SP
SP
SP-SMSM
PTSM
SP
SM
GP-GM
GPGM
Dark gray, fine to medium SAND with tracesilt (dense, wet)
dark gray, very gravelly, fine to coarseSAND (medium dense, wet)
Dark gray, fine to medium SAND with silt(dense, wet)
Dark gray, very silty, fine to medium SANDwith organics (dense, wet)
Dark brownish-black PEAT (dense, wet)
Dark gray, very silty, fine to medium SANDwith organics (dense, wet)
Dark gray, fine to medium SAND withcoarse gravel (dense, wet)
Dark gray, silty, fine to medium SAND(dense, wet)
- grades very silty
Grayish-brown, sandy, fine to coarseGRAVEL with silt (dense, wet)
Dark brown, fine to coarse SAND with tracesilt (dense, wet)
Dark brown, silty, fine to coarse SAND(dense, wet)
S-7
Run 5
S-8
S-9
S-10
Run 6
S-11
Boring Completed 08/24/10. Total Depth of Boring = 60.0 ft.Monitoring Well Completed 08/25/10Total Depth of Monitoring Well = 59.6 ft.
SPT N-Value
10 20 30 40
Moisture Content (%)
5 10 15 20
Fines Content (%)
5 10 15 20
(DO
E#:
BB
P23
3)W
EL
L D
ET
AIL
35
40
45
50
55
60
65
70
Ele
vatio
n (f
t)
50
45
40
35
30
Notes:
Sam
pler
Typ
e
Blo
ws/
Foo
t
Tes
t D
ata
LiquidLimit
Sam
ple
Num
ber
& I
nter
val
Non-Standard N-Value
Gra
phic
Sym
bol
Dep
th (
ft)
US
CS
Sym
bol
Drilled By:
SOIL PROFILE
Ground Elevation (ft):
Drilling Method:
Boart Longyear
SAMPLE DATA
Rotosonic
PlasticLimit
1. Stratigraphic contacts are based on field interpretations and are approximate.2. Reference to the text of this report is necessary for a proper understanding of subsurface conditions.3. Refer to "Soil Classification System and Key" figure for explanation of graphics and symbols.4. DOE Unique Well Number: BBP233
0251
64.
11/1
2/1
0 Y
:\025
\164
\T\A
UB
UR
N B
OR
ING
S A
ND
WE
LLS
\BO
RIN
G A
ND
WE
LL L
OG
S\0
2516
4 -
MA
ST
ER
FIL
E.G
PJ
SO
IL B
OR
ING
LO
G W
ITH
GR
AP
H
AGW164
86.52
Log of Boring AGW164 A-3(2 of 2)
Figure
0251
64.
11/1
2/1
0 Y
:\025
\164
\T\A
UB
UR
N B
OR
ING
S A
ND
WE
LLS
\BO
RIN
G A
ND
WE
LL L
OG
S\0
2516
4 -
MA
ST
ER
FIL
E.G
PJ
SO
IL B
OR
ING
LO
G W
ITH
GR
AP
H
Boeing AuburnRemedial InvestigationAuburn, Washington

d
i4
d
d
i4
d
i4
d
PC
SP
SM
GP
SP
GP
SP
GP
SP
Portland concrete cement
Not Sampled
Brown, fine to medium SAND with graveland trace silt (medium dense, damp)
- grades gray
Gray, silty, fine to medium SAND (mediumdense, damp)
Gray, sandy, fine to coarse GRAVEL(medium dense, moist)
Gray, fine to coarse SAND with trace gravel(medium dense, wet)
Dark gray, sandy, fine to coarse GRAVEL(medium dense, wet)
dark gray, fine to medium SAND with tracegravel (medium dense, wet)
Dark gray, sandy, fine to coarse GRAVEL(medium dense, wet)
S-1
Run 1
S-2
S-3
Run 2
S-4
Run 3
S-5
SPT N-Value
10 20 30 40
Moisture Content (%)
5 10 15 20
Fines Content (%)
5 10 15 20
(DO
E#:
BB
P23
4)W
EL
L D
ET
AIL
0
5
10
15
20
25
30
35
Ele
vatio
n (f
t)
85
80
75
70
65
60
55
Notes:
Sam
pler
Typ
e
Blo
ws/
Foo
t
Tes
t D
ata
LiquidLimit
Sam
ple
Num
ber
& I
nter
val
Non-Standard N-Value
Gra
phic
Sym
bol
Dep
th (
ft)
US
CS
Sym
bol
Drilled By:
SOIL PROFILE
Ground Elevation (ft):
Drilling Method:
Boart Longyear
SAMPLE DATA
Rotosonic
PlasticLimit
1. Stratigraphic contacts are based on field interpretations and are approximate.2. Reference to the text of this report is necessary for a proper understanding of subsurface conditions.3. Refer to "Soil Classification System and Key" figure for explanation of graphics and symbols.4. DOE Unique Well Number: BBP234
0251
64.
11/1
2/1
0 Y
:\025
\164
\T\A
UB
UR
N B
OR
ING
S A
ND
WE
LLS
\BO
RIN
G A
ND
WE
LL L
OG
S\0
2516
4 -
MA
ST
ER
FIL
E.G
PJ
SO
IL B
OR
ING
LO
G W
ITH
GR
AP
H
AGW165
86.50
Log of Boring AGW165 A-4(1 of 2)
Figure
0251
64.
11/1
2/1
0 Y
:\025
\164
\T\A
UB
UR
N B
OR
ING
S A
ND
WE
LLS
\BO
RIN
G A
ND
WE
LL L
OG
S\0
2516
4 -
MA
ST
ER
FIL
E.G
PJ
SO
IL B
OR
ING
LO
G W
ITH
GR
AP
H
Boeing AuburnRemedial InvestigationAuburn, Washington
AT
D

i4d
d
d
d
i4
d
d
i4
d
SP
GP
SPGP
GP-GMML
PTML
SP-SM
SP
GP
SP
Dark gray, fine to coarse SAND with tracegravel (medium dense, wet)
Dark gray, sandy, fine to coarse GRAVEl(medium dense, wet)
Dark gray, fine to medium SAND (mediumdense, wet)
Dark gray, very sandy, fine to coarseGRAVEL (medium dense, wet)
Gray, sandy, fine to coarse GRAVEL withsilt (medium dense, wet)
Grayish-brown SILT with organics (mediumstiff, wet)
Dark brown, silty PEAT (medium dense,wet)
Grayish-brown, very sandy SILT withorganics (medium stiff, wet)
Brownish-gray, fine to medium SAND withsilt (medium dense, wet)
Dark brown, fine to coarse SAND with tracegravel (medium dense, wet)
Grayish-brown, very sandy, fine to coarseGRAVEL (medium dense, wet)
Grayish-brown, fine to coarse SAND withgravel and trace silt (medium dense, wet)
Run 4S-6
S-7
S-8
S-9
Run 5
S-10
S-11
Run 6
S-12
Boring Completed 08/25/10. Total Depth of Boring = 60.0 ft.Monitoring Well Completed 08/25/10Total Depth of Monitoring Well = 28.0 ft.
SPT N-Value
10 20 30 40
Moisture Content (%)
5 10 15 20
Fines Content (%)
5 10 15 20
(DO
E#:
BB
P23
4)W
EL
L D
ET
AIL
35
40
45
50
55
60
65
70
Ele
vatio
n (f
t)
50
45
40
35
30
Notes:
Sam
pler
Typ
e
Blo
ws/
Foo
t
Tes
t D
ata
LiquidLimit
Sam
ple
Num
ber
& I
nter
val
Non-Standard N-Value
Gra
phic
Sym
bol
Dep
th (
ft)
US
CS
Sym
bol
Drilled By:
SOIL PROFILE
Ground Elevation (ft):
Drilling Method:
Boart Longyear
SAMPLE DATA
Rotosonic
PlasticLimit
1. Stratigraphic contacts are based on field interpretations and are approximate.2. Reference to the text of this report is necessary for a proper understanding of subsurface conditions.3. Refer to "Soil Classification System and Key" figure for explanation of graphics and symbols.4. DOE Unique Well Number: BBP234
0251
64.
11/1
2/1
0 Y
:\025
\164
\T\A
UB
UR
N B
OR
ING
S A
ND
WE
LLS
\BO
RIN
G A
ND
WE
LL L
OG
S\0
2516
4 -
MA
ST
ER
FIL
E.G
PJ
SO
IL B
OR
ING
LO
G W
ITH
GR
AP
H
AGW165
86.50
Log of Boring AGW165 A-4(2 of 2)
Figure
0251
64.
11/1
2/1
0 Y
:\025
\164
\T\A
UB
UR
N B
OR
ING
S A
ND
WE
LLS
\BO
RIN
G A
ND
WE
LL L
OG
S\0
2516
4 -
MA
ST
ER
FIL
E.G
PJ
SO
IL B
OR
ING
LO
G W
ITH
GR
AP
H
Boeing AuburnRemedial InvestigationAuburn, Washington

i4d
d
i4d
d
i4
d
d
i4
d
d
GP-GMPTSM
PTSM
SM
SP-SM
SP
GP
No Recovery
Brownish-gray, sandy, fine to coarseGRAVEL with silt (loose, moist)
Brown, woody PEAT (soft, moist)
Brownish-gray, silty, very gravelly, fine tocoarse SAND (loose, moist)
Brown, fibrous PEAT (soft, moist)
Gray, silty, fine to medium SAND withorganics (loose, wet)
Brownish-gray, silty, fine SAND (mediumdense, wet)
- grades gray
- grades very silty with trace gravel
Brownish-gray, gravelly, fine to coarseSAND with silt (medium dense, wet)
Dark brown, fine to coarse SAND (mediumdense, wet)
Gray, fine to coarse GRAVEL (mediumdense, wet)
- grades grayish-brown and with sand
Run 1S-1
S-2
Run 2S-3
S-4
Run 3
S-5
S-6
Run 4
S-7
S-8
SPT N-Value
10 20 30 40
Moisture Content (%)
5 10 15 20
Fines Content (%)
5 10 15 20
(DO
E#:
BC
R00
1)W
EL
L D
ET
AIL
0
5
10
15
20
25
30
35
Ele
vatio
n (f
t)
75
70
65
60
55
50
45
Notes:
Sam
pler
Typ
e
Blo
ws/
Foo
t
Tes
t D
ata
LiquidLimit
Sam
ple
Num
ber
& I
nter
val
Non-Standard N-Value
Gra
phic
Sym
bol
Dep
th (
ft)
US
CS
Sym
bol
Drilled By:
SOIL PROFILE
Ground Elevation (ft):
Drilling Method:
Boart Longyear
SAMPLE DATA
Rotosonic
PlasticLimit
1. Stratigraphic contacts are based on field interpretations and are approximate.2. Reference to the text of this report is necessary for a proper understanding of subsurface conditions.3. Refer to "Soil Classification System and Key" figure for explanation of graphics and symbols.4. DOE Unique Well Number:BCR001
0251
64.
11/1
2/1
0 Y
:\025
\164
\T\A
UB
UR
N B
OR
ING
S A
ND
WE
LLS
\BO
RIN
G A
ND
WE
LL L
OG
S\0
2516
4 -
MA
ST
ER
FIL
E.G
PJ
SO
IL B
OR
ING
LO
G W
ITH
GR
AP
H
AGW166
77.61
Log of Boring AGW166 A-5(1 of 2)
Figure
0251
64.
11/1
2/1
0 Y
:\025
\164
\T\A
UB
UR
N B
OR
ING
S A
ND
WE
LLS
\BO
RIN
G A
ND
WE
LL L
OG
S\0
2516
4 -
MA
ST
ER
FIL
E.G
PJ
SO
IL B
OR
ING
LO
G W
ITH
GR
AP
H
Boeing AuburnRemedial InvestigationAuburn, Washington
AT
D

i4
d
i4
d
i4
d
GP
SM
SP
Gray, fine to coarse GRAVEL (mediumdense, wet)
Brownish-gray, silty, fine SAND (mediumdense, wet)
Dark gray, fine to medium SAND (mediumdense, wet)
Run 5
S-9
Run 6
S-10
Run 7
S-11
Boring Completed 10/26/10. Total Depth of Boring = 60.0 ft.Monitoring Well Completed 10/26/10Total Depth of Monitoring Well = 59.6 ft.
SPT N-Value
10 20 30 40
Moisture Content (%)
5 10 15 20
Fines Content (%)
5 10 15 20
(DO
E#:
BC
R00
1)W
EL
L D
ET
AIL
35
40
45
50
55
60
65
70
Ele
vatio
n (f
t)
40
35
30
25
20
Notes:
Sam
pler
Typ
e
Blo
ws/
Foo
t
Tes
t D
ata
LiquidLimit
Sam
ple
Num
ber
& I
nter
val
Non-Standard N-Value
Gra
phic
Sym
bol
Dep
th (
ft)
US
CS
Sym
bol
Drilled By:
SOIL PROFILE
Ground Elevation (ft):
Drilling Method:
Boart Longyear
SAMPLE DATA
Rotosonic
PlasticLimit
1. Stratigraphic contacts are based on field interpretations and are approximate.2. Reference to the text of this report is necessary for a proper understanding of subsurface conditions.3. Refer to "Soil Classification System and Key" figure for explanation of graphics and symbols.4. DOE Unique Well Number:BCR001
0251
64.
11/1
2/1
0 Y
:\025
\164
\T\A
UB
UR
N B
OR
ING
S A
ND
WE
LLS
\BO
RIN
G A
ND
WE
LL L
OG
S\0
2516
4 -
MA
ST
ER
FIL
E.G
PJ
SO
IL B
OR
ING
LO
G W
ITH
GR
AP
H
AGW166
77.61
Log of Boring AGW166 A-5(2 of 2)
Figure
0251
64.
11/1
2/1
0 Y
:\025
\164
\T\A
UB
UR
N B
OR
ING
S A
ND
WE
LLS
\BO
RIN
G A
ND
WE
LL L
OG
S\0
2516
4 -
MA
ST
ER
FIL
E.G
PJ
SO
IL B
OR
ING
LO
G W
ITH
GR
AP
H
Boeing AuburnRemedial InvestigationAuburn, Washington

d
i4
d
di4
d
d
i4
d
d
GM
SM
SP
GP
GP
No Recovery
Brown, silty, sandy, coarse GRAVEL (loose,moist)
Brownish-gray, very silty, very gravelly, fineSAND (loose, wet)
- grades silty and without gravel
Brown, fine to coarse SAND with gravel(medium dense, wet)
Brown, fine to coarse GRAVEL (mediumdense, wet)
Grayish-brown, sandy, fine to coarseGRAVEL with trace silt (medium dense, wet)
S-1
Run 1
S-2
S-3Run 2
S-4
S-5
Run 3
S-6
S-7
SPT N-Value
10 20 30 40
Moisture Content (%)
5 10 15 20
Fines Content (%)
5 10 15 20
(DO
E#:
BC
R00
2)W
EL
L D
ET
AIL
0
5
10
15
20
25
30
35
Ele
vatio
n (f
t)
75
70
65
60
55
50
45
Notes:
Sam
pler
Typ
e
Blo
ws/
Foo
t
Tes
t D
ata
LiquidLimit
Sam
ple
Num
ber
& I
nter
val
Non-Standard N-Value
Gra
phic
Sym
bol
Dep
th (
ft)
US
CS
Sym
bol
Drilled By:
SOIL PROFILE
Ground Elevation (ft):
Drilling Method:
Boart Longyear
SAMPLE DATA
Rotosonic
PlasticLimit
1. Stratigraphic contacts are based on field interpretations and are approximate.2. Reference to the text of this report is necessary for a proper understanding of subsurface conditions.3. Refer to "Soil Classification System and Key" figure for explanation of graphics and symbols.4. DOE Unique Well Number:BCR002
0251
64.
11/1
2/1
0 Y
:\025
\164
\T\A
UB
UR
N B
OR
ING
S A
ND
WE
LLS
\BO
RIN
G A
ND
WE
LL L
OG
S\0
2516
4 -
MA
ST
ER
FIL
E.G
PJ
SO
IL B
OR
ING
LO
G W
ITH
GR
AP
H
AGW167
78.11
Log of Boring AGW167 A-6(1 of 3)
Figure
0251
64.
11/1
2/1
0 Y
:\025
\164
\T\A
UB
UR
N B
OR
ING
S A
ND
WE
LLS
\BO
RIN
G A
ND
WE
LL L
OG
S\0
2516
4 -
MA
ST
ER
FIL
E.G
PJ
SO
IL B
OR
ING
LO
G W
ITH
GR
AP
H
Boeing AuburnRemedial InvestigationAuburn, Washington
AT
D

i4
d
i4d
d
d
i4
d
d
i4
d
GP
GP-GM
SP
SM
WDSP-SM
SP
SP-SM
Grayish-brown, sandy, fine to coarseGRAVEL with trace silt (medium dense, wet)
- grades very sandy
- grades sandy
Grayish-brown, fine to coarse GRAVEL withsand and silt (medium dense, wet)
Dark gray, very gravelly, fine to coarseSAND (medium dense, wet)
Gray, silty, fine SAND (medium dense, wet)
Large fragments of wood
Dark gray, fine SAND with silt (mediumdense, wet)
Dark gray, fine to coarse SAND with tracegravel (medium dense, wet)
Dark gray, fine to coarse SAND with silt(medium dense, wet)
Run 4
S-8
Run 8S-9
S-10
S-11
Run 6
S-12
S-13
Run 7
S-14
SPT N-Value
10 20 30 40
Moisture Content (%)
5 10 15 20
Fines Content (%)
5 10 15 20
(DO
E#:
BC
R00
2)W
EL
L D
ET
AIL
35
40
45
50
55
60
65
70
Ele
vatio
n (f
t)
40
35
30
25
20
15
10
Notes:
Sam
pler
Typ
e
Blo
ws/
Foo
t
Tes
t D
ata
LiquidLimit
Sam
ple
Num
ber
& I
nter
val
Non-Standard N-Value
Gra
phic
Sym
bol
Dep
th (
ft)
US
CS
Sym
bol
Drilled By:
SOIL PROFILE
Ground Elevation (ft):
Drilling Method:
Boart Longyear
SAMPLE DATA
Rotosonic
PlasticLimit
1. Stratigraphic contacts are based on field interpretations and are approximate.2. Reference to the text of this report is necessary for a proper understanding of subsurface conditions.3. Refer to "Soil Classification System and Key" figure for explanation of graphics and symbols.4. DOE Unique Well Number:BCR002
0251
64.
11/1
2/1
0 Y
:\025
\164
\T\A
UB
UR
N B
OR
ING
S A
ND
WE
LLS
\BO
RIN
G A
ND
WE
LL L
OG
S\0
2516
4 -
MA
ST
ER
FIL
E.G
PJ
SO
IL B
OR
ING
LO
G W
ITH
GR
AP
H
AGW167
78.11
Log of Boring AGW167 A-6(2 of 3)
Figure
0251
64.
11/1
2/1
0 Y
:\025
\164
\T\A
UB
UR
N B
OR
ING
S A
ND
WE
LLS
\BO
RIN
G A
ND
WE
LL L
OG
S\0
2516
4 -
MA
ST
ER
FIL
E.G
PJ
SO
IL B
OR
ING
LO
G W
ITH
GR
AP
H
Boeing AuburnRemedial InvestigationAuburn, Washington
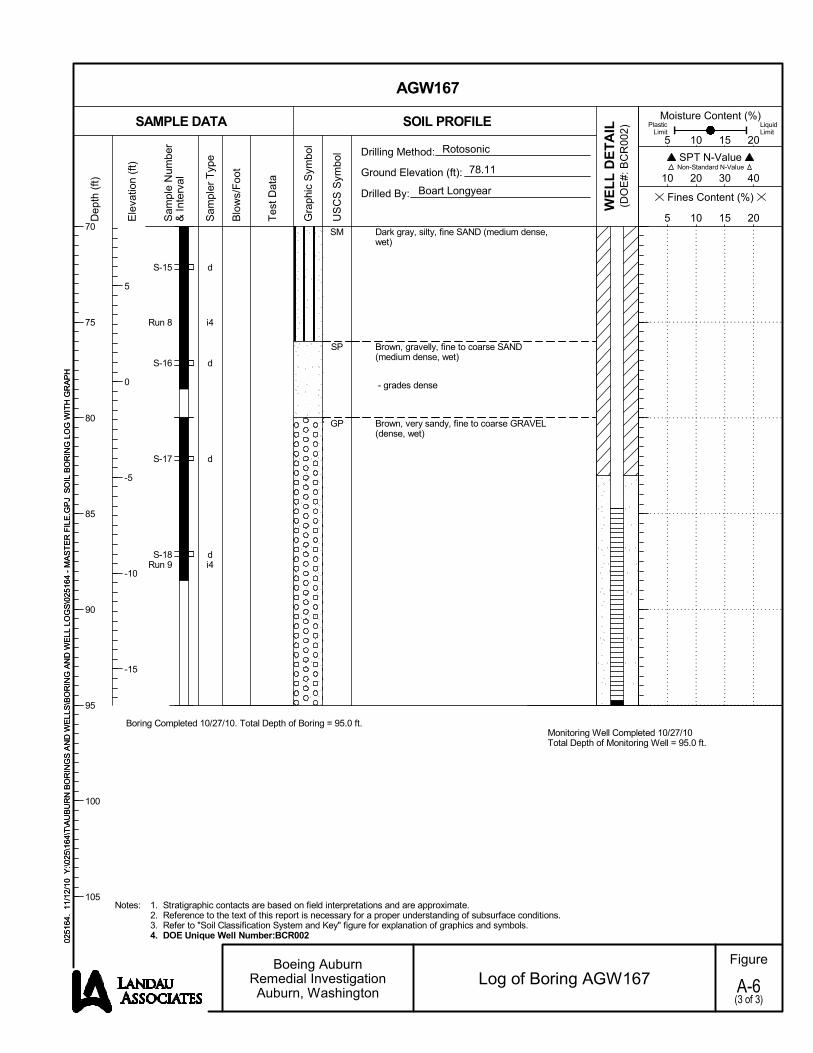
d
i4
d
d
di4
SM
SP
GP
Dark gray, silty, fine SAND (medium dense,wet)
Brown, gravelly, fine to coarse SAND(medium dense, wet)
- grades dense
Brown, very sandy, fine to coarse GRAVEL(dense, wet)
S-15
Run 8
S-16
S-17
S-18Run 9
Boring Completed 10/27/10. Total Depth of Boring = 95.0 ft.Monitoring Well Completed 10/27/10Total Depth of Monitoring Well = 95.0 ft.
SPT N-Value
10 20 30 40
Moisture Content (%)
5 10 15 20
Fines Content (%)
5 10 15 20
(DO
E#:
BC
R00
2)W
EL
L D
ET
AIL
70
75
80
85
90
95
100
105
Ele
vatio
n (f
t)
5
0
-5
-10
-15
Notes:
Sam
pler
Typ
e
Blo
ws/
Foo
t
Tes
t D
ata
LiquidLimit
Sam
ple
Num
ber
& I
nter
val
Non-Standard N-Value
Gra
phic
Sym
bol
Dep
th (
ft)
US
CS
Sym
bol
Drilled By:
SOIL PROFILE
Ground Elevation (ft):
Drilling Method:
Boart Longyear
SAMPLE DATA
Rotosonic
PlasticLimit
1. Stratigraphic contacts are based on field interpretations and are approximate.2. Reference to the text of this report is necessary for a proper understanding of subsurface conditions.3. Refer to "Soil Classification System and Key" figure for explanation of graphics and symbols.4. DOE Unique Well Number:BCR002
0251
64.
11/1
2/1
0 Y
:\025
\164
\T\A
UB
UR
N B
OR
ING
S A
ND
WE
LLS
\BO
RIN
G A
ND
WE
LL L
OG
S\0
2516
4 -
MA
ST
ER
FIL
E.G
PJ
SO
IL B
OR
ING
LO
G W
ITH
GR
AP
H
AGW167
78.11
Log of Boring AGW167 A-6(3 of 3)
Figure
0251
64.
11/1
2/1
0 Y
:\025
\164
\T\A
UB
UR
N B
OR
ING
S A
ND
WE
LLS
\BO
RIN
G A
ND
WE
LL L
OG
S\0
2516
4 -
MA
ST
ER
FIL
E.G
PJ
SO
IL B
OR
ING
LO
G W
ITH
GR
AP
H
Boeing AuburnRemedial InvestigationAuburn, Washington

d
d
i4d
d
i4
d
d
i4
d
d
AC
GP
PTSP-SM
SP
8-inches asphalt concrete pavement
No Recovery
Brown, sandy, fine to coarse GRAVEL(loose, moist)
Dark brown PEAT with gravel (soft, moist)
Brown, fine to medium SAND with silt(loose, moist)
- grades dark gray and medium dense
- grades wet
Dark gray, fine to medium SAND with tracesilt (medium dense, wet)
- grades with wood
- grades gray
- grades light grayish-brown
- grades gravelly and fine to coarse sand
S-1
S-2
Run 1S-3
S-4
Run 2
S-5
S-6
Run 3
S-7
S-8
SPT N-Value
10 20 30 40
Moisture Content (%)
5 10 15 20
Fines Content (%)
5 10 15 20
(DO
E#:
BC
R00
3)W
EL
L D
ET
AIL
0
5
10
15
20
25
30
35
Ele
vatio
n (f
t)
75
70
65
60
55
50
45
Notes:
Sam
pler
Typ
e
Blo
ws/
Foo
t
Tes
t D
ata
LiquidLimit
Sam
ple
Num
ber
& I
nter
val
Non-Standard N-Value
Gra
phic
Sym
bol
Dep
th (
ft)
US
CS
Sym
bol
Drilled By:
SOIL PROFILE
Ground Elevation (ft):
Drilling Method:
Boart Longyear
SAMPLE DATA
Rotosonic
PlasticLimit
1. Stratigraphic contacts are based on field interpretations and are approximate.2. Reference to the text of this report is necessary for a proper understanding of subsurface conditions.3. Refer to "Soil Classification System and Key" figure for explanation of graphics and symbols.4. DOE Unique Well Number:BCR003
0251
64.
11/1
2/1
0 Y
:\025
\164
\T\A
UB
UR
N B
OR
ING
S A
ND
WE
LLS
\BO
RIN
G A
ND
WE
LL L
OG
S\0
2516
4 -
MA
ST
ER
FIL
E.G
PJ
SO
IL B
OR
ING
LO
G W
ITH
GR
AP
H
AGW168
77.95
Log of Boring AGW168 A-7(1 of 2)
Figure
0251
64.
11/1
2/1
0 Y
:\025
\164
\T\A
UB
UR
N B
OR
ING
S A
ND
WE
LLS
\BO
RIN
G A
ND
WE
LL L
OG
S\0
2516
4 -
MA
ST
ER
FIL
E.G
PJ
SO
IL B
OR
ING
LO
G W
ITH
GR
AP
H
Boeing AuburnRemedial InvestigationAuburn, Washington
AT
D
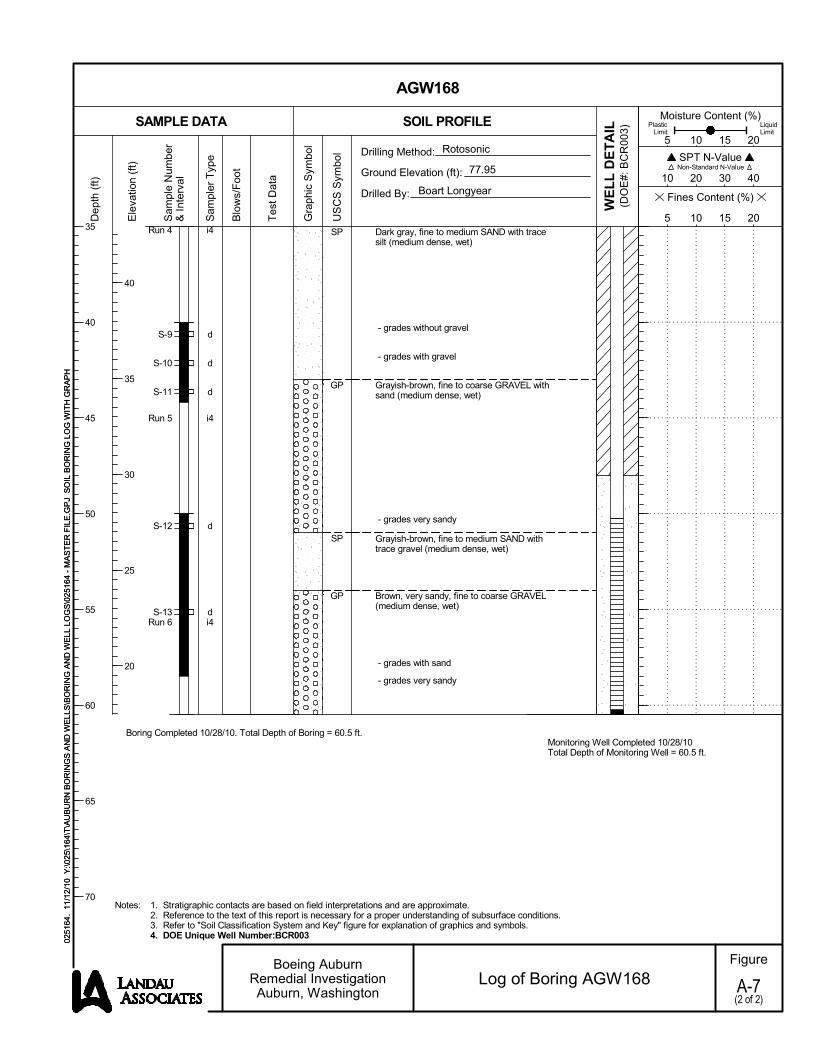
i4
d
d
d
i4
d
di4
SP
GP
SP
GP
Dark gray, fine to medium SAND with tracesilt (medium dense, wet)
- grades without gravel
- grades with gravel
Grayish-brown, fine to coarse GRAVEL withsand (medium dense, wet)
- grades very sandy
Grayish-brown, fine to medium SAND withtrace gravel (medium dense, wet)
Brown, very sandy, fine to coarse GRAVEL(medium dense, wet)
- grades with sand
- grades very sandy
Run 4
S-9
S-10
S-11
Run 5
S-12
S-13Run 6
Boring Completed 10/28/10. Total Depth of Boring = 60.5 ft.Monitoring Well Completed 10/28/10Total Depth of Monitoring Well = 60.5 ft.
SPT N-Value
10 20 30 40
Moisture Content (%)
5 10 15 20
Fines Content (%)
5 10 15 20
(DO
E#:
BC
R00
3)W
EL
L D
ET
AIL
35
40
45
50
55
60
65
70
Ele
vatio
n (f
t)
40
35
30
25
20
Notes:
Sam
pler
Typ
e
Blo
ws/
Foo
t
Tes
t D
ata
LiquidLimit
Sam
ple
Num
ber
& I
nter
val
Non-Standard N-Value
Gra
phic
Sym
bol
Dep
th (
ft)
US
CS
Sym
bol
Drilled By:
SOIL PROFILE
Ground Elevation (ft):
Drilling Method:
Boart Longyear
SAMPLE DATA
Rotosonic
PlasticLimit
1. Stratigraphic contacts are based on field interpretations and are approximate.2. Reference to the text of this report is necessary for a proper understanding of subsurface conditions.3. Refer to "Soil Classification System and Key" figure for explanation of graphics and symbols.4. DOE Unique Well Number:BCR003
0251
64.
11/1
2/1
0 Y
:\025
\164
\T\A
UB
UR
N B
OR
ING
S A
ND
WE
LLS
\BO
RIN
G A
ND
WE
LL L
OG
S\0
2516
4 -
MA
ST
ER
FIL
E.G
PJ
SO
IL B
OR
ING
LO
G W
ITH
GR
AP
H
AGW168
77.95
Log of Boring AGW168 A-7(2 of 2)
Figure
0251
64.
11/1
2/1
0 Y
:\025
\164
\T\A
UB
UR
N B
OR
ING
S A
ND
WE
LLS
\BO
RIN
G A
ND
WE
LL L
OG
S\0
2516
4 -
MA
ST
ER
FIL
E.G
PJ
SO
IL B
OR
ING
LO
G W
ITH
GR
AP
H
Boeing AuburnRemedial InvestigationAuburn, Washington

d
i4d
d
d
i4
d
d
d
i4
d
AC
SP
ML
SP
SM
SP
GP
SP
8-inches asphalt concrete pavement
No Recovery
Brown, fine to coarse SAND with gravel(medium dense, moist)
- grades without gravel
- grades fine to medium sand
- grades gravelly, fine to coarse sand
- grades without gravel
Brownish-gray, sandy SILT (medium stiff,wet)
Dark gray, fine to medium SAND (mediumdense, wet)
Grayish-brown, very silty, fine to coarseSAND with peat (medium dense, wet)
Dark gray, fine to coarse SAND (mediumdense, wet)
Brownish-gray, sandy, fine to coarseGRAVEL (medium dense, wet)
Brown, very gravelly, fine to coarse SAND(medium dense, wet)
S-1
Run 1S-2
S-3
S-4
Run 2
S-5
S-6
S-7
Run 3
S-8
SPT N-Value
10 20 30 40
Moisture Content (%)
5 10 15 20
Fines Content (%)
5 10 15 20
(DO
E#:
BC
R00
4)W
EL
L D
ET
AIL
0
5
10
15
20
25
30
35
Ele
vatio
n (f
t)
75
70
65
60
55
50
45
Notes:
Sam
pler
Typ
e
Blo
ws/
Foo
t
Tes
t D
ata
LiquidLimit
Sam
ple
Num
ber
& I
nter
val
Non-Standard N-Value
Gra
phic
Sym
bol
Dep
th (
ft)
US
CS
Sym
bol
Drilled By:
SOIL PROFILE
Ground Elevation (ft):
Drilling Method:
Boart Longyear
SAMPLE DATA
Rotosonic
PlasticLimit
1. Stratigraphic contacts are based on field interpretations and are approximate.2. Reference to the text of this report is necessary for a proper understanding of subsurface conditions.3. Refer to "Soil Classification System and Key" figure for explanation of graphics and symbols.4. DOE Unique Well Number:BCR004
0251
64.
11/1
2/1
0 Y
:\025
\164
\T\A
UB
UR
N B
OR
ING
S A
ND
WE
LLS
\BO
RIN
G A
ND
WE
LL L
OG
S\0
2516
4 -
MA
ST
ER
FIL
E.G
PJ
SO
IL B
OR
ING
LO
G W
ITH
GR
AP
H
AGW169
78.12
Log of Boring AGW169 A-8(1 of 3)
Figure
0251
64.
11/1
2/1
0 Y
:\025
\164
\T\A
UB
UR
N B
OR
ING
S A
ND
WE
LLS
\BO
RIN
G A
ND
WE
LL L
OG
S\0
2516
4 -
MA
ST
ER
FIL
E.G
PJ
SO
IL B
OR
ING
LO
G W
ITH
GR
AP
H
Boeing AuburnRemedial InvestigationAuburn, Washington
AT
D

i4
d
d
i4
d
i4
d
d
d
i4d
d
d
SP
SP
GP
SP
SM
SP-SM
Brown, very gravelly, fine to coarse SAND(medium dense, wet)
- grades medium to coarse sand andwithout gravel
- grades gravelly
Gray, fine to medium SAND (mediumdense, wet)
- grades gravelly, fine to coarse sand
Brown, fine to coarse GRAVEL with sand(medium dense, wet)
Brown, gravelly, fine to coarse SAND(medium dense, wet)
- grades with gravel
Gray, silty, fine SAND (medium dense, wet)
Gray, fine SAND with silt (medium dense,wet)
Run 4
S-9
S-10
Run 5
S-11
Run 6
S-12
S-13
S-14
Run 7S-15
S-16
S-17
SPT N-Value
10 20 30 40
Moisture Content (%)
5 10 15 20
Fines Content (%)
5 10 15 20
(DO
E#:
BC
R00
4)W
EL
L D
ET
AIL
35
40
45
50
55
60
65
70
Ele
vatio
n (f
t)
40
35
30
25
20
15
10
Notes:
Sam
pler
Typ
e
Blo
ws/
Foo
t
Tes
t D
ata
LiquidLimit
Sam
ple
Num
ber
& I
nter
val
Non-Standard N-Value
Gra
phic
Sym
bol
Dep
th (
ft)
US
CS
Sym
bol
Drilled By:
SOIL PROFILE
Ground Elevation (ft):
Drilling Method:
Boart Longyear
SAMPLE DATA
Rotosonic
PlasticLimit
1. Stratigraphic contacts are based on field interpretations and are approximate.2. Reference to the text of this report is necessary for a proper understanding of subsurface conditions.3. Refer to "Soil Classification System and Key" figure for explanation of graphics and symbols.4. DOE Unique Well Number:BCR004
0251
64.
11/1
2/1
0 Y
:\025
\164
\T\A
UB
UR
N B
OR
ING
S A
ND
WE
LLS
\BO
RIN
G A
ND
WE
LL L
OG
S\0
2516
4 -
MA
ST
ER
FIL
E.G
PJ
SO
IL B
OR
ING
LO
G W
ITH
GR
AP
H
AGW169
78.12
Log of Boring AGW169 A-8(2 of 3)
Figure
0251
64.
11/1
2/1
0 Y
:\025
\164
\T\A
UB
UR
N B
OR
ING
S A
ND
WE
LLS
\BO
RIN
G A
ND
WE
LL L
OG
S\0
2516
4 -
MA
ST
ER
FIL
E.G
PJ
SO
IL B
OR
ING
LO
G W
ITH
GR
AP
H
Boeing AuburnRemedial InvestigationAuburn, Washington
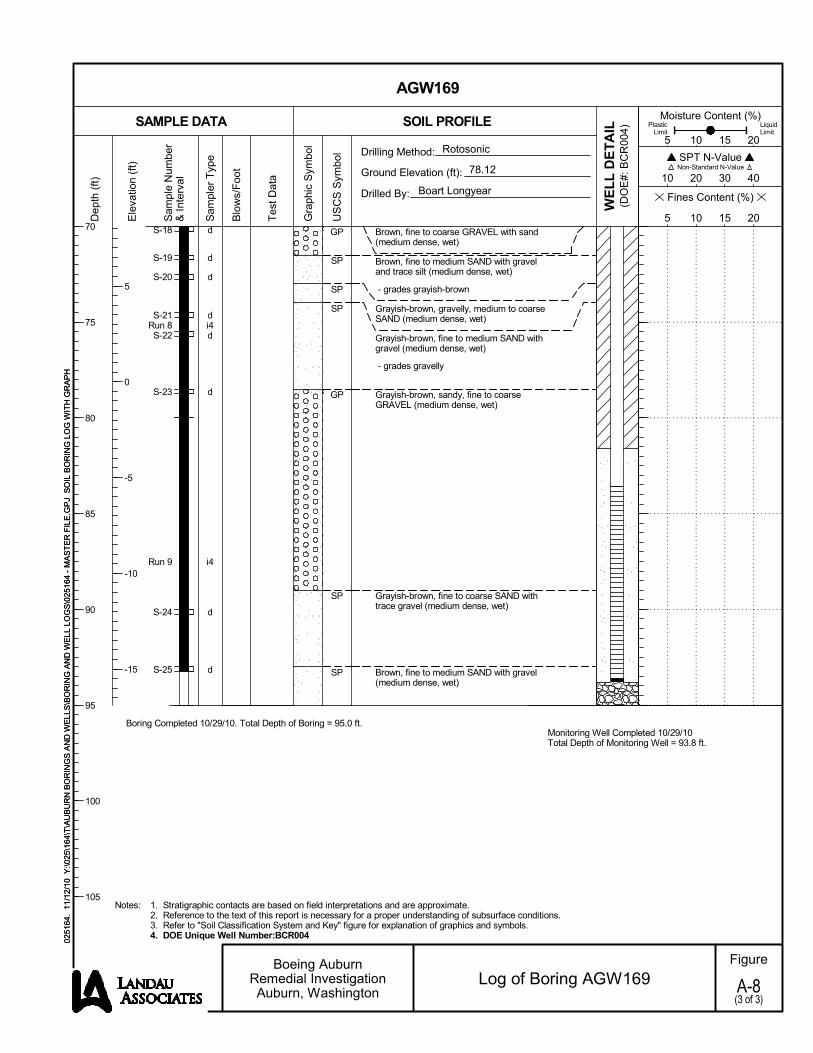
d
d
d
di4d
d
i4
d
d
GP
SP
SP
SP
GP
SP
SP
Brown, fine to coarse GRAVEL with sand(medium dense, wet)
Brown, fine to medium SAND with graveland trace silt (medium dense, wet)
- grades grayish-brown
Grayish-brown, gravelly, medium to coarseSAND (medium dense, wet)
Grayish-brown, fine to medium SAND withgravel (medium dense, wet)
- grades gravelly
Grayish-brown, sandy, fine to coarseGRAVEL (medium dense, wet)
Grayish-brown, fine to coarse SAND withtrace gravel (medium dense, wet)
Brown, fine to medium SAND with gravel(medium dense, wet)
S-18
S-19
S-20
S-21Run 8S-22
S-23
Run 9
S-24
S-25
Boring Completed 10/29/10. Total Depth of Boring = 95.0 ft.Monitoring Well Completed 10/29/10Total Depth of Monitoring Well = 93.8 ft.
SPT N-Value
10 20 30 40
Moisture Content (%)
5 10 15 20
Fines Content (%)
5 10 15 20
(DO
E#:
BC
R00
4)W
EL
L D
ET
AIL
70
75
80
85
90
95
100
105
Ele
vatio
n (f
t)
5
0
-5
-10
-15
Notes:
Sam
pler
Typ
e
Blo
ws/
Foo
t
Tes
t D
ata
LiquidLimit
Sam
ple
Num
ber
& I
nter
val
Non-Standard N-Value
Gra
phic
Sym
bol
Dep
th (
ft)
US
CS
Sym
bol
Drilled By:
SOIL PROFILE
Ground Elevation (ft):
Drilling Method:
Boart Longyear
SAMPLE DATA
Rotosonic
PlasticLimit
1. Stratigraphic contacts are based on field interpretations and are approximate.2. Reference to the text of this report is necessary for a proper understanding of subsurface conditions.3. Refer to "Soil Classification System and Key" figure for explanation of graphics and symbols.4. DOE Unique Well Number:BCR004
0251
64.
11/1
2/1
0 Y
:\025
\164
\T\A
UB
UR
N B
OR
ING
S A
ND
WE
LLS
\BO
RIN
G A
ND
WE
LL L
OG
S\0
2516
4 -
MA
ST
ER
FIL
E.G
PJ
SO
IL B
OR
ING
LO
G W
ITH
GR
AP
H
AGW169
78.12
Log of Boring AGW169 A-8(3 of 3)
Figure
0251
64.
11/1
2/1
0 Y
:\025
\164
\T\A
UB
UR
N B
OR
ING
S A
ND
WE
LLS
\BO
RIN
G A
ND
WE
LL L
OG
S\0
2516
4 -
MA
ST
ER
FIL
E.G
PJ
SO
IL B
OR
ING
LO
G W
ITH
GR
AP
H
Boeing AuburnRemedial InvestigationAuburn, Washington

d
i4d
d
i4
d
d
i4
d
AC
GP-GM
SM
SP
GP
SP
GP
6-inches asphalt concrete pavement
No Recovery
Brown, sandy, fine to coarse GRAVEL withsilt (loose, moist)
Brown iron oxide mottled, silty, fine tomedium SAND (loose, moist)
Dark brown, fine to medium SAND (loose,wet)
- grades with trace gravel
Brown, sandy, fine to coarse GRAVEL(medium dense, wet)
Brown, fine to coarse SAND with gravel(medium dense, wet)
Brown, sandy, fine to coarse GRAVEL(medium dense, wet)
- grades very sandy
S-1
Run 1S-2
S-3
Run 2
S-4
S-5
Run 3
S-6
SPT N-Value
10 20 30 40
Moisture Content (%)
5 10 15 20
Fines Content (%)
5 10 15 20
(DO
E#:
BC
R00
5)W
EL
L D
ET
AIL
0
5
10
15
20
25
30
35
Ele
vatio
n (f
t)
80
75
70
65
60
55
50
Notes:
Sam
pler
Typ
e
Blo
ws/
Foo
t
Tes
t D
ata
LiquidLimit
Sam
ple
Num
ber
& I
nter
val
Non-Standard N-Value
Gra
phic
Sym
bol
Dep
th (
ft)
US
CS
Sym
bol
Drilled By:
SOIL PROFILE
Ground Elevation (ft):
Drilling Method:
Boart Longyear
SAMPLE DATA
Rotosonic
PlasticLimit
1. Stratigraphic contacts are based on field interpretations and are approximate.2. Reference to the text of this report is necessary for a proper understanding of subsurface conditions.3. Refer to "Soil Classification System and Key" figure for explanation of graphics and symbols.4. DOE Unique Well Number:BCR005
0251
64.
11/1
2/1
0 Y
:\025
\164
\T\A
UB
UR
N B
OR
ING
S A
ND
WE
LLS
\BO
RIN
G A
ND
WE
LL L
OG
S\0
2516
4 -
MA
ST
ER
FIL
E.G
PJ
SO
IL B
OR
ING
LO
G W
ITH
GR
AP
H
AGW170
80.21
Log of Boring AGW170 A-9(1 of 2)
Figure
0251
64.
11/1
2/1
0 Y
:\025
\164
\T\A
UB
UR
N B
OR
ING
S A
ND
WE
LLS
\BO
RIN
G A
ND
WE
LL L
OG
S\0
2516
4 -
MA
ST
ER
FIL
E.G
PJ
SO
IL B
OR
ING
LO
G W
ITH
GR
AP
H
Boeing AuburnRemedial InvestigationAuburn, Washington
AT
D

i4
d
i4
d
i4
GP Brown, sandy, fine to coarse GRAVEL(medium dense, wet)
- grades sandy
- grades with sand
Run 4
S-7
Run 5
S-8
Run 6
Boring Completed 11/01/10. Total Depth of Boring = 60.2 ft.Monitoring Well Completed 11/01/10Total Depth of Monitoring Well = 60.2 ft.
SPT N-Value
10 20 30 40
Moisture Content (%)
5 10 15 20
Fines Content (%)
5 10 15 20
(DO
E#:
BC
R00
5)W
EL
L D
ET
AIL
35
40
45
50
55
60
65
70
Ele
vatio
n (f
t)
45
40
35
30
25
Notes:
Sam
pler
Typ
e
Blo
ws/
Foo
t
Tes
t D
ata
LiquidLimit
Sam
ple
Num
ber
& I
nter
val
Non-Standard N-Value
Gra
phic
Sym
bol
Dep
th (
ft)
US
CS
Sym
bol
Drilled By:
SOIL PROFILE
Ground Elevation (ft):
Drilling Method:
Boart Longyear
SAMPLE DATA
Rotosonic
PlasticLimit
1. Stratigraphic contacts are based on field interpretations and are approximate.2. Reference to the text of this report is necessary for a proper understanding of subsurface conditions.3. Refer to "Soil Classification System and Key" figure for explanation of graphics and symbols.4. DOE Unique Well Number:BCR005
0251
64.
11/1
2/1
0 Y
:\025
\164
\T\A
UB
UR
N B
OR
ING
S A
ND
WE
LLS
\BO
RIN
G A
ND
WE
LL L
OG
S\0
2516
4 -
MA
ST
ER
FIL
E.G
PJ
SO
IL B
OR
ING
LO
G W
ITH
GR
AP
H
AGW170
80.21
Log of Boring AGW170 A-9(2 of 2)
Figure
0251
64.
11/1
2/1
0 Y
:\025
\164
\T\A
UB
UR
N B
OR
ING
S A
ND
WE
LLS
\BO
RIN
G A
ND
WE
LL L
OG
S\0
2516
4 -
MA
ST
ER
FIL
E.G
PJ
SO
IL B
OR
ING
LO
G W
ITH
GR
AP
H
Boeing AuburnRemedial InvestigationAuburn, Washington

d
i4
i4d
d
d
i4d
d
d
AC
SP-SM
SP
GPSP
SP
GP
SP
6-inches asphalt concrete pavement
No Recovery
Brown, very gravelly, fine to coarse SANDwith silt (loose, moist)
Dark gray, fine to medium SAND (mediumdense, moist)
Dark gray, very sandy, fine to coarseGRAVEL (medium dense, wet)
Dark gray, fine to medium SAND (mediumdense, wet)
Dark gray, fine to coarse SAND with graveland cobble (medium dense, wet)
Brown, fine to coarse GRAVEL with sand(medium dense, wet)
- grades sandy
S-1
Run 1
Run 2S-2
S-3
S-4
Run 3S-5
S-6
S-7
SPT N-Value
10 20 30 40
Moisture Content (%)
5 10 15 20
Fines Content (%)
5 10 15 20
(DO
E#:
BC
R00
6)W
EL
L D
ET
AIL
0
5
10
15
20
25
30
35
Ele
vatio
n (f
t)
80
75
70
65
60
55
50
Notes:
Sam
pler
Typ
e
Blo
ws/
Foo
t
Tes
t D
ata
LiquidLimit
Sam
ple
Num
ber
& I
nter
val
Non-Standard N-Value
Gra
phic
Sym
bol
Dep
th (
ft)
US
CS
Sym
bol
Drilled By:
SOIL PROFILE
Ground Elevation (ft):
Drilling Method:
Boart Longyear
SAMPLE DATA
Rotosonic
PlasticLimit
1. Stratigraphic contacts are based on field interpretations and are approximate.2. Reference to the text of this report is necessary for a proper understanding of subsurface conditions.3. Refer to "Soil Classification System and Key" figure for explanation of graphics and symbols.4. DOE Unique Well Number:BCR006
0251
64.
11/1
2/1
0 Y
:\025
\164
\T\A
UB
UR
N B
OR
ING
S A
ND
WE
LLS
\BO
RIN
G A
ND
WE
LL L
OG
S\0
2516
4 -
MA
ST
ER
FIL
E.G
PJ
SO
IL B
OR
ING
LO
G W
ITH
GR
AP
H
AGW171
80.43
Log of Boring AGW171 A-10(1 of 3)
Figure
0251
64.
11/1
2/1
0 Y
:\025
\164
\T\A
UB
UR
N B
OR
ING
S A
ND
WE
LLS
\BO
RIN
G A
ND
WE
LL L
OG
S\0
2516
4 -
MA
ST
ER
FIL
E.G
PJ
SO
IL B
OR
ING
LO
G W
ITH
GR
AP
H
Boeing AuburnRemedial InvestigationAuburn, Washington
AT
D

i4
d
i4d
d
i4
d
d
i4d
SP
GP
Dark gray, very gravelly, fine to coarseSAND (medium dense, wet)
Grayish-brown, very sandy, fine to coarseGRAVEL (medium dense, wet)
- grades brown and with sand
- grades dark brown
- grades very sandy
- grades sandy
- grades with trace sand
Run 4
S-8
Run 5S-9
S-10
Run 6
S-11
S-12
Run 7S-13
SPT N-Value
10 20 30 40
Moisture Content (%)
5 10 15 20
Fines Content (%)
5 10 15 20
(DO
E#:
BC
R00
6)W
EL
L D
ET
AIL
35
40
45
50
55
60
65
70
Ele
vatio
n (f
t)
45
40
35
30
25
20
15
Notes:
Sam
pler
Typ
e
Blo
ws/
Foo
t
Tes
t D
ata
LiquidLimit
Sam
ple
Num
ber
& I
nter
val
Non-Standard N-Value
Gra
phic
Sym
bol
Dep
th (
ft)
US
CS
Sym
bol
Drilled By:
SOIL PROFILE
Ground Elevation (ft):
Drilling Method:
Boart Longyear
SAMPLE DATA
Rotosonic
PlasticLimit
1. Stratigraphic contacts are based on field interpretations and are approximate.2. Reference to the text of this report is necessary for a proper understanding of subsurface conditions.3. Refer to "Soil Classification System and Key" figure for explanation of graphics and symbols.4. DOE Unique Well Number:BCR006
0251
64.
11/1
2/1
0 Y
:\025
\164
\T\A
UB
UR
N B
OR
ING
S A
ND
WE
LLS
\BO
RIN
G A
ND
WE
LL L
OG
S\0
2516
4 -
MA
ST
ER
FIL
E.G
PJ
SO
IL B
OR
ING
LO
G W
ITH
GR
AP
H
AGW171
80.43
Log of Boring AGW171 A-10(2 of 3)
Figure
0251
64.
11/1
2/1
0 Y
:\025
\164
\T\A
UB
UR
N B
OR
ING
S A
ND
WE
LLS
\BO
RIN
G A
ND
WE
LL L
OG
S\0
2516
4 -
MA
ST
ER
FIL
E.G
PJ
SO
IL B
OR
ING
LO
G W
ITH
GR
AP
H
Boeing AuburnRemedial InvestigationAuburn, Washington

d
d
d
i4
d
d
i4
d
SP
GP
SM
SP-SM
Dark brown, fine to coarse SAND (mediumdense, wet)
Brown, sandy, fine to coarse GRAVEL(medium dense, wet)
- grades very sandy
Dark gray, silty, fine SAND (medium dense,wet)
Brown, fine SAND with silt (medium dense,wet)
S-14
S-15
S-16
Run 8
S-17
S-18
Run 9
S-19
Boring Completed 11/02/10. Total Depth of Boring = 95.0 ft.Monitoring Well Completed 11/02/10Total Depth of Monitoring Well = 82.7 ft.
SPT N-Value
10 20 30 40
Moisture Content (%)
5 10 15 20
Fines Content (%)
5 10 15 20
(DO
E#:
BC
R00
6)W
EL
L D
ET
AIL
70
75
80
85
90
95
100
105
Ele
vatio
n (f
t)
10
5
0
-5
-10
Notes:
Sam
pler
Typ
e
Blo
ws/
Foo
t
Tes
t D
ata
LiquidLimit
Sam
ple
Num
ber
& I
nter
val
Non-Standard N-Value
Gra
phic
Sym
bol
Dep
th (
ft)
US
CS
Sym
bol
Drilled By:
SOIL PROFILE
Ground Elevation (ft):
Drilling Method:
Boart Longyear
SAMPLE DATA
Rotosonic
PlasticLimit
1. Stratigraphic contacts are based on field interpretations and are approximate.2. Reference to the text of this report is necessary for a proper understanding of subsurface conditions.3. Refer to "Soil Classification System and Key" figure for explanation of graphics and symbols.4. DOE Unique Well Number:BCR006
0251
64.
11/1
2/1
0 Y
:\025
\164
\T\A
UB
UR
N B
OR
ING
S A
ND
WE
LLS
\BO
RIN
G A
ND
WE
LL L
OG
S\0
2516
4 -
MA
ST
ER
FIL
E.G
PJ
SO
IL B
OR
ING
LO
G W
ITH
GR
AP
H
AGW171
80.43
Log of Boring AGW171 A-10(3 of 3)
Figure
0251
64.
11/1
2/1
0 Y
:\025
\164
\T\A
UB
UR
N B
OR
ING
S A
ND
WE
LLS
\BO
RIN
G A
ND
WE
LL L
OG
S\0
2516
4 -
MA
ST
ER
FIL
E.G
PJ
SO
IL B
OR
ING
LO
G W
ITH
GR
AP
H
Boeing AuburnRemedial InvestigationAuburn, Washington

i4d
i4d
d
di4
d
d
di4
d
d
d
i4d
d
ACSM
SM
PT
SP-SMSM
SP-SM
GP
GP
SP
GP
SP
3-inches asphalt concrete pavement
Gray, silty, fine to coarse SAND with gravel(medium dense, damp)
- grades moist
Brown, very silty, fine SAND with gravel(medium dense, wet)
Dark brown, fibrous PEAT with woodfragments (medium dense, wet)
Brown, fine to medium SAND with silt(medium dense, moist)
Brownish-gray, very silty, fine to mediumSAND (medium dense, wet)
Brown, fine to medium SAND with silt(medium dense, wet)
Gray, sandy, fine to coarse GRAVEL(medium dense, wet)
Brownish-gray, fine to coarse GRAVEL withsand (dense, wet)
Dark gray, fine to medium SAND (mediumdense, wet)
Brown, sandy, fine to coarse GRAVEL(dense, wet)
Gray, fine to medium SAND (mediumdense, wet)
Run 1S-1
Run 2S-2
S-3
S-4Run 3
S-5
S-6
S-7Run 4
S-8
S-9
S-10
Run 5S-11
S-12
SPT N-Value
10 20 30 40
Moisture Content (%)
5 10 15 20
Fines Content (%)
5 10 15 20
(DO
E#:
BB
P23
7)W
EL
L D
ET
AIL
0
5
10
15
20
25
30
35
Ele
vatio
n (f
t)
80
75
70
65
60
55
50
Notes:
Sam
pler
Typ
e
Blo
ws/
Foo
t
Tes
t D
ata
LiquidLimit
Sam
ple
Num
ber
& I
nter
val
Non-Standard N-Value
Gra
phic
Sym
bol
Dep
th (
ft)
US
CS
Sym
bol
Drilled By:
SOIL PROFILE
Ground Elevation (ft):
Drilling Method:
Boart Longyear
SAMPLE DATA
Rotosonic
PlasticLimit
1. Stratigraphic contacts are based on field interpretations and are approximate.2. Reference to the text of this report is necessary for a proper understanding of subsurface conditions.3. Refer to "Soil Classification System and Key" figure for explanation of graphics and symbols.4. DOE Unique Well Number: BBP237
0251
64.
11/1
2/1
0 Y
:\025
\164
\T\A
UB
UR
N B
OR
ING
S A
ND
WE
LLS
\BO
RIN
G A
ND
WE
LL L
OG
S\0
2516
4 -
MA
ST
ER
FIL
E.G
PJ
SO
IL B
OR
ING
LO
G W
ITH
GR
AP
H
AGW172
84.25
Log of Boring AGW172 A-11(1 of 2)
Figure
0251
64.
11/1
2/1
0 Y
:\025
\164
\T\A
UB
UR
N B
OR
ING
S A
ND
WE
LLS
\BO
RIN
G A
ND
WE
LL L
OG
S\0
2516
4 -
MA
ST
ER
FIL
E.G
PJ
SO
IL B
OR
ING
LO
G W
ITH
GR
AP
H
Boeing AuburnRemedial InvestigationAuburn, Washington
9/9/
10

d
d
i4
d
d
SP
GP
Gray, fine to medium SAND (mediumdense, wet)
- grades fine to coarse sand
Brown, sandy, fine to coarse GRAVEL(medium dense, wet)
- grades with sand
S-13
S-14
Run 6
S-15
S-16
Boring Completed 09/02/10. Total Depth of Boring = 60.0 ft.Monitoring Well Completed 09/02/10Total Depth of Monitoring Well = 59.5 ft.
SPT N-Value
10 20 30 40
Moisture Content (%)
5 10 15 20
Fines Content (%)
5 10 15 20
(DO
E#:
BB
P23
7)W
EL
L D
ET
AIL
35
40
45
50
55
60
65
70
Ele
vatio
n (f
t)
45
40
35
30
25
Notes:
Sam
pler
Typ
e
Blo
ws/
Foo
t
Tes
t D
ata
LiquidLimit
Sam
ple
Num
ber
& I
nter
val
Non-Standard N-Value
Gra
phic
Sym
bol
Dep
th (
ft)
US
CS
Sym
bol
Drilled By:
SOIL PROFILE
Ground Elevation (ft):
Drilling Method:
Boart Longyear
SAMPLE DATA
Rotosonic
PlasticLimit
1. Stratigraphic contacts are based on field interpretations and are approximate.2. Reference to the text of this report is necessary for a proper understanding of subsurface conditions.3. Refer to "Soil Classification System and Key" figure for explanation of graphics and symbols.4. DOE Unique Well Number: BBP237
0251
64.
11/1
2/1
0 Y
:\025
\164
\T\A
UB
UR
N B
OR
ING
S A
ND
WE
LLS
\BO
RIN
G A
ND
WE
LL L
OG
S\0
2516
4 -
MA
ST
ER
FIL
E.G
PJ
SO
IL B
OR
ING
LO
G W
ITH
GR
AP
H
AGW172
84.25
Log of Boring AGW172 A-11(2 of 2)
Figure
0251
64.
11/1
2/1
0 Y
:\025
\164
\T\A
UB
UR
N B
OR
ING
S A
ND
WE
LLS
\BO
RIN
G A
ND
WE
LL L
OG
S\0
2516
4 -
MA
ST
ER
FIL
E.G
PJ
SO
IL B
OR
ING
LO
G W
ITH
GR
AP
H
Boeing AuburnRemedial InvestigationAuburn, Washington

d
i4
d
d
i4
d
d
i4d
ACSM
GP
SP
GP
SP
GP
3-inches asphalt concrete pavement
Gray, silty, gravelly, fine to coarse SAND(dense, damp)
- grades brown
- grades brownish-gray
Dark gray, very sandy, fine to coarseGRAVEL (dense, wet)
Dark gray, fine to medium SAND (dense,wet)
Dark gray, very sandy, fine to coarseGRAVEL (dense, wet)
Dark gray, fine to medium SAND (dense,wet)
Dark gray, very sandy, fine to coarseGRAVEL (dense, wet)
S-1
Run 1
S-2
S-3
Run 2
S-4
S-5
Run 3S-6
SPT N-Value
10 20 30 40
Moisture Content (%)
5 10 15 20
Fines Content (%)
5 10 15 20
(DO
E#:
BB
P23
6)W
EL
L D
ET
AIL
0
5
10
15
20
25
30
35
Ele
vatio
n (f
t)
85
80
75
70
65
60
55
Notes:
Sam
pler
Typ
e
Blo
ws/
Foo
t
Tes
t D
ata
LiquidLimit
Sam
ple
Num
ber
& I
nter
val
Non-Standard N-Value
Gra
phic
Sym
bol
Dep
th (
ft)
US
CS
Sym
bol
Drilled By:
SOIL PROFILE
Ground Elevation (ft):
Drilling Method:
Boart Longyear
SAMPLE DATA
Rotosonic
PlasticLimit
1. Stratigraphic contacts are based on field interpretations and are approximate.2. Reference to the text of this report is necessary for a proper understanding of subsurface conditions.3. Refer to "Soil Classification System and Key" figure for explanation of graphics and symbols.4. DOE Unique Well Number: BBP236
0251
64.
11/1
2/1
0 Y
:\025
\164
\T\A
UB
UR
N B
OR
ING
S A
ND
WE
LLS
\BO
RIN
G A
ND
WE
LL L
OG
S\0
2516
4 -
MA
ST
ER
FIL
E.G
PJ
SO
IL B
OR
ING
LO
G W
ITH
GR
AP
H
AGW173
85.68
Log of Boring AGW173 A-12(1 of 2)
Figure
0251
64.
11/1
2/1
0 Y
:\025
\164
\T\A
UB
UR
N B
OR
ING
S A
ND
WE
LLS
\BO
RIN
G A
ND
WE
LL L
OG
S\0
2516
4 -
MA
ST
ER
FIL
E.G
PJ
SO
IL B
OR
ING
LO
G W
ITH
GR
AP
H
Boeing AuburnRemedial InvestigationAuburn, Washington
AT
D

d
d
d
d
i4
d
d
GP
SP
SP
GP
SM
GP
Dark gray, very sandy, fine to coarseGRAVEL (dense, wet)
Dark gray, fine to medium SAND (mediumdense, wet)
Dark gray, medium to coarse SAND(medium dense, wet)
Dark gray, sandy, fine to coarse GRAVEL(medium dense, wet)
Gray, silty, fine SAND (medium dense, wet)
- grades very silty (medium dense, wet)
Brown, sandy, fine to coarse GRAVEL(dense, wet)
S-7
S-8
S-9
S-10
Run 4
S-11
S-12
Boring Completed 09/01/10. Total Depth of Boring = 60.0 ft.Monitoring Well Completed 09/01/10Total Depth of Monitoring Well = 50.9 ft.
SPT N-Value
10 20 30 40
Moisture Content (%)
5 10 15 20
Fines Content (%)
5 10 15 20
(DO
E#:
BB
P23
6)W
EL
L D
ET
AIL
35
40
45
50
55
60
65
70
Ele
vatio
n (f
t)
50
45
40
35
30
Notes:
Sam
pler
Typ
e
Blo
ws/
Foo
t
Tes
t D
ata
LiquidLimit
Sam
ple
Num
ber
& I
nter
val
Non-Standard N-Value
Gra
phic
Sym
bol
Dep
th (
ft)
US
CS
Sym
bol
Drilled By:
SOIL PROFILE
Ground Elevation (ft):
Drilling Method:
Boart Longyear
SAMPLE DATA
Rotosonic
PlasticLimit
1. Stratigraphic contacts are based on field interpretations and are approximate.2. Reference to the text of this report is necessary for a proper understanding of subsurface conditions.3. Refer to "Soil Classification System and Key" figure for explanation of graphics and symbols.4. DOE Unique Well Number: BBP236
0251
64.
11/1
2/1
0 Y
:\025
\164
\T\A
UB
UR
N B
OR
ING
S A
ND
WE
LLS
\BO
RIN
G A
ND
WE
LL L
OG
S\0
2516
4 -
MA
ST
ER
FIL
E.G
PJ
SO
IL B
OR
ING
LO
G W
ITH
GR
AP
H
AGW173
85.68
Log of Boring AGW173 A-12(2 of 2)
Figure
0251
64.
11/1
2/1
0 Y
:\025
\164
\T\A
UB
UR
N B
OR
ING
S A
ND
WE
LLS
\BO
RIN
G A
ND
WE
LL L
OG
S\0
2516
4 -
MA
ST
ER
FIL
E.G
PJ
SO
IL B
OR
ING
LO
G W
ITH
GR
AP
H
Boeing AuburnRemedial InvestigationAuburn, Washington

i4d
d
i4
d
d
i4d
d
SM
SPSP-SM
SP
SP-SM
SP
SP-SM
SM
Not Sampled
Mottled brown, very silty, fine SAND withroots (medium dense, damp)
- grades moist
Black, fine to medium SAND (mediumdense, wet)
Grayish-brown, fine to medium SAND withsilt (medium dense, wet)
- grades dark gray
Black, fine to medium SAND (mediumdense, wet)
Brownish-gray, fine to medium SAND withsilt (medium dense, wet)
Dark brownish-gray, fine to medium SANDwith trace silt (medium dense, wet)
Dark gray with light gray grains, fine tomedium SAND with silt (medium dense, wet)
Gray, silty to very silty, fine SAND (mediumdense, wet)
Run 1S-1
S-2
Run 2
S-3
S-4
Run 3S-5
S-6
SPT N-Value
10 20 30 40
Moisture Content (%)
5 10 15 20
Fines Content (%)
5 10 15 20
(DO
E#:
BB
P23
2)W
EL
L D
ET
AIL
0
5
10
15
20
25
30
35
Ele
vatio
n (f
t)
75
70
65
60
55
50
45
Notes:
Sam
pler
Typ
e
Blo
ws/
Foo
t
Tes
t D
ata
LiquidLimit
Sam
ple
Num
ber
& I
nter
val
Non-Standard N-Value
Gra
phic
Sym
bol
Dep
th (
ft)
US
CS
Sym
bol
Drilled By:
SOIL PROFILE
Ground Elevation (ft):
Drilling Method:
Boart Longyear
SAMPLE DATA
Rotosonic
PlasticLimit
1. Stratigraphic contacts are based on field interpretations and are approximate.2. Reference to the text of this report is necessary for a proper understanding of subsurface conditions.3. Refer to "Soil Classification System and Key" figure for explanation of graphics and symbols.4. DOE Unique Well Number: BBP232
0251
64.
11/1
2/1
0 Y
:\025
\164
\T\A
UB
UR
N B
OR
ING
S A
ND
WE
LLS
\BO
RIN
G A
ND
WE
LL L
OG
S\0
2516
4 -
MA
ST
ER
FIL
E.G
PJ
SO
IL B
OR
ING
LO
G W
ITH
GR
AP
H
AGW174
78.03
Log of Boring AGW174 A-13(1 of 2)
Figure
0251
64.
11/1
2/1
0 Y
:\025
\164
\T\A
UB
UR
N B
OR
ING
S A
ND
WE
LLS
\BO
RIN
G A
ND
WE
LL L
OG
S\0
2516
4 -
MA
ST
ER
FIL
E.G
PJ
SO
IL B
OR
ING
LO
G W
ITH
GR
AP
H
Boeing AuburnRemedial InvestigationAuburn, Washington
AT
D

i4d
d
i4d
d
i4
d
SM
SP
SM
GP
GP
GP
Gray, silty to very silty, fine SAND (mediumdense, wet)
Dark gray, fine to medium SAND with tracesilt (medium dense, wet)
Dark gray, silty, fine SAND with gravel(medium dense, wet)
Brown, very sandy, fine to coarse GRAVEL(medium dense, wet)
Brown, coarse GRAVEL (medium dense,wet)
- grades sandy
Gray, sandy, fine to coarse GRAVEL(medium dense, wet)
- grades with sand
Run 4S-7
S-8
Run 5S-9
S-10
Run 6
S-11
Boring Completed 08/23/10. Total Depth of Boring = 60.0 ft.Monitoring Well Completed 08/23/10Total Depth of Monitoring Well = 59.2 ft.
SPT N-Value
10 20 30 40
Moisture Content (%)
5 10 15 20
Fines Content (%)
5 10 15 20
(DO
E#:
BB
P23
2)W
EL
L D
ET
AIL
35
40
45
50
55
60
65
70
Ele
vatio
n (f
t)
40
35
30
25
20
Notes:
Sam
pler
Typ
e
Blo
ws/
Foo
t
Tes
t D
ata
LiquidLimit
Sam
ple
Num
ber
& I
nter
val
Non-Standard N-Value
Gra
phic
Sym
bol
Dep
th (
ft)
US
CS
Sym
bol
Drilled By:
SOIL PROFILE
Ground Elevation (ft):
Drilling Method:
Boart Longyear
SAMPLE DATA
Rotosonic
PlasticLimit
1. Stratigraphic contacts are based on field interpretations and are approximate.2. Reference to the text of this report is necessary for a proper understanding of subsurface conditions.3. Refer to "Soil Classification System and Key" figure for explanation of graphics and symbols.4. DOE Unique Well Number: BBP232
0251
64.
11/1
2/1
0 Y
:\025
\164
\T\A
UB
UR
N B
OR
ING
S A
ND
WE
LLS
\BO
RIN
G A
ND
WE
LL L
OG
S\0
2516
4 -
MA
ST
ER
FIL
E.G
PJ
SO
IL B
OR
ING
LO
G W
ITH
GR
AP
H
AGW174
78.03
Log of Boring AGW174 A-13(2 of 2)
Figure
0251
64.
11/1
2/1
0 Y
:\025
\164
\T\A
UB
UR
N B
OR
ING
S A
ND
WE
LLS
\BO
RIN
G A
ND
WE
LL L
OG
S\0
2516
4 -
MA
ST
ER
FIL
E.G
PJ
SO
IL B
OR
ING
LO
G W
ITH
GR
AP
H
Boeing AuburnRemedial InvestigationAuburn, Washington
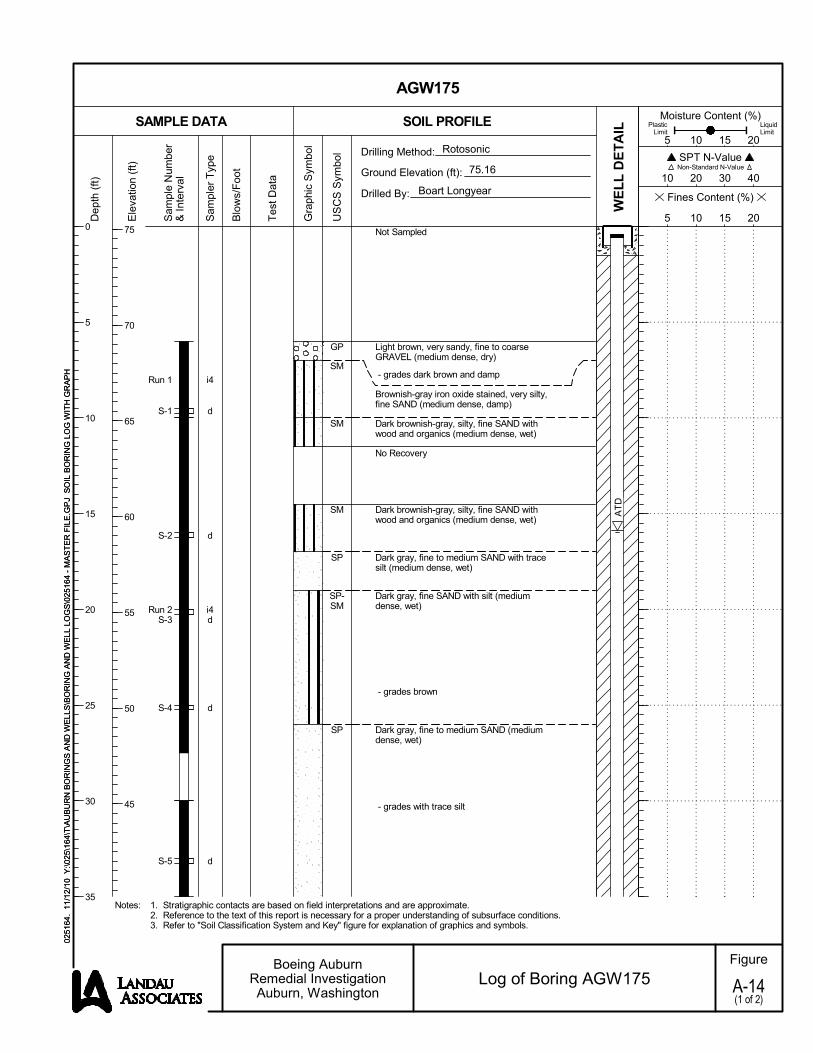
i4
d
d
i4d
d
d
GP
SM
SM
SM
SP
SP-SM
SP
Not Sampled
Light brown, very sandy, fine to coarseGRAVEL (medium dense, dry)
- grades dark brown and damp
Brownish-gray iron oxide stained, very silty,fine SAND (medium dense, damp)
Dark brownish-gray, silty, fine SAND withwood and organics (medium dense, wet)
No Recovery
Dark brownish-gray, silty, fine SAND withwood and organics (medium dense, wet)
Dark gray, fine to medium SAND with tracesilt (medium dense, wet)
Dark gray, fine SAND with silt (mediumdense, wet)
- grades brown
Dark gray, fine to medium SAND (mediumdense, wet)
- grades with trace silt
Run 1
S-1
S-2
Run 2S-3
S-4
S-5
SPT N-Value
10 20 30 40
Moisture Content (%)
5 10 15 20
Fines Content (%)
5 10 15 20
WE
LL
DE
TA
IL
0
5
10
15
20
25
30
35
Ele
vatio
n (f
t)
75
70
65
60
55
50
45
Notes:
Sam
pler
Typ
e
Blo
ws/
Foo
t
Tes
t D
ata
LiquidLimit
Sam
ple
Num
ber
& I
nter
val
Non-Standard N-Value
Gra
phic
Sym
bol
Dep
th (
ft)
US
CS
Sym
bol
Drilled By:
SOIL PROFILE
Ground Elevation (ft):
Drilling Method:
Boart Longyear
SAMPLE DATA
Rotosonic
PlasticLimit
1. Stratigraphic contacts are based on field interpretations and are approximate.2. Reference to the text of this report is necessary for a proper understanding of subsurface conditions.3. Refer to "Soil Classification System and Key" figure for explanation of graphics and symbols.
0251
64.
11/1
2/1
0 Y
:\025
\164
\T\A
UB
UR
N B
OR
ING
S A
ND
WE
LLS
\BO
RIN
G A
ND
WE
LL L
OG
S\0
2516
4 -
MA
ST
ER
FIL
E.G
PJ
SO
IL B
OR
ING
LO
G W
ITH
GR
AP
H
AGW175
75.16
Log of Boring AGW175 A-14(1 of 2)
Figure
0251
64.
11/1
2/1
0 Y
:\025
\164
\T\A
UB
UR
N B
OR
ING
S A
ND
WE
LLS
\BO
RIN
G A
ND
WE
LL L
OG
S\0
2516
4 -
MA
ST
ER
FIL
E.G
PJ
SO
IL B
OR
ING
LO
G W
ITH
GR
AP
H
Boeing AuburnRemedial InvestigationAuburn, Washington
AT
D

d
i4
d
d
d
i4
d
SP
ML
SM
GP-GM
SP
GP
Dark gray, fine to medium SAND (mediumdense, wet)
- grades gray
Gray, fine sandy SILT (stiff, wet)
Gray, very silty, fine SAND (medium dense,wet)
Brown, fine to coarse GRAVEL with silt andsand (medium dense, wet)
Grayish-brown, fine to coarse SAND withtrace gravel (medium dense, wet)
Grayish-brown, fine to coarse GRAVEL withsand (medium dense, wet)
- grades sandy
S-6
Run 3
S-7
S-8
S-9
Run 4
S-10
Boring Completed 08/27/10. Total Depth of Boring = 60.0 ft.Monitoring Well Completed 08/27/10Total Depth of Monitoring Well = 58.2 ft.
SPT N-Value
10 20 30 40
Moisture Content (%)
5 10 15 20
Fines Content (%)
5 10 15 20
WE
LL
DE
TA
IL
35
40
45
50
55
60
65
70
Ele
vatio
n (f
t)
40
35
30
25
20
Notes:
Sam
pler
Typ
e
Blo
ws/
Foo
t
Tes
t D
ata
LiquidLimit
Sam
ple
Num
ber
& I
nter
val
Non-Standard N-Value
Gra
phic
Sym
bol
Dep
th (
ft)
US
CS
Sym
bol
Drilled By:
SOIL PROFILE
Ground Elevation (ft):
Drilling Method:
Boart Longyear
SAMPLE DATA
Rotosonic
PlasticLimit
1. Stratigraphic contacts are based on field interpretations and are approximate.2. Reference to the text of this report is necessary for a proper understanding of subsurface conditions.3. Refer to "Soil Classification System and Key" figure for explanation of graphics and symbols.
0251
64.
11/1
2/1
0 Y
:\025
\164
\T\A
UB
UR
N B
OR
ING
S A
ND
WE
LLS
\BO
RIN
G A
ND
WE
LL L
OG
S\0
2516
4 -
MA
ST
ER
FIL
E.G
PJ
SO
IL B
OR
ING
LO
G W
ITH
GR
AP
H
AGW175
75.16
Log of Boring AGW175 A-14(2 of 2)
Figure
0251
64.
11/1
2/1
0 Y
:\025
\164
\T\A
UB
UR
N B
OR
ING
S A
ND
WE
LLS
\BO
RIN
G A
ND
WE
LL L
OG
S\0
2516
4 -
MA
ST
ER
FIL
E.G
PJ
SO
IL B
OR
ING
LO
G W
ITH
GR
AP
H
Boeing AuburnRemedial InvestigationAuburn, Washington
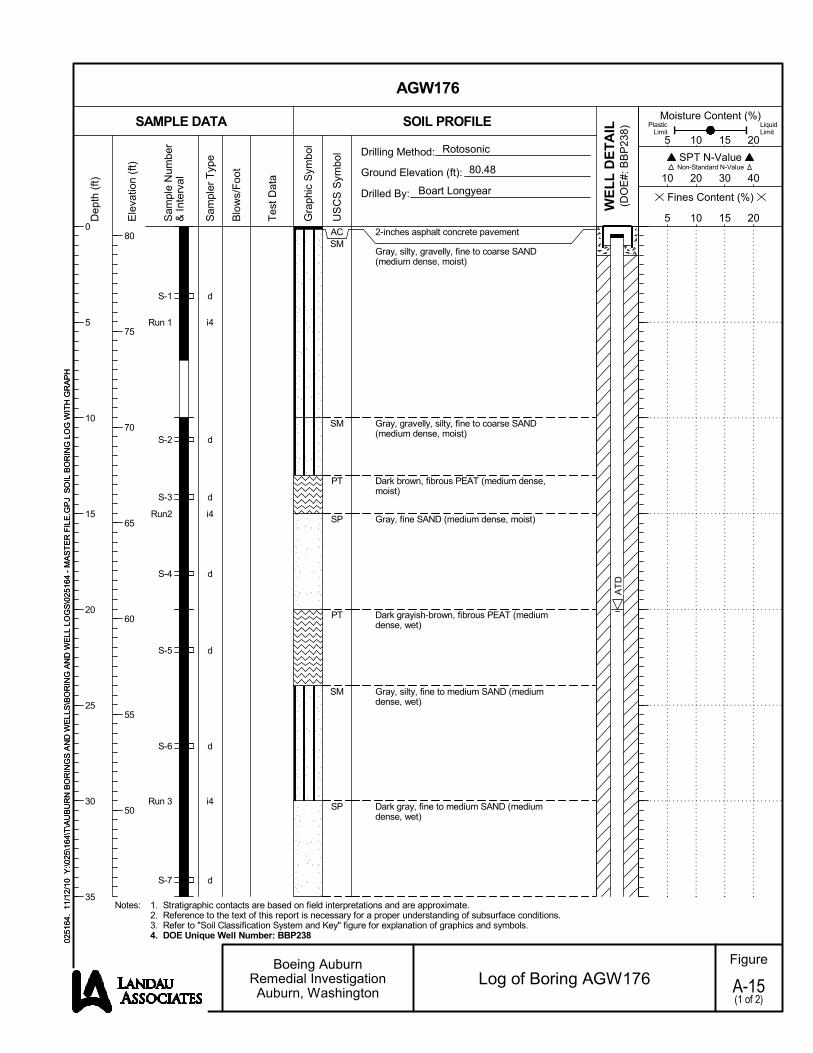
d
i4
d
d
i4
d
d
d
i4
d
ACSM
SM
PT
SP
PT
SM
SP
2-inches asphalt concrete pavement
Gray, silty, gravelly, fine to coarse SAND(medium dense, moist)
Gray, gravelly, silty, fine to coarse SAND(medium dense, moist)
Dark brown, fibrous PEAT (medium dense,moist)
Gray, fine SAND (medium dense, moist)
Dark grayish-brown, fibrous PEAT (mediumdense, wet)
Gray, silty, fine to medium SAND (mediumdense, wet)
Dark gray, fine to medium SAND (mediumdense, wet)
S-1
Run 1
S-2
S-3
Run2
S-4
S-5
S-6
Run 3
S-7
SPT N-Value
10 20 30 40
Moisture Content (%)
5 10 15 20
Fines Content (%)
5 10 15 20
(DO
E#:
BB
P23
8)W
EL
L D
ET
AIL
0
5
10
15
20
25
30
35
Ele
vatio
n (f
t)
80
75
70
65
60
55
50
Notes:
Sam
pler
Typ
e
Blo
ws/
Foo
t
Tes
t D
ata
LiquidLimit
Sam
ple
Num
ber
& I
nter
val
Non-Standard N-Value
Gra
phic
Sym
bol
Dep
th (
ft)
US
CS
Sym
bol
Drilled By:
SOIL PROFILE
Ground Elevation (ft):
Drilling Method:
Boart Longyear
SAMPLE DATA
Rotosonic
PlasticLimit
1. Stratigraphic contacts are based on field interpretations and are approximate.2. Reference to the text of this report is necessary for a proper understanding of subsurface conditions.3. Refer to "Soil Classification System and Key" figure for explanation of graphics and symbols.4. DOE Unique Well Number: BBP238
0251
64.
11/1
2/1
0 Y
:\025
\164
\T\A
UB
UR
N B
OR
ING
S A
ND
WE
LLS
\BO
RIN
G A
ND
WE
LL L
OG
S\0
2516
4 -
MA
ST
ER
FIL
E.G
PJ
SO
IL B
OR
ING
LO
G W
ITH
GR
AP
H
AGW176
80.48
Log of Boring AGW176 A-15(1 of 2)
Figure
0251
64.
11/1
2/1
0 Y
:\025
\164
\T\A
UB
UR
N B
OR
ING
S A
ND
WE
LLS
\BO
RIN
G A
ND
WE
LL L
OG
S\0
2516
4 -
MA
ST
ER
FIL
E.G
PJ
SO
IL B
OR
ING
LO
G W
ITH
GR
AP
H
Boeing AuburnRemedial InvestigationAuburn, Washington
AT
D

d
d
i4d
d
d
i4
d
GP
SP
GP
SP
SM
GM
GP
Gray, sandy, fine to coarse GRAVEL(medium dense, wet)
Dark gray, fine to medium SAND (mediumdense, wet)
Gray, sandy, fine to coarse GRAVEL(dense, wet)
Dark gray, gravelly, fine to coarse SAND(dense, wet)
Brown, very silty, fine to medium SAND(dense, wet)
Brown, silty, sandy, fine to coarse GRAVEL(dense, wet)
Brown, sandy, fine to coarse GRAVEL(dense, wet)
- grades gray
S-8
S-9
Run 4S-10
S-11
S-12
Run 5
S-13
Boring Completed 09/03/10. Total Depth of Boring = 60.0 ft.Monitoring Well Completed 09/03/10Total Depth of Monitoring Well = 59.0 ft.
SPT N-Value
10 20 30 40
Moisture Content (%)
5 10 15 20
Fines Content (%)
5 10 15 20
(DO
E#:
BB
P23
8)W
EL
L D
ET
AIL
35
40
45
50
55
60
65
70
Ele
vatio
n (f
t)
45
40
35
30
25
Notes:
Sam
pler
Typ
e
Blo
ws/
Foo
t
Tes
t D
ata
LiquidLimit
Sam
ple
Num
ber
& I
nter
val
Non-Standard N-Value
Gra
phic
Sym
bol
Dep
th (
ft)
US
CS
Sym
bol
Drilled By:
SOIL PROFILE
Ground Elevation (ft):
Drilling Method:
Boart Longyear
SAMPLE DATA
Rotosonic
PlasticLimit
1. Stratigraphic contacts are based on field interpretations and are approximate.2. Reference to the text of this report is necessary for a proper understanding of subsurface conditions.3. Refer to "Soil Classification System and Key" figure for explanation of graphics and symbols.4. DOE Unique Well Number: BBP238
0251
64.
11/1
2/1
0 Y
:\025
\164
\T\A
UB
UR
N B
OR
ING
S A
ND
WE
LLS
\BO
RIN
G A
ND
WE
LL L
OG
S\0
2516
4 -
MA
ST
ER
FIL
E.G
PJ
SO
IL B
OR
ING
LO
G W
ITH
GR
AP
H
AGW176
80.48
Log of Boring AGW176 A-15(2 of 2)
Figure
0251
64.
11/1
2/1
0 Y
:\025
\164
\T\A
UB
UR
N B
OR
ING
S A
ND
WE
LLS
\BO
RIN
G A
ND
WE
LL L
OG
S\0
2516
4 -
MA
ST
ER
FIL
E.G
PJ
SO
IL B
OR
ING
LO
G W
ITH
GR
AP
H
Boeing AuburnRemedial InvestigationAuburn, Washington

d
d
d
d
d
d
d
d
d
ACSM
PT
SM
SP-SM
SP
SP
SP
SP
2-inches asphalt concrete pavement
Gray, silty, gravelly, fine to coarse SAND(medium dense, moist)
- grades brown and with organics
Brown, fibrous PEAT (medium dense, wet)
Grayish-brown, silty, fine SAND with gravel(medium dense, wet)
- grades with trace gravel
Dark gray, fine to medium SAND with silt(medium dense, wet)
Dark gray, fine to medium SAND (mediumdense, wet)
Dark gray, gravelly, fine to coarse SAND(very dense, wet)
Dark brownish-gray, gravelly, fine to coarseSAND (medium dense, wet)
S-1
Run 1
S-2
S-3
S-4
Run 2
S-5
S-6
Run 3
S-7
S-8
S-9
SPT N-Value
10 20 30 40
Moisture Content (%)
5 10 15 20
Fines Content (%)
5 10 15 20
(DO
E#:
BB
P23
9)W
EL
L D
ET
AIL
0
5
10
15
20
25
30
35
Ele
vatio
n (f
t)
75
70
65
60
55
50
45
Notes:
Sam
pler
Typ
e
Blo
ws/
Foo
t
Tes
t D
ata
LiquidLimit
Sam
ple
Num
ber
& I
nter
val
Non-Standard N-Value
Gra
phic
Sym
bol
Dep
th (
ft)
US
CS
Sym
bol
Drilled By:
SOIL PROFILE
Ground Elevation (ft):
Drilling Method:
Boart Longyear
SAMPLE DATA
Rotosonic
PlasticLimit
1. Stratigraphic contacts are based on field interpretations and are approximate.2. Reference to the text of this report is necessary for a proper understanding of subsurface conditions.3. Refer to "Soil Classification System and Key" figure for explanation of graphics and symbols.4. DOE Unique Well Number: BBP239
0251
64.
11/1
2/1
0 Y
:\025
\164
\T\A
UB
UR
N B
OR
ING
S A
ND
WE
LLS
\BO
RIN
G A
ND
WE
LL L
OG
S\0
2516
4 -
MA
ST
ER
FIL
E.G
PJ
SO
IL B
OR
ING
LO
G W
ITH
GR
AP
H
AGW177
77.76
Log of Boring AGW177 A-16(1 of 2)
Figure
0251
64.
11/1
2/1
0 Y
:\025
\164
\T\A
UB
UR
N B
OR
ING
S A
ND
WE
LLS
\BO
RIN
G A
ND
WE
LL L
OG
S\0
2516
4 -
MA
ST
ER
FIL
E.G
PJ
SO
IL B
OR
ING
LO
G W
ITH
GR
AP
H
Boeing AuburnRemedial InvestigationAuburn, Washington
AT
D

d
d
d
d
GP
GP
SP
GP
Dark gray, fine to coarse SAND with tracegravel (medium dense, wet)
Dark brownish-gray, sandy, fine to coarseGRAVEl (dense, wet)
No Recovery
Gray, sandy, fine to coarse GRAVEL(dense, wet)
Grayish-brown, fine to coarse SAND withgravel (medium dense, wet)
Grayish-brown, sandy, fine to coarseGRAVEl (dense, wet)
- grades brown and without sand
Run 4
S-10
S-11
Run 5
S-12
S-13
Boring Completed 09/21/10. Total Depth of Boring = 60.0 ft.Monitoring Well Completed 09/21/10Total Depth of Monitoring Well = 58.5 ft.
SPT N-Value
10 20 30 40
Moisture Content (%)
5 10 15 20
Fines Content (%)
5 10 15 20
(DO
E#:
BB
P23
9)W
EL
L D
ET
AIL
35
40
45
50
55
60
65
70
Ele
vatio
n (f
t)
40
35
30
25
20
Notes:
Sam
pler
Typ
e
Blo
ws/
Foo
t
Tes
t D
ata
LiquidLimit
Sam
ple
Num
ber
& I
nter
val
Non-Standard N-Value
Gra
phic
Sym
bol
Dep
th (
ft)
US
CS
Sym
bol
Drilled By:
SOIL PROFILE
Ground Elevation (ft):
Drilling Method:
Boart Longyear
SAMPLE DATA
Rotosonic
PlasticLimit
1. Stratigraphic contacts are based on field interpretations and are approximate.2. Reference to the text of this report is necessary for a proper understanding of subsurface conditions.3. Refer to "Soil Classification System and Key" figure for explanation of graphics and symbols.4. DOE Unique Well Number: BBP239
0251
64.
11/1
2/1
0 Y
:\025
\164
\T\A
UB
UR
N B
OR
ING
S A
ND
WE
LLS
\BO
RIN
G A
ND
WE
LL L
OG
S\0
2516
4 -
MA
ST
ER
FIL
E.G
PJ
SO
IL B
OR
ING
LO
G W
ITH
GR
AP
H
AGW177
77.76
Log of Boring AGW177 A-16(2 of 2)
Figure
0251
64.
11/1
2/1
0 Y
:\025
\164
\T\A
UB
UR
N B
OR
ING
S A
ND
WE
LLS
\BO
RIN
G A
ND
WE
LL L
OG
S\0
2516
4 -
MA
ST
ER
FIL
E.G
PJ
SO
IL B
OR
ING
LO
G W
ITH
GR
AP
H
Boeing AuburnRemedial InvestigationAuburn, Washington

d
d
d
d
d
d
ACSM
SM
SM
SP
GP
SP
2-inches asphalt concrete pavement
Gray, silty, gravelly, fine to coarse SAND(medium dense, moist)
Brown, silty, fine to medium SAND withorganics and gravel (medium dense, moist)
Dark gray, silty, fine to medium SAND(medium dense, wet)
Dark gray, fine to medium SAND (mediumdense, wet)
Dark gray, fine to coarse GRAVEL with sand(dense, wet)
Dark gray, fine to medium SAND with tracegravel (dense, wet)
- grades without gravel
S-1
S-2
Run 1
S-3
Run 2
S-4
S-5
Run 3
S-6
SPT N-Value
10 20 30 40
Moisture Content (%)
5 10 15 20
Fines Content (%)
5 10 15 20
(DO
E#:
BB
P24
0)W
EL
L D
ET
AIL
0
5
10
15
20
25
30
35
Ele
vatio
n (f
t)
75
70
65
60
55
50
45
Notes:
Sam
pler
Typ
e
Blo
ws/
Foo
t
Tes
t D
ata
LiquidLimit
Sam
ple
Num
ber
& I
nter
val
Non-Standard N-Value
Gra
phic
Sym
bol
Dep
th (
ft)
US
CS
Sym
bol
Drilled By:
SOIL PROFILE
Ground Elevation (ft):
Drilling Method:
Boart Longyear
SAMPLE DATA
Rotosonic
PlasticLimit
1. Stratigraphic contacts are based on field interpretations and are approximate.2. Reference to the text of this report is necessary for a proper understanding of subsurface conditions.3. Refer to "Soil Classification System and Key" figure for explanation of graphics and symbols.4. DOE Unique Well Number: BBP240
0251
64.
11/1
2/1
0 Y
:\025
\164
\T\A
UB
UR
N B
OR
ING
S A
ND
WE
LLS
\BO
RIN
G A
ND
WE
LL L
OG
S\0
2516
4 -
MA
ST
ER
FIL
E.G
PJ
SO
IL B
OR
ING
LO
G W
ITH
GR
AP
H
AGW178
77.74
Log of Boring AGW178 A-17(1 of 3)
Figure
0251
64.
11/1
2/1
0 Y
:\025
\164
\T\A
UB
UR
N B
OR
ING
S A
ND
WE
LLS
\BO
RIN
G A
ND
WE
LL L
OG
S\0
2516
4 -
MA
ST
ER
FIL
E.G
PJ
SO
IL B
OR
ING
LO
G W
ITH
GR
AP
H
Boeing AuburnRemedial InvestigationAuburn, Washington
9/24
/10

d
d
d
d
d
SP
GP
SP
SP
Dark gray, fine to coarse GRAVEL with sand(dense, wet)
Brown, fine to coarse SAND with gravel(dense, wet)
Dark gray, fine to medium SAND (mediumdense, wet)
Run 4S-7
S-8
S-9
Run 5
S-10
S-11
Run 6
SPT N-Value
10 20 30 40
Moisture Content (%)
5 10 15 20
Fines Content (%)
5 10 15 20
(DO
E#:
BB
P24
0)W
EL
L D
ET
AIL
35
40
45
50
55
60
65
70
Ele
vatio
n (f
t)
40
35
30
25
20
15
10
Notes:
Sam
pler
Typ
e
Blo
ws/
Foo
t
Tes
t D
ata
LiquidLimit
Sam
ple
Num
ber
& I
nter
val
Non-Standard N-Value
Gra
phic
Sym
bol
Dep
th (
ft)
US
CS
Sym
bol
Drilled By:
SOIL PROFILE
Ground Elevation (ft):
Drilling Method:
Boart Longyear
SAMPLE DATA
Rotosonic
PlasticLimit
1. Stratigraphic contacts are based on field interpretations and are approximate.2. Reference to the text of this report is necessary for a proper understanding of subsurface conditions.3. Refer to "Soil Classification System and Key" figure for explanation of graphics and symbols.4. DOE Unique Well Number: BBP240
0251
64.
11/1
2/1
0 Y
:\025
\164
\T\A
UB
UR
N B
OR
ING
S A
ND
WE
LLS
\BO
RIN
G A
ND
WE
LL L
OG
S\0
2516
4 -
MA
ST
ER
FIL
E.G
PJ
SO
IL B
OR
ING
LO
G W
ITH
GR
AP
H
AGW178
77.74
Log of Boring AGW178 A-17(2 of 3)
Figure
0251
64.
11/1
2/1
0 Y
:\025
\164
\T\A
UB
UR
N B
OR
ING
S A
ND
WE
LLS
\BO
RIN
G A
ND
WE
LL L
OG
S\0
2516
4 -
MA
ST
ER
FIL
E.G
PJ
SO
IL B
OR
ING
LO
G W
ITH
GR
AP
H
Boeing AuburnRemedial InvestigationAuburn, Washington

d
d
SP
GP
GP
Dark gray, fine to medium SAND (mediumdense, wet)
- grades with gravel
Brown, fine to coarse GRAVEL (mediumdense, wet)
- grades sandy and dense
Brown, fine to coarse GRAVEL with sand(dense, wet)
S-12
S-13
Run 7
Run 8
Boring Completed 09/22/10. Total Depth of Boring = 95.0 ft.Monitoring Well Completed 09/22/10Total Depth of Monitoring Well = 95.0 ft.
SPT N-Value
10 20 30 40
Moisture Content (%)
5 10 15 20
Fines Content (%)
5 10 15 20
(DO
E#:
BB
P24
0)W
EL
L D
ET
AIL
70
75
80
85
90
95
100
105
Ele
vatio
n (f
t)
5
0
-5
-10
-15
Notes:
Sam
pler
Typ
e
Blo
ws/
Foo
t
Tes
t D
ata
LiquidLimit
Sam
ple
Num
ber
& I
nter
val
Non-Standard N-Value
Gra
phic
Sym
bol
Dep
th (
ft)
US
CS
Sym
bol
Drilled By:
SOIL PROFILE
Ground Elevation (ft):
Drilling Method:
Boart Longyear
SAMPLE DATA
Rotosonic
PlasticLimit
1. Stratigraphic contacts are based on field interpretations and are approximate.2. Reference to the text of this report is necessary for a proper understanding of subsurface conditions.3. Refer to "Soil Classification System and Key" figure for explanation of graphics and symbols.4. DOE Unique Well Number: BBP240
0251
64.
11/1
2/1
0 Y
:\025
\164
\T\A
UB
UR
N B
OR
ING
S A
ND
WE
LLS
\BO
RIN
G A
ND
WE
LL L
OG
S\0
2516
4 -
MA
ST
ER
FIL
E.G
PJ
SO
IL B
OR
ING
LO
G W
ITH
GR
AP
H
AGW178
77.74
Log of Boring AGW178 A-17(3 of 3)
Figure
0251
64.
11/1
2/1
0 Y
:\025
\164
\T\A
UB
UR
N B
OR
ING
S A
ND
WE
LLS
\BO
RIN
G A
ND
WE
LL L
OG
S\0
2516
4 -
MA
ST
ER
FIL
E.G
PJ
SO
IL B
OR
ING
LO
G W
ITH
GR
AP
H
Boeing AuburnRemedial InvestigationAuburn, Washington

d
i4d
d
d
i4
d
d
i4
d
d
ACSM
SM
SP-SM
SP
SP-SM
GPSP
GP
SP
GP
SP
2-inches asphalt concrete pavement
Gray, silty, fine to coarse SAND withorganics (medium dense, moist)
Brown, mottled, very silty, fine to mediumSAND with organics (medium dense, moist)
Gray, fine to medium SAND with silt(medium dense, moist)
Gray, fine to medium SAND with trace silt(medium dense, moist)
Brownish-gray, fine to medium SAND withsilt (medium dense, moist)
Dark gray, sandy, fine to coarse GRAVEL(medium dense, wet)
Dark gray, fine to coarse SAND with gravel(medium dense, wet)
Dark gray, sandy, fine to coarse GRAVEL(medium dense, wet)
Dark gray, fine to medium SAND (mediumdense, wet)
Dark gray, sandy, fine to coarse GRAVEL(medium dense, wet)
Dark gray, fine to coarse SAND with gravel(medium dense, wet)
S-1
Run 1S-2
S-3
S-4
Run 2
S-5
S-6
Run 3
S-7
S-8
SPT N-Value
10 20 30 40
Moisture Content (%)
5 10 15 20
Fines Content (%)
5 10 15 20
(DO
E#:
BB
P24
1)W
EL
L D
ET
AIL
0
5
10
15
20
25
30
35
Ele
vatio
n (f
t)
75
70
65
60
55
50
45
Notes:
Sam
pler
Typ
e
Blo
ws/
Foo
t
Tes
t D
ata
LiquidLimit
Sam
ple
Num
ber
& I
nter
val
Non-Standard N-Value
Gra
phic
Sym
bol
Dep
th (
ft)
US
CS
Sym
bol
Drilled By:
SOIL PROFILE
Ground Elevation (ft):
Drilling Method:
Boart Longyear
SAMPLE DATA
Rotosonic
PlasticLimit
1. Stratigraphic contacts are based on field interpretations and are approximate.2. Reference to the text of this report is necessary for a proper understanding of subsurface conditions.3. Refer to "Soil Classification System and Key" figure for explanation of graphics and symbols.4. DOE Unique Well Number: BBP241
0251
64.
11/1
2/1
0 Y
:\025
\164
\T\A
UB
UR
N B
OR
ING
S A
ND
WE
LLS
\BO
RIN
G A
ND
WE
LL L
OG
S\0
2516
4 -
MA
ST
ER
FIL
E.G
PJ
SO
IL B
OR
ING
LO
G W
ITH
GR
AP
H
AGW179
79.22
Log of Boring AGW179 A-18(1 of 2)
Figure
0251
64.
11/1
2/1
0 Y
:\025
\164
\T\A
UB
UR
N B
OR
ING
S A
ND
WE
LLS
\BO
RIN
G A
ND
WE
LL L
OG
S\0
2516
4 -
MA
ST
ER
FIL
E.G
PJ
SO
IL B
OR
ING
LO
G W
ITH
GR
AP
H
Boeing AuburnRemedial InvestigationAuburn, Washington
AT
D
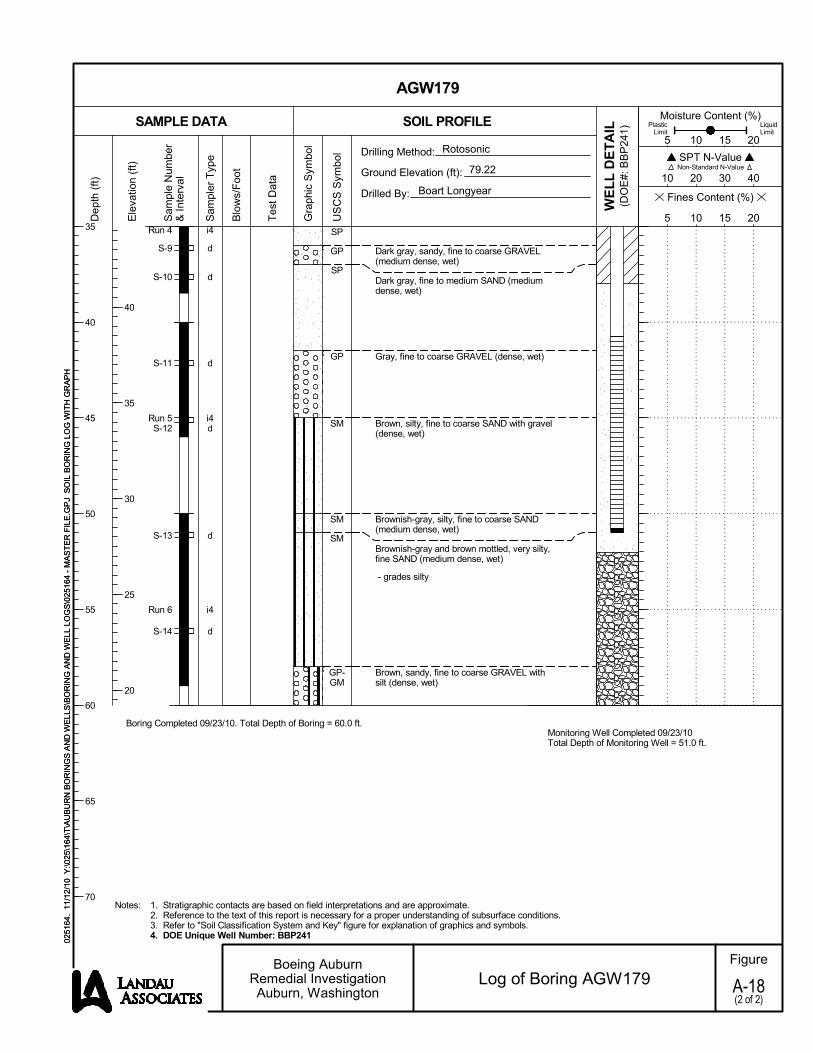
i4
d
d
d
i4d
d
i4
d
SP
GP
SP
GP
SM
SM
SM
GP-GM
Dark gray, sandy, fine to coarse GRAVEL(medium dense, wet)
Dark gray, fine to medium SAND (mediumdense, wet)
Gray, fine to coarse GRAVEL (dense, wet)
Brown, silty, fine to coarse SAND with gravel(dense, wet)
Brownish-gray, silty, fine to coarse SAND(medium dense, wet)
Brownish-gray and brown mottled, very silty,fine SAND (medium dense, wet)
- grades silty
Brown, sandy, fine to coarse GRAVEL withsilt (dense, wet)
Run 4
S-9
S-10
S-11
Run 5S-12
S-13
Run 6
S-14
Boring Completed 09/23/10. Total Depth of Boring = 60.0 ft.Monitoring Well Completed 09/23/10Total Depth of Monitoring Well = 51.0 ft.
SPT N-Value
10 20 30 40
Moisture Content (%)
5 10 15 20
Fines Content (%)
5 10 15 20
(DO
E#:
BB
P24
1)W
EL
L D
ET
AIL
35
40
45
50
55
60
65
70
Ele
vatio
n (f
t)
40
35
30
25
20
Notes:
Sam
pler
Typ
e
Blo
ws/
Foo
t
Tes
t D
ata
LiquidLimit
Sam
ple
Num
ber
& I
nter
val
Non-Standard N-Value
Gra
phic
Sym
bol
Dep
th (
ft)
US
CS
Sym
bol
Drilled By:
SOIL PROFILE
Ground Elevation (ft):
Drilling Method:
Boart Longyear
SAMPLE DATA
Rotosonic
PlasticLimit
1. Stratigraphic contacts are based on field interpretations and are approximate.2. Reference to the text of this report is necessary for a proper understanding of subsurface conditions.3. Refer to "Soil Classification System and Key" figure for explanation of graphics and symbols.4. DOE Unique Well Number: BBP241
0251
64.
11/1
2/1
0 Y
:\025
\164
\T\A
UB
UR
N B
OR
ING
S A
ND
WE
LLS
\BO
RIN
G A
ND
WE
LL L
OG
S\0
2516
4 -
MA
ST
ER
FIL
E.G
PJ
SO
IL B
OR
ING
LO
G W
ITH
GR
AP
H
AGW179
79.22
Log of Boring AGW179 A-18(2 of 2)
Figure
0251
64.
11/1
2/1
0 Y
:\025
\164
\T\A
UB
UR
N B
OR
ING
S A
ND
WE
LLS
\BO
RIN
G A
ND
WE
LL L
OG
S\0
2516
4 -
MA
ST
ER
FIL
E.G
PJ
SO
IL B
OR
ING
LO
G W
ITH
GR
AP
H
Boeing AuburnRemedial InvestigationAuburn, Washington

d
i4
d
d
i4
d
d
i4
d
d
d
ACSM
PT
SM
SP-SM
SP
GP
2-inches asphalt concrete pavement
Grayish-brown, silty, fine to medium SAND(medium dense, moist)
Brown, fibrous PEAT (medium dense, moist)
Gray, silty, fine SAND (medium dense,moist)
Gray, fine to medium SAND with silt andwood (medium dense, moist)
Gray, gravelly, fine to coarse SAND (dense,wet)
- grades fine to medium sand and withoutgravel
- grades gravelly
- grades dark gray and gravelly
Gray, fine to coarse GRAVEL with sand(dense, wet)
S-1
Run 1
S-2
S-3
Run 2
S-4
S-5
Run 3
S-6
S-7
S-8
SPT N-Value
10 20 30 40
Moisture Content (%)
5 10 15 20
Fines Content (%)
5 10 15 20
(DO
E#:
BB
P24
2)W
EL
L D
ET
AIL
0
5
10
15
20
25
30
35
Ele
vatio
n (f
t)
75
70
65
60
55
50
45
Notes:
Sam
pler
Typ
e
Blo
ws/
Foo
t
Tes
t D
ata
LiquidLimit
Sam
ple
Num
ber
& I
nter
val
Non-Standard N-Value
Gra
phic
Sym
bol
Dep
th (
ft)
US
CS
Sym
bol
Drilled By:
SOIL PROFILE
Ground Elevation (ft):
Drilling Method:
Boart Longyear
SAMPLE DATA
Rotosonic
PlasticLimit
1. Stratigraphic contacts are based on field interpretations and are approximate.2. Reference to the text of this report is necessary for a proper understanding of subsurface conditions.3. Refer to "Soil Classification System and Key" figure for explanation of graphics and symbols.4. DOE Unique Well Number: BBP242
0251
64.
11/1
2/1
0 Y
:\025
\164
\T\A
UB
UR
N B
OR
ING
S A
ND
WE
LLS
\BO
RIN
G A
ND
WE
LL L
OG
S\0
2516
4 -
MA
ST
ER
FIL
E.G
PJ
SO
IL B
OR
ING
LO
G W
ITH
GR
AP
H
AGW180
79.00
Log of Boring AGW180 A-19(1 of 3)
Figure
0251
64.
11/1
2/1
0 Y
:\025
\164
\T\A
UB
UR
N B
OR
ING
S A
ND
WE
LLS
\BO
RIN
G A
ND
WE
LL L
OG
S\0
2516
4 -
MA
ST
ER
FIL
E.G
PJ
SO
IL B
OR
ING
LO
G W
ITH
GR
AP
H
Boeing AuburnRemedial InvestigationAuburn, Washington
9/24
/10

i4
d
d
d
i4
d
d
d
d
i4
SP
GP
SM
SP
ML
SM
GP
Dark gray, fine to coarse SAND (dense, wet)
Dark gray, sandy, fine to coarse GRAVEL(dense, wet)
- grades gray
Brownish-gray, silty, fine to medium SAND(dense, wet)
Dark gray, fine to medium SAND (mediumdense, wet)
Brownish-gray, very sandy SILT withorganics (medium stiff, wet)
Gray, silty, fine SAND (medium dense, wet)
Gray, sandy, fine to coarse GRAVEL(medium dense, wet)
Run 4
S-9
S-10
S-11
Run 5
S-12
S-13
S-14
S-15
Run 6
SPT N-Value
10 20 30 40
Moisture Content (%)
5 10 15 20
Fines Content (%)
5 10 15 20
(DO
E#:
BB
P24
2)W
EL
L D
ET
AIL
35
40
45
50
55
60
65
70
Ele
vatio
n (f
t)
40
35
30
25
20
15
10
Notes:
Sam
pler
Typ
e
Blo
ws/
Foo
t
Tes
t D
ata
LiquidLimit
Sam
ple
Num
ber
& I
nter
val
Non-Standard N-Value
Gra
phic
Sym
bol
Dep
th (
ft)
US
CS
Sym
bol
Drilled By:
SOIL PROFILE
Ground Elevation (ft):
Drilling Method:
Boart Longyear
SAMPLE DATA
Rotosonic
PlasticLimit
1. Stratigraphic contacts are based on field interpretations and are approximate.2. Reference to the text of this report is necessary for a proper understanding of subsurface conditions.3. Refer to "Soil Classification System and Key" figure for explanation of graphics and symbols.4. DOE Unique Well Number: BBP242
0251
64.
11/1
2/1
0 Y
:\025
\164
\T\A
UB
UR
N B
OR
ING
S A
ND
WE
LLS
\BO
RIN
G A
ND
WE
LL L
OG
S\0
2516
4 -
MA
ST
ER
FIL
E.G
PJ
SO
IL B
OR
ING
LO
G W
ITH
GR
AP
H
AGW180
79.00
Log of Boring AGW180 A-19(2 of 3)
Figure
0251
64.
11/1
2/1
0 Y
:\025
\164
\T\A
UB
UR
N B
OR
ING
S A
ND
WE
LLS
\BO
RIN
G A
ND
WE
LL L
OG
S\0
2516
4 -
MA
ST
ER
FIL
E.G
PJ
SO
IL B
OR
ING
LO
G W
ITH
GR
AP
H
Boeing AuburnRemedial InvestigationAuburn, Washington

d
d
i4d
d
i4
GP
SP
GP-GM
ML
Gray, sandy, fine to coarse GRAVEL(medium dense, wet)
Brown, fine to coarse SAND (dense, wet)
Brown, fine to coarse GRAVEl with sand andsilt (dense, wet)
Gray, very sandy SILT (medium stiff, wet)
S-16
S-17
Run 7S-18
S-19
Run 8
Boring Completed 09/23/10. Total Depth of Boring = 90.0 ft.Monitoring Well Completed 09/23/10Total Depth of Monitoring Well = 80.8 ft.
SPT N-Value
10 20 30 40
Moisture Content (%)
5 10 15 20
Fines Content (%)
5 10 15 20
(DO
E#:
BB
P24
2)W
EL
L D
ET
AIL
70
75
80
85
90
95
100
105
Ele
vatio
n (f
t)
5
0
-5
-10
Notes:
Sam
pler
Typ
e
Blo
ws/
Foo
t
Tes
t D
ata
LiquidLimit
Sam
ple
Num
ber
& I
nter
val
Non-Standard N-Value
Gra
phic
Sym
bol
Dep
th (
ft)
US
CS
Sym
bol
Drilled By:
SOIL PROFILE
Ground Elevation (ft):
Drilling Method:
Boart Longyear
SAMPLE DATA
Rotosonic
PlasticLimit
1. Stratigraphic contacts are based on field interpretations and are approximate.2. Reference to the text of this report is necessary for a proper understanding of subsurface conditions.3. Refer to "Soil Classification System and Key" figure for explanation of graphics and symbols.4. DOE Unique Well Number: BBP242
0251
64.
11/1
2/1
0 Y
:\025
\164
\T\A
UB
UR
N B
OR
ING
S A
ND
WE
LLS
\BO
RIN
G A
ND
WE
LL L
OG
S\0
2516
4 -
MA
ST
ER
FIL
E.G
PJ
SO
IL B
OR
ING
LO
G W
ITH
GR
AP
H
AGW180
79.00
Log of Boring AGW180 A-19(3 of 3)
Figure
0251
64.
11/1
2/1
0 Y
:\025
\164
\T\A
UB
UR
N B
OR
ING
S A
ND
WE
LLS
\BO
RIN
G A
ND
WE
LL L
OG
S\0
2516
4 -
MA
ST
ER
FIL
E.G
PJ
SO
IL B
OR
ING
LO
G W
ITH
GR
AP
H
Boeing AuburnRemedial InvestigationAuburn, Washington

APPENDIX B
Laboratory Analytical Results(On CD)