summative evaluation july 25, 2011 executive … · e tvskveq summative evaluation july 25, 2011 by...
TRANSCRIPT

SUMMATIVE EVALUATIONJULY 25, 2011
ByKje l l Enge , PhD
Dick inson Col lege
Edi ted by Patr ic ia Sche id & Cafer OrmanInternat iona l Youth Foundat ion
!"#$%&'()&*%+,$%-,.'%()$$#/0'%#1%(,&*%/2%*"'%3'1'&)4$%$4(()&*%)5%*"'%%6-',1%8')(0'%*"&)43"%*"'%91#*'.%:*,*'$%63'172%5)&%;1*'&1,*#)1,0%<'='0)(-'1*%>9:6;<?%%
41.'&%@))('&,*#='%63&''-'1*%A)B%CDEF6FGGFGHFGGGEIFGGB
Executive Summary

Executive Summary
The International Youth Foundation (IYF) is implementing Bridgeit in 17 districts in Tanzania in partnership with the Ministry of Education and Vocational Training (MoEVT), the U.S. Agency for International Development (USAID) Mission in Tanzania, the Nokia Corporation, Nokia Institute for Technology (INdT), Pearson Foundation and Vodacom Foundation. The goal of the Bridgeit program is to significantly increase the educational quality and achievement among students at primary school level in mathematics, science and life skills through the innovative use of cell phones and digital technology. In addition, IYF had the following objectives:
1) To deepen collaboration and build capacity within the MoEVT and local communities to enrich Bridgeit in Tanzania and lay the foundation for long-‐term sustainability of the approach;
2) To create a system for integrating Bridgeit into Tanzanian primary school classrooms to improve the quality of interaction and teaching and learning in the classroom;
3) To demonstrate learning gains between Standard V and VI students in Mathematics, Science, and Life Skills in Bridgeit classrooms in comparison to schools without the technology, especially for girls.
This evaluation used math and science tests in conjunction with attitude questionnaires and classroom observation to measure the learning gains, teacher classroom performance and attitude changes for both teachers and students. Data were collected from a total of 18 BridgeIT schools and 18 control schools. The sample size (# of students) was sufficient for the evaluator to make valid statistical comparisons between students’ performance in math and science in BridgeIT classrooms with those who were not exposed to the approach;1 however, the sample size was not large enough to make comparisons in overall school performance. The initial data were collected at the beginning of the 2010 academic year in Tanzania (January/February), and a second round of data was collected at the end of the academic year (November/December).
Context – Quality of Education in Tanzania
In Tanzania, enormous strides have been undertaken to meet the Millennium Development Goals, especially in education. The budgets for schooling have been tripled over the last ten years.2 Despite such venerable efforts, there are still challenges that have to be overcome.
While access to a basic education has improved significantly in many countries in East Africa as a result of the 1990 Education for All (EFA) bill guaranteeing universal primary schooling, other challenges still linger. According to a research paper published by Southern and Eastern Africa Consortium for Monitoring Educational Quality (SACMEQ), one of the primary challenges faced by primary school
1 The number of students tested in each school was large enough to provide 95% confidence levels and 5% margin of error.
2 Uwezo Main Report-‐ Tanzania http://www.uwezo.net/uploads/files/Uwezo%20Main%20Report.pdf

students, standards 1-‐7 is the lack of learning for students enrolled in classes.3 In addition, repetition of grades was not that uncommon, with the national average for repetition standing at 23.3%.4 Student absenteeism was about 2.1 days per month, or about 19 days in the school year. Textbook ownership is very low, with the proportions standing at about 6% and 7% for Reading and Mathematics texts, respectively.5
A recent survey on the quality of education was conducted by Uwezo in May 2010 by visiting over 20,000 households throughout the country, which includes 38 districts, and is one of the largest educational surveys undertaken in Tanzania. The assessment reports that less than half (42%) of primary school students surveyed were able to read in the national language of Swahili fluently.6 Also, almost half of the students (49.1%) could not read a story in the English language. More than 30% of students finishing primary school could not do basic mathematics (including multiplication). The report comes to the conclusion that despite huge investments in basic education made by the Tanzanian government, children are still not learning. While children should have basic skills in reading and mathematics by grade 3 (Standard 3), only 30% can read in basic Swahili, 10% can read English, and 20% can do basic mathematics.7 In a comparable study, only 21.4% of Tanzanian Standard 6 students reached a Level 5 for Interpretive Reading (from a scale of 1 of Pre-‐Reading to 8 Insightful Reading) competency.8 The level of competency in mathematics paints a starker picture. The largest chunk of Standard 6 students, 35%, was in Level 3 Basic Numeracy (from a scale of 1 of Pre-‐Numeracy to 8 Abstract Problem Solving) and around 25% of Standard 6 students reached the 1st and 2nd levels.9 Overall, Uwezo found that Tanzanian students still face an uphill battle: “Standard (grade) 6 pupils were under achieving, grappling with less complex levels that required recall and comprehension.”10
Principal Findings of this Evaluation
Test scores of students in BridgeIT and BridgeIT + Life Skills in both math and science showed significant gains during the 2010 academic year in comparison to test scores of students in the control schools who did not benefit from BridgeIT. On average, test scores for students in BridgeIT schools was in the range of 10-‐20 percentage points higher, representing very positive results. Annex 1 provides the mean test results by grade and subject area.
However, the distributions of the mean scores show that many students were left behind and the increases in the means were due to groups of students who excelled while others showed more modest gains or no gains at all. This has especially been the case for students in the BridgeIT schools with the added Life Skills curriculum, who performed the best academically. However, this indicates that one group of students have advanced considerably while others have not.
3 Mrutu, A., Ponera, G., & Nkumbi, E., “Equity The SACMEQ II Project in Tanzania: A Study of the Conditions of Schooling and the Quality of Education.,” SACMEQ Educational Policy Research Series, 2005 http://www.sacmeq.org/downloads/sacmeqII/Tanzania.zip 4 Mrutu, A., Ponera, G., & Nkumbi, E., Page 62 5 Mrutu, A., Ponera, G., & Nkumbi, E., Page 89 6 Uwezo Main Report-‐ Tanzania page 8 http://www.uwezo.net/uploads/files/Uwezo%20Main%20Report.pdf 7 Uwezo Main Report-‐ Tanzania page 22 http://www.uwezo.net/uploads/files/Uwezo%20Main%20Report.pdf 8 Mrutu, A., Ponera, G., & Nkumbi, E., Page 198 9 Mrutu, A., Ponera, G., & Nkumbi, E., Page 201 10 Mrutu, A., Ponera, G., & Nkumbi, E., Page 225

No significant gender differences were found in the test scores. Overall, girls’ scores were somewhat lower but these were not statistically significant differences. There is vast experience from programs in other countries of strategies to improve girls’ learning skills in relation to boys. These include the formation of girls’ learning groups that meet after school, peer tutoring by girls who are doing well, special training for teachers to work more with girls and to encourage their participation in cooperative learning groups, adaptation of math and science texts and assignments to be more relevant to girls, just to mention a few. While not of grave concern given the results of this evaluation, BridgeIT may wish to experiment with some of these approaches in the future to ensure girls benefit equally.
Initially, teachers were skeptical about whether or not the videos would help students learn math and science, but this skepticism was drastically diminished by the end of the year. In addition, post-‐test results show that nearly all the teachers felt the videos integrated quite well with their lessons. Teachers sometimes are reluctant to try something new, especially if it may require extra preparation or activities, but if teachers are shown during their initial training sessions that the Bridgeit equipment and activities are actually a tool to improve the effectiveness of their teacher, any initial reluctance can be greatly reduced. In addition, if guides could be designed and produced to show how the video lessons are relevant, how they specifically integrate with the teachers’ lesson plans, and how the videos can help improve these lessons plan this initial resistance could be reduced.
The teacher interviews found that teachers’ satisfaction with their job and school facilities has decreased. Their satisfaction with the BridgeIT phone and video equipment has gone down slightly, while satisfaction with the BridgeIT education model has increased.
More than 90% of the teachers said that they received appropriate support from head teachers and colleagues in their schools; a large majority said they received adequate support from the school inspectors in their districts, and that they received visits from the school inspectors. Nearly all of the teachers said they got adequate support from the BridgeIT help desk.
As far as students’ opinions of the BridgeIT lessons, most of the 5th and 6th graders felt that the video lessons were boring when asked at the beginning of the year; both groups of students drastically changed their attitudes after nearly a year of using the lessons. Overall, the percentage of students who felt that the videos made math and science easier to understand increased by about 10-‐20% over the one year period.
When the students considered the statement that going to work after completing primary school was a good idea, about one-‐third of the BridgeIT and control school students thought this was a good idea; less than 19% the BridgeIT schools where Life Skills was taught felt this way in the pre-‐test. In the post-‐test, this dropped to 11% for the BridgeIT students and 14% for the control schools; students in the BridgeIT schools where Life Skills was offered were the lowest with this opinion at less than 10%. Thus, it appears that the Life Skills program is having an effect on attitudes towards entering the workforce post-‐primary (when students should be encouraged to continue their education in secondary).
The observations of the school facilities and educational materials availability found that adequate storage space has increased, space for children to work has also gone up, and more importantly having a functional Nokia cell phone and TV has also increased. Materials for enrichment and extra help

continue to be in short supply as do both workbooks and text books; only in about one-‐third of the visited classrooms were there enough textbooks available.
The classroom visits also observed improvements in student-‐teacher behavior and interaction, most notably, children (both boys and girls) were asking more questions, and there has been an increase in children who need help getting that help from both teachers and their peers. An important finding is that very few teachers were observed to communicate in a local language other than Swahili and that there has been a large increase in teachers encouraging silent students to participate in the class by calling on them more often. Also, there has been an increase in the number of teachers who know their students by name (often a challenge in Tanzanian schools where class sizes often range from 60-‐100 students).
An important finding was that at the beginning of the school year, a little more than half the teachers used the video lessons during the observation visit; this increased to almost three-‐quarters by the end the school year in the BridgeIT and to four-‐fifths in the BridgeIT + Life Skills classrooms. In the classrooms where the videos were shown, a little more than half of the teachers prepared the students for the lesson at the beginning of the year; this increased to two-‐thirds for the BridgeIT classes and 80% for the BridgeIT + Life Skills classrooms by the end of the year. Additionally, when the video lessons were completed, 60% of the teachers offered activities related to the video lessons to the class at the beginning of the year; this increased to three-‐quarters of the teachers for the BridgeIT classes and 81% for the BridgeIT + Life Skills classes by the end of the year.
The teachers’ movement around the classroom to check students’ work decreased in BridgeIT but increased in the BridgeIT + Life Skills classrooms. The very same pattern was observed on whether or not the teachers check for students’ understanding before assigning practice work, and a similar pattern was observed in whether or not the teacher marks the students’ work and provides other feedback to the students. Also, the preparation of activities based on children’s abilities increased over the year, but the increase was largest in the BIT+ Life Skills classrooms. Cooperative learning in the form of group work with the teacher circulating among the groups and related activities have all increased.
Of all the items on the student attitude test, the single item that significantly affected test scores (based on regression analysis) in a positive manner was the response to whether or not the teacher helped students understand the video lessons. None of the other items accounted for any significant variance in the test scores. These possible relationships should be examined in detail to determine how teacher training activities related to use of the videos in the classroom can be strengthened, as well as if there are any cost-‐effective ways to make the lessons even more understandable for students. At the same time, efforts should be made to make the lessons more entertaining and relevant to students’ daily lives.

Annex 1: Math and Science Test Score Improvements in BridgeIT Schools
The most important indicators are the learning gains in math and science for STD 5 and STD6. The evaluation design calls for statistically significant learning gains among students in BridgeIT schools in comparison to control schools (where BridgeIT was not offered). The four figures and tables below show the pre and post-‐test scores in math and science by grade level11.
As shown below, the STD 5 pre-‐test math scores were not significantly different between the BridgeIT (BIT), BridgeIT + Life Skills (BIT+LS), and the control students; for all practical purposes these score were virtually identical. The second set of bars show the post-‐test scores, and all three groups increased their mean scores and the differences between the pre-‐test and post-‐test scores are shown in the third column. The overall gains in all three groups were statistically significant over the pre-‐tests. However, the BIT students who also were given the Life Skills curriculum achieved the greatest gains. These scores were all significantly different from each other (F=87.52, p=0.000).
Figure 1: Math STD 5
11In order to contextualize the percentage scores presented here, it is important to keep in mind the grading scale used in Tanzanian primary schools:86-‐100% = A, 71-‐85% = B, 55-‐70% = C, 30-‐54% = D, 0-‐29% = E -‐ failing grade.
0
10
20
30
40
50
60
70
Pretest Posttest Difference BridgeIT 36.5 58.7 22.2
BridgeIT+LS 36.1 61.9 25.8
Control 35.4 48.5 13.1
36.5
58.7
22.2
36.1
61.9
25.8
35.4
48.5
13.1
Percent

The STD 5 science tests show a similar overall pattern but with significant differences in the pre-‐test scores as well. Although the scores for the three groups are similar at around 40% correct responses with the BIT+LS scoring the highest, the analysis showed that the BIT+LS were significantly higher than the other two groups (F=4.33, p=0.013). -‐The pre and post-‐test scores for all three groups were significantly different from each other. The post-‐test scores of the BIT and BIT+LS are both significantly higher than the controls, but not significantly different from each other (F=168.6, p=0.000).
Figure 2: Science STD 5
The STD 6 math pre-‐tests scores were in the middle and high 20s with the BIT+LS scoring the lowest (mean=25.9), and this was significantly lower than both BIT and the control students. As the graph and table below shows, all three groups made significant gains over the pre-‐test scores, and BIT+LS went from having the lowest mean score to the highest. Furthermore, all the post-‐test scores are significantly different from each other (F=109.9, p=0.000).
0
10
20
30
40
50
60
70
Pretest Posttest Difference BridgeIT 40.5 65.4 24.9
BridgeIT+LS 42.9 66.8 23.9
Control 39.6 50.3 10.7
40.5
65.4
24.9
42.9
66.8
23.9
39.6
50.3
10.7
Percent
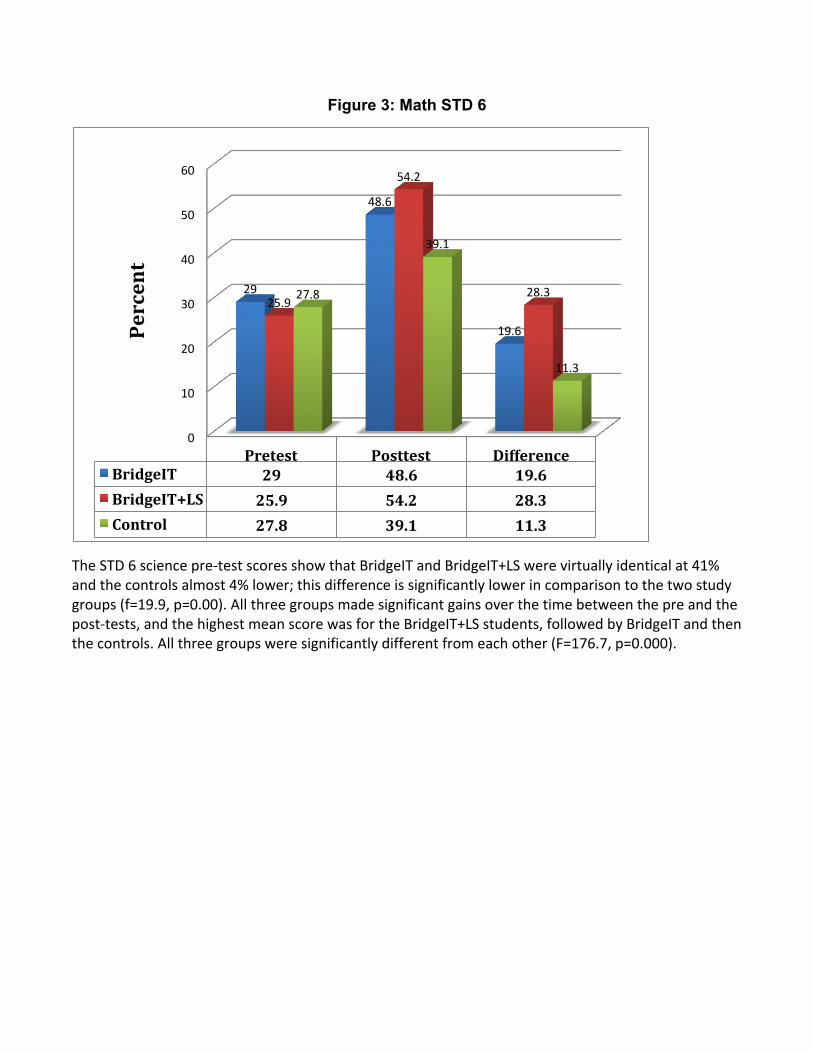
Figure 3: Math STD 6
The STD 6 science pre-‐test scores show that BridgeIT and BridgeIT+LS were virtually identical at 41% and the controls almost 4% lower; this difference is significantly lower in comparison to the two study groups (f=19.9, p=0.00). All three groups made significant gains over the time between the pre and the post-‐tests, and the highest mean score was for the BridgeIT+LS students, followed by BridgeIT and then the controls. All three groups were significantly different from each other (F=176.7, p=0.000).
0
10
20
30
40
50
60
Pretest Posttest Difference BridgeIT 29 48.6 19.6
BridgeIT+LS 25.9 54.2 28.3
Control 27.8 39.1 11.3
29
48.6
19.6
25.9
54.2
28.3 27.8
39.1
11.3
Percent

Figure 4: Science STD 6
0
10
20
30
40
50
60
Pretest Posttest Difference BridgeIT 41.2 53.8 12.6
BridgeIT+LS 41.4 59.1 17.7
Control 37.8 42.9 5.1
41.2
53.8
12.6
41.4
59.1
17.7
37.8
42.9
5.1
Percent

Annex 2: Author’s and Editors’ Bios
Professor Kjell Enge has a Ph.D in Anthropology from Boston University (1982). He has conducted research in many locations, including Bolivia, Costa Rica, El Salvador, Guatemala, Ghana, Guinea, Honduras, India, Jamaica, Malawi, Mali, Mexico, Morocco, Nepal, Nicaragua, Pakistan, Philippines, Spain and Tanzania. He speaks Norwegian, English and Spanish. His specialties are socio-‐economic development, medical anthropology, ecological anthropology, agrarian systems, the anthropology of education, reproductive health, maternal-‐child health care, and monitoring and evaluation of development projects. Prof. Enge has completed a number of evaluations of USAID programs focusing on Girls Education and Quality Education initiatives in Central America, the Caribbean, Africa and Southwest Asia.
Patricia Scheid has an MS in Organizational Development from Johns Hopkins University. She joined International Youth Foundation in 2011 and is presently Program Director, Africa. Previously, Ms. Scheid served as Director of Programs & Partnerships, and then Director of Strategic Partnerships for Aga Khan Foundation USA where she was responsible for grants management, donor relations and capacity building of the foundation’s local implementing partners. She has extensive experience in providing management support for international education programs focusing on improving access and quality, especially for girls and other marginalized groups, as well as teacher development programs. Ms. Scheid also has extensive experience in planning and managing both qualitative and quantitative evaluations of international development programs.
Cafer Orman graduated Summa Cum Laude in Economics from Stockton College and finished his Master in Public Policy at Georgetown University in May 2011. Prior to working at International Youth Foundation, he was placed at the United Nations Office of the Recovery Coordinator in Banda Aceh, Indonesia drafting policy recommendations for the local government of Aceh.