summary results of child labour survey in pakistan (1996) · summary results of child labour survey...
TRANSCRIPT

Summary results of Child Labour Survey in Pakistan (1996)
Federal Bureau of Statistics (FBS), Statistics Division Ministry of Labour, Manpower and Overseas Pakistanis
International Labour Organization (ILO) and
International Programme on the Elimination of Child Labour (IPEC)
9 October 1996 Islamabad, Pakistan

Pakistan 1
Survey on child labour 5-14 years old
Background
Information on child labour in Pakistan is sketchy. For the last few years some case studies on child labour focusing on certain geographic areas and industrial sectors have been conducted. However, no comprehensive national picture of child labour in the country exists. Without the availability of statistical data on the volume and nature of child labour, it is extremely difficult to convince the public of the urgency of child labour as a public issue and for the Government to formulate appropriate action programmes and allocate the necessary resources for improving the situation and eventually solving the various problems relating to working children. The lack of data on working children 5-14 years old even diverts attention from those categories of children who critically require attention and assistance.
In Pakistan, the main source of statistical data on the labour force is the annual Labour Force Survey conducted by the Federal Bureau of Statistics (FBS). Currently, the Labour Force Survey (LFS) collects information on persons above the age of ten years. In reality, there is a wide range of economic activities performed by many children below the age of ten. For this reason, the Government of Pakistan decided to carry out a sample survey of households to provide baseline information on the extent and socio-economic characteristics of child labour throughout the country. This nationwide survey was undertaken by the FBS, in close collaboration with the Ministry of Labour, Manpower and Overseas Pakistanis (Labour Wing) and the International Labour Organization, as a component of the ILO’s International Programme on the Elimination of Child Labour (IPEC). This survey is the first of its kind in Pakistan.
Objectives
The Child Labour Survey (CLS) has the following main objectives:
(1) to collect information on the dimensions of working children by age, sex, location, occupation and industry;
(2) to collect information on the working conditions of the children, i.e. hours worked, wages received and terms of employment as well as on the safety and health aspects of their workplace; and
(3) to collect data on the socio-economic characteristics of the children and their families.
Specifically, the complete data sets that have been generated from this survey may be utilized in:
(1) establishing targets and formulating and implementing intervention programmes;
(2) monitoring the effectiveness of policies, regulations and programmes aimed at the eventual elimination of child labour;
(3) mobilizing support to generate public concern and interest on the issue of child labour;
(4) formulation and/or amending legislations to protect the health and well-being of children; and

2 Pakistan
(5) designing information materials directed at parents and children who are not aware of hazardous conditions in their working environment.
Concepts and definitions
Household: A household is a single person living alone or a group of persons who normally live and eat together under common cooking arrangements and have no other usual place of residence elsewhere.
Household members: These include all such persons present or temporarily absent whose usual place of residence falls in the selected household at the time of enumeration.
Reference population: In this survey, “child” refers to persons 5-14 years old.
Reference period: Two reference periods were used – the last 12 months (for measuring the usually active population) and the week preceding the interview (for measuring the currently active population).
The usually active population: The usually active population comprises all persons 5 years old and above who fulfil the requirements for inclusion among the employed or unemployed during the reference period, i.e. one year preceding the date of the interview. The definitions of “employed” and “unemployed” covered under the usual active population approach are: the usually “employed” comprises all persons 5 years old and above who worked during most of the weeks (or most of the days) of the year. The usually “unemployed” comprises all persons 5 years old and above who were without work and available for/seeking work during most of the weeks (or most of the days) of the year.
The currently active population: The currently active population comprises all persons 5 years old and above who fulfil the requirements for inclusion among “employed” and “unemployed” during the short reference period, i.e. one week preceding the date of the interview. Definitions of “employed” and “unemployed” covered under the currently active population are: the “employed” comprises all persons 5 years old and above who worked in economic activity for at least one hour during the reference period and were either “paid employed” or “self employed”. The “unemployed” comprises all persons 5 years old and above who were without work during the reference period and who are currently available for/seeking work.
Sampling methodology
The sampling methodology of CLS has been evolved with the basic objective to estimate the prevalence of child labour incidence in a precise way. For this, a cluster approach has been adopted.
Universe
The “universe” consisted of all urban and rural areas of the four provinces of Pakistan as defined in the 1981 population census and changes made therein after by provincial governments. Military-restricted areas and federally administered tribal areas (FATA) have been excluded from coverage. The population of excluded areas constitutes about 3 per cent of the total population.

Pakistan 3
Sampling frame
Urban areas
The FBS has developed its own urban area frame through the quick count record survey scheme. According to this scheme, each city/town of urban domain has been divided into small areas called “enumeration blocks”. Each enumeration block comprises about 200-250 households. This frame was updated during 1994-95. It has been used for drawing samples from urban areas. Within each ultimate stratum formed for CLS, all enumeration blocks falling therein have been treated as primary sampling units (PSUs).
Rural areas
The list of villages/mouzas/dehs published by the Population Census Organization as a result of the 1981 population census has been taken as a sampling frame for drawing samples from rural areas. Villages in each ultimate stratum have been treated as primary sampling units (PSUs).
Stratification plan
Keeping in view the geographical level of the estimates at national/provincial levels and to control heterogeneity among different population groups for catching child labour, a stratification plan has been formulated as under:
Urban area
Karachi, Lahore, Faisalabad, Rawalpindi, Hyderabad, Multan, Peshawar, Quetta, Islamabad, Sargodha and Sialkot, being larger sized cities, have been treated as independent strata. Each of these cities has been further sub-stratified into low, middle and high-income groups.
After excluding the population of big cities from the population of respective administrative division, all cities and towns have been grouped to form a stratum. Each stratum of remaining urban areas, i.e. the administrative division, has been further sub-stratified into low, middle and high-income groups. The objective of classifying the urban population into low, middle and high-income groups was to distribute samples to low and middle-income groups in a higher proportion, as child labour activities are expected to be prevalent in these groups.
Rural areas
In the rural areas of Punjab, Sindh and NWFP each administrative district has been treated as an independent stratum. In Balochistan province the administrative division has been considered as a stratum.
Sample coverage
Enumeration blocks (EBs) in urban areas and villages in rural areas were treated as primary sampling units (PSUs). In all, 1,865 sample PSUs covered in the survey were selected from each ultimate stratum by the probability proportionate to size (PPS) method of selection. Within each sample PSU, clusters of approximately 75 households were formed. These clusters were treated as secondary sampling units (SSUs). One cluster from each sample PSU was selected randomly and listed all households within a cluster on a special listing form developed for the CLS. The number of households listed in this manner totalled 140,298. Then, all households within a cluster having at least one

4 Pakistan
economically active child within the ages 5-14 years were enumerated. The detail of sample PSUs covered in the survey is given in the following table.
Sample coverage: PSUs
Urban Rural Total
Low Middle High Total
Punjab 166 282 52 500 342 842
Sindh 149 233 28 410 116 526
NWFP 56 100 16 172 124 296
Balochistan 58 83 2 143 58 201
Pakistan 429 698 98 1 225 640 1 865
From the covered sample clusters, 13,962 economically active children within the age group 5-14 years were enumerated by following the current status approach (last week reference period) and usual status approach (last 12 months reference period). These children were members of 10,438 households out of 140,298 households listed, representing about 7.4 per cent.
It was found that out of 1,865 sample clusters (or 140,298 households) covered, no economically active child was found in 461 sample clusters, i.e. 24.7 per cent of the clusters covered. The highest proportion of 58 per cent was observed in Balochistan, followed by 31 per cent in Sindh, 18 per cent in Punjab and 10 per cent in NWFP.
The large sample size of PSUs was fixed keeping in mind the relatively low prevalence rate of economically active children in the entire population. The analysis indicates that coverage in the rural domains of Balochistan and Sindh are probably on the lower side. The impact of this under-coverage on estimates is discussed under the next heading. The details of procedures used for the sample selection and for deriving the estimates and their variances are given in Appendix 1.
Precision of estimates
Based on the sample design adopted for the CLS, the sampling errors have been worked out for national and provincial estimates of the number of children by age group. For the purpose of this presentation, the results of sampling errors at the national and provincial levels will be presented for children between 5 and 14 years old.
At the national level, the number of economically active children between 5 and 14 years old, based on survey estimates, is 2,657,539. Its standard error has been estimated as 142,131. The coefficient of variation (CV) is 5.4 per cent. At the 95 per cent level of confidence, the confidence interval of the national estimate would be as follows:
(a) Confidence interval for economically active children between the ages of 5-14 based on survey estimates:
= 2,657,539 + 1.96 (142,131);
= 2,657,539 + 278,577;
= 2,378,962 to 2,936,116.
(b) Confidence interval for economically active children between the ages of 5-14, population as in January 1996:

Pakistan 5
= 2,975,921 to 3,672,884.
The confidence interval describes that we are 95 per cent confident that the true value of the number of economically active children between the ages of 5 and 14 as in January 1996 would be within the interval of 2,975,921 to 3,672,884. Details of standard errors and coefficient of variations at national/provincial levels are given in table 1. From the analysis of the CLS figures it appears that economically active children between the ages of 10 and 14 in Sindh (rural) and in Balochistan (rural) have been reported on the lower side. The comparisons of participation rates for the CLS, 1996, and the Labour Force Survey (LFS), 1993-94, are given below to give the extent of lower coverage.
Province Participation rate (%)
CLS, 1996 LFS, 1993-94
Sindh (rural) 8.08 14.58
Balochistan (rural) 1.26 14.16
It has been worked out that, due to this under-coverage within age group 10-14, approximately 300,000 economically active children have been underestimated. If we add this figure to 3.31 million, then the overall estimate of economically active children between 5 and 14 years old would be 3.61 million, representing an economically active children participation rate of around 9 per cent. The FBS thinks that the under-enumeration will be validated by attaching a module to the ongoing Labour Force Survey.
The questionnaire
A well-structured questionnaire was designed to collect information on households and individuals through face-to-face interview. All households that reported child labour within the age group 5-14 years were interviewed. The questionnaire consists of 11 sections and it was structured as follows:
Section 1: Household identification;
Section 2: Field operation’s particulars;
Section 3: Editing/coding at headquarters particular;
Section 4: Household composition and demographic information;
Section 5: Usual activities of household members 5 years old and above;
Section 6: Current activity of persons 15 years old and above;
Section 7: Current activity of each child aged 5-14 years old;
Section 8: Perception of parents/guardians or other relatives with whom the working child usually resides;
Section 9: Questions addressed to children aged 5-14 years old;
Section 10: Household income and expenditure; and
Section 11: Housing conditions.

6 Pakistan
Pilot test
The pilot test was carried out to test the questionnaire and other instruments like concepts and time required. On the basis of this pilot test, some questions were revised in accordance with the recommendations of the enumerators, such as questions which are difficult to answer or not easily understood, particularly by the child interviewed. In addition, standard output per day per enumerator was established in preparing the plan for field enumeration.
Training and field operation
The training of staff was conducted in two phases. In the first phase the training was imparted to the headquarter staff. The training course consisted of instructions in general interviewing techniques, field procedures, concepts and definitions of the terms used in the questionnaire. The participants of the first phase acted as the master trainers for the second phase where training to the usual field enumerators and supervisors at different stations throughout the country was imparted. For quality control, field supervisors and supervisors from headquarters made frequent visits to the field for spot-checking during the data collection process. Field operation was started in January 1996 and completed by the end of June 1996. In total, 250 enumerators and 50 supervisors were deployed to carry out field activities.
Data processing
Editing/coding of the questionnaire was done by headquarter staff and data processing was carried out by the Data Processing Centre of the FBS.
Response rate
A total of 140,298 households were listed, out of which 10,438 sample households reported to have child labour. All the households reporting child labour were successfully interviewed. As some working children were away from the household at the time of enumeration they could not be contacted for the interview.
Survey results
Child population
As on 1 January 1996, there were 40 million children aged 5-14 years old in Pakistan. They represent close to one-third (30 per cent) of the total population. More than 50 per cent of the children are in the age group 5-9 years. Among children, males outnumbered females with a sex ratio of 106 males per 100 females. In both age groups – 5-9 years and 10-14 years – males outnumbered females with a sex ratio of 107 and 105 respectively. Rural areas have a relatively higher male/female sex ratio than urban areas. The majority of the children, i.e. 28.7 million (72 per cent) are living in rural areas (for details refer to table 2).
Child labour participation
As stated earlier, two reference periods were adopted: (i) the current status approach – the week preceding the interview; and (ii) the usual status approach – the 12 months preceding the interview.

Pakistan 7
Among the 40 million children aged 5-14 years, 3.3 million, i.e. 8.3 per cent, were economically active during the reference week. During the 12-month reference period almost 8.1 per cent of the 40 million children reported that their principal activity was either working or being available for economic activity during most of the past 12 months. The 12-month participation rate is lower than that of the reference week. This is due to a number of reasons. The one-week reference period may have coincided with the peak of agricultural activities, thereby incorporating slightly more youngsters who were working. Secondly, the longer reference period of 12 months may have led to some memory lapses. Thirdly, and most importantly, the definition of “usual activity approach” adopted for the Child Labour Survey was limited only to “principal activity” during the 12-month period. Thus, the children who might have combined an economic activity with their principal non-economic work were not included in the count of economically active children. For example, those attending school or those doing housekeeping work during most of the 12 months might also have been engaged in economic activity occasionally or on a part-time basis during the year and especially during the agricultural seasons. Since all these are not their main or principal activities, these children were excluded from the count of the economically active (refer to table 3).
Volume of child labour
In Pakistan, child labour is about 3.3 million, out of which 2.4 million (73 per cent) are boys and 0.9 million (27 per cent) are girls. The quantum of child labour increases with age, i.e. the older the child, the higher the rate of participation in economic activity. The volume of male child labour is about 2.1 million in age group 10-14 years, which is about seven times greater than the level in age group 5-9 years (i.e. 0.3 million). Similarly, the volume of female child labour in age group 10-14 years is about three times (i.e. 0.6 million) greater than in age group 5-9 years (i.e. 0.2 million) (see table 4 for details).
Male child labour outnumbered female child labour in both rural and urban areas. The contribution of rural areas in child labour is about eight times higher than that of urban areas. This may be due to unpaid farm activities performed by family members in the rural areas.
The provincial distribution indicates that the volume of child labour in the Punjab is about 1.9 million, which is about three-fifths (60 per cent) of total child labour in the country. Next comes NWFP which shows about 1 million child labour. The lowest figure is for Balochistan because of the lesser number of households reporting child labour (for detailed comparisons see table 4).
Occupational structure
About 71 per cent of the 3.3 million employed children who worked during the reference week were engaged in elementary (unskilled) occupations relating to agriculture, sales and services, mining, construction, manufacturing and transport sectors where farm activity dominates. Craft and related trade activities are the next major occupation group which absorbed about 19 per cent of the working children.
Among male employed children elementary (unskilled) occupations are the most prevalent. A great majority (68 per cent) of males worked in farms, sales and services. Craft and related trade activities are ranked second and absorb about 19 per cent of male working children. Similarly, in the case of female child workers, elementary (unskilled) occupations absorb the higher proportion, i.e. 80 per cent, which is larger than the proportion of boy workers in the same occupations. The next important occupational group is craft and related trade workers which absorbs 19 per cent of total female workers (for details refer to table 5).

8 Pakistan
Industrial structure
The industrial distribution of children who worked during the reference week indicates that about 67 per cent of employed children were engaged in the agricultural sector. The manufacturing sector ranked second and employed about 11 per cent of children. The next most important sector was wholesale and retail trade followed by community, social and personal services which absorbed about 9 per cent and 8 per cent respectively.
Among male workers, agriculture is again the most prevalent industry and it absorbed about 63 per cent of male working children. Wholesale and retail trade is the second most important sector absorbing about 12 per cent of employed children, followed by the manufacturing sector (10 per cent), community, social and personal services (7 per cent) and transport storage and communication (5 per cent).
Female workers have an even higher percentage in the agricultural sector (77 per cent) than male workers. Manufacturing is the second most important sector absorbing 12 per cent of female workers followed by community, social and personal services (10 per cent) (see table 6).
Educational level
The data reveal that out of the total 3.3 million employed children, one-third (33.2 per cent) are literate from the formal system of education. Male child labour is more educated than female. About two in every five (40.3 per cent) of the total male child labour is pre-matric while that of female child labour is approximately one in ten only (11.2 per cent). Child labour in urban areas is more educated than in rural areas. In urban areas about 41 per cent of the total is pre-matric and in the rural areas it is only 32 per cent (for details see table 7).
Employment status
Employment status by broad categories indicates that about 70 per cent of working children are working as unpaid family helpers, followed by employees (23 per cent) and self-employed (7 per cent). Male and female unpaid working children account for 67 per cent and 78 per cent respectively. Like the national pattern, the next major group is paid employees, which represents 25 per cent and 17 per cent for male and female respectively. Significant urban-rural differentials are observed in employment status. In rural areas, three-fourths of children are working as unpaid family helpers while in urban centres it is less than one-third. In urban areas, paid employees is the leading employment status and it contributes about three-fifths of the total working children in urban areas. A similar pattern is also observed for male and female working children separately (for details refer to table 8).
Number of hours worked
The distribution of working hours during the reference week indicates that close to one-half (46 per cent) of children are working more than the normal working hours, i.e. 35 hours per week. A good proportion of children worked 56 hours or more at the national level. In urban areas, 25 per cent worked 56 hours or more per week. The percentage of male children working more than the normal working hours is 50 per cent, much higher than that of females with 33 per cent. Similarly, 42 per cent of the total rural working children worked more than the normal working hours and in urban areas it is 73 per cent. The situation in urban centres in general, and for males (76 per cent) in particular, is worse. Table 9 may be referred to for greater detail.

Pakistan 9
Illnesses/injuries
Of the total working children, 7 per cent suffered from illnesses/injuries frequently, 28 per cent occasionally and 33 per cent rarely. Female children were less prone to injuries than male children. The majority of the children in rural areas were more prone to illnesses/injuries and this may be due to the hard labour associated with the agricultural sector in rural areas (for details refer to table 10).
Most of the children (75 per cent) who received injuries were engaged in elementary (unskilled) occupation, followed by craft and related trade works (16 per cent) and service workers (9 per cent) (please refer to table 11). With respect to the industrial structure of illnesses and injuries, the majority of children (71 per cent) fall into agricultural activities, followed by manufacturing (9 per cent) and services (8 per cent) (please refer to table 12).
Reasons for child labour
The most cogent reasons given by the parents/guardians for letting their child work are: to assist in household enterprises (54 per cent), to supplement the household income (27 per cent), and because no one else is available to do household chores (14 per cent) (please refer to table 13).
Working children by household income
The majority of working children (39 per cent) are members of households whose income range is Rs.2,501-Rs.4,000; followed by 31 per cent in the income group Rs.1,501-Rs.2,500; 21 per cent in the income group Rs.4,001 and above; and, the remaining 9 per cent in the income group with less than Rs.1,500 (please refer to table 14).

10 Pakistan
Table 1. Estimates of standard errors and coefficient of variations (CVs) of economically active children between 5 and 14 years old
Area Usual approach Current approach
Standard errors CV (%) Standard errors CV (%)
Pakistan 141 375 5.48 142 131 5.35
Rural 140 745 6.14 141 485 5.99
Urban 13 331 4.64 13 533 4.59
Punjab 63 968 4.29 64 662 4.15
Sindh 21 065 9.06 22 094 9.24
NWFP 124 278 14.70 124 602 14.68
Balochistan 2 485 22.82 2 486 22.61Source: Federal Bureau of Statistics, Child Labour Survey, 1996.

Pakistan 11
Table 2. Total number of children 5-14 years old, by sex, Pakistan and provinces, January 1996
Percentage distribution Age group/ province
Both sexes (00)
Male (00)
Female(00)
Sex ratio(%)
Both sexes Male FemalePakistan 400 437 206 505 193 932 106 100.00 51.57 48.43
5-9 216 044 111 864 104 180 107 100.00 51.78 48.22
10-14 184 393 94 641 89 752 105 100.00 51.33 48.67
Rural areas 287 018 149 031 137 987 108 100.00 51.92 48.08
5-9 158 256 83 204 75 052 111 100.00 52.58 47.42
10-14 128 762 65 827 62 935 105 100.00 51.12 48.88
Urban areas 113 419 57 474 55 945 103 100.00 50.67 49.33
5-9 57 788 28 660 29 128 98 100.00 49.60 50.40
10-14 55 631 28 814 26 817 107 100.00 51.79 48.21
Punjab 226 343 117 525 108 818 108 100.00 51.92 48.08
5-9 122 393 63 973 58 420 110 100.00 52.27 47.73
10-14 103 950 53 552 50 398 106 100.00 51.52 48.48
Rural areas 159 661 83 630 76 031 110 100.00 52.38 47.62
5-9 89 045 47 476 41 569 114 100.00 53.32 46.68
10-14 70 616 36 154 34 462 105 100.00 51.20 48.80
Urban areas 66 682 33 895 32 787 103 100.00 50.83 49.17
5-9 33 348 16 497 16 851 98 100.00 49.47 50.53
10-14 33 334 17 398 15 936 109 100.00 52.19 47.81
Sindh 86 232 44 219 42 013 105 100.00 51.28 48.72
5-9 45 829 23 278 22 551 103 100.00 50.79 49.21
10-14 40 403 20 941 19 462 108 100.00 51.83 48.17
Rural areas 50 223 25 886 24 337 106 100.00 51.54 48.46
5-9 27 122 13 973 13 149 106 100.00 51.52 48.48
10-14 23 101 11 913 11 188 106 100.00 51.57 48.43
Urban areas 36 009 18 333 17 676 104 100.00 50.91 49.09
5-9 18 707 9 305 9 402 99 100.00 49.74 50.26
10-14 17 302 9 028 8 274 109 100.00 52.18 47.82
NWFP 67 142 33 910 33 232 102 100.00 50.50 49.50
5-9 35 878 18 232 17 646 103 100.00 50.82 49.18
10-14 31 264 15 678 15 586 101 100.00 50.15 49.85
Rural areas 59 458 30 227 29 231 103 100.00 50.84 49.16
5-9 31 874 16 293 15 581 105 100.00 51.12 48.88
10-14 27 584 13 934 13 650 102 100.00 50.51 49.49

12 Pakistan
Percentage distribution Age group/ province
Both sexes (00)
Male (00)
Female(00)
Sex ratio(%)
Both sexes Male FemaleUrban areas 7 684 3 683 4 001 92 100.00 47.93 52.07
5-9 4 004 1 939 2 065 94 100.00 48.43 51.57
10-14 3 680 1 744 1 936 90 100.00 47.39 52.61
Balochistan 20 720 10 851 9 869 110 100.00 52.37 47.63
5-9 11 944 6 381 5 563 115 100.00 53.42 46.58
10-14 8 776 4 470 4 306 104 100.00 50.93 49.07
Rural areas 17 676 9 288 8 388 111 100.00 52.55 47.45
5-9 10 215 5 462 4 753 115 100.00 53.47 46.53
10-14 7 461 3 826 3 635 105 100.00 51.28 48.72
Urban areas 3 044 1 563 1 481 106 100.00 51.35 48.65
5-9 1 729 919 810 113 100.00 53.15 46.85
10-14 1 315 644 671 96 100.00 48.97 51.03Source: Federal Bureau of Statistics, Child Labour Survey 1996.

Pakistan 13
Table 3. Labour force participation rates of children 5-14 years old, by sex, Pakistan and provinces, January 1996 (last week)
Age groups/ provinces
Based on estimated population of households having economically active children 5-14 years old
Based on total estimated population
Both sexes Male Female Both sexes Male FemalePakistan 47.47 57.82 31.78 8.30 11.81 4.56
5-9 19.57 20.86 18.02 2.66 2.99 2.31
10-14 67.65 80.51 44.46 14.91 22.53 7.18
Rural areas 48.36 57.77 34.27 10.29 14.19 6.08
5-9 20.73 21.32 20.00 3.40 3.66 3.13
10-14 68.80 80.96 47.41 18.78 27.54 9.60
Urban areas 41.35 58.12 13.70 3.25 5.61 0.82
5-9 10.80 17.21 3.66 0.64 1.08 0.20
10-14 60.36 77.81 22.99 5.97 10.14 1.50
Punjab 46.94 57.27 31.67 8.59 12.04 4.86
5-9 13.30 16.85 9.21 1.78 2.31 1.20
10-14 69.04 79.53 50.60 16.60 23.66 9.10
Rural areas 47.72 57.13 33.96 10.68 14.50 6.49
5-9 13.64 16.80 9.99 2.17 2.69 1.57
10-14 70.16 79.69 53.82 21.41 30.00 12.39
Urban areas 42.04 58.08 16.50 3.58 5.98 1.10
5-9 11.09 17.21 4.37 0.74 1.22 0.28
10-14 62.08 78.64 27.96 6.42 10.48 1.98
Sindh 46.14 63.99 11.41 3.46 6.18 0.59
5-9 13.12 22.10 2.11 0.66 1.20 0.10
10-14 64.36 81.64 19.68 6.64 11.71 1.18
Rural areas 48.85 66.41 12.88 4.16 7.37 0.75
5-9 14.45 24.20 1.99 0.81 1.48 0.10
10-14 67.93 84.31 22.83 8.08 14.28 1.49
Urban areas 40.86 59.03 8.83 2.49 4.50 0.40
5-9 10.49 17.72 2.32 0.43 0.78 0.09
10-14 57.43 76.19 14.32 4.71 8.34 0.74
NWFP 48.87 56.71 37.35 15.76 21.54 9.86
5-9 30.84 26.44 36.52 9.01 8.55 9.48
10-14 65.78 82.29 38.27 23.51 36.65 10.29
Rural areas 49.37 56.75 38.61 17.18 23.04 11.12
5-9 31.65 26.82 37.88 10.02 9.36 10.71
10-14 66.26 82.63 39.41 25.44 39.02 11.58

14 Pakistan
Age groups/ provinces
Based on estimated population of households having economically active children 5-14 years old
Based on total estimated population
Both sexes Male Female Both sexes Male FemaleUrban areas 38.20 56.00 7.52 4.81 9.30 0.67
5-9 9.89 16.25 2.32 0.96 1.76 0.20
10-14 57.05 76.81 12.65 9.00 17.69 1.17
Balochistan 47.49 64.83 4.01 0.66 1.23 0.03
5-9 17.10 32.35 – 0.16 0.31 –
10-14 67.47 78.31 11.66 1.34 2.56 0.08
Rural areas 48.28 65.36 2.16 0.63 1.19 0.02
5-9 19.05 35.88 – 0.18 0.33 –
10-14 68.30 77.73 7.33 1.26 2.41 0.04
Urban areas 44.33 62.46 9.86 0.84 1.51 0.13
5-9 8.23 15.87 – 0.10 0.18 –
10-14 64.41 80.85 19.67 1.82 3.41 0.29
Labour force participation rates of children 5-14 years old, by sex, Pakistan and provinces, January 1996 (last 12 months)
Age groups/ provinces
Based on estimated population of households having economically activechildren 5-14 years old
Based on total estimated population
Both sexes Male Female Both sexes Male FemalePakistan 46.08 56.46 30.34 8.06 11.53 4.36
5-9 18.88 19.98 17.56 2.57 2.86 2.25
10-14 65.76 78.86 42.11 14.50 21.80 6.80
Rural areas 46.93 56.47 32.66 9.99 13.86 5.79
5-9 20.11 20.45 19.48 3.28 3.50 3.04
10-14 66.83 79.37 44.79 18.23 27.00 9.07
Urban areas 40.25 56.46 13.53 3.16 5.45 0.81
5-9 10.31 16.27 3.68 0.61 1.02 0.20
10-14 50.88 75.80 22.63 5.82 9.88 1.48
Punjab 44.89 55.53 29.16 8.21 11.67 4.48
5-9 12.15 15.64 8.13 1.63 2.15 1.06
10-14 66.40 77.51 46.87 15.97 23.06 8.42
Rural areas 45.54 55.40 31.13 10.19 14.06 5.94
5-9 12.40 15.56 8.74 1.98 2.49 1.38
10-14 67.36 77.68 49.67 20.55 29.25 11.44
Urban areas 40.79 56.30 16.11 3.47 5.80 1.07
5-9 10.54 16.16 4.36 0.70 1.14 0.28
10-14 60.38 76.49 27.20 6.24 10.20 1.92

Pakistan 15
Age groups/ provinces
Based on estimated population of households having economically activechildren 5-14 years old
Based on total estimated population
Both sexes Male Female Both sexes Male FemaleSindh 44.85 61.95 11.57 3.36 5.98 0.60
5-9 12.53 20.26 2.61 0.63 1.12 0.12
10-14 62.67 79.37 19.51 6.46 11.38 1.17
Rural areas 47.14 63.87 12.84 5.59 7.08 0.74
5-9 13.74 22.38 2.69 1.12 1.37 0.14
10-14 65.66 81.47 22.11 10.43 13.79 1.44
Urban areas 40.39 58.01 9.32 2.46 4.43 0.41
5-9 10.16 16.95 2.48 0.42 0.75 0.10
10-14 56.89 75.07 15.09 4.66 8.21 0.78
NWFP 48.70 56.30 37.54 15.68 21.39 9.91
5-9 30.84 26.17 36.86 9.01 8.47 9.57
10-14 65.45 81.75 38.29 23.39 36.40 10.30
Rural areas 49.26 56.43 38.82 17.14 22.90 11.18
5-9 31.66 26.56 38.25 10.03 9.27 10.72
10-14 66.04 82.24 39.46 25.36 38.84 11.60
Urban areas 36.61 53.70 7.16 4.61 8.92 0.64
5-9 9.49 15.58 2.23 0.92 1.69 0.19
10-14 54.68 73.65 12.03 8.62 16.96 1.10
Balochistan 47.03 64.12 4.17 0.66 1.22 0.03
5-9 17.00 32.15 – 0.16 0.31 –
10-14 66.77 77.39 12.10 1.33 2.53 0.08
Rural areas 48.28 65.36 2.16 0.63 1.19 0.02
5-9 19.05 35.88 – 0.18 0.33 –
10-14 68.30 77.73 7.33 1.26 2.41 0.04
Urban areas 43.25 71.36 8.74 0.80 1.42 0.14
5-9 7.63 14.70 – 0.09 0.17 –
10-14 61.11 75.87 20.93 1.72 3.19 0.31Source: Federal Bureau of Statistics, Child Labour Survey, 1996.

16 Pakistan
Table 4. Distribution of economically active children 5-14 years old, by sex, Pakistan and provinces, January 1996
Age groups/provinces Last week Last 12 months
Both sexes Male Female Both sexes Male FemalePakistan 3 313 420 2 431 992 881 428 3 215 344 2 374 830 840 514
5-9 573 084 333 656 239 428 551 699 319 415 232 284
10-14 2 740 336 2 098 336 642 000 2 663 645 2 055 415 608 230
Rural areas 2 945 675 2 110 358 835 317 2 857 474 2 062 399 795 075
5-9 536 145 302 694 233 451 516 430 290 196 226 234
10-14 2 409 530 1 807 664 601 866 2 341 044 1 772 203 568 841
Urban areas 367 745 321 634 46 111 357 870 312 431 45 439
5-9 36 939 30 962 5 977 35 269 29 219 6 050
10-14 330 806 290 672 40 134 322 601 283 212 39 389
Punjab 1 943 305 1 414 787 528 518 1 858 912 1 371 987 486 925
5-9 217 817 147 836 69 981 199 105 137 022 62 083
10-14 1 725 488 1 266 951 458 537 1 659 807 1 234 965 424 842
Rural areas 1 704 577 1 212 330 492 247 1 627 330 1 175 720 451 610
5-9 192 973 127 710 65 263 175 580 118 215 57 365
10-14 1 511 604 1 084 620 426 984 1 451 750 1 057 505 394 245
Urban areas 238 728 202 457 36 271 231 582 196 267 35 315
5-9 24 844 20 126 4 718 23 525 18 807 4 718
10-14 213 884 182 331 31 553 208 057 177 460 30 597
Sindh 298 303 273 350 24 953 289 868 264 522 25 346
5-9 30 099 27 938 2 161 28 903 26 122 2 781
10-14 268 204 245 412 22 792 260 965 238 400 22 565
Rural areas 208 783 190 798 17 985 201 375 183 423 17 952
5-9 21 995 20 680 1 315 20 984 19 143 1 841
10-14 186 788 170 118 16 670 180 391 164 280 16 111
Urban areas 89 520 82 552 6 968 88 493 81 099 7 394
5-9 8 104 7 258 846 7 919 6 979 940
10-14 81 416 75 294 6 122 80 574 74 120 6 454
NWFP 1 058 089 730 471 327 618 1 052 978 725 088 327 890
5-9 323 201 155 915 167 286 321 733 154 313 167 420
10-14 734 888 574 556 160 332 731 245 570 775 160 470
Rural areas 1 021 147 696 207 324 940 1 017 601 692 233 325 368
5-9 319 375 152 502 166 873 318 064 151 036 167 028
10-14 701 772 543 705 158 067 699 537 541 197 158 340

Pakistan 17
Age groups/provinces Last week Last 12 months
Both sexes Male Female Both sexes Male FemaleUrban areas 36 942 34 264 2 678 35 377 32 855 2 522
5-9 3 826 3 413 413 3 669 3 277 392
10-14 33 116 30 851 2 265 31 708 29 578 2 130
Balochistan 13 723 13 384 339 13 586 13 233 353
5-9 1 967 1 967 – 1 958 1 958 –
10-14 11 756 11 417 339 11 628 11 275 353
Rural areas 11 168 11 023 145 11 168 11 023 145
5-9 1 802 1 802 – 1 802 1 802 –
10-14 9 366 9 221 145 9 366 9 221 145
Urban areas 2 555 2 361 194 2 418 2 210 208
5-9 165 165 – 156 156 –
10-14 2 390 2 196 194 2 262 2 054 208Source: Federal Bureau of Statistics, Child Labour Survey, 1996.

18 Pakistan
Table 5. Percentage distribution of working children 5-14 years old, by major occupation groups and sex, Pakistan and provinces, January 1996
Major occupation groups Last week Last 12 months
Both sexes Male Female Both sexes Male Female
Punjab 100.00 100.00 100.00 100.00 100.00 100.00
Legislators, senior officials and managers
– – – – – –
Professionals – – – – – –
Technicians and associate professionals
0.14 0.17 0.06 0.14 0.18 0.02
Clerks – – – – – –
Service workers, shop and market sales workers 9.45 12.53 1.16
9.69 12.73 1.13
Skilled agricultural and fishery workers
– – – – – –
Craft and related trade workers 24.85 24.32 26.27 25.21 24.19 28.09
Plant and machine operators and assemblers 0.45 0.60 0.04
0.41 0.53 0.07
Elementary occupations* 65.11 62.38 72.47 64.55 62.37 70.69
Sindh 100.00 100.00 100.00 100.00 100.00 100.00
Legislators, senior officials and managers
– – – – – –
Professionals – – – – – –
Technicians and associate professionals
0.32 0.31 0.34 0.27 0.30 –
Clerks – – – – – –
Service workers, shop and market sales workers 14.88 16.08 1.38
15.17 16.46 1.37
Skilled agricultural and fishery workers
– – – – – –
Craft and related trade workers 29.80 27.15 59.59 30.07 27.62 56.27
Plant and machine operators and assemblers 0.25 0.24 0.37
0.25 0.24 0.36
Elementary occupations* 54.75 56.22 38.32 54.24 55.38 42.00
NWFP 100.00 100.00 100.00 100.00 100.00 100.00
Legislators, senior officials and managers
– – – – – –
Professionals – – – – – –
Technicians and associate professionals
0.13 0.19 – 0.08 0.12 –
Clerks – – – – – –
Service workers, shop and market sales workers 7.21 10.29 0.36
7.39 10.49 0.46
Skilled agricultural and fishery workers
– – – – – –

Pakistan 19
Major occupation groups Last week Last 12 months
Both sexes Male Female Both sexes Male FemaleCraft and related trade workers 5.59 6.37 3.85 5.68 6.47 3.92
Plant and machine operators and assemblers 0.09 0.09 0.07
0.07 0.07 0.07
Elementary occupations* 86.98 83.06 95.72 86.78 82.85 95.55
Balochistan 100.00 100.00 100.00 100.00 100.00 100.00
Legislators, senior officials and managers
– – – – – –
Professionals – – – – – –
Technicians and associate professionals
0.15 0.16 – 0.16 0.16 –
Clerks – – – – – –
Service workers, shop and market sales workers
14.32 14.67 – 14.44 14.82 –
Skilled agricultural and fishery workers
– – – – – –
Craft and related trade workers 17.94 16.28 85.28 17.18 15.40 85.82
Plant and machine operators and assemblers
0.13 0.13 – 0.22 0.23 –
Elementary occupations* 67.46 68.76 14.72 68.00 69.39 14.18
* Elementary (unskilled) occupations include: sales and services elementary occupations; agricultural, fishery and related labourers; labourers in mining, construction, manufacturing and transport. Source: Federal Bureau of Statistics, Child Labour Survey, 1996.

20 Pakistan
Table 6. Percentage distribution of working children 5-14 years old, by major industry division and sex, Pakistan and provinces, January 1996
Last week Last 12 months Major industry division
Both sexes Male Female Both sexes Male Female
Pakistan 100.00 100.00 100.00 100.00 100.00 100.00
Agriculture, forestry, hunting and fishing 66.97 63.26 77.23 66.41 62.99 76.12
Mining and quarrying – – – – – –
Manufacturing 10.75 10.37 11.80 10.97 10.45 12.44
Electricity, gas and water 0.01 0.01 – 0.01 0.01 –
Construction 1.84 2.40 0.31 1.87 2.41 0.34
Wholesale and retail trade and restaurants and hotels
8.72 11.59 0.78 8.94 11.79 0.82
Transport storage and communication 3.65 4.94 0.08 3.83 5.11 0.19
Financing, insurance, real estate and business services
0.02 0.03 – 0.02 0.03 0.02
Community, social and personal services 8.04 7.40 9.80 7.95 7.21 10.07
Rural 100.00 100.00 100.00 100.00 100.00 100.00
Agriculture, forestry, hunting and fishing 74.05 71.43 80.69 73.50 71.12 79.71
Mining and quarrying – – – – – –
Manufacturing 8.20 7.53 9.91 8.46 7.67 10.51
Electricity, gas and water 0.01 0.02 – 0.01 0.02 –
Construction 1.66 2.20 0.29 1.67 2.19 0.32
Wholesale and retail trade and restaurants and hotels
6.89 9.37 0.59 7.13 9.61 0.64
Transport storage and communication 2.53 3.50 0.06 2.72 3.70 0.16
Financing, insurance, real estate and business services
0.01 0.01 – 0.01 0.01 –
Community, social and personal services 6.65 5.94 8.46 6.50 5.68 8.66
Urban 100.00 100.00 100.00 100.00 99.99 100.01
Agriculture, forestry, hunting and fishing 10.07 9.49 14.12 9.85 9.30 13.65
Mining and quarrying – – – – – –
Manufacturing 31.20 29.07 46.20 30.99 28.81 45.99
Electricity, gas and water – – – – – –
Construction 3.31 3.68 0.71 3.46 3.86 0.72
Wholesale and retail trade and restaurants and hotels
23.48 26.21 4.31 23.38 26.19 3.96
Transport storage and communication 12.64 14.37 0.50 12.70 14.41 0.85
Financing, insurance, real estate and business services
0.13 0.14 – 0.13 0.11 0.28
Community, social and personal services 19.15 17.02 34.16 19.49 17.31 34.56
Activities not adequately defined 0.02 0.02 – – – –

Pakistan 21
Last week Last 12 months Major industry division
Both sexes Male Female Both sexes Male FemalePunjab 100.00 100.00 100.00 100.00 100.00 100.00
Agriculture, forestry, hunting and fishing 60.59 57.31 69.42 59.82 57.19 67.25
Mining and quarrying – – – – – –
Manufacturing 14.37 13.15 17.67 14.75 13.24 18.99
Electricity, gas and water 0.02 0.02 – 0.02 0.02 –
Construction 2.19 2.88 0.36 2.27 2.94 0.39
Wholesale and retail trade and restaurants and hotels
8.59 11.41 0.98 8.78 11.54 0.99
Transport storage and communication 4.18 5.71 0.07 4.43 5.92 0.23
Financing, insurance, real estate and business services
0.02 0.03 – 0.02 0.02 0.03
Community, social and personal services 10.03 9.48 11.50 9.91 9.13 12.12
Activities not adequately defined 0.01 0.01 – – – –
Sindh 100.00 100.00 100.00 100.00 100.00 100.00
Agriculture, forestry, hunting and fishing 47.10 48.42 32.28 46.01 46.97 35.79
Mining and quarrying – – – – – –
Manufacturing 17.71 16.68 29.28 18.20 17.16 29.38
Electricity, gas and water – – – – – –
Construction 2.05 2.24 – 2.07 2.26 –
Wholesale and retail trade and restaurants and hotels
15.04 16.18 2.16 15.51 16.76 2.13
Transport storage and communication 8.04 8.65 1.25 8.20 8.78 1.94
Financing, insurance, real estate and business services
– – – – – –
Community, social and personal services 10.06 7.83 35.03 10.01 8.07 30.76
NWFP 100.00 100.00 100.00 100.00 100.00 100.00
Agriculture, forestry, hunting and fishing 84.37 80.41 93.16 84.16 80.25 92.92
Mining and quarrying – – – – – –
Manufacturing 2.19 2.70 1.06 2.16 2.64 1.09
Electricity, gas and water – – – – – –
Construction 1.15 1.55 0.27 1.10 1.47 0.28
Wholesale and retail trade and restaurants and hotels
7.06 10.08 0.35 7.25 10.30 0.44
Transport storage and communication 1.37 1.98 0.01 1.46 2.11 –
Financing, insurance, real estate and business services
0.03 0.04 – 0.03 0.04 –
Community, social and personal services 3.83 3.24 5.15 3.84 3.19 5.27
Balochistan 100.00 100.00 100.00 100.00 100.00 100.00
Agriculture, forestry, hunting and fishing 57.40 58.71 4.53 58.14 59.54 4.36
Mining and quarrying 0.07 0.07 – 0.07 0.08 –
Manufacturing 7.05 6.41 32.83 6.63 5.98 31.64

22 Pakistan
Last week Last 12 months Major industry division
Both sexes Male Female Both sexes Male FemaleElectricity, gas and water – – – – – –
Construction 1.42 1.46 – 1.44 1.47 –
Wholesale and retail trade and restaurants and hotels
18.52 18.86 4.53 18.47 18.84 4.36
Transport storage and communication 8.58 8.79 – 8.68 8.90 –
Financing, insurance, real estate and business services
– – – – – –
Community, social and personal services 6.96 5.70 58.11 6.57 5.19 59.64
Source: Federal Bureau of Statistics, Child Labour Survey, 1996.

Pakistan 23
Table 7. Percentage distribution of working children 5-14 years old, by sex and level of education, Pakistan and provinces, January 1996
Last week Last 12 months Level of education
Both sexes Male Female Both sexes Male Female
Pakistan 100.00 100.00 100.00 100.00 100.00 100.00
Illiterate 66.83 59.06 88.35 67.16 59.56 88.77
Literate 33.17 40.94 11.65 32.84 40.44 11.23
No formal education 0.62 0.68 0.46 0.62 0.70 0.42
Pre-matric 32.55 40.26 11.19 32.22 39.74 10.81
Rural 100.00 100.00 100.00 100.00 100.00 100.00
Illiterate 67.90 59.53 89.12 68.26 60.08 89.62
Literate 32.10 40.47 10.88 31.74 39.92 10.38
No formal education 0.59 0.65 0.45 0.59 0.67 0.39
Pre-matric 31.51 39.82 10.43 31.15 39.25 9.99
Urban 100.00 100.00 100.00 100.00 100.00 100.00
Illiterate 58.23 55.94 74.31 58.40 56.15 73.92
Literate 41.77 44.06 25.69 41.60 43.85 26.08
No formal education 0.84 0.85 0.78 0.87 0.88 0.81
Pre-matric 40.93 43.21 24.91 40.73 42.97 25.27
Punjab 100.00 100.00 100.00 100.00 100.00 100.00
Illiterate 68.01 61.70 85.00 68.10 62.18 84.81
Literate 31.99 38.30 15.00 31.90 37.82 15.19
No formal education 0.74 0.84 0.47 0.75 0.87 0.41
Pre-matric 31.25 37.46 14.53 31.15 36.95 14.78
Sindh 100.00 100.00 100.00 100.00 100.00 100.00
Illiterate 55.77 54.03 75.18 55.19 53.37 74.65
Literate 44.23 45.97 24.82 44.81 46.63 25.35
No formal education 0.65 0.70 0.17 0.67 0.72 0.17
Pre-matric 43.58 45.27 24.65 44.14 45.91 25.18
NWFP 100.00 100.00 100.00 100.00 100.00 100.00
Illiterate 67.62 55.47 94.72 68.69 56.46 95.96
Literate 32.38 44.53 5.28 31.31 43.54 4.04
No formal education 0.39 0.34 0.49 0.38 0.36 0.44
Pre-matric 31.99 44.19 4.79 30.93 43.18 3.60
Balochistan 100.00 100.00 100.00 100.00 100.00 100.00
Illiterate 77.88 78.24 63.02 78.30 78.66 64.36
Literate 22.12 21.76 36.98 21.70 21.34 35.64
No formal education 1.03 1.05 – 1.04 1.07 –
Pre-matric 21.09 20.71 36.98 20.66 20.27 35.64
Source: Federal Bureau of Statistics, Child Labour Survey, 1996.

24 Pakistan
Table 8. Percentage distribution of working children 5-14 years old, by employment status and sex, Pakistan and provinces, January 1996
Employment status Last week Last 12 months
Both sexes Male Female Both sexes Male Female
Pakistan 100.00 100.00 100.00 100.00 100.00 100.00
Employer – – – – – –
Self-employed 6.74 7.17 5.54 7.61 8.17 6.02
Employees 23.15 25.42 16.87 22.54 25.22 14.93
Unpaid family helper 70.11 67.41 77.59 69.85 66.61 69.05
Rural 100.00 100.00 100.00 100.00 100.00 100.00
Employer – – – – – –
Self-employed 6.61 7.05 5.48 7.43 7.98 5.99
Employees 18.34 19.70 14.87 17.68 19.54 12.83
Unpaid family helper 75.06 73.25 79.65 74.89 72.48 81.18
Urban 100.00 100.00 100.00 100.00 100.00 100.00
Employer – – – – – –
Self-employed 7.80 7.97 6.55 9.04 9.40 6.57
Employees 61.80 63.00 53.35 61.27 62.67 51.62
Unpaid family helper 30.40 29.03 40.10 29.69 27.90 41.81
Punjab 100.00 100.00 100.00 100.00 100.00 100.00
Employer – – – – – –
Self-employed 6.26 7.29 3.48 7.33 8.31 4.55
Employees 26.26 27.18 23.77 25.24 26.92 20.51
Unpaid family helper 67.48 65.53 72.75 67.43 64.77 74.94
Sindh 100.00 100.00 100.00 100.00 100.00 100.00
Employer – – – – – –
Self-employed 6.72 7.08 2.65 7.44 8.01 1.33
Employees 61.95 62.93 50.97 62.13 63.05 52.33
Unpaid family helper 31.33 29.99 46.38 30.43 28.94 46.34
NWFP 100.00 100.00 100.00 100.00 100.00 100.00
Employer – – – – – –
Self-employed 7.61 6.97 9.05 8.15 7.94 8.62
Employees 6.22 7.56 3.24 6.17 7.39 3.44
Unpaid family helper 86.16 85.47 87.71 85.68 84.67 87.94
Balochistan 100.00 100.00 100.00 100.00 100.00 100.00
Employer – – – – – –
Self-employed 7.83 7.88 6.03 8.73 8.64 12.36
Employees 48.00 48.04 46.42 48.23 47.48 76.73
Unpaid family helper 44.17 44.08 47.55 43.04 43.88 10.91Source: Federal Bureau of Statistics, Child Labour Survey, 1996.

Pakistan 25
Table 9. Percentage distribution of working children 5-14 years old, by number of hours worked during the reference week and by sex, Pakistan and provinces, January 1996
No. of hours worked per week
Total Not worked
Less than 5 hours
5-9 hours
10-14 hours
15-24 hours
25-34 hours
35-41 hours
42-48 hours
49-55 hours
56 hours or more
Pakistan 100.00 0.32 0.19 5.14 12.95 20.01 15.56 11.68 16.93 4.61 12.59
Male 100.00 0.35 0.20 5.35 11.16 19.52 22.93 11.49 19.82 4.80 14.38
Female 100.00 0.26 0.15 4.57 17.91 21.37 22.86 12.21 8.93 4.10 7.64
Rural 100.00 0.33 0.18 5.68 13.95 21.07 16.38 11.72 15.12 4.47 11.09
Male 100.00 0.36 0.20 6.04 12.17 20.87 13.75 11.62 17.89 4.57 12.53
Female 100.00 0.26 0.15 4.77 18.45 21.57 23.07 11.99 8.09 4.21 7.44
Urban 100.00 0.27 0.23 0.82 4.95 11.49 8.98 11.32 31.51 5.78 24.64
Male 100.00 0.27 0.24 0.83 4.50 10.59 7.57 10.62 32.55 6.30 26.53
Female 100.00 0.26 0.18 0.80 8.12 17.76 18.91 16.30 24.19 2.15 11.34
Punjab 100.00 0.27 0.22 2.19 10.29 18.29 15.58 14.13 20.58 4.81 13.64
Male 100.00 0.30 0.21 2.10 9.28 15.56 12.80 13.30 23.66 5.74 16.98
Female 100.00 0.17 0.23 2.44 12.99 25.65 23.05 16.19 12.32 2.31 4.65
Sindh 100.00 0.02 0.18 1.46 2.86 10.19 15.23 14.61 31.22 3.60 20.64
Male 100.00 0.02 0.20 0.65 2.32 9.67 15.34 15.15 31.38 3.87 21.40
Female 100.00 – – 10.58 8.93 15.91 14.07 8.50 29.31 0.55 12.15
NWFP 100.00 0.52 0.09 11.65 20.83 26.08 15.68 5.97 6.14 4.57 8.47
Male 100.00 0.52 0.11 13.51 18.31 31.07 12.32 5.93 8.01 3.38 6.84
Female 100.00 0.43 0.04 7.52 26.45 14.96 23.20 6.09 1.98 7.23 12.10
Balochistan 100.00 – 3.86 0.17 1.07 8.90 12.05 41.34 23.87 1.62 7.11
Male 100.00 – 3.96 0.18 0.20 9.01 11.90 41.81 23.99 1.66 7.29
Female 100.00 – – – 36.22 4.53 17.74 22.26 19.25 – –
Source: Federal Bureau of Statistics, Child Labour Survey, 1996.

26 Pakistan
Table 10. Percentage distribution of working children 5-14 years old, by frequency of injuries/illness and by sex, Pakistan and provinces, January 1996
Frequency of injuries/illness Both sexes Male Female
Pakistan 100.00 100.00 100.00
Often/frequently 6.60 7.50 4.12
Occasionally 27.64 29.19 23.36
Seldom/rarely 33.30 30.35 41.43
Never (no injuries or illness) 32.46 32.96 31.09
Rural 100.00 100.00 100.00
Often/frequently 6.63 7.65 4.05
Occasionally 28.03 29.82 23.47
Seldom/rarely 34.31 31.39 41.73
Never (no injuries or illness) 31.03 31.14 30.75
Urban 100.00 100.00 100.00
Often/frequently 6.37 6.50 5.46
Occasionally 24.53 24.99 21.30
Seldom/rarely 25.14 23.61 35.87
Never (no injuries or illness) 43.96 44.90 37.37
Punjab 100.00 100.00 100.00
Often/frequently 4.32 4.58 3.63
Occasionally 25.23 25.62 24.17
Seldom/rarely 26.58 26.00 28.12
Never (no injuries or illness) 43.87 43.80 44.08
Sindh 100.00 100.00 100.00
Often/frequently 7.72 8.07 3.81
Occasionally 38.68 39.12 33.97
Seldom/rarely 9.19 9.09 10.27
Never (no injuries or illness) 44.41 43.72 51.95
NWFP 100.00 100.00 100.00
Often/frequently 10.50 13.00 4.92
Occasionally 29.15 32.69 21.26
Seldom/rarely 52.84 47.26 65.26
Never (no injuries or illness) 7.51 7.05 8.56
Balochistan 100.00 100.00 100.00
Often/frequently 3.64 3.56 6.79
Occasionally 12.29 12.50 3.77
Seldom/rarely 2.13 1.30 36.23
Never (no injuries or illness) 81.94 82.64 53.21Source: Federal Bureau of Statistics, Child Labour Survey, 1996.

Pakistan 27
Table 11. Injuries/illness: Distribution of working children 5-14 years old ever worked in economic activity by major occupations
Major occupation groups Both sexes Male Female
Pakistan 100.00 100.00 100.00
Legislators, senior officials and manager
Professionals 0.00 0.01
Technicians and associate professionals 0.09 0.10 0.05
Clerks
Service workers, shop and market sales workers 8.63 11.57 0.72
Skilled agricultural and fishery workers
Craft and related trade workers 15.77 16.06 14.98
Plant and machine operators and assemblers 0.29 0.38 0.05
Elementary occupations* 75.22 71.87 84.19
Rural 100.00 100.00 100.00
Legislators, senior officials and manager
Professional
Technicians and associate professionals 0.06 0.06 0.04
Clerks
Service workers, shop and market sales workers 7.24 9.88 0.61
Skilled agricultural and fishery workers
Craft and related trade workers 11.70 11.48 12.25
Plant and machine operators and assemblers 0.20 0.26 0.04
Elementary occupations* 80.80 78.30 87.07
Urban 100.00 100.00 100.00
Legislators, senior officials and manager
Professional 0.05 0.06
Technicians and associate professionals 0.39 0.42 0.18
Clerks
Service workers, shop and market sales workers 22.32 25.44 3.08
Skilled agricultural and fishery workers
Craft and related trade workers 55.95 53.65 70.14
Plant and machine operators and assemblers 1.19 1.32 0.39
Elementary occupations* 20.10 19.11 26.21
Punjab 100.00 100.00 100.00
Legislators, senior officials and manager
Professional 0.01 0.01
Technicians and associate professionals 0.08 0.07 0.10
Clerks
Service workers, shop and market sales workers 8.81 11.63 1.22
Skilled agricultural and fishery workers

28 Pakistan
Major occupation groups Both sexes Male FemaleCraft and related trade workers 24.40 24.19 24.98
Plant and machine operators and assemblers 0.51 0.68 0.04
Elementary occupations* 66.19 63.41 73.66
Sindh 100.00 100.00 100.00
Legislators, senior officials and manager
Professional
Technicians and associate professionals 0.13 0.14
Clerks
Service workers, shop and market sales workers 17.40 18.70 0.81
Skilled agricultural and fishery workers
Craft and related trade workers 21.70 18.87 57.74
Plant and machine operators and assemblers 0.11 0.12
Elementary occupations* 60.66 62.17 41.45
NWFP 100.00 100.00 100.00
Legislators, senior officials and manager
Professional
Technicians and associate professionals 0.09 0.13
Clerks
Service workers, shop and market sales workers 6.89 9.87 0.23
Skilled agricultural and fishery workers
Craft and related trade workers 5.45 5.84 3.38
Plant and machine operators and assemblers 0.08 0.08 0.07
Elementary occupations* 87.49 84.08 96.32
Balochistan 100.00 100.00 100.00
Legislators, senior officials and manager
Professional
Technicians and associate professionals 0.86 0.91
Clerks
Service workers, shop and market sales workers 16.77 17.88
Skilled agricultural and fishery workers
Craft and related trade workers 40.43 36.57 98.39
Plant and machine operators and assemblers
Elementary occupations* 41.94 44.63 1.61
* Elementary (unskilled) occupations include: sales and services elementary occupations; agricultural, fishery and relatedlabourers; labourers in mining, construction, manufac1ring and transport. Source: Federal Bureau of Statistics, Child Labour Survey, 1996.

Pakistan 29
Table 12. Injuries/illness: Distribution of working children 5-14 years by major industry division and sex (Pakistan and provinces, January 1996)
Major industry division Both sexes Male Female
Pakistan 100.00 100.00 100.00
Agriculture, forestry, hunting and fishing 71.01 67.12 81.36
Mining and quarrying
Manufacturing 8.62 8.32 9.41
Electricity, gas and water 0.01 0.02
Construction 1.69 2.25 0.17
Wholesale and retail trade and restaurants and hotels 8.19 11.08 0.55
Transport storage and communication 3.27 4.45 0.08
Financing, insurance, real estate and business services 0.02 0.02
Community, social and personal services 7.19 6.72 8.42
Rural 100.00 100.00 100.00
Agriculture, forestry, hunting and fishing 77.40 74.45 84.81
Mining and quarrying
Manufacturing 6.21 5.73 7.42
Electricity, gas and water 0.02 0.02
Construction 1.53 2.09 0.12
Wholesale and retail trade and restaurants and hotels 6.62 9.08 0.43
Transport storage and communication 2.36 3.26 0.08
Financing, insurance, real estate and business services 0.01 0.02
Community, social and personal services 5.85 5.34 7.14
Urban 9.19 10.84 4.72
Agriculture, forestry, hunting and fishing 7.90 7.27 11.76
Mining and quarrying
Manufacturing 32.45 29.65 49.74
Electricity, gas and water
Construction 3.24 3.58 1.12
Wholesale and retail trade and restaurants and hotels 23.70 27.06 2.95
Transport storage and communication 12.31 14.28 0.15
Financing, insurance, real estate and business services 0.04 0.05
Community, social and personal services 20.35 18.10 34.26
Activities not adequately defined
Punjab 100.00 100.00 100.00
Agriculture, forestry, hunting and fishing 61.27 57.82 70.60
Mining and quarrying
Manufacturing 13.63 12.69 16.15
Electricity, gas and water 0.03 0.04
Construction 2.17 2.89 0.20

30 Pakistan
Major industry division Both sexes Male FemaleWholesale and retail trade and restaurants and hotels 8.13 10.82 0.87
Transport storage and communication 4.44 6.04 0.13
Financing, insurance, real estate and business services 0.01 0.01
Community, social and personal services 10.32 9.68 12.05
Sindh 100.00 100.00 100.00
Agriculture, forestry, hunting and fishing 51.22 52.31 37.32
Mining and quarrying
Manufacturing 13.91 10.99 51.22
Electricity, gas and water
Construction 1.99 2.14
Wholesale and retail trade and restaurants and hotels 17.22 18.50 0.81
Transport storage and communication 7.76 8.28 1.15
Financing, insurance, real estate and business services
Community, social and personal services 7.90 7.77 9.50
NWFP 100.00 100.00 100.00
Agriculture, forestry, hunting and fishing 85.30 81.58 93.75
Mining and quarrying
Manufacturing 2.12 2.57 1.12
Electricity, gas and water
Construction 1.11 1.54 0.15
Wholesale and retail trade and restaurants and hotels 6.69 9.54 0.22
Transport storage and communication 1.19 1.71
Financing, insurance, real estate and business services 0.03 0.04
Community, social and personal services 3.55 3.02 4.76
Balochistan 100.00 100.00 100.00
Agriculture, forestry, hunting and fishing 31.37 33.46
Mining and quarrying
Manufacturing 19.23 19.98 8.06
Electricity, gas and water
Construction 1.01 1.07
Wholesale and retail trade and restaurants and hotels 22.96 24.49
Transport storage and communication 9.72 10.37
Financing, insurance, real estate and business services
Community, social and personal services 15.71 10.63 91.94 Source: Federal Bureau of Statistics, Child Labour Survey, 1996.

Pakistan 31
Table 13. Distribution of working children 5-14 years old by parents’/ guardian’s main reason for letting child to work (January 1996)
Major occupation groups Both sexes Male Female
Pakistan 100.00 100.01 100.01
To supplement household income 27.47 29.67 21.38
To pay outstanding debt 0.85 1.00 0.44
Assist/help in household enterprise 54.39 54.92 52.93
No one else available for household chores 14.24 10.96 23.34
Other 3.05 3.46 1.92
Rural 100.00 100.00 100.00
To supplement household income 23.32 24.85 19.46
To pay outstanding debt 0.63 0.74 0.35
Assist/help in household enterprise 57.60 59.14 53.69
No one else available for household chores 15.93 12.52 24.56
Other 2.52 2.75 1.93
Urban 100.00 100.01 100.00
To supplement household income 60.78 61.41 56.35
To pay outstanding debt 2.57 2.66 1.97
Assist/help in household enterprise 28.64 27.16 39.04
No one else available for household chores 0.70 0.67 0.94
Other 7.31 8.11 1.70
Punjab 100.00 100.00 100.00
To supplement household income 29.88 31.43 25.70
To pay outstanding debt 0.83 0.91 0.61
Assist/help in household enterprise 61.01 59.75 64.42
No one else available for household chores 4.53 3.88 6.27
Other 3.75 4.03 3.00
Sindh 99.99 100.01 159.40
To supplement household income 63.37 64.48 50.99
To pay outstanding debt 3.15 3.26 2.01
Assist/help in household enterprise 30.00 28.69 44.66
No one else available for household chores 1.00 0.94 1.74
Other 2.47 2.64 60.00
NWFP 99.99 100.00 100.00
To supplement household income 12.69 12.90 12.23
To pay outstanding debt 0.19 0.26 0.04
Assist/help in household enterprise 49.25 55.58 35.14
No one else available for household chores 35.94 28.60 52.31
Other 1.92 2.66 0.28
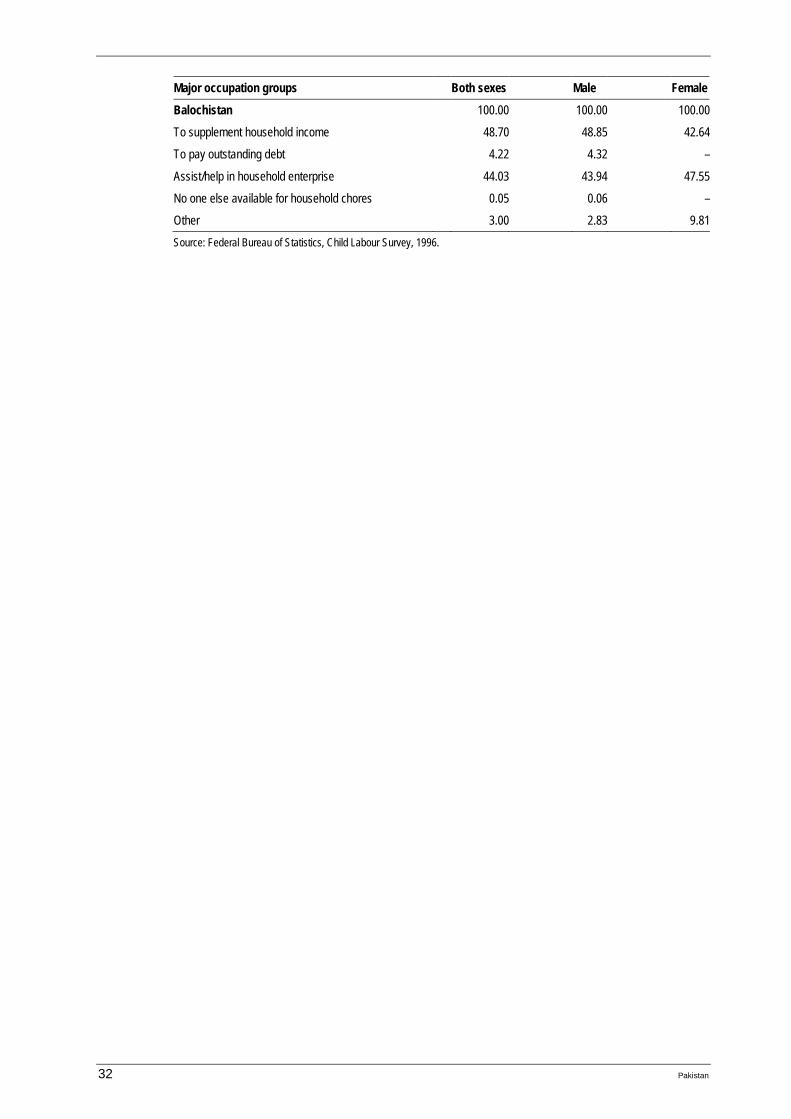
32 Pakistan
Major occupation groups Both sexes Male FemaleBalochistan 100.00 100.00 100.00
To supplement household income 48.70 48.85 42.64
To pay outstanding debt 4.22 4.32 –
Assist/help in household enterprise 44.03 43.94 47.55
No one else available for household chores 0.05 0.06 –
Other 3.00 2.83 9.81 Source: Federal Bureau of Statistics, Child Labour Survey, 1996.

Pakistan 33
Table 14. Percentage distribution of employed children 5-14 years old, by household income (January 1996)
Areas/provinces Total Less thanRs.1,501
Rs.1,501 to2,500
Rs.2,501 to 4,000
Rs.4,001 andabove
Pakistan 100.00 8.97 31.13 39.15 20.74
Rural 100.00 9.50 32.73 38.38 19.39
Urban 100.00 4.73 18.34 45.35 31.58
Punjab 100.00 9.19 30.40 40.52 19.89
Sindh 100.00 11.55 31.34 38.43 18.68
NWFP 100.00 7.91 32.51 36.61 22.97
Balochistan 100.00 4.17 25.04 56.67 14.12 Source: Federal Bureau of Statistics, Child Labour Survey, 1996.

34 Pakistan
Appendix 1
Sampling and estimation procedures adopted for the Child Labour Survey
Notations
Nh = Number of total PSUs in the hth stratum of a province.
nh = Number of sample PSUs in the hth stratum of a province.
Mhi = Number of total SSUs in the ith sample PSU of hth stratum of a province.
mhi = Number of sample SSUs in the ith sample PSU of hth stratum of a province.
Phi = Assigned probability of selection of ith PSU of the hth stratum of a province.
Yhij = Value of any characteristic y of jth SSU within ith PSU of hth stratum of a province.
Xhij = Value of any characteristic x of jth SSU within ith PSU of hth stratum of a province with whose respect proportion is required.
Estimation formulae for totals and their variances
∑∑∑∑====
====L
hhNN
1
∑∑∑∑====
====L
hhnn
1
hi
hin
ihh P
Yn
Yh ˆ1ˆ1∑∑∑∑
====
====
hij
m
jhi
hi
hi
n
ihh y
mM
PnY
hih
∑∑∑∑∑∑∑∑========
====11
11ˆ
hi
hin
ih
L
hh
L
h PY
nYY
h ˆ1ˆˆ111∑∑∑∑∑∑∑∑∑∑∑∑
========−−−−
========
For X, another variable of interest, we have:
hij
m
jhi
hi
hi
n
ihhi
hin
ihh X
mM
PnPX
nX
hihh
∑∑∑∑∑∑∑∑∑∑∑∑============
========111
11ˆ1ˆ
hi
hin
ih
L
hh
L
h PX
nXX
h ˆ1ˆˆ111∑∑∑∑∑∑∑∑∑∑∑∑
============
========

Pakistan 35
XYR ˆˆˆ ====
(((( )))) (((( ))))
−−−−========
∑∑∑∑∑∑∑∑
====
==== h
hi
hin
i
hi
hin
ihh
ht
hh n
Py
PY
nnS
nYV
h
h
2
12
2
1
2
ˆˆ
111ˆ
(((( )))) (((( ))))
−−−−========
∑∑∑∑∑∑∑∑∑∑∑∑∑∑∑∑
====
============ h
hi
hin
i
hi
hin
ihh
L
hht
h
L
h nPy
PY
nnS
nYV
h
h
2
12
2
11
2
1
ˆˆ
111ˆ