summary report on main findings unversity of jordan · summary report on main findings ... refugee...
TRANSCRIPT


Summary Report on Main Findings
National Child Labour Survey 2016 of Jordan
Center for Strategic StudiesUnversity of Jordan
In Collaboration withInternational Labour Organisation(ILO)
&Minstry of Labour
& Department of Statistics
Amman, August 2016

3
National Child Labour Survey 2016 of Jordan Center for Strategic Studies
The designations employed in this International Labour Organization (ILO) sup-ported publication, and the presentation of material therein do not imply the expres-sion of any opinion whatsoever on the part of the ILO concerning the legal status of any country, area or territory or of its authorities, or concerning the delimitation of its frontiers.The responsibility for opinions expressed in signed articles, studies and other con-tributions rests solely with their authors, and the publication does not constitute an endorsement by the ILO of the opinions expressed in them. Reference to names of firms and commercial products and processes does not imply their endorsement by the ILO, and any failure to mention a particular firm, com-mercial product or process is not a sign of disapproval.Funding for this publication was provided by the United States Department of Labor (Project JOR/10/50/USA). This publication does not necessarily reflect the views or policies of the United States Department of Labor, nor does mention of trade names, commercial products, or organizations imply endorsement by the United States Government.
Research Team
Dr. Musa Shteiwi Dr. Walid Alkhatib
Ahmad SaadEdeen
Design by Rania Meshal

4
National Child Labour Survey 2016 of Jordan Center for Strategic Studies
Contents
I. INTRODUCTION AND SURVEY OBJECTIVES................................ 6 A. Introduction......................................................................................... 6 B. Survey Scope and Objectives............................................................ 7 C. Child Labour Measurement Protocol............................................... 10 II. MAIN CONCEPTS AND DEFINITIONS IN CHILD LABOUR........ 12A. Concepts and definitions..................................................................... 12B. Statistical measurement framework.................................................... 15III. GENERAL POPULATION CHARACTERISTICS....................... 16IV. WORKING CHILDREN AND CHILD LABOUR .......................... 18 V. OTHER ACTIVITIES BY CHILDREN.............................................. 22A. School attendance.................................................................................. 22B. Household chores................................................................................... 25C. Children grouped by activities ............................................................ 28 IV. CHARACTERISTICS OF WORKING CHILDREN.................... 30A. Industrial sector .................................................................................... 30B. Occupational group................................................................................ 31C. Status in employment............................................................................ 31D. Weekly hours of work........................................................................... 33E. Earnings of working children............................................................... 35 VII. ADDITIONAL CHILD LABOUR CONCERNS............................ 36A. Health and safety at work.................................................................... 36B. Place of work........................................................................................... 38C. Other child work issues ........................................................................ 40 i. Children at more than one job............................................................ 40 ii. Children seeking work ........................................................................ 41 iii. Age when children start to work..................................................... 42

5
National Child Labour Survey 2016 of Jordan Center for Strategic Studies

6
National Child Labour Survey 2016 of Jordan Center for Strategic Studies
I. INTRODUCTION AND SURVEY OBJECTIVES
A. Introduction
The Jordan National Child Labour Survey (NCLS) 2016 has been implemented by the Centre for Strategic Studies, University of Jordan, in consultation with the Ministry of Labour and the Department of Statistics of the Government of Jordan. Technical and financial support was provided by the International Labour Office (ILO) under its project “Moving towards a Child Labour Free Jordan (JOR/10/50/USA)” funded by the United States Department of Labor1 in which the Ministry of Labour is the national partner.
The primary objective of the project and the NCLS 2016 is to provide an updated and comprehensive database on child labour in Jordan to support the creation of an en-abling environment to combat child labour, by building on achievements made already in the country and to continue complementing other initiatives of the Government of Jordan and civil society aimed at reducing student drop-out from basic education, improving working conditions for youth, and progressively eliminating child labour. The findings of the Jordan NCLS 2016 shall facilitate also the process of informed and targeted policy making by the Ministry of Labour and Ministry of Social Development to combat the underlying factors leading to children labour.
The Jordan NCLS 2016 is a successor to the Child Labour Survey 2007 of Jordan that was also supported by the ILO, but is an advance in several respects. First, the survey estimates incorporate the guidelines and statistical measurement standards on child la-bour and relevant statistics of working children as contained in the Resolution concern-ing the statistics of child labour adopted in December 2008 at the 18th International Conference of Labour Statisticians. Second, the survey covered children within the age of 5 to 17 years. Third, to provide robust estimates of child labour within Jordan, the entire resident population of Jordan including migrants and refugee households was the survey target population. This last point is very relevant and important since the ground situation in Jordan over the past few years has been considerably altered due to the large influx of Syrian refugees.2
1- Funding for this publication was provided by the United States Department of Labor (Project JOR/10/50/USA). This publication does
not necessarily reflect the views or policies of the United States Department of Labor, nor does mention of trade names, commercial
products, or organizations imply endorsement by the United States Government.
2 An unpublished report, supported by the ILO “Rapid Assessment on Child Labour in the Urban Informal Sector in three governorates
of Jordan (Amman, Mafraq and Irbid)”, January 2014, found that child labour in Jordan is increasing. The highest percentage of the
surveyed child labourers were selling food and non-food items in the streets and in shops, as well as working in the service sector gener-
ally. This indicates that the informal sector is a place where child labourers are employed. From their work, child labourers are making
very significant contributions to household incomes, especially among Syrian families. Economic pressures on families are increasing
as the cost of living rises, and Syrian children’s wages are contributing to rent and other basic household expenditures. Jordanian chil-
dren contribute to rent and other household expenses, but also use their wages for entertainment purposes or for personal items such as
mobile phone credit. There are risks that child labour will increase among Jordanians, as families appear to be accepting child work as
a norm, while simultaneously finding that the schooling system is not of great value. As a result, the enrolment and school attendance
rate is low among child labourers.
7
National Child Labour Survey 2016 of Jordan Center for Strategic Studies
Due to these methodological improvements in the Jordan NCLS 2016, it is not strictly correct to compare the findings in this report to the estimates contained in the report on the Child Labour Survey 2007 of Jordan (except for the percentage of working children).
In recent years, Jordan has taken significant steps to to strengthen its policy responses to child labour. A Child Labour Unit has been established within the Ministry of La-bour and the Ministry also chairs the National Committee on Child Labour (NCCL). In 2011, the Prime Minister approved the National Framework to Combat Child Labour (NFCCL), the implementation of which is being supported by the ILO. The NFCCL is designed to integrate efforts to combat child labour among the Ministries of Labour, Education, and Social Development to effectively tackle the identification and referral of child labour across Jordan. And in 2014 the Juvenile Law No. 32 was adopted by the Parliament resulting in a bigger role for the Ministry of Social Devel-opment in addressing child labour and the creation of a Child Labour Unit there as well.
This Summary Report presents the main features of the Jordan NCLS 2016 and its most relevant and important findings.1
B. Survey Scope and Objectives
The Jordan NCLS 2016 was implemented with a sample size of 20,002 households selected randomly by a 3-stage sampling process across the entire country. It was designed to generate estimates disaggregated by the 12 governorates and the Zaatari refugee camp, as also breakdown by gender male/ female, children 5–17 years by major groups, rural/ urban residence, and nationality as Jordanian/ Syrian/ other nationalities.
1- The full Jordan National Child Labor Survey Report 2016, including a more detailed presentation of findings and estimates from the
surveys, the technical details and questionnaire, will be disseminated in September 2016 by the Centre for Strategic Studies, University
of Jordan, and the ILO.

8
National Child Labour Survey 2016 of Jordan Center for Strategic Studies
The distribution of the sampled households is provided in below.
Table 1: Distribution of Sampled Households : (unweighted)Governorates: Urban Rural TotalAmman 6684 456 7140Balqa 1044 384 1428Zarqa 2808 156 2964Madaba 336 144 480Irbid 2951 648 3599Mafraq 335 516 851Jerash 432 204 636Ajloun 336 132 468Karak 264 528 792Tafeileh 216 120 336Ma’an 180 168 348Aqaba 300 60 360Zaatari refugee camp 600 0 600Jordan (Total) 16486 3516 20002
A national stakeholders’ workshop was held on 4 June 2015 in Amman on the proposed Jordan NCLS 2015-16 to obtain views of the National Committee on Child Labour, ILO constituents [Ministry of Labour, and employers’ and workers’ associations], concerned government ministries/ offices, and other stakeholders on the critical survey specifics for data collection in order that, both, the survey process and the data collection instrument (that is, the questionnaire) are suitably designed. It was agreed that:
1. The survey target population be all persons 5 – 17 years residing in Jordan.
2. The estimates of working children and child labour shall be classified by:
(i) Male – female gender; (ii) Age-groups to reflect school levels and minimum legal age for work; (iii) Rural – urban residence; (iv) Major nationality groups, namely, Jordanian, Syrian, and others; and (v) All 12 governorates.

9
National Child Labour Survey 2016 of Jordan Center for Strategic Studies
3. Identification of the main economic sectors/ geographical areas/ patterns of work/ types of economic activities (jobs)/ etc. where child labour is found, with special focus on agriculture, and child workers in own family farm/ business.
4. Classification of child workers by industry/ occupation/ status in employment.
5. Earnings, weekly hours of work, etc. of child workers.
6. Education levels/ schooling status, and reasons for working/ school dropout.
7. Engagement in household chores (weekly hours, main types of chores).
8. Health and safety issues at work place; violence/ abuse at workplace.

10
National Child Labour Survey 2016 of Jordan Center for Strategic Studies
C. Child Labour Measurement Protocol
The child labour measurement protocol for the Jordan NCLS 2016 is illustrated by the four (4) main aggregates that are estimated as the most important statistics from the survey.
Desegregation of each aggregate and the major activities and characteristics of working children by gender, age-groups, rural-urban residence, nationality, and governorates constitute the essence of the findings contained in the Jordan NCLS 2016 Report.
The following chapter illustrates the statistical measurement framework for working children, child labour and hazardous work applied for the estimates contained in this Report. The measurement framework is based on the guidelines provided by the Resolution concerning statistics of child labour adopted at the Eighteenth International Conference of Labour Statisticians in December 2008, and take into account the provisions in the national legislation in Jordan on compulsory schooling and employment, especially of juveniles.

11
National Child Labour Survey 2016 of Jordan Center for Strategic Studies

12
National Child Labour Survey 2016 of Jordan Center for Strategic Studies
II. MAIN CONCEPTS AND DEFINITIONS IN CHILD LABOUR
A. Concepts and definitions
Household: A household is defined as a person or group of persons who live together in the same house or compound, who share the same housekeeping arrangements and who are catered for as one unit. Members of a household are not necessarily related to each other either by blood or marriage. In order to be considered a household member, a person must reside with the other household members in the dwelling for six months or more and must not be a member of any other household. Institutions such as military forces barracks, prisons, orphanages, etc. are treated as households.
Child: In line with the 1989 UN Convention on the Rights of the Child (CRC) and the 1999 ILO Convention (No. 182) on the Worst Forms of Child Labour (WFCL), a child is defined as an individual under the age of 18. In addition, the Jordanian Labour Law No. 8 of 1996 defines a ‘juvenile’ as “Every person, male or female, who reached the age of seventeen and not yet eighteen.” For this survey, the target population for measuring child labour comprises all persons in the age group from 5 to 17 years, where age is measured as the number of completed years at the child’s last birthday.
The child population and its characteristics is analysed by the age-groups 5-11 years, 12-14 years and 15-17 years. The exceptions are (i) the table concerning school attendance, where the category 16-17 years is used to distinguish the age where school is no longer compulsory, and (ii) in the definition of hazardous work where the category 16-17 years (juvenile) is applied to distinguish a child who is above the Jordanian minimum age for employment.
Employment: Persons in employment are defined as all those of working age who, during a reference period of seven days, were engaged in any activity to produce goods or provide services for pay or profit. They comprise: (i) Employed persons “at work”, i.e. who worked in a job for at least one hour; and (ii) Employed persons “not at work” due to temporary absence from a job, or to working-time arrangements (such as shift work, flexitime and compensatory leave for overtime).
Children in employment (‘working children’ or ‘children in economic activity’): Children are defined as ‘in employment’ or as ‘working children’ if they worked for at least one hour during the survey reference period (1 week) or if they had a job or business from which they were temporarily absent. Such work may be on full-time or part-time basis, paid or unpaid.

13
National Child Labour Survey 2016 of Jordan Center for Strategic Studies
Child labour: Child labourers are defined as children who are engaged in work unsuitable for their capacities as children or in work that may jeopardize their health, education or moral development. The definition is based on ILO Convention No. 138 on minimum age and ILO Convention No. 182 on the worst forms of child labour, taken in conjunction with relevant clauses on employment of juveniles in the Jordan Labour Law No.8 of 1996. Taking into account the minimum age for employment in Jordan (16 years) and the definition of hazardous work (see below), child labour is defined as:
i) All children in employment under the age of 16 years;ii) Children aged 16 -17 years employed for more than 36 hours per week; andiii) Children under the age of 18 years engaged in designated hazardous work.
Hazardous work by children: Hazardous work by children engaged in such work are defined based on the guidelines provided under ILO Convention No. 182 on the worst forms of child labour. Hazardous work is work that might be harmful to a child’s physical, social or psychological development. The latter category has been defined in detail by the Jordanian Ministry of Labour in 2011, in line with Article 74 of Labour Law No. 8 of 1996, via Official Gazette on Decision issued by the Minister of Labour called “Decision on Dangerous, Strenuous or Health-Hazardous Forms of Labour for Juveniles for the Year 2011”. Such work includes that which involves the use of dangerous machinery and equipment; the use and manufacture of explosives; working with fire, gas or chemicals; guarding duties; work that requires excessive physical or repetitive effort; work that takes place in dusty, noisy, extremely hot or cold, or otherwise unhealthy environments; work that takes place underwater; work in mines and at construction sites; and work in hotels, restaurants, clubs and nightclubs.
Household chores (also called ‘unpaid household services’): Refers to all children aged 5-17 years who, during a short reference period were engaged in any unpaid activity to provide services for their own household or family, such as preparing and serving meals; mending, washing and ironing clothes; shopping; caring for siblings and sick/disabled household members; cleaning and maintaining the household dwelling; repairing household durables; and transporting household members and their goods. Engagement in ‘household chores’ is not included in the estimate of ‘working children’.
14
National Child Labour Survey 2016 of Jordan Center for Strategic Studies
Worst forms of child labour (WFCL)’: By ILO’s Convention No. 182 these are:• All forms of slavery or practices similar to slavery, such as the sale and trafficking
of children, debt bondage and serfdom, as well as forced or compulsory labour, including forced or compulsory recruitment of children for use in armed conflict;
• The use, procuring or offering of a child for prostitution, for the production of pornography or for pornographic performances;
• The use, procuring or offering of a child for illicit activities, in particular for the production and trafficking of drugs as defined in relevant international treaties; and
• Work which, by its nature or the circumstances in which it is carried out, is likely to harm the health, safety or morals of children (also called ‘hazardous work’).
Among WFCL, the Jordan NCLS survey measured only child labour in hazardous work.
Usual activity status: Work status over a 12-month reference period. (While the survey has collected this information, the estimates in the Child Labour in Jordan 2015 Report are based only on the data collected over the reference period of 7 days.)
Job: A job is defined as a set of tasks and duties which are carried out by, or can be assigned to, one person for a single economic unit. Persons may have one or more jobs.
Occupation: The term “occupation” refers to the kind of work done by the person in a specific job, irrespective of his/her status in employment (employee or self-employed) and of the kind of goods or services produced by the establishment where the person works (industry).
Industry: Industry refers to the type of economic activity carried out by the establishment, business or organization where the person holds a job, including own account enterprises. The type of economic activity is determined by the main goods and services produced or provided to other units or persons. An industry is a group of units which carry out similar economic activities.
15
National Child Labour Survey 2016 of Jordan Center for Strategic Studies
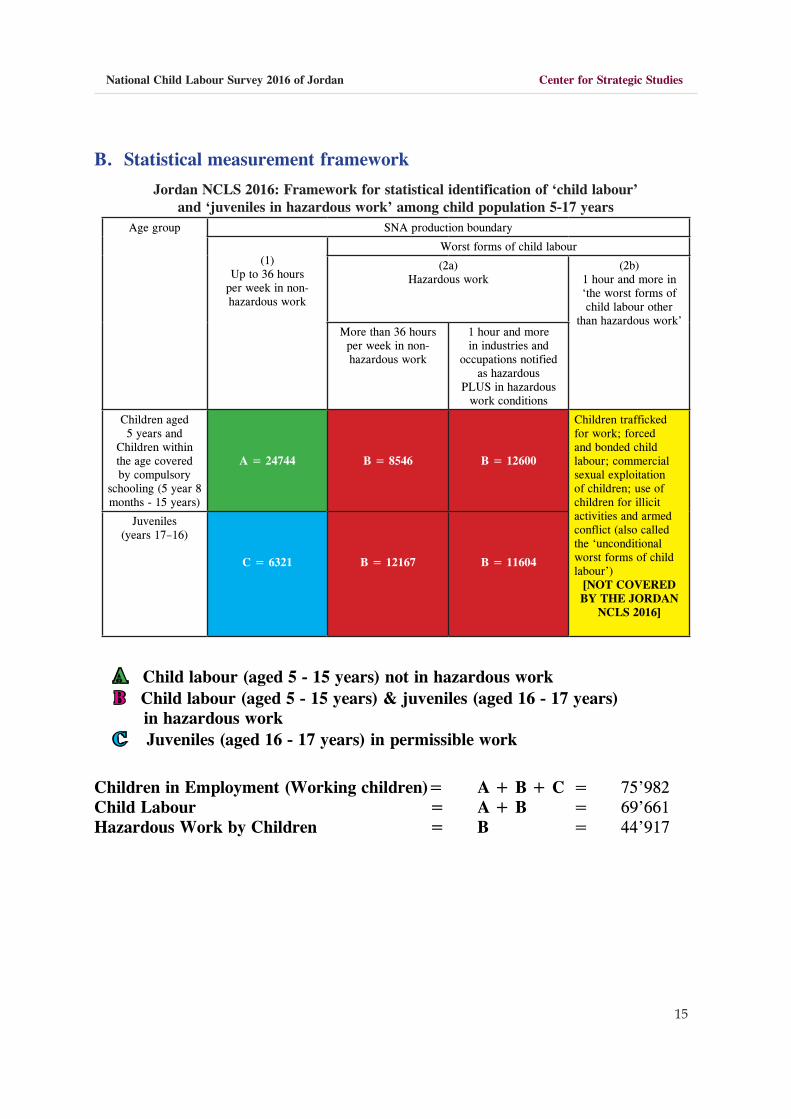
B. Statistical measurement framework
Jordan NCLS 2016: Framework for statistical identification of ‘child labour’and ‘juveniles in hazardous work’ among child population 5-17 years
SNA production boundaryAge group
Worst forms of child labour(1)
Up to 36 hoursper week in non-hazardous work
(2b)1 hour and more in ‘the worst forms of child labour other
than hazardous work’
(2a)Hazardous work
1 hour and more in industries and
occupations notified as hazardous
PLUS in hazardouswork conditions
More than 36 hours per week in non-hazardous work
Children trafficked for work; forced and bonded child labour; commercial sexual exploitation of children; use of children for illicit activities and armed conflict (also called the ‘unconditional worst forms of child labour’)
[NOT COVERED BY THE JORDAN
NCLS 2016]
B = 12600B = 8546A = 24744
Children aged 5 years and
Children within the age covered by compulsory
schooling (5 year 8 months - 15 years)
B = 11604B = 12167C = 6321
Juveniles(years 17–16)
A Child labour (aged 5 - 15 years) not in hazardous workB Child labour (aged 5 - 15 years) & juveniles (aged 16 - 17 years) in hazardous work C Juveniles (aged 16 - 17 years) in permissible work
Children in Employment (Working children)= A + B + C = 75’982Child Labour = A + B = 69’661Hazardous Work by Children = B = 44’917

16
National Child Labour Survey 2016 of Jordan Center for Strategic Studies
III. GENERAL POPULATION CHARACTERISTICS
According to the Jordan NCLS 2016, the total population of Jordan in 2016 was about 9.53 million (Table 2), with by and large evenly balanced shares of female and male populations of about 50.7 and 49.3 percent, respectively.1
The target population for the survey is the population in the age range from 5 to 17 years which is 4.03 million and constitutes about 42 percent of the country’s population. The survey determined that of the child population (5-17 years), 2.076 million are boys and 1.96 million are girls.
Table 2: Age-sex composition of Jordan Population (Survey estimate)
Age group / Nationality
Percentage distribution
Male Female TotalAge-groups:0 – 4 10.82 11.00 10.91
5 – 11 24.98 24.63 24.8112 – 14 9.47 9.03 9.2515 – 17 8.35 8.09 8.22
(5 – 17) 42.79 41.76 42.28
18 – 64 45.38 46.01 45.6965+ 1.01 1.23 1.12Total: Jordan 100 100 100
By gender distribution, the shares of boys and girls are 51.3 and 48.7 percent, respectively, which translates to a boys-to-girls ratio of 1.06 for Jordan as a whole (Table 3). A majority of the children fall in the age group of 5-11 years (58.7 percent), followed by 12-14 years group accounting for 21.9 percent. The lowest share is observed for those aged 15-17 years at 19.4 percent.
1- The survey estimates will not be same as the results of the Jordan Population Census 2016. The divergence of the survey estimate from
the Census result is due to the difference in population coverage: while the Census is conducted on all types of households, the Jordan
NCLS 2016 (like most household sample surveys), was restricted to only conventional households and institutional households were excluded.

17
National Child Labour Survey 2016 of Jordan Center for Strategic Studies
An overwhelming majority (almost 84 percent) of children reside in the urban areas.
Table 3: Child population 5-17 years by age-group, sex, residence and geographical domain
Number Percent distribution Boys-
Girls ratioBoys Girls Total Boys Girls Total
Total children (Jordan)
2’069’273 1’961’111 4’030’38451.34% 48.66% -
1.06100 100 100
Age group
5-11 years 1’207’746 1’156’850 2’364’596 58.40 59.00 58.70 1.04
12-14 years 457’844 424’171 882’015 22.10 21.60 21.90 1.08
15-17 years 403’683 380’090 783’773 19.50 19.40 19.40 1.06
Type of residence
Urban 1’736’843 1’643’228 3’380’071 83.90 83.80 83.90 1.057
Rural 332’430 317’883 650’313 16.10 16.20 16.10 1.046
Geographical domain
Amman 858’144 816’711 1’674’856 41.50 41.60 41.60 1.051
Balqa 107’255 97’933 205’188 5.20 5.00 5.10 1.095
Zarqa 307’383 286’723 594’107 14.90 14.60 14.70 1.072
Madaba 41’212 36’700 77’912 2.00 1.90 1.90 1.123
Irbid 380’653 367’110 747’763 18.40 18.70 18.60 1.037
Mafraq 94’248 90’727 184’975 4.60 .60 4.60 1.039
Jerash 51’844 50’183 102’028 2.50 2.60 2.50 1.033
Ajloun 40’073 33’602 73’675 1.90 1.70 1.80 1.193
Karak 66’281 67’770 134’051 3.20 3.50 3.30 0.978
Tafeileh 20’763 19’914 40’677 1.00 1.00 1.00 1.043
Ma’an 29’977 29’976 59’953 1.40 1.50 1.50 1.000
Aqaba 43’840 37’975 81’814 2.10 1.90 2.00 1.154
Zaatari refugee camp
27’600 25’786 53’386 1.30 1.304 1.30 1.070
No appreciable variation is observed in the distribution of children between the two sexes in all the age groups, and also among urban and rural areas.
Some variation in the gender (boy-to-girls) ratio is noted among the governorates and is highest for Ailoun (1.193) and lowest for Karak (0.978).

18
National Child Labour Survey 2016 of Jordan Center for Strategic Studies
IV. WORKING CHILDREN AND CHILD LABOUR
Out of approximately 4.03 million children aged 5 - 17 years, about 1.89 percent, that is, 0.076 thousand children (75,982) were engaged in economic activities. Of all chil-dren engaged in economic activities, 88.3 percent (67,114) were boys and only 11.7 percent (8,868) were girls (Table 4). Therefore, the ‘worker-population ratio’ (WPR) for boys was 3.24 against only 0.45 for girls (Table 5).
As may be expected, in respect of distribution of working children among age-groups, as is noted in Table 4, the highest number/percentage of children engaged in economic activities was for the age group of 15-17 years (43,556 or 57.3 percent), compared to the other age groups of 12-14 years (20,615 or 27.1 percent) and 5-11 years (11,810 or 15.5 percent).
Participation in economic activities was lower among children from urban areas (1.73 percent) than among children from rural areas (2.66 percent). The same pattern is ob-served for both boys and girls (Table 5).
By nationality, Table 6 illustrates that the highest WPR is noted for Syrian children at 3.22 percent, followed by other nationalities at 1.98 percent. Children who are Jorda-nians have the lowest WPR at 1.75 percent.
Table 4: Working children by sex, age-group, residence and nationality
CategoryResidence Age-group
Urban Rural 5 – 11 12 – 14 15 – 17 Total
Jordan 58702 17279 11810 20615 43556 75982
Percent distribution 77.26 22.74 15.54 27.13 57.32 100
Boys 52502 14612 9074 18017 40023 67114
Relative share (Boys) 89.4 84.6 76.8 87.4 91.9 88.3
Girls 6200 2667 2736 2598 3533 8868
Relative share (Girls) 10.56 15.43 23.17 12.6 8.11 11.67
Jordanian 45272 15516 9785 17049 33953 60787
Relative share Jordan 77.10% 89.80% 82.90% 82.70% 78.00% 80.00%
Syrian 9704 1394 1492 2815 6791 11098
Relative share Syrian 16.50% 8.10% 12.60% 13.70% 15.60% 14.60%
Other Nationality 3727 369 533 750 2813 4096
Relative share Others 6.30% 2.10% 4.50% 3.60% 6.50% 5.40%

19
National Child Labour Survey 2016 of Jordan Center for Strategic Studies
Considering distribution by governorates, the highest number of child workers are in Amman where the WPR is 1.65 percent, but is below the national average (1.89). The distribution of the working children by geographical domains points to a high order of regional variation in the WPR. As Table 5 illustrates, the highest WPR (4.22 percent) is for Karak, and is also higher than the national average (at 2.1 percent or more) in Mafraq, Jerash, Ajloun, Tafeileh, Ma’an, Aqaba, and Zaatari refugee camp. At the other extreme, Balqa has a WPR of just 0.95 percent. The table also indicates a clear divergence between the WPRs of boys and girls, with that of boys always much higher than that of girls. In fact, the WPR for boys is the highest in Jordan at 6.46 percent in Karak, followed by 5.83 percent in Ma’an and 5.12 percent in Jersah. The WPR for boys is also high in Tafelleh (4.85 percent) and Aqaba (4.81 percent).
Table 5: Number and percent of working children by sex and geographical domain
Working children Boys Girls
Geographical domain Number WPR* Number WPR* Number WPR*
Jordan - All 75982 1.89 67114 3.24 8868 0.45
Jordan - Urban 58702 1.73 52502 3.02 6200 0.38
Jordan - Rural 17279 2.66 14612 4.40 2667 0.84
Amman 27651 1.65 24674 2.88 2976 0.36
Balqa 1952 0.95 1892 1.76 59 0.06
Zarqa 9523 1.60 8840 2.88 683 0.24
Madaba 1432 1.84 988 2.40 444 1.21
Irbid 13899 1.86 12343 3.24 1555 0.42
Mafraq 4100 2.22 3873 4.11 227 0.25
Jerash 2943 2.88 2654 5.12 289 0.58
Ajloun 2201 2.99 1676 4.18 525 1.56
Karak 5661 4.22 4280 6.46 1380 2.04
Tafeileh 1140 2.80 1008 4.85 132 0.66
Ma’an 1941 3.24 1749 5.83 191 0.64
Aqaba 2422 2.96 2108 4.81 314 0.83
Zaatari refugee camp 1119 2.10 1028 3.72 91 0.35
*WPR = Worker-Population Ratio expressed as percentage

20
National Child Labour Survey 2016 of Jordan Center for Strategic Studies
Table 6: Key estimates of working children, child labour and hazardous child labour
Gender Nationality
Total Boys Girls Jordanian Syrian Other Nationality
Child Population (CP) 4’030’384 2’069’273 1’961’111 3’478’876 344’748 206’760
Working Children (WC) 75’982 67’114 8’868 60’787 11’098 4’096
Child Labour (CL) 69’661 62’212 7’449 55’492 10’509 3’659
Hazardous Child Labour 44’917 42’524 2’393 33’509 8’801 2’607
WC (percent of CP = WPR*) 1.89 3.24 0.45 1.75 3.22 1.98
Child labour (percent of CP) 1.73 3.01 0.38 1.60 3.05 1.77
Hazardous CL (percent of CP) 1.11 2.06 0.12 0.96 2.55 1.26
*WPR = Worker-Population Ratio expressed as percentage
In Jordan, its is estimated that most of the working children (91.7 percent) are in child labor. As is shown in Table 6, of the 75,982 working children, the vast majority at 69,661 are classified by the Jordan NCLS 2016 to be in child labour. The framework for the statistical measurement of child labour and hazardous work for Jordan has been provided earlier in this report in Chapter II Section B. Following, child labour in Jordan comprises child workers below the legal minimum age of employment (16 years), juveniles aged 16 and 17 years who work excess hours in work that they are permitted to be employed in (that is, more than 36 hours of work weekly), children who are engaged in hazardous work notified by the Official Gazette of 2011, and children for whom it has been responded in the survey questionnaire that they face one or more of the health and safety hazards at their workplace.
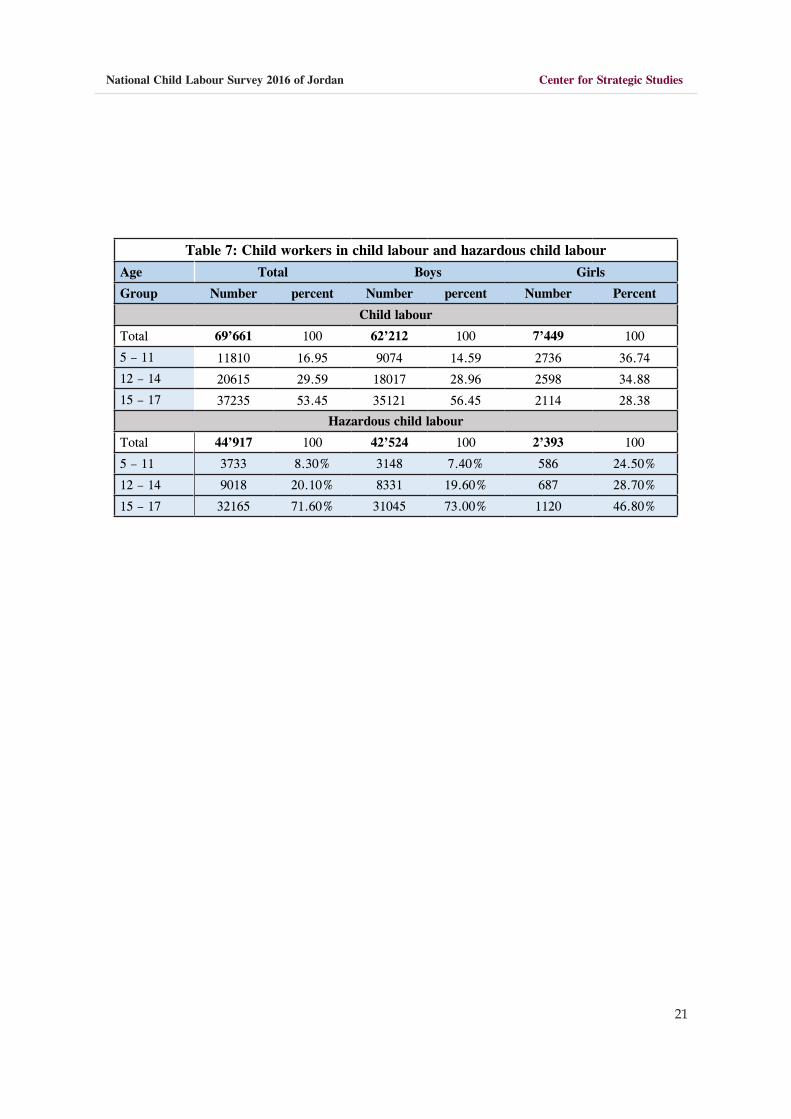
Table 7 provides the distribution of child labour and hazardous child labour by age-group and by gender. For child labour, across age-groups, it is seen that 53 percent are in the highest age-group of 15-17 years, while 30 percent are aged 12-14 years and 17 percent are of age 5-11 years.
In regard to hazardous child labour, most (over 71 percent) are aged 15-17 years, while 20 percent are in the age-group 12-14 years. For the youngest child workers 5-11 years, they form 8 percent.
21
National Child Labour Survey 2016 of Jordan Center for Strategic Studies
Table 7: Child workers in child labour and hazardous child labour Age Total Boys Girls
Group Number percent Number percent Number Percent
Child labour
Total 69’661 100 62’212 100 7’449 100
5 – 11 11810 16.95 9074 14.59 2736 36.74
12 – 14 20615 29.59 18017 28.96 2598 34.88
15 – 17 37235 53.45 35121 56.45 2114 28.38
Hazardous child labour
Total 44’917 100 42’524 100 2’393 100
5 – 11 3733 8.30% 3148 7.40% 586 24.50%
12 – 14 9018 20.10% 8331 19.60% 687 28.70%
15 – 17 32165 71.60% 31045 73.00% 1120 46.80%

22
National Child Labour Survey 2016 of Jordan Center for Strategic Studies
V. OTHER ACTIVITIES BY CHILDREN
A. School attendance
In Jordan, over 92 percent of children aged 5-17 years are attending schools. Age-wise disaggregation reveals that close to 95 percent of children in the age groups 5-11 years and 12-14 years go to schools.
Table 8: Percent of child population 5-17 years attending school by sex, age-group
and geographical domain
Percent of children currently attending school
Total childrenGender Nationality
Boys Girls Jordanian Syrian Other Nationality
Jordan (number) 4’030’384 2’069’273 1’961’111 3’478’876 344’779 206’729
In school 3’734’028 1’900’708 1’833’321 3’296’808 250’067 187’154
Jordan 92.60% 91.90% 93.50% 94.80% 72.50% 90.50%
Residence type
Urban 92.50% 91.70% 93.30% 94.70% 72.90% 91.00%
Rural 93.50% 92.50% 94.50% 94.90% 68.20% 84.00%
Age group (years)
5 – 11 94.70% 94.40% 95.00% 96.50% 80.40% 92.70%
12 – 14 94.90% 94.80% 95.00% 96.90% 71.10% 94.60%
15-17 83.90% 80.80% 87.20% 87.50% 39.80% 78.10%
of which: 15 years 88.92% 87.46% 90.52% 92.71% 46.98% 85.66%
16-17 years 80.88% 76.70% 85.26% 84.42% 34.56% 73.41%
Geographical domain
Amman 92.60% 91.90% 93.30% 94.20% 74.90% 90.40%
Balqa 93.70% 92.50% 95.00% 95.30% 64.10% 90.40%
Zarqa 92.50% 91.80% 93.20% 94.10% 68.40% 89.20%
Madaba 94.90% 93.30% 96.70% 95.90% 69.60% 96.80%
Irbid 93.50% 93.00% 94.10% 95.60% 74.50% 96.50%
Mafraq 90.00% 88.90% 91.10% 93.90% 68.60% 92.60%
Jerash 94.80% 94.60% 95.10% 97.20% 76.80% 88.90%
Ajloun 94.80% 94.70% 95.00% 96.80% 74.40% 100.00%
Karak 96.00% 95.10% 96.90% 97.10% 74.80% 89.40%
Tafeileh 95.00% 94.40% 95.50% 95.40% 86.00% 59.20%
Ma’an 89.00% 87.00% 90.90% 92.10% 66.00% 91.80%

23
National Child Labour Survey 2016 of Jordan Center for Strategic Studies
Aqaba 93.40% 90.80% 96.50% 94.80% 47.80% 92.70%
Zaatari refugee camp 71.30% 66.60% 76.40% 0.00% 71.30% 0.00%
The percentage of school attending children is visibly lower at 84 percent in the highest age group of 15-17 years. The main reason for the dip in school attendance is that the age-group includes juveniles aged 16 and 17 years who are legally permitted to work up to 36 hours per week, and clearly a significant proportion of such children discontinue their studies at this stage to join the labour market as workers at an early age. It is noted in Table 8 that the school attendance rate which is almost 89 percent for children who are 15 years, falls to below 81 percent for those aged 16-17 years.
School attendance of rural children is marginally higher than for urban children, and that of girls is slightly higher than of boys.
The Jordan NCLS 2016 covered the Syrian refugee camps, and it is observed by nationality basis, while, on average, close to 95 percent of Jordanian children aged 5-17 years where in school, the corresponding school attendance rate was 90.5 percent for other nationalities and only 72.5 percent for all Syrians (including Syrian households inside the refugee camps and those households living normally outside with the general population).
Among geographical domains, all governorates had school attendance rates of 90 percent or more, and the lowest is for Ma’an at 89 percent. The overall school attendance rate for children in the Zaatari refugee camp was 71.3 percent, with that for boys at 66.6 percent and 76.4 percent for girls.
Table 9: Percent distribution of reason for not attending school … contd.
Domain
Percent distribution of reason for not attending school by children
Too young for school
Disability/ illness
No school/ School too
far/ No teachers
Cannot afford school
Family did not allow schooling
School is not safe
All Jordan 40.30% 17.30% 3.80% 23.90% 2.80% 0.90%
Sex
Boys 40.30% 18.60% 2.60% 23.40% 2.70% 1.20%
Girls 40.30% 15.90% 5.30% 24.60% 2.90% 0.50%
Age-group (years)
5-11 47.40% 11.50% 3.70% 26.00% 1.90% 0.60%
12-14 0.00% 50.20% 4.40% 11.20% 7.80% 2.60%
15-17 0.00% 50.10% 5.00% 13.00% 8.30% 2.50%
Nationality
Jordanian 44.20% 23.30% 2.70% 18.00% 3.10% 0.50%
Syrian 34.20% 7.00% 6.30% 34.20% 2.70% 2.00%

24
National Child Labour Survey 2016 of Jordan Center for Strategic Studies
Other nationality 33.80% 13.30% 1.60% 28.80% 0.80% 0.00%
Table 9: Percent distribution of reason for not attending school … contd.
Domain
Percent of children not attending school by reason
Not interested in school/ education is not important
Because of Immigra-tion
Help with household chores & Family Business
No official documents
Other including ‘No available seat at school’
Total
All Jordan 6.50% 1.60% 0.10% 0.80% 2.00% 100%
Sex
Boys 7.10% 1.20% 0.20% 0.90% 1.80% 100%
Girls 5.80% 2.10% 0.10% 0.60% 2.10% 100%
Age-group (years)
5-11 4.60% 1.80% 0.10% 0.90% 1.60% 100%
12-14 17.40% 1.00% 0.80% 0.00% 4.70% 100%
15-17 17.90% 0.00% 0.00% 0.00% 3.30% 100%
Nationality
Jordanian 6.40% 0.00% 0.20% 0.00% 1.80% 100%
Syrian 5.40% 4.90% 0.10% 1.20% 2.10% 100%
Other nationality 13.00% 0.00% 0.00% 5.80% 3.00% 100%
The survey enquired into the reasons why some of the children in the target age range of 5 -17 years did not attend school. A variety of pre-coded response options were provided, and for the country as a whole the main reasons were being too young for school (40 percent), family could not afford schooling (23 percent) and due to disability/ illness (17 percent). About 6.5 percent considered that schooling/ education is not so important. This same pattern is more or less observed for both boys and girls.
By nationality, is is noted that for Syrians and other nationalities (excluding Jordanians), not being able to afford schooling becomes a more important reason for not attending school, than is for Jordanians.

25
National Child Labour Survey 2016 of Jordan Center for Strategic Studies
B. Household chores
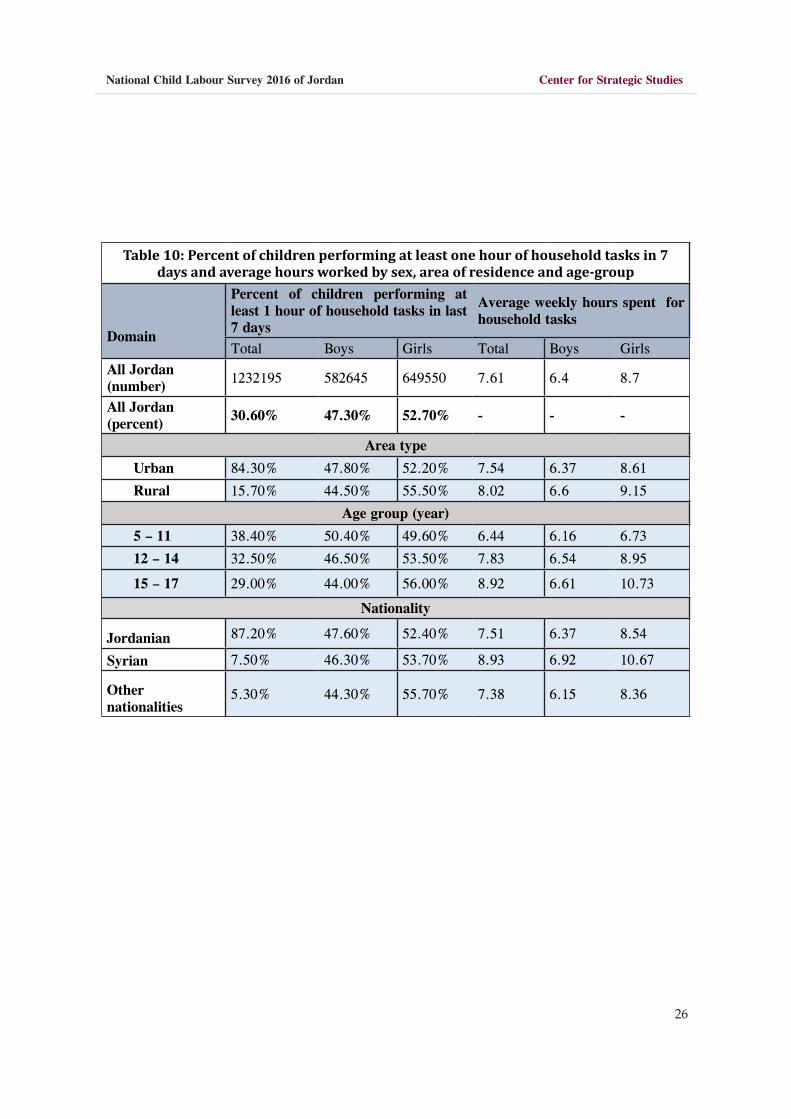
In the study of child labour, engagement in household chores by children is important since the time spent in it may sometimes adversely affect school attendance, especially for girls. The major household chores children have to attend to are shopping for household, cooking, cleaning, washing clothes, caring for children and old/sick family members. In Jordan, except shopping for the household which involves stepping outside the house and is mostly assigned to boys, the remaining major household chores are mainly in the domain of girls. The estimates of children (separately classified as working and non-working) in household chores is provided by sex and by age-groups to bring out the differences based on these 3 criteria. The highest share of the child population in household chores is of children 15-17 years for both working and non-working segments.
Over 30 percent of the children spent at least one hour in the past 7 days in household chores. The average weekly hours engaged in household chores for all Jordan is 7.16 hours, but for girls is 8.7 hours against 6.4 for boys. Participation by rural children of both sexes is slightly higher than for urban children in terms of average hours spent weekly on household chores. The highest number of weekly hours spent in household chores at 10.73 hours is by girls in the age-group 15-17 years.
By nationality, the pattern of girls spending more hours weekly in performing household chores is confirmed, and is highest for Syrian girls who devote on average 10.67 hours every week in such tasks.
26
National Child Labour Survey 2016 of Jordan Center for Strategic Studies
Table 10: Percent of children performing at least one hour of household tasks in 7 days and average hours worked by sex, area of residence and age-group
Domain
Percent of children performing at least 1 hour of household tasks in last 7 days
Average weekly hours spent for household tasks
Total Boys Girls Total Boys GirlsAll Jordan (number) 1232195 582645 649550 7.61 6.4 8.7
All Jordan (percent) 30.60% 47.30% 52.70% - - -
Area type
Urban 84.30% 47.80% 52.20% 7.54 6.37 8.61
Rural 15.70% 44.50% 55.50% 8.02 6.6 9.15
Age group (year)
5 – 11 38.40% 50.40% 49.60% 6.44 6.16 6.73
12 – 14 32.50% 46.50% 53.50% 7.83 6.54 8.95
15 – 17 29.00% 44.00% 56.00% 8.92 6.61 10.73
Nationality
Jordanian 87.20% 47.60% 52.40% 7.51 6.37 8.54
Syrian 7.50% 46.30% 53.70% 8.93 6.92 10.67
Other nationalities
5.30% 44.30% 55.70% 7.38 6.15 8.36

27
National Child Labour Survey 2016 of Jordan Center for Strategic Studies
Table 11: Percent of children (working and non-working) in household chores
Domain
Percentage of children performing household chores in past 7 days by type of chores
Cooking shopping
forhousehold
cleaning utensils/
house
washingclothes
minor house-hold
repairs
caring forchildren /old, sick
other household
tasks
All Children
All-Jordan 5.00% 16.60% 19.10% 7.40% 2.50% 11.30% 0.10%
Boys 0.70% 25.80% 8.90% 0.90% 4.30% 6.50% 0.10%
Girls 9.50% 6.90% 29.80% 14.40% 0.70% 16.30% 0.10%
Age group
5-11 1.10% 12.80% 11.30% 2.30% 0.80% 7.00% 0.10%
12-14 8.00% 22.90% 29.60% 12.80% 4.20% 17.60% 0.10%
15-17 13.40% 21.10% 30.80% 17.00% 6.00% 16.90% 0.10%
Working Children
All-Jordan 4.60% 36.30% 15.20% 4.70% 9.90% 9.80% 0.20%
Boys 1.20% 39.30% 9.40% 0.50% 10.90% 7.00% 0.20%
Girls 30.40% 13.40% 59.00% 36.00% 2.10% 31.30% 0.00%
Age group
5-11 4.20% 36.90% 18.60% 3.60% 2.20% 15.80% 0.00%
12-14 5.10% 41.50% 21.90% 6.50% 13.60% 13.90% 0.00%
15-17 4.50% 33.60% 11.10% 4.10% 10.20% 6.20% 0.30%
Non-Working Children
All-Jordan 5.00% 16.20% 19.20% 7.50% 2.40% 11.30% 0.10%
Boys 0.70% 25.30% 8.90% 0.90% 4.10% 6.40% 0.10%
Girls 9.40% 6.90% 29.70% 14.30% 0.70% 16.20% 0.10%
Age group
5-11 1.00% 12.70% 11.20% 2.30% 0.70% 7.00% 0.10%
12-14 8.10% 22.40% 29.80% 12.90% 3.90% 17.70% 0.10%
15-17 14.00% 20.30% 31.90% 17.80% 5.70% 17.50% 0.10%

28
National Child Labour Survey 2016 of Jordan Center for Strategic Studies
C. Children grouped by activities
The combination of activities the children are engaged in is also of interest, and for the purpose the child population 5-17 years may be disaggregated into 8 non-overlapping activity groups that involve engagement in economic activity, household chores, and education. In the chart that follows the survey findings on the combination of the two main activities by children, namely, work and education is presented.
Table 12: Percent distribution of children by combination of activities
Activity combination
Percent distribution by activitiesNumber
of children 5-17 years
Nationality
5 – 11 12 – 14 15 – 17 (5 – 17) Jordanian Syrian Other Nationality
Jordan 100 100 100 100 4’030’384 100 100 100
Working only 0.03% 0.35% 2.65% 0.61% 24’578 0.50% 1.64% 0.72%
Attending school only 74.85% 51.10% 44.63% 63.78% 2’570’452 64.88% 53.82% 61.77%
Involved in household chores only 0.39% 2.09% 5.83% 1.82% 73’406 1.22% 7.38% 2.62%
Working and studying 0.23% 0.71% 0.69% 0.42% 17’037 0.45% 0.24% 0.29%
Working and involved in household chores 0.01% 0.27% 1.24% 0.30% 12’250 0.23% 1.00% 0.47%
Attending school and involved in household
chores19.39% 42.09% 37.59% 27.90% 1’124’422 28.86% 18.13% 27.97%
Working, attending school and involved in
household chores0.24% 1.02% 0.97% 0.55% 22’117 0.57% 0.34% 0.49%
Neither activity 4.87% 2.38% 6.38% 4.62% 186’122 3.29% 17.45% 5.65%
It is noted that children in the youngest age-group 5-11 years reflect the highest share of almost three-fourths of its child population who are attending school only. Another 20 percent is attending school and involved in household chores, while the remaining 5 percent is doing no major activity (are perhaps those who are too young to go to school). The share of the child population attending school only decreases with a movement to the higher age-groups, and is largely compensated by increased involvement in household chores. In fact, for the age-group 15-17 years, almost 6 percent of children of this age are engaged only in household chores and are mainly girls.
The other notable features revealed in Table 12 are that (as may be expected) about 2.65 percent of children aged 15-17 years are working only, and that 17.45 percent of the Syrian population is not engaged in any activity.
Further analysis indicated that of all (Jordanian, Syrian and other nationalities) such

29
National Child Labour Survey 2016 of Jordan Center for Strategic Studies
‘inactive’ children taken together about 62 percent were in the age-group 5-11 years and therefore a large number of them might be too young to enter school, while about 27 percent were in the age-group 15-17 years and perhaps in the search (or in wait) for a job.

30
National Child Labour Survey 2016 of Jordan Center for Strategic Studies
IV. CHARACTERISTICS OF WORKING CHILDREN
A. Industrial sector
The major industrial sectors of employment for working children in Jordan are agriculture, forestry and fishing (27 percent), followed by wholesale and retail trade, etc. (29 percent), and household business activities or home-based production (8 percent). Also important were manufacturing and construction (each sector accounting for about 11 percent).
By age-group, the importance of agriculture, forestry and fishing declines from 55 percent for the youngest 5-11 years to 36 percent for those who are 12-14 years and still lower to 15 percent for the 15-17 years age-group. A similar declining share in employment is observed for household business activities or home-based production, while an increasing share with the movement to higher age-groups is recorded for wholesale and retail trade, manufacturing and construction sectors.
By nationality, the pattern of employment sectors is different for Jordanian children, as compared Syrian children and of other nationalities. For the latter groups, the most important source of work is wholesale and retail trade, and construction, followed by manufacturing. Agriculture and allied sector is of relatively less importance.
Table 13: Working children by major industry and age-group
Major Industry sector 5 – 11 12 – 14 15 – 17Total
(5 – 17)
Nationality
Jordanian Syrian Other Nationality
All working children 100 100 100 100 100 100 100
Agriculture, forestry and fishing 55.70% 36.70% 15.50% 27.50% 31.90% 10.50% 7.90%
Mining and quarrying 0.00% 0.00% 0.40% 0.20% 0.10% 0.80% 0.00%
Manufacturing 1.90% 8.60% 15.10% 11.30% 10.60% 14.40% 12.80%
Electricity, gas, & water supply 0.00% 0.00% 0.10% 0.10% 0.10% 0.00% 0.00%
Construction 7.00% 8.80% 14.20% 11.60% 8.70% 21.00% 28.80%
Wholesale & retail trade; repair of motor vehicles etc. 20.30% 28.60% 32.30% 29.40% 27.90% 35.10% 36.80%
Accommodation and food service activities 0.60% 2.70% 6.00% 4.30% 3.60% 7.20% 5.80%
Transportation and Storage 0.00% 0.80% 1.00% 0.80% 0.70% 0.30% 3.10%
Administrative and support service activities 0.00% 0.00% 1.10% 0.60% 0.70% 0.60% 0.00%
Household activities as an entrepreneur, household activities to produce goods and services for its own use
13.90% 11.20% 5.20% 8.20% 9.00% 5.20% 3.80%

31
National Child Labour Survey 2016 of Jordan Center for Strategic Studies
Other services 0.60% 2.60% 9.20% 6.10% 6.70% 4.90% 1.00%
Number of working children 11’810 20’615 43’556 75’982 60’787 11’098 4’096
B. Occupational group
The preferred occupations are elementary occupations (33 percent), craft and related trades (28 percent) and service and sales work (28 percent). By age-group, elementary occupations are most important (62 percent) for the youngest age-group of 5-11 years, and its share decreases gradually for the higher age-groups. In contrast, the importance of craft and related trades, and of service and sales work rises for the higher age-groups (Table 14).
These three occupation groups are also the most important for all 3 nationality groups, although their relative importance varies within each group.
Table 14: Working children by major occupation and age group
Major Occupation Group
Age groups Total
(5 – 17)
Nationality
5 – 11 12 – 14 15 – 17 Jordanian Syrian Other Nationality
All working children 100 100 100 100 100 100 100
Service and sales 18.00% 26.60% 32.50% 28.60% 27.20% 35.00% 33.10%
Skilled agricultural, forestry and fishery 8.90% 8.90% 4.90% 6.60% 7.50% 4.50% 0.00%
Craft and related trades 9.90% 19.30% 37.50% 28.30% 25.30% 37.30% 48.20%
Plant and machine operators & assemblers 0.60% 2.70% 2.50% 2.30% 2.20% 3.10% 1.60%
Elementary occupations 62.60% 42.40% 21.40% 33.50% 37.00% 20.20% 17.20%
Others 0.00% 0.00% 1.20% 0.70% 0.80% 0.00% 0.00%
Number of working children 11’810 20’615 43’556 75’982 60’787 11’098 4’096
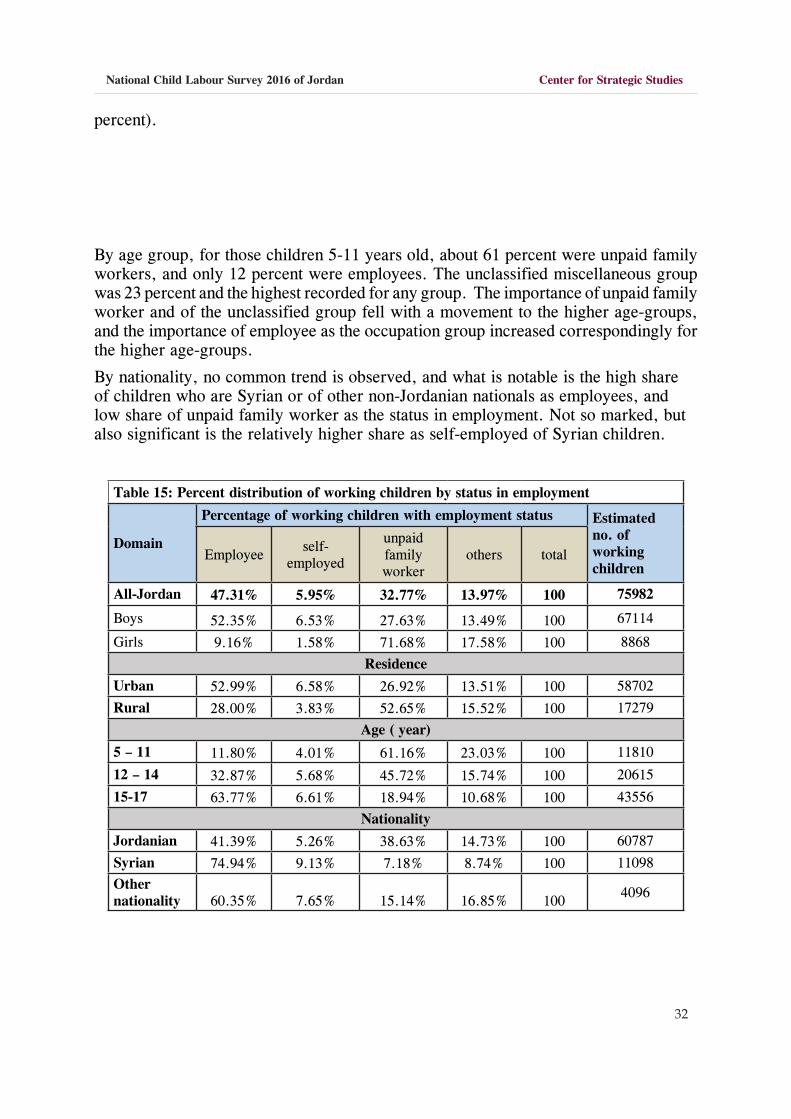
C. Status in employmentStatus of employment represents the type of contract which a person has with other persons or organizations when performing a particular job and is indicated in Table 15. (Among the working children, employers are very rare).
The survey found that almost one-half (47 percent) of working children in Jordan are engaged as employees, and almost one-third (32 percent) are unpaid family workers. About 6 percent was self-employed. The distributional pattern varies significantly between boys and girls. While for boys the general pattern prevailed (to an extent obvious since most child workers are male), for girls the largest share was of unpaid family workers (71 percent of all female child workers), and as employee was only 9
32
National Child Labour Survey 2016 of Jordan Center for Strategic Studies
percent).
By age group, for those children 5-11 years old, about 61 percent were unpaid family workers, and only 12 percent were employees. The unclassified miscellaneous group was 23 percent and the highest recorded for any group. The importance of unpaid family worker and of the unclassified group fell with a movement to the higher age-groups, and the importance of employee as the occupation group increased correspondingly for the higher age-groups.
By nationality, no common trend is observed, and what is notable is the high share of children who are Syrian or of other non-Jordanian nationals as employees, and low share of unpaid family worker as the status in employment. Not so marked, but also significant is the relatively higher share as self-employed of Syrian children.
Table 15: Percent distribution of working children by status in employment
Domain
Percentage of working children with employment status Estimated no. of working children
Employee self-employed
unpaid family worker
others total
All-Jordan 47.31% 5.95% 32.77% 13.97% 100 75982
Boys 52.35% 6.53% 27.63% 13.49% 100 67114
Girls 9.16% 1.58% 71.68% 17.58% 100 8868
Residence
Urban 52.99% 6.58% 26.92% 13.51% 100 58702
Rural 28.00% 3.83% 52.65% 15.52% 100 17279
Age ( year)
5 – 11 11.80% 4.01% 61.16% 23.03% 100 11810
12 – 14 32.87% 5.68% 45.72% 15.74% 100 20615
15-17 63.77% 6.61% 18.94% 10.68% 100 43556
Nationality
Jordanian 41.39% 5.26% 38.63% 14.73% 100 60787
Syrian 74.94% 9.13% 7.18% 8.74% 100 11098
Other nationality 60.35% 7.65% 15.14% 16.85% 100 4096

33
National Child Labour Survey 2016 of Jordan Center for Strategic Studies
D. Weekly hours of work
Table 16: Distribution of working children by weekly hours of work
Domain/ Group
Percentage of working children with weekly working hours
Estimated working childrenless than 36 36 – 48 48+ total
Jordan 54.80% 12.30% 32.90% 100 75’982
GenderBoys 50.10% 13.40% 36.50% 100 67’114
Girls 89.90% 4.10% 5.90% 100 8’868Residence type
Urban 50.10% 13.50% 36.40% 100 58’702
Rural 70.80% 8.20% 21.00% 100 17’279Age groups
5 – 11 88.70% 5.20% 6.10% 100 11’810
12 – 14 72.30% 8.60% 19.00% 100 20’615
15-17 37.20% 16.00% 46.70% 100 43’556Nationality
Jordanian 59.80% 12.30% 27.90% 100 60’787
Syrian 30.40% 11.30% 58.30% 100 11’098
Other Nationality 46.60% 15.30% 38.10% 100 4’096
Children put in over 33 hours of work on average per week, with that for boys (37 hours) more than twice as high for girls (16 hours). The survey estimated also that weekly working hours are highest for boys aged 15-17 years (46 hours), and the lowest for girls aged 5-11 years at 11.36 hours.

34
National Child Labour Survey 2016 of Jordan Center for Strategic Studies
Table 17: Average weekly hours of work per working child by sex, area of residence and age-group
Domain / Age-groupAverage number of working hours per week
Total children Boys GirlsJordan 34.55 37.00 15.93
Area typeUrban 36.65 39.16 15.38Rural 27.4 29.26 17.21
Age-group (years)5 – 11 15.45 16.69 11.3612 – 14 25.67 27.54 12.7315-17 43.92 45.87 21.83Working children 75’982 67’114 8’868

35
National Child Labour Survey 2016 of Jordan Center for Strategic Studies
E. Earnings of working children
Table 18: Earnings of children in paid employment
Domain Received in cash monthly (Jordan Dinars)
All-Jordan 170.79
Boys 170.32
Girls 190.18
Residence
Urban 167.43
Rural 190.28
Age-group
5 – 11 181.96
12 – 14 164.51
15-17 171.83
Nationality
Jordanian 174.14
Syrian 158.55
Other nationality 178.12
The Jordan NCLS 2016 estimated that, on average, a child worker in paid employment received a monthly cash payment of 170 (one hundred seventy) Jordanian Dinars. As Table 18 indicates, the highest, on average, payment was to rural children and to girls, each at 190 Jordanian Dinars. What is noted is that the lowest monthly payment of less than 160 Jordanian Dinars was received by the group of Syrian child workers.

36
National Child Labour Survey 2016 of Jordan Center for Strategic Studies
VII. ADDITIONAL CHILD LABOUR CONCERNS
A. Health and safety at work
According to the definition of hazardous child labour, children working in designated industries, occupations and long hours of work are considered performing hazardous work. In addition, certain working conditions are also included in hazardous work as they have an important impact on the health and safety of working children. Hazardous working conditions can be caused by unhealthy work environment, unsafe equipment or heavy loads and dangerous work location. Data on these particular conditions are analyzed the report (Table 19)
Table 19 : Percent of working children by selected kinds of hazards exposed to at work
Domain
Percent of working children exposed to hazards at work
dust, fumes fire, gas, flames
loud noise or vibration
extreme cold or
heat
dangerous tools
(knives etc.)
chemicals (pesticides, glues, etc.)
other things (lifting
weights etc.)
All Jordan 18.30% 6.70% 10.90% 10.50% 8.50% 2.60% 1.00%
Sex
Boys 19.20% 7.40% 12.20% 11.00% 9.50% 2.70% 1.10%
Girls 11.40% 0.70% 1.40% 6.20% 1.30% 1.70% 0.40%
Area type
Urban 17.00% 7.40% 12.00% 10.10% 10.10% 3.10% 1.20%
Rural 22.60% 4.20% 7.10% 11.90% 3.20% 0.90% 0.20%
Age-group (years)
5 – 11 19.20% 1.70% 5.80% 6.00% 3.30% 0.60% 0.00%
12 – 14 14.20% 5.40% 8.10% 8.10% 6.20% 1.80% 0.70%
15-17 19.90% 8.60% 13.70% 12.80% 11.00% 3.50% 1.40%

37
National Child Labour Survey 2016 of Jordan Center for Strategic Studies
The main forms of hazards faced by children in Jordan due to work place conditions are: dust fumes to which 18 percent of working children are exposed to; loud noise and vibrations faced by about 11 percent; extreme cold or heat faced by 10.5 percent; and dangerous tools faced by 8.5 percent.
Boys, perhaps owing to greater ability of risk taking in the households, are more exposed to most of the selected hazards. In the rural areas, children are more susceptible to being exposed to hazards from dust and fumes, and extreme cold or heat. In the urban areas, more dangers are posed by fire and gas, loud noise, and exposure to dangerous tools. In the age group 15-17 years, large proportions of the working children are exposed to threats from dust and fumes, loud noise and vibrations, extreme heat or cold, and dangerous tools.
This information was also collected, with reference period of the past 1 year, on the exposure of children to physical and psychological abuse at their place of work. The data reveals that about 12 percent of the working children in Jordan had faced constant shouting, while 5 percent were repeatedly insulted at their work places. There are no major variations across the two sexes or area of residence (Table 20).
Table 20: Percent of working children by type of abuse at workplace
Percent of working children abused
Domain constantly shouted at
repeatedly insulted
beaten/ physically hurt
touched or done the child dislike things
All-Jordan 12 5.2 1.8 0.2Sex
Boys 12.20% 5.60% 2.00% 0.10%
Girls 10.20% 2.10% 0.00% 0.70%
Area typeUrban 11.80% 5.60% 2.10% 0.10%Rural 12.50% 3.70% 0.70% 0.40%

38
National Child Labour Survey 2016 of Jordan Center for Strategic Studies
The percentage of working children sustaining injuries at work places during one year is insignificantly small (Table 21).
Table 21: Children sustaining injury at the workplace during past one year
Indicator Estimate
Average no. of injuries per 100 working children 0.18
Average no. of man-days lost due to injury 0.43
B. Place of work
The majority (50 percent) of working children are working indoors, while almost 25 percent are working at home. In farms only 11.6 percent are working. There are some variations by gender, and for girls, about 69 percent work at home and another 23 percent work in farms. Some differences are noted also among age-groups, and the place of work reflects the type of they do. Otherwise, there is not much difference from the general overall pattern in distribution of the child workers between the boys and girls, or between age-groups when it comes to distribution by work place.
The highest share of working indoors at 60 percent and more is found for the age-group 15-17 years, as also for children who are Syrian and other non-Jordanian nationals. It is significant that construction sites as workplace is highest at about 12 percent for children who are Syrian and other non-Jordanian nationals.

39
National Child Labour Survey 2016 of Jordan Center for Strategic Studies
Table 22: Percentage distribution of working children by their place of work
Domain
Percentage of Children Working
Indoors On the street At home farming land
Construction Site
Total
All Jordan 49.6% 9.4% 24.7% 11.6% 4.8% 100
Sex
Boys 55.50% 10.20% 18.90% 10.00% 5.40% 100
Girls 4.40% 3.20% 68.70% 23.70% 0.00% 100
Area type
Urban 54.70% 10.20% 20.30% 9.20% 5.60% 100
Rural 31.90% 6.80% 39.80% 19.70% 1.80% 100
Age-group (year)
5 – 11 17.20% 11.10% 47.10% 22.70% 1.90% 100
12 – 14 38.00% 12.20% 31.90% 14.60% 3.30% 100
15-17 63.80% 7.60% 15.30% 7.20% 6.20% 100
Nationality
Jordanian 46.70% 8.50% 29.30% 12.60% 2.90% 100
Syrian 59.30% 14.60% 4.80% 9.20% 12.10% 100
Other Nationality 66.10% 8.40% 10.10% 3.50% 11.80% 100

40
National Child Labour Survey 2016 of Jordan Center for Strategic Studies
C. Other child work issues
i. Children at more than one job
Table 23: Number of child workers doing more than 1 job in past week
Domain Total Boys Girls
All Jordan (number) 1607 1204 403
All Jordan (percent) 2.11 1.79 4.54Area type
Urban 1257 854 403
Rural 350 350 0
Age group (year)
5 – 11 242 137 105
12 – 14 632 521 11115 – 17 733 546 187
Nationality
Jordanian 1341 968 373
Syrian 225 195 30
Other nationalities 41 41 0
The survey found that 1,607 child workers (2.11 percent) in Jordan were doing more than 1 job, and the relative share among girls was higher than for boys. Multiple jobs is mostly an urban phenomenon, and for child workers in the higher age-groups.
41
National Child Labour Survey 2016 of Jordan Center for Strategic Studies
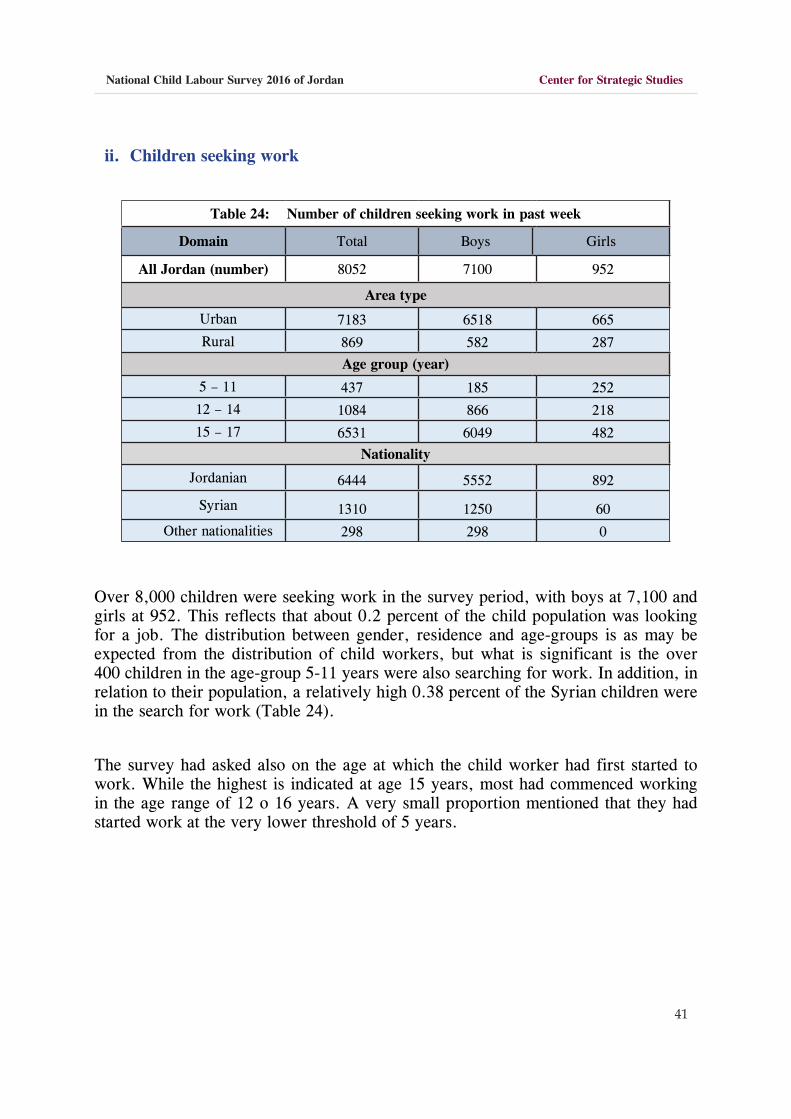
ii. Children seeking work
Table 24: Number of children seeking work in past week
Domain Total Boys Girls
All Jordan (number) 8052 7100 952
Area type
Urban 7183 6518 665
Rural 869 582 287
Age group (year)
5 – 11 437 185 252
12 – 14 1084 866 218
15 – 17 6531 6049 482
Nationality
Jordanian 6444 5552 892
Syrian 1310 1250 60
Other nationalities 298 298 0
Over 8,000 children were seeking work in the survey period, with boys at 7,100 and girls at 952. This reflects that about 0.2 percent of the child population was looking for a job. The distribution between gender, residence and age-groups is as may be expected from the distribution of child workers, but what is significant is the over 400 children in the age-group 5-11 years were also searching for work. In addition, in relation to their population, a relatively high 0.38 percent of the Syrian children were in the search for work (Table 24).
The survey had asked also on the age at which the child worker had first started to work. While the highest is indicated at age 15 years, most had commenced working in the age range of 12 o 16 years. A very small proportion mentioned that they had started work at the very lower threshold of 5 years.

42
National Child Labour Survey 2016 of Jordan Center for Strategic Studies
iii. Age when children start to work
Table 25: Age when child worker started to work
Age (years)Gender
Total
Nationality
Male Female Jordanian Syrian Other Nationality
5 0.80% 0.80% 0.80% 0.90% 0.70% 0.00%
6 3.60% 5.40% 3.80% 4.10% 0.80% 7.10%
7 1.50% 7.70% 2.20% 2.50% 1.30% 0.00%
8 3.10% 7.30% 3.60% 4.00% 2.70% 1.00%
9 3.20% 5.10% 3.50% 3.10% 4.90% 4.40%
10 8.20% 17.50% 9.30% 9.60% 8.30% 7.10%
11 7.20% 8.90% 7.40% 7.60% 7.00% 5.80%
12 11.10% 19.70% 12.10% 13.40% 7.70% 4.80%
13 12.10% 5.20% 11.20% 9.90% 18.00% 11.40%
14 12.60% 6.20% 11.80% 10.30% 20.20% 12.30%
15 17.90% 7.90% 16.80% 16.00% 18.40% 24.10%
16 10.80% 7.40% 10.40% 10.50% 7.60% 16.90%
17 7.90% 0.90% 7.10% 8.10% 2.40% 5.10%
Total 100 100 100 100 100 100
Number 67114 8868 75982 60787 11098 4096

43
National Child Labour Survey 2016 of Jordan Center for Strategic Studies

44
National Child Labour Survey 2016 of Jordan Center for Strategic Studies