summary report for dissolved oxygen monitoring in the ... · summary report for dissolved oxygen...
TRANSCRIPT

Summary Report for Dissolved Oxygen Monitoring in the Jordan River, Salt Lake County, Utah
Prepared for
Utah Department of Environmental Quality, Division of Water Quality
Prepared by
SWCA Environmental Consultants
April 2016


SUMMARY REPORT FOR DISSOLVED OXYGEN MONITORING IN THE JORDAN RIVER,
SALT LAKE COUNTY, UTAH
Prepared for
Utah Department of Environmental Quality, Division of Water Quality 195 North 1950 West, Third Floor
Salt Lake City, Utah 84114
Prepared by
SWCA Environmental Consultants 257 East 200 South, Suite 200
Salt Lake City, Utah 84111 Telephone: (801) 322-4307
Fax: (801) 322-4308 www.swca.com
April 1, 2016

Summary Report for Dissolved Oxygen Monitoring in the Jordan River, Salt Lake County, Utah
i
CONTENTS
1. Introduction ......................................................................................................................................... 1
1.1. Sampling and Analysis Plan ........................................................................................................... 1
2. Monitoring Tasks ................................................................................................................................ 1
2.1. Monitoring Task 1 – Dissolved Oxygen Profile Sampling ............................................................ 3 2.1.1. Profile Data ............................................................................................................................ 3 2.1.2. Wet and Dry Sampling Events ............................................................................................... 9 2.1.3. Jordan River/Farmington Bay Water Quality Council Probe Measurements ...................... 10
2.2. Monitoring Task 2 – Stormwater Sampling ................................................................................. 13 2.2.1. Flow ..................................................................................................................................... 14 2.2.2. Water Chemistry .................................................................................................................. 16 2.2.3. Event Mean Concentration ................................................................................................... 20 2.2.4. Continuous Dissolved Oxygen in Mill Creek ...................................................................... 21 2.2.5. Central Valley Water Reclamation Facility ......................................................................... 22
2.3. Monitoring Task 3 – Sediment Suspension Sampling ................................................................. 24 2.3.1. Dredging ............................................................................................................................... 24 2.3.2. Sediment Suspension ........................................................................................................... 26
3. Conclusions ........................................................................................................................................ 28
4. Recommendations ............................................................................................................................. 28
5. Literature Cited ................................................................................................................................ 29
APPENDIXES
Appendix A. Sampling Location Maps
Appendix B. Dissolved Oxygen Profiling Data Sheets
Appendix C. Stormwater Sampling Data Sheets
Appendix D. Suspended Sediment Sampling Data Sheets
Appendix E. Chain of Custody Forms
Appendix F. Results from American West Analytical Laboratories
FIGURES
Figure 1. Cross-section schematic of the Jordan River illustrating approximate locations of
dissolved oxygen measurements. ............................................................................................... 3 Figure 2. Mean dissolved oxygen by date and site. ................................................................................... 6 Figure 3. Mean dissolved oxygen by site across all sampling events. ...................................................... 7 Figure 4. Additional sampling locations and dissolved oxygen measurements during Profiling
Event #1 (SWCA 2014b). .......................................................................................................... 8 Figure 5. The confluence of the Jordan River and Mill Creek. ................................................................. 9 Figure 6. Mean dissolved oxygen by sampling event across all sites. Bars represent one standard
deviation from the mean. ......................................................................................................... 10 Figure 7. Dissolved oxygen concentration at each site during each of the five sampling events. .......... 10 Figure 8. Dissolved oxygen measurement near the JR/FBWQC probe at the 800 South site. ................ 11

Summary Report for Dissolved Oxygen Monitoring in the Jordan River, Salt Lake County, Utah
ii
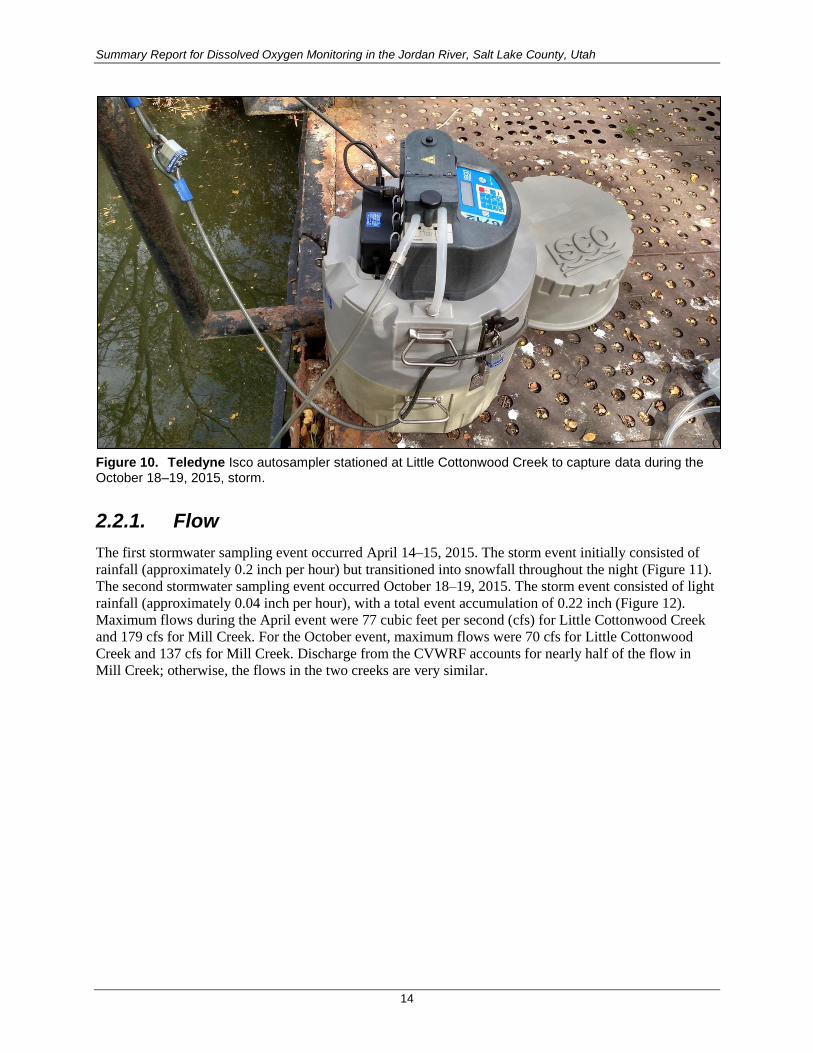
Figure 9. Jordan River/Farmington Bay Water Quality Council probe located at 2100 South. .............. 13 Figure 10. Teledyne Isco autosampler stationed at Little Cottonwood Creek to capture data during
the October 18–19, 2015, storm. .............................................................................................. 14 Figure 11. Hydrographs and hyetographs for the April 14–15, 2015, storm event. The shaded
region represents the time period of water chemistry sampling. ............................................. 15 Figure 12. Hydrographs and precipitation for the October 18–19, 2015, storm event. The shaded
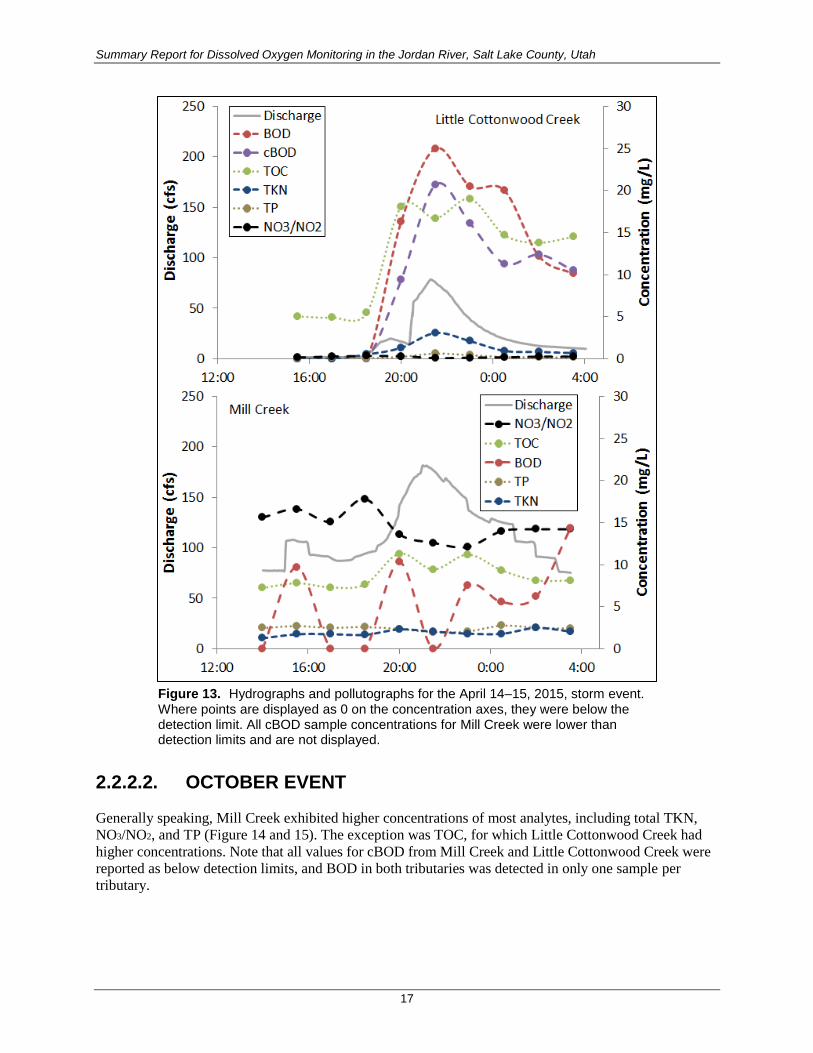
region represents the time period of water sampling. .............................................................. 15 Figure 13. Hydrographs and pollutographs for the April 14–15, 2015, storm event. Where points
are displayed as 0 on the concentration axes, they were below the detection limit. All
cBOD sample concentrations for Mill Creek were lower than detection limits and are
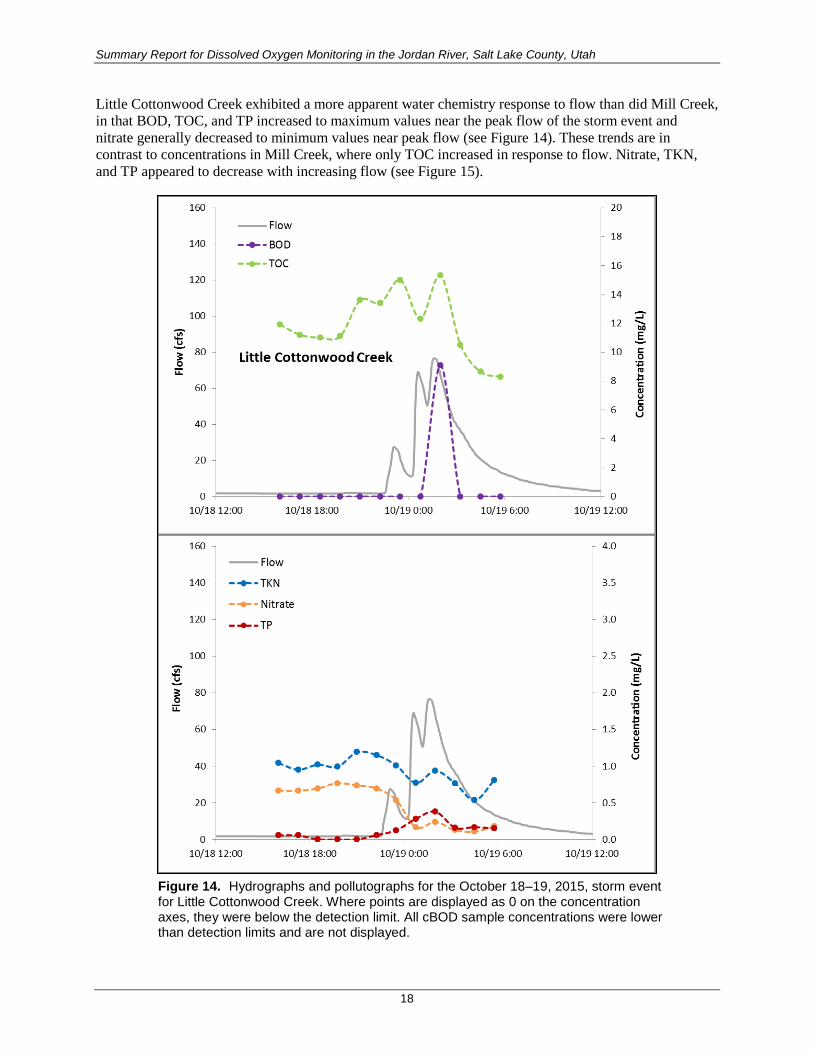
not displayed. ........................................................................................................................... 17 Figure 14. Hydrographs and pollutographs for the October 18–19, 2015, storm event for Little
Cottonwood Creek. Where points are displayed as 0 on the concentration axes, they
were below the detection limit. All cBOD sample concentrations were lower than
detection limits and are not displayed. ..................................................................................... 18 Figure 15. Hydrographs and pollutographs for the October 18–19, 2015, storm event for Mill
Creek. Where points are displayed as 0 on the concentration axes, they were below the
detection limit. All cBOD sample concentrations were lower than detection limits and
are not displayed. ..................................................................................................................... 19 Figure 16. Dissolved oxygen for the October 18–19, 2015, storm event for Mill Creek. ......................... 22 Figure 17. Hydrographs for the October 18–19, 2015, storm event. The shaded region represents
the time period of water sampling. Mill Creek + CVWRF represents flow at the
sampling site. Flow data were obtained from Salt Lake County and the CVWRF. ................. 23 Figure 18. Regression analysis for four analytes in Mill Creek and discharge from the CVWRF. .......... 23 Figure 19. Aerial imagery overview of dredging site at Utah State Fairpark. Numbered points are
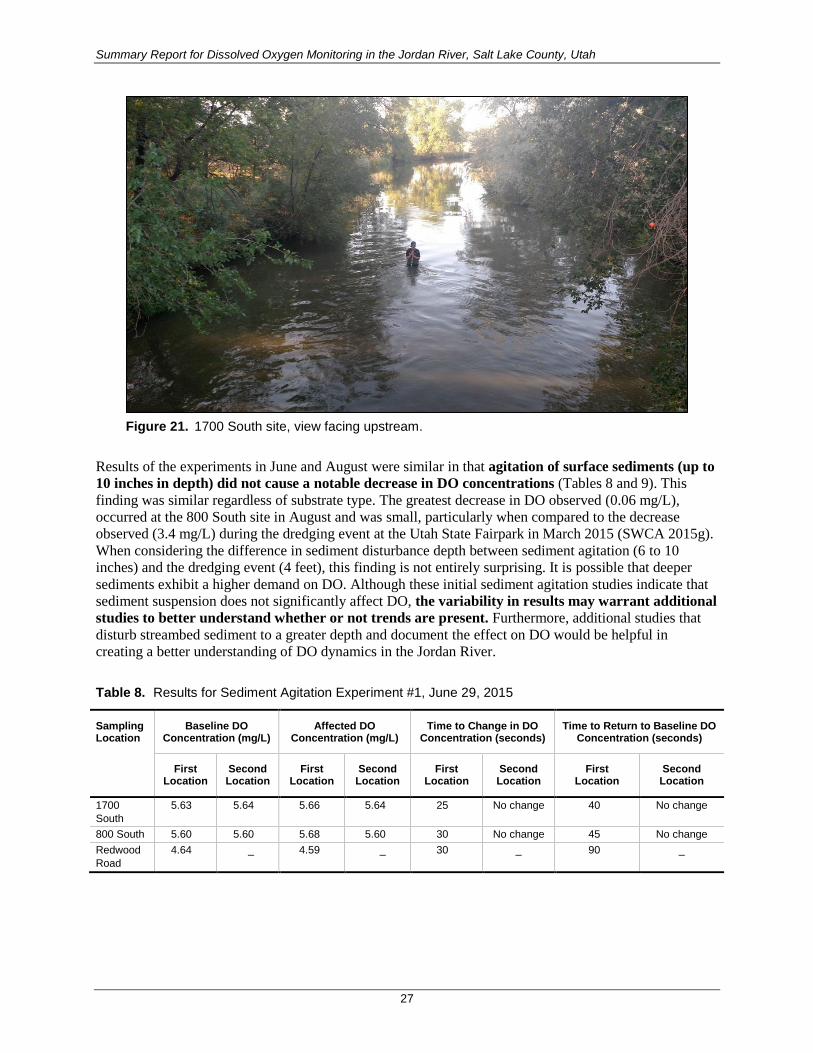
the four sampling locations, with numbers referring to order of sampling. ............................. 24 Figure 20. Dredging action at sampling location 3, view from sampling location 2. ............................... 25 Figure 21. 1700 South site, view facing upstream. ................................................................................... 27
TABLES
Table 1. Completion Status for the Monitoring Tasks ............................................................................. 2 Table 2. Dissolved Oxygen Concentration across the River Profile at Each Site during Each
Sampling Event .......................................................................................................................... 4 Table 3. Comparison between the Jordan River/Farmington Bay Water Quality Council and
Manual Dissolved Oxygen Measurements .............................................................................. 12 Table 4. Event Mean Concentrations and Estimated Loads for the April 14–15, 2015, Storm
Event ........................................................................................................................................ 20 Table 5. Event Mean Concentrations and Estimated Loads for the October 18–19, 2015, Storm
Event ........................................................................................................................................ 21 Table 6. Data Summary for Dredging Event #1, March 16, 2015 ......................................................... 26 Table 7. Sampling Locations for Sediment Suspension ......................................................................... 26 Table 8. Results for Sediment Agitation Experiment #1, June 29, 2015 ............................................... 27 Table 9. Results for Sediment Agitation Experiment #2, August 26, 2015 ........................................... 28

Summary Report for Dissolved Oxygen Monitoring in the Jordan River, Salt Lake County, Utah
1
1. INTRODUCTION
Salt Lake City (the City) with assistance from SWCA Environmental Consultants (SWCA) developed and
executed a study according to a scope of work dated October 15, 2014. The intent of this study was to
address patterns of dissolved oxygen (DO) in the lower Jordan River and increase the overall
understanding of the health of the river. The project consisted of three monitoring tasks designed to
provide data for evaluating the following:
1. Variation in DO concentrations at cross-sectional profiles in the Jordan River at seven locations
along its length during dry, spring runoff, and storm hydrologic conditions. This task also
assessed the representativeness of current in situ DO probe measurements. (I.e., are the
measurements made by these DO probes representative of the entire water column?)
2. Chemical source inputs to the Jordan River during storm events, specifically urban stormwater
versus tributary stormwater.
3. The effect of sediment suspension on water column DO and the effects of different sediment
compositions on DO.
Monitoring task results were previously documented in a series of memoranda submitted to the Utah
Division of Water Quality in 2014 and 2015. This report aims to summarize those findings through a
more holistic lens and provide recommendations for additional data collection that will enhance our
collective understanding of DO dynamics in the Jordan River. Major findings and recommendations from
this study are presented as bolded text throughout the report and are summarized in Section 3 and Section
4. Sampling location maps are provided in Appendix A. Datasheets for each monitoring task are provided
in Appendixes B, C, and D. Chain of custody forms are provided in Appendix E. Laboratory analysis
reports are provided in Appendix F.
1.1. Sampling and Analysis Plan
A sampling and analysis plan (SAP) was developed prior to field sampling, and presents in detail the
approach and procedures to implement water chemistry sampling activities on the Jordan River in 2014
and 2015. The purpose of the SAP was to define the personnel, sampling locations, sampling frequency
and schedule, sampling collection methods and analysis, data management, and quality assurance and
quality control procedures for each monitoring task to complete the requirements of the scope of work as
agreed upon between the City and SWCA. The SAP provides a detailed road map for all aspects of the
project to ensure its successful completion. Any changes to the SAP that occurred throughout the course
of the project are noted in the final version, which will be submitted along with this report.
2. MONITORING TASKS
The three monitoring tasks that compose the study consisted of 12 total sampling events, 10 of which
were completed in 2014 and 2015. Table 1 presents a completion summary of the monitoring tasks and
associated events. Two sampling events (one in Task 1 and one in Task 2) were not completed due to
difficulty in the timing of storms. A memorandum was developed to document each sampling event and
includes the methodology, results, and conclusions specific to that event. All 10 memoranda have been
submitted to the Utah Department of Environmental Quality, Division of Water Quality, and are listed in
the Literature Cited section of this report.

Summary Report for Dissolved Oxygen Monitoring in the Jordan River, Salt Lake County, Utah
2
Table 1. Completion Status for the Monitoring Tasks
Monitoring Task Year Sampling Event Status Completion Date Notes
1 – DO Profiling 2014–2015 Dry weather 1 Complete November 6, 2014
Dry weather 2 Complete July 16, 2015
Spring runoff Complete June, 23, 2015
Storm event 1 (first major storm) Complete April 8, 2015
Storm event 2 (second major storm) Complete September 16, 2015
Storm event 3 (minor storm) Did not complete – Difficulty in storm timing
2 – Stormwater Sampling
2015 Spring runoff storm (April–May) Complete April 13, 2015
Major storm 1 Complete October 17, 2015
Major storm 2 Did not complete – Sampling equipment was deployed in early November to capture a third storm; however, rainfall was insufficient to increase flow. No samples were collected.
3 – Sediment Suspension Sampling
2015 Known dredging operations Complete March 4, 2015
Spring agitation experiment Complete June 29, 2015
Summer agitation experiment Complete August 26, 2015

Summary Report for Dissolved Oxygen Monitoring in the Jordan River, Salt Lake County, Utah
3
2.1. Monitoring Task 1 – Dissolved Oxygen Profile Sampling
Five DO profiling sampling events were conducted at seven sites along the Jordan River from 2014 to
2015: 1) 3300 South, 2) 2100 South, 3) 1300 South, 4) 800 South, 5) 300 North, 6) Redwood Road, and
7) Center Street (see Figures A-1 through A-4 in Appendix A). For sampling event dates, see Table 1. For
a full description of sampling procedures, please see the SAP (SWCA 2014a) and associated memoranda
(SWCA 2014b; SWCA 2015a, 2015b, 2015c, 2015d). DO measurements (concentration and percent
saturation) were taken at two depths (near surface and near bottom) at each of three locations across the
river channel (Figure 1) using a YSI ProSeries Optical DO Probe.
Figure 1. Cross-section schematic of the Jordan River illustrating approximate locations of dissolved oxygen measurements.
2.1.1. Profile Data
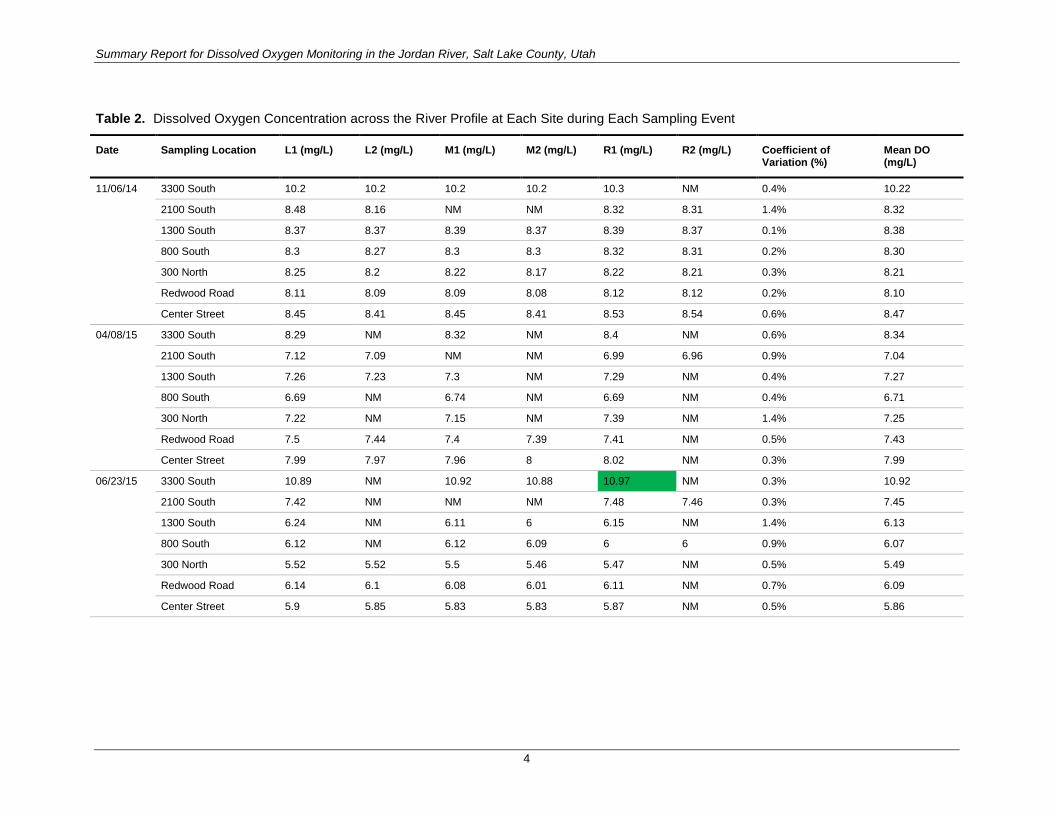
A summary of DO concentration data collected at each site during each sampling event is provided in
Table 2. The lowest DO concentration recorded was 4.67 milligrams per liter (mg/L) at the 300 North site
on July 16, 2015. The highest measurement was 10.97 mg/L recorded at 3300 South on June 23, 2015. No
violations of the acute DO standard (4.0 mg/L or 4.5 mg/L) occurred at any time throughout the
sampling period. Using the profile data, mean DO was calculated at each site during each sampling event
and is presented in Table 2 and Figure 2. Mean DO reflected values similar to the profile data in that the
maximum mean DO occurred at 3300 South in June 2015 and the minimum mean DO occurred at 300
North in July 2015.
Also provided in Table 2 is the coefficient of variation (CV) for each set of profile measurements.
Generally speaking, the CV was less than 1% of the profile’s mean DO concentration (i.e., there is very
little variability within each profile) at the majority of the sites, indicating that the river is well mixed
throughout the profile. In only five instances was the CV greater than 1%, and the highest CV recorded
was 4.3% at the Redwood Road site in July 2015.
Summary Report for Dissolved Oxygen Monitoring in the Jordan River, Salt Lake County, Utah
4
Table 2. Dissolved Oxygen Concentration across the River Profile at Each Site during Each Sampling Event
Date Sampling Location L1 (mg/L) L2 (mg/L) M1 (mg/L) M2 (mg/L) R1 (mg/L) R2 (mg/L) Coefficient of Variation (%)
Mean DO (mg/L)
11/06/14 3300 South 10.2 10.2 10.2 10.2 10.3 NM 0.4% 10.22
2100 South 8.48 8.16 NM NM 8.32 8.31 1.4% 8.32
1300 South 8.37 8.37 8.39 8.37 8.39 8.37 0.1% 8.38
800 South 8.3 8.27 8.3 8.3 8.32 8.31 0.2% 8.30
300 North 8.25 8.2 8.22 8.17 8.22 8.21 0.3% 8.21
Redwood Road 8.11 8.09 8.09 8.08 8.12 8.12 0.2% 8.10
Center Street 8.45 8.41 8.45 8.41 8.53 8.54 0.6% 8.47
04/08/15 3300 South 8.29 NM 8.32 NM 8.4 NM 0.6% 8.34
2100 South 7.12 7.09 NM NM 6.99 6.96 0.9% 7.04
1300 South 7.26 7.23 7.3 NM 7.29 NM 0.4% 7.27
800 South 6.69 NM 6.74 NM 6.69 NM 0.4% 6.71
300 North 7.22 NM 7.15 NM 7.39 NM 1.4% 7.25
Redwood Road 7.5 7.44 7.4 7.39 7.41 NM 0.5% 7.43
Center Street 7.99 7.97 7.96 8 8.02 NM 0.3% 7.99
06/23/15 3300 South 10.89 NM 10.92 10.88 10.97 NM 0.3% 10.92
2100 South 7.42 NM NM NM 7.48 7.46 0.3% 7.45
1300 South 6.24 NM 6.11 6 6.15 NM 1.4% 6.13
800 South 6.12 NM 6.12 6.09 6 6 0.9% 6.07
300 North 5.52 5.52 5.5 5.46 5.47 NM 0.5% 5.49
Redwood Road 6.14 6.1 6.08 6.01 6.11 NM 0.7% 6.09
Center Street 5.9 5.85 5.83 5.83 5.87 NM 0.5% 5.86

Summary Report for Dissolved Oxygen Monitoring in the Jordan River, Salt Lake County, Utah
5
Table 2. Dissolved Oxygen Concentration across the River Profile at Each Site during Each Sampling Event
Date Sampling Location L1 (mg/L) L2 (mg/L) M1 (mg/L) M2 (mg/L) R1 (mg/L) R2 (mg/L) Coefficient of Variation (%)
Mean DO (mg/L)
07/16/15 3300 South 7.75 7.74 7.7 7.71 7.75 NM 0.3% 7.73
2100 South 7.52 7.48 NM NM 7.66 NM 1.0% 7.55
1300 South 5.55 5.53 5.58 5.55 5.49 NM 0.5% 5.54
800 South 5.11 5.1 5.14 5.12 5.17 5.13 0.4% 5.13
300 North 4.79 4.7 4.71 4.67 4.69 4.67 0.9% 4.71
Redwood Road 5.34 5.3 5.3 4.75 5.28 NM 4.3% 5.19
Center Street 5.75 5.76 5.72 5.71 5.76 NM 0.4% 5.74
09/16/15 3300 South 7.49 7.46 7.44 7.44 7.43 NM 0.3% 7.45
2100 South 7.14 7.12 NM NM 7.34 NM 1.4% 7.20
1300 South 7.28 7.29 7.31 7.3 7.32 7.28 0.2% 7.30
800 South 7.1 NM 7.14 7.16 7.05 7.06 0.6% 7.10
300 North 6.83 6.84 6.78 6.76 6.78 NM 0.5% 6.80
Redwood Road 6.77 6.75 6.86 6.86 6.77 6.78 0.7% 6.80
Center Street 6.76 NM 6.73 6.71 6.71 6.72 0.3% 6.73
NM = Not measured due to safety concerns such as high water.
Shading indicates the maximum and minimum DO values recorded throughout the sampling period.

Summary Report for Dissolved Oxygen Monitoring in the Jordan River, Salt Lake County, Utah
6
Figure 2. Mean dissolved oxygen by date and site.
4.00
5.00
6.00
7.00
8.00
9.00
10.00
11.00
12.00
33
00
S
21
00
S
13
00
S
80
0 S
30
0 N
Re
dw
oo
d R
d
Ce
nte
r St
33
00
S
21
00
S
13
00
S
80
0 S
30
0 N
Re
dw
oo
d R
d
Ce
nte
r St
33
00
S
21
00
S
13
00
S
80
0 S
30
0 N
Re
dw
oo
d R
d
Ce
nte
r St
33
00
S
21
00
S
13
00
S
80
0 S
30
0 N
Re
dw
oo
d R
d
Ce
nte
r St
33
00
S
21
00
S
13
00
S
80
0 S
30
0 N
Re
dw
oo
d R
d
Ce
nte
r St
11/06/14 04/08/15 06/23/15 07/16/15 09/16/15
Mean DO (mg/L)
Summary Report for Dissolved Oxygen Monitoring in the Jordan River, Salt Lake County, Utah
7
2.1.1.1. SPATIAL TRENDS IN DISSOLVED OXYGEN
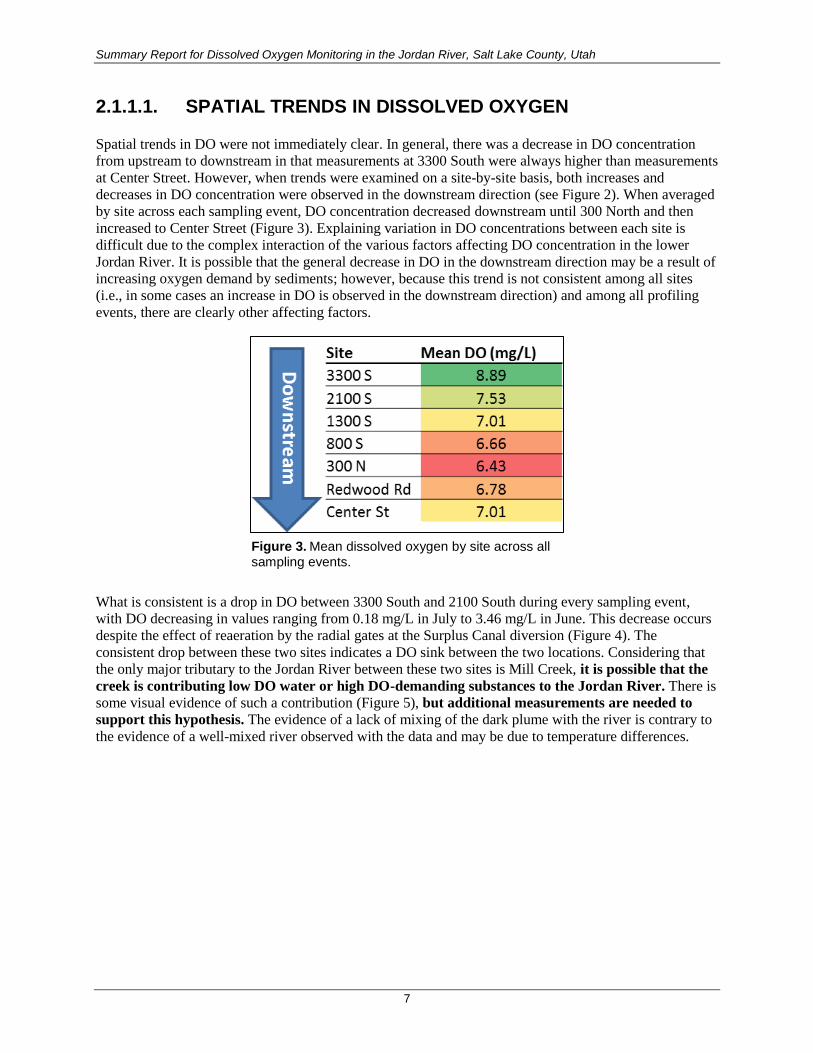
Spatial trends in DO were not immediately clear. In general, there was a decrease in DO concentration
from upstream to downstream in that measurements at 3300 South were always higher than measurements
at Center Street. However, when trends were examined on a site-by-site basis, both increases and
decreases in DO concentration were observed in the downstream direction (see Figure 2). When averaged
by site across each sampling event, DO concentration decreased downstream until 300 North and then
increased to Center Street (Figure 3). Explaining variation in DO concentrations between each site is
difficult due to the complex interaction of the various factors affecting DO concentration in the lower
Jordan River. It is possible that the general decrease in DO in the downstream direction may be a result of
increasing oxygen demand by sediments; however, because this trend is not consistent among all sites
(i.e., in some cases an increase in DO is observed in the downstream direction) and among all profiling
events, there are clearly other affecting factors.
Figure 3. Mean dissolved oxygen by site across all sampling events.
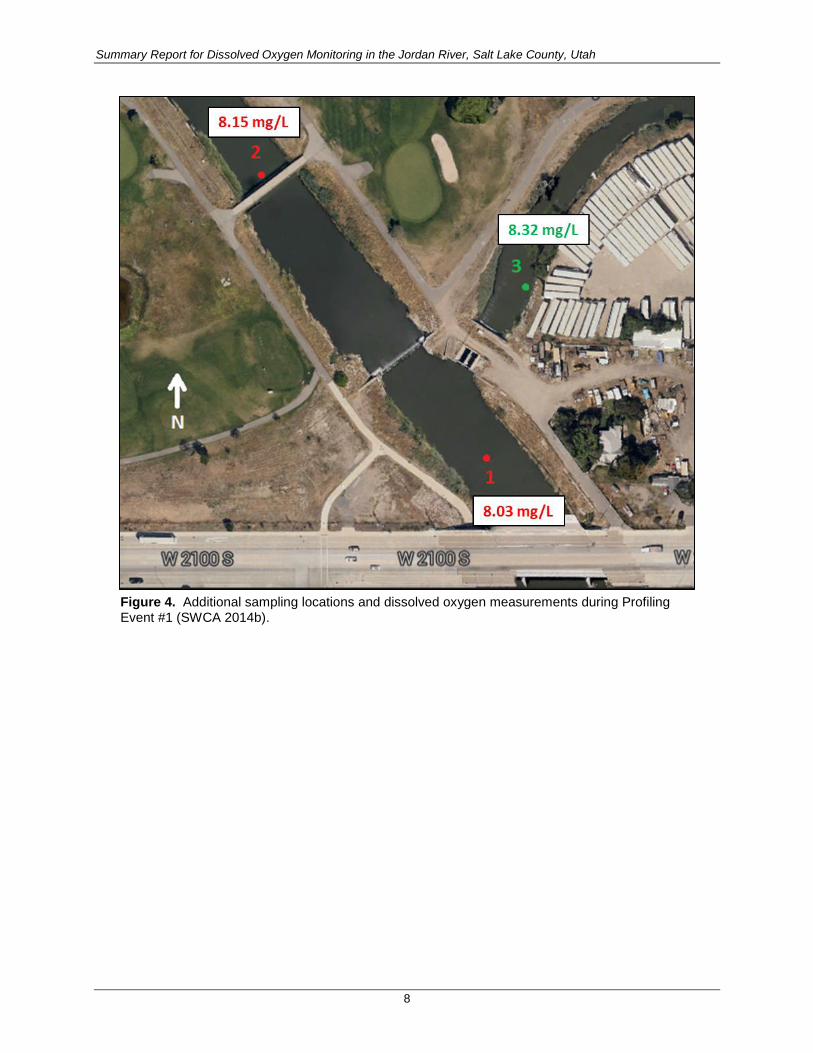
What is consistent is a drop in DO between 3300 South and 2100 South during every sampling event,
with DO decreasing in values ranging from 0.18 mg/L in July to 3.46 mg/L in June. This decrease occurs
despite the effect of reaeration by the radial gates at the Surplus Canal diversion (Figure 4). The
consistent drop between these two sites indicates a DO sink between the two locations. Considering that
the only major tributary to the Jordan River between these two sites is Mill Creek, it is possible that the
creek is contributing low DO water or high DO-demanding substances to the Jordan River. There is
some visual evidence of such a contribution (Figure 5), but additional measurements are needed to
support this hypothesis. The evidence of a lack of mixing of the dark plume with the river is contrary to
the evidence of a well-mixed river observed with the data and may be due to temperature differences.
Summary Report for Dissolved Oxygen Monitoring in the Jordan River, Salt Lake County, Utah
8
Figure 4. Additional sampling locations and dissolved oxygen measurements during Profiling Event #1 (SWCA 2014b).

Summary Report for Dissolved Oxygen Monitoring in the Jordan River, Salt Lake County, Utah
9
Figure 5. The confluence of the Jordan River and Mill Creek.
2.1.2. Wet and Dry Sampling Events
When examined by type of sampling event, mean DO (across all sites) was highest during the dry
November sampling event (8.57 mg/L) and lowest during the dry July sampling event (5.94 mg/L)
(Figure 6). This pattern holds when examining data at each site during each event (Figure 7). Across all
sites, DO is generally highest in the dry November sampling event and lowest during the dry July
sampling event (see Figure 7). These results indicate that storm events are not solely responsible for
decreases in DO concentration. Low DO concentrations may occur during storm events but may also
occur during dry baseflow periods of the warmer summer months as well.

Summary Report for Dissolved Oxygen Monitoring in the Jordan River, Salt Lake County, Utah
10
Figure 6. Mean dissolved oxygen by sampling event across all sites. Bars represent one standard deviation from the mean.
Figure 7. Dissolved oxygen concentration at each site during each of the five sampling events.
2.1.3. Jordan River/Farmington Bay Water Quality Council Probe Measurements
Five of the DO profiling sampling locations (3300 South, 2100 South, 800 South, 300 North, and Center
Street) are co-located with the Jordan River/Farmington Bay Water Quality Council (JR/FBWQC) in situ
water quality probes (see Figures A-1 through A-4 in Appendix A), allowing for direct comparison
between manual DO measurements and in situ probe measurements (Figure 8).
4.00
5.00
6.00
7.00
8.00
9.00
10.00
Nov-14Dry
Apr-15Wet
Jun-15Spring Runoff
Jul-15Dry
Sep-15Wet
Me
an D
O (
mg/
L)
4.00
6.00
8.00
10.00
12.00
3300 S 2100 S 1300 S 800 S 300 N Redwood Rd Center St
DO
(m
g/L)
Nov-14 Apr-15 Jun-15 Jul-15 Sep-15

Summary Report for Dissolved Oxygen Monitoring in the Jordan River, Salt Lake County, Utah
11
Large differences were observed between manual DO measurements and JR/FBWQC probe
measurements at most sites when comparisons were possible (Table 3). The relative percent difference
between manual measurements and JR/FBWQC probe measurements ranged from 2% to 52% and
averaged approximately 18%. Manual DO measurements were on average, approximately 1.5 mg/L
lower than adjacent in situ probes. This large difference in measurements may be due to calibration
issues or sensor drift, or perhaps to the influence of algae on the sensor housings (Figure 9). The latter
hypothesis is plausible because JR/FBWQC probes generally measured higher than SWCA’s probes, an
expected result if there were a localized increased flux of oxygen to the probes from algal photosynthesis
on the sensor housing. This hypothesis could further be supported through nighttime measurements,
where the expected result would be that JR/FBWQC probes would measure lower DO concentrations than
SWCA’s probes, due to increased localized respiration from algae on the sensor housings.
Figure 8. Dissolved oxygen measurement near the JR/FBWQC probe at the 800 South site.

Summary Report for Dissolved Oxygen Monitoring in the Jordan River, Salt Lake County, Utah
12
Table 3. Comparison between the Jordan River/Farmington Bay Water Quality Council and Manual Dissolved Oxygen Measurements
Sampling Location Date
JR/FBWQC DO (mg/L)
Mean DO*
(mg/L) Relative Percent Difference
2100 South 11/06/14 9.38 8.32 12%
04/08/15 8.90 7.04 23%
06/23/15 10.71 7.45 36%
07/16/15 10.22 7.55 30%
09/16/15 8.24 7.20 13%
300 North 11/06/14 9.46 8.21 14%
04/08/15 NA 7.25 –
06/23/15 6.80 5.49 21%
07/16/15 5.17 4.71 9%
09/16/15 NA 6.80 –
3300 South 11/06/14 9.12 10.22 11%
04/08/15 9.76 8.34 16%
06/23/15 15.25 10.92 33%
07/16/15 13.21 7.73 52%
09/16/15 8.58 7.45 14%
800 South 11/06/14 NA 8.30 –
04/08/15 NA 6.71 –
06/23/15 6.58 6.07 8%
07/16/15 5.67 5.13 10%
09/16/15 NA 7.10 –
Center Street 11/06/14 NA 8.47 –
04/08/15 NA 7.99 –
06/23/15 NA 5.86 –
07/16/15 6.05 5.74 5%
09/16/15 6.57 6.73 2%
Notes: NA = not available. Shading represents relative percent difference values from low (green) to high (red). *Mean DO represents the average of the profile data at each site.

Summary Report for Dissolved Oxygen Monitoring in the Jordan River, Salt Lake County, Utah
13
Figure 9. Jordan River/Farmington Bay Water Quality Council probe located at 2100 South.
2.2. Monitoring Task 2 – Stormwater Sampling
Two stormwater sampling events were conducted at two sites along the Jordan River: 1) Mill Creek and
2) Little Cottonwood Creek in April and October of 2015 (Figures A-3 and A-4 in Appendix A).
Stormwater sampling at a third site (stormwater outfall at 600 South) was planned; however, due to
logistics and the magnitude of the storm event, sampling did not occur on either occasion (see SWCA
2015e and SWCA 2015f for details). For a full description of sampling procedures, please see the SAP
(SWCA 2014a) and associated memoranda (SWCA 2015e, SWCA 2015f). Briefly, for each event
Teledyne Isco autosamplers were set up at the two locations (Figure 10) and programmed based on the
expected duration of the storm. Samples were collected the following day and transported on ice to
American West Analytical Laboratories for analysis.
Flow data for Mill Creek and Little Cottonwood Creek were obtained from Salt Lake County (Salt Lake
County 2015a, 2015b), and precipitation data were obtained from Wunderground, station KUTSALTL87
(Weather Underground 2015a, 2015b). Because the Mill Creek sampling site is approximately 1,000 feet
downstream of the Central Valley Water Reclamation Facility (CVWRF), discharge and water chemistry
data were requested from the CVWRF for the sampling time period to correct for loads derived from
wastewater effluent versus loads derived from the watershed.
Summary Report for Dissolved Oxygen Monitoring in the Jordan River, Salt Lake County, Utah
14
Figure 10. Teledyne Isco autosampler stationed at Little Cottonwood Creek to capture data during the October 18–19, 2015, storm.
2.2.1. Flow
The first stormwater sampling event occurred April 14–15, 2015. The storm event initially consisted of
rainfall (approximately 0.2 inch per hour) but transitioned into snowfall throughout the night (Figure 11).
The second stormwater sampling event occurred October 18–19, 2015. The storm event consisted of light
rainfall (approximately 0.04 inch per hour), with a total event accumulation of 0.22 inch (Figure 12).
Maximum flows during the April event were 77 cubic feet per second (cfs) for Little Cottonwood Creek
and 179 cfs for Mill Creek. For the October event, maximum flows were 70 cfs for Little Cottonwood
Creek and 137 cfs for Mill Creek. Discharge from the CVWRF accounts for nearly half of the flow in
Mill Creek; otherwise, the flows in the two creeks are very similar.

Summary Report for Dissolved Oxygen Monitoring in the Jordan River, Salt Lake County, Utah
15
Figure 11. Hydrographs and hyetographs for the April 14–15, 2015, storm event. The shaded region represents the time period of water chemistry sampling.
Figure 12. Hydrographs and precipitation for the October 18–19, 2015, storm event. The shaded region represents the time period of water sampling.

Summary Report for Dissolved Oxygen Monitoring in the Jordan River, Salt Lake County, Utah
16
2.2.2. Water Chemistry
2.2.2.1. APRIL EVENT
Little Cottonwood Creek and Mill Creek were markedly different in both magnitude and timing of
concentrations in measured water chemistry analytes. Generally, Little Cottonwood Creek exhibited a
stronger water chemistry response to storm flows than did Mill Creek, where biochemical oxygen demand
(BOD), carbonaceous biochemical oxygen demand (cBOD) (which is the BOD less demand from
nitrogenous bacteria), total organic carbon (TOC), and total Kjeldahl nitrogen (TKN) all increased to
maximum values near the peak flow of the storm event. This increase is in contrast to concentrations in
Mill Creek, which did not appear to increase to maximum values near peak storm flow. Instead,
concentrations in Mill Creek generally stayed consistent throughout the storm event (see Figure 13). In
both creeks, concentrations for nitrate and nitrite (NO3/NO2) and total phosphorus (TP) stayed relatively
consistent throughout the storm event.
Note that all values for cBOD from Mill Creek were reported as below detection limits and are not shown
in Figure 13. BOD from Mill Creek also had strange behavior, and was below detection limits for four
samples. These low BOD and cBOD values are potentially attributable to measurement errors at
American West Analytical Laboratories, which noted low matrix spike recovery rates for each cBOD
sample from Mill Creek.
Summary Report for Dissolved Oxygen Monitoring in the Jordan River, Salt Lake County, Utah
17
Figure 13. Hydrographs and pollutographs for the April 14–15, 2015, storm event. Where points are displayed as 0 on the concentration axes, they were below the detection limit. All cBOD sample concentrations for Mill Creek were lower than detection limits and are not displayed.
2.2.2.2. OCTOBER EVENT
Generally speaking, Mill Creek exhibited higher concentrations of most analytes, including total TKN,
NO3/NO2, and TP (Figure 14 and 15). The exception was TOC, for which Little Cottonwood Creek had
higher concentrations. Note that all values for cBOD from Mill Creek and Little Cottonwood Creek were
reported as below detection limits, and BOD in both tributaries was detected in only one sample per
tributary.
Summary Report for Dissolved Oxygen Monitoring in the Jordan River, Salt Lake County, Utah
18
Little Cottonwood Creek exhibited a more apparent water chemistry response to flow than did Mill Creek,
in that BOD, TOC, and TP increased to maximum values near the peak flow of the storm event and
nitrate generally decreased to minimum values near peak flow (see Figure 14). These trends are in
contrast to concentrations in Mill Creek, where only TOC increased in response to flow. Nitrate, TKN,
and TP appeared to decrease with increasing flow (see Figure 15).
Figure 14. Hydrographs and pollutographs for the October 18–19, 2015, storm event for Little Cottonwood Creek. Where points are displayed as 0 on the concentration axes, they were below the detection limit. All cBOD sample concentrations were lower than detection limits and are not displayed.

Summary Report for Dissolved Oxygen Monitoring in the Jordan River, Salt Lake County, Utah
19
Figure 15. Hydrographs and pollutographs for the October 18–19, 2015, storm event for Mill Creek. Where points are displayed as 0 on the concentration axes, they were below the detection limit. All cBOD sample concentrations were lower than detection limits and are not displayed.

Summary Report for Dissolved Oxygen Monitoring in the Jordan River, Salt Lake County, Utah
20
2.2.3. Event Mean Concentration
2.2.3.1. APRIL EVENT
Little Cottonwood Creek had an event mean concentration (EMC) for BOD that was three times higher
than that of Mill Creek, but it had a 27% lower BOD load due to much lower flows (Table 4).
Approximately 70% of the BOD load in Mill Creek can be attributed to discharge from the CVWRF.
Storm event cBOD loads from the CVWRF are estimated to be 158.5 kilograms (kg), but cBOD was
below detection limits in all samples from Mill Creek. This discrepancy suggests either sampling or
analysis error for cBOD.
Nutrients (nitrogen and phosphorus) were present in much greater concentrations in Mill Creek
than in Little Cottonwood Creek. Mill Creek NO3/NO2 EMCs were two orders of magnitude greater
than Little Cottonwood Creek EMCs, and TP was one order of magnitude greater (see Table 4). This
difference is indicative of significant nutrient loads from CVWRF, but no wastewater discharge data on
these two analytes were available for comparison. However, although the two watersheds have very
similar contributing areas (25,872 acres for Little Cottonwood Creek and 23,556 acres for Mill Creek),
Mill Creek has almost twice as much developed land as Little Cottonwood Creek (8,941 acres versus
5,454 acres), which may help explain this difference in nutrient EMCs. This difference in developed land
may also help explain the greater TOC, BOD, and cBOD concentrations in Little Cottonwood Creek
when compared to Mill Creek. It is possible that the greater presence of undeveloped space (e.g.,
shrub/scrub, forest, and grassland) in Little Cottonwood Creek may result in more organic matter
deposition and storage than in Mill Creek. More storage of organic matter is linked to higher
concentrations of TOC, BOD, and cBOD in downstream waters, where pulses of organic matter are often
transported in storm events (Mallin et al. 2009; see Figure 13). Mill Creek had higher loads than Little
Cottonwood Creek for all analytes measured, a result that is attributable to the larger flows in Mill
Creek compared to Little Cottonwood Creek.
Table 4. Event Mean Concentrations and Estimated Loads for the April 14–15, 2015, Storm Event
Analyte Event Mean Concentration (mg/L) Estimated Loads (kg)*
Mill Creek Little Cottonwood Creek Mill Creek (CVWRF) Little Cottonwood Creek
BOD 6.26 19.91 760.8 (536.1) 553.0
cBOD – 15.38 – (158.5) 427.2
NO3/NO2 13.48 0.15 1,638.8 4.3
TKN 2.02 1.92 246.1 53.2
TOC 9.65 16.84 1,173.0 467.7
TP 2.32 0.39 281.8 10.8
Note: All Mill Creek sample measurements for cBOD were below the detection limit. Values in parentheses are the loads from the CVWRF, approximately 1,000 feet upstream from the sampling site. Only BOD and cBOD data were available from the CVWRF.
* Loads are estimates only for the first pulse of the April 14–15, 2015, storm event. Additional storm pulses occurred after our sampling window on April 15, 2015 (see Figure 1).

Summary Report for Dissolved Oxygen Monitoring in the Jordan River, Salt Lake County, Utah
21
2.2.3.2. OCTOBER EVENT
Little Cottonwood Creek EMCs for TOC and BOD were higher than those for Mill Creek; however,
EMCs for nutrients (nitrogen [nitrate and TKN] and phosphorus) were lower than those for Mill Creek
(Table 5). Higher EMCs of nutrients in Mill Creek is possibly a result of nutrient loads from CVWRF,
although no wastewater discharge data on these analytes were available for comparison. This hypothesis
is further supported by the significant positive relationships between nitrate and discharge and between
TP and discharge (see Figure 18) that indicate a pulse of nutrients to Mill Creek during times of high
discharge from the CVWRF. It should be noted that BOD was detected in a sample from Mill Creek, but
it did not occur during the storm event and therefore is not reported in Table 1. It is possible that the BOD
reading was a result of discharge from the CVWRF.
Mill Creek had higher loads than Little Cottonwood Creek for all analytes measured (with the exception
of BOD), a result that is attributable to the larger flows and in some cases, concentrations in Mill Creek
compared to Little Cottonwood Creek. A BOD load of 512.0 kg and a cBOD load of 232.3 kg were
calculated from the CVWRF data; however, neither of these analytes was detected in Mill Creek during
the storm event. This discrepancy suggests either sampling or analysis error for BOD and cBOD.
Table 5. Event Mean Concentrations and Estimated Loads for the October 18–19, 2015, Storm Event
Analyte Event Mean Concentration (mg/L) Estimated Loads (kg)
Mill Creek Little Cottonwood Creek Mill Creek (CVWRF) Little Cottonwood Creek
BOD – 3.02 – (512.0) 76.0
cBOD – – – (232.3) –
NO3/NO2 9.56 0.17 715.1 4.4
TKN 1.43 0.79 106.9 20.0
TOC 8.17 11.98 611.2 301.7
TP 1.61 0.26 120.1 6.4
Note: All Mill Creek and Little Cottonwood Creek sample measurements for cBOD were below the detection limit. Values in parentheses are the loads from the CVWRF, approximately 1,000 feet upstream from the Mill Creek sampling site. Only BOD and cBOD data were available from the CVWRF.
2.2.4. Continuous Dissolved Oxygen in Mill Creek
An INW DO2 Sensor was installed at the Mill Creek site to record continuous DO throughout the October
storm event. DO in Mill Creek exhibited a decrease until approximately midnight when it began a steady
increase (Figure 16). The decrease in DO is expected as a part of the diurnal cycle; however, the increase
in DO before daylight hours is somewhat surprising and could be attributed to increased aeration as a
result of the increased flow in Mill Creek during the storm event. It is also possible that DO is increasing
because discharge from the CVWRF is decreasing. DO also exhibited significant decreases during the
latter part of the sampling period when CVWRF discharge is increasing. (Unfortunately, no analyte data
were available during this time.) Despite these observations, it is important to note that there are many
factors affecting DO cycling in streams, and, without additional data, it is difficult to pinpoint exact
causes for DO behavior.

Summary Report for Dissolved Oxygen Monitoring in the Jordan River, Salt Lake County, Utah
22
Figure 16. Dissolved oxygen for the October 18–19, 2015, storm event for Mill Creek.
2.2.5. Central Valley Water Reclamation Facility
Discharge from the CVWRF on October 18 and October 19 was irregular and appeared to occur in pulses.
It more than doubled the flow in Mill Creek at the sampling site (Figure 17). When analytes in Mill Creek
were examined in relation to discharge from the CVWRF, significant positive relationships were present
between nitrate and discharge (R2 = 0.75902, P ≤ 0.05) and between TP and discharge TP (R2 = 0.74576,
P ≤ 0.05). Significant relationships were not present between TKN and discharge and between TOC and
discharge (Figure 18). It appears that the peak in TOC was largely driven by the increase in flow in Mill
Creek from the storm rather than discharge from the CVWRF (see Figure 15).

Summary Report for Dissolved Oxygen Monitoring in the Jordan River, Salt Lake County, Utah
23
Figure 17. Hydrographs for the October 18–19, 2015, storm event. The shaded region represents the time period of water sampling. Mill Creek + CVWRF represents flow at the sampling site. Flow data were obtained from Salt Lake County and the CVWRF.
Figure 18. Regression analysis for four analytes in Mill Creek and discharge from the CVWRF.

Summary Report for Dissolved Oxygen Monitoring in the Jordan River, Salt Lake County, Utah
24
2.3. Monitoring Task 3 – Sediment Suspension Sampling
2.3.1. Dredging
DO monitoring during a dredging event on the Jordan River occurred on March 4, 2015, at the Utah State
Fairpark. For a full description of sampling methodology for the dredging event, please see the associated
memorandum (SWCA 2015g). Prior to sampling at the dredging operation, a sample was taken at the
pedestrian bridge just south of North Temple to establish a baseline measurement. DO was then sampled
from four locations in the vicinity of the dredging operation (Figure 19). The first sample was taken
approximately 350 feet downstream of the dredging site at a Jordan River Parkway pedestrian bridge. The
second sample was taken approximately 100 feet upstream of the dredging site, also at a pedestrian
bridge. The third sample was taken within 5 feet of the active dredging. For this third sampling location,
baseline measurements were recorded before the sediment was agitated by the dredging backhoe. After
those measurements were recorded, the backhoe operator scooped up sediment within 5 feet of the DO
probe, and more measurements were recorded to observe changes in water chemistry from sediment
agitation (Figure 20). Measurements were continually observed until water chemistry parameters returned
to baseline numbers. To account for potential backwater effects, a sample was taken at the fourth
sampling location just downstream of the dredging site, in a backwater area similar to the third sampling
point but relatively undisturbed by the dredging activity. According to operators on-site, the goal of the
dredging operation was to remove approximately 4 vertical feet of sediment from the river.
Figure 19. Aerial imagery overview of dredging site at Utah State Fairpark. Numbered points are the four sampling locations, with numbers referring to order of sampling.

Summary Report for Dissolved Oxygen Monitoring in the Jordan River, Salt Lake County, Utah
25
Figure 20. Dredging action at sampling location 3, view from sampling location 2.
Data collected during this event are shown in Table 6 and indicate a significant reduction in water quality
from sediment suspension. This impact was highly localized, however; it was only apparent within
approximately 20 feet of dredging activities, which is possibly due to dredging occurring outside the main
flowpath of the river, limiting the amount of sediment transported downstream. Additionally, the
operators were careful not to disturb too much sediment in the main flowpath of the river. Closer to the
dredging activity, suspended sediment reduced DO concentrations by up to 3.4 mg/L (from 6.30 mg/L
to 2.91 mg/L) in a matter of seconds, but, when left undisturbed, DO concentrations returned to
baseline conditions after the sediment disturbance within 5 minutes.

Summary Report for Dissolved Oxygen Monitoring in the Jordan River, Salt Lake County, Utah
26
Table 6. Data Summary for Dredging Event #1, March 16, 2015
Sampling Location
Sample Time
Sampling Parameter Notes
Temperature (°Celsius)
DO (%)
DO (mg/L)
Specific Conductance
(μS/cm)
Turbidity (NTU)
North Temple
11:45 13.0 65.0 6.80 1,706 2.7 Sampled roughly 1 hour before other sites
1 12:40 13.4 71.9 7.48 1,665 3.3 –
2 12:46 13.4 70.6 7.33 1,684 2.0 –
3 (baseline) 13:04 14.0 61.7 6.30 1,657 160 –
3 (agitation) 13:05 13.7 28.6 2.91 1,594 1,500 Time to return to baseline = 5 minutes
4 13:15 15.7 84.0 8.30 1,646 5.6 –
Notes: μS/cm = microsiemens per centimeter; NTU = nephelometric turbidity units.
2.3.2. Sediment Suspension
Two sediment agitation experiments were conducted at three sites along the Jordan River in June and
August (Table 7, Figures A-1 through A-3 in Appendix A). For a full description of sampling
methodology, please see the associated memoranda (SWCA 2015h, 2015i). DO measurements were
recorded at two locations for each site; the first was 10 feet downstream of the agitation site, and the
second was at a downstream distance equivalent to a flow travel time of 1 minute. Once the two
downstream locations were selected, one person (agitator) walked as close to the center of the stream as
possible (Figure 21) while the second person (collector) began recording DO measurements to establish a
baseline reading at the first downstream location. Once DO readings were stable, the agitator conducted
sediment agitation for 60 seconds and the collector recorded DO measurements. This process was
repeated at the second downstream location when access was possible.
Table 7. Sampling Locations for Sediment Suspension
Sampling Location Rationale
1700 South Mostly gravel bed
800 South Intermediate bed sediment between gravel and organic
Redwood Road* Predominantly organic with some gravels
*The Redwood Road site was selected due to high water at the Center Street location.
Summary Report for Dissolved Oxygen Monitoring in the Jordan River, Salt Lake County, Utah
27
Figure 21. 1700 South site, view facing upstream.
Results of the experiments in June and August were similar in that agitation of surface sediments (up to
10 inches in depth) did not cause a notable decrease in DO concentrations (Tables 8 and 9). This
finding was similar regardless of substrate type. The greatest decrease in DO observed (0.06 mg/L),
occurred at the 800 South site in August and was small, particularly when compared to the decrease
observed (3.4 mg/L) during the dredging event at the Utah State Fairpark in March 2015 (SWCA 2015g).
When considering the difference in sediment disturbance depth between sediment agitation (6 to 10
inches) and the dredging event (4 feet), this finding is not entirely surprising. It is possible that deeper
sediments exhibit a higher demand on DO. Although these initial sediment agitation studies indicate that
sediment suspension does not significantly affect DO, the variability in results may warrant additional
studies to better understand whether or not trends are present. Furthermore, additional studies that
disturb streambed sediment to a greater depth and document the effect on DO would be helpful in
creating a better understanding of DO dynamics in the Jordan River.
Table 8. Results for Sediment Agitation Experiment #1, June 29, 2015
Sampling Location
Baseline DO Concentration (mg/L)
Affected DO Concentration (mg/L)
Time to Change in DO Concentration (seconds)
Time to Return to Baseline DO Concentration (seconds)
First Location
Second Location
First Location
Second Location
First Location
Second Location
First Location
Second Location
1700
South
5.63 5.64 5.66 5.64 25 No change 40 No change
800 South 5.60 5.60 5.68 5.60 30 No change 45 No change
Redwood
Road
4.64 _ 4.59 _ 30 _ 90 _

Summary Report for Dissolved Oxygen Monitoring in the Jordan River, Salt Lake County, Utah
28
Table 9. Results for Sediment Agitation Experiment #2, August 26, 2015
Sampling Location
Baseline DO Concentration (mg/L)
Affected DO Concentration (mg/L)
Time to Change in DO Concentration (seconds)
Time to Return to Baseline DO Concentration (seconds)
First Location
Second Location
First Location
Second Location
First Location
Second Location
First Location
Second Location
1700
South
4.80 4.92 4.85 4.92 60 No change 45 No change
800 South 5.73 5.80 5.67 5.80 90 No change > 600 No change
Redwood
Road
5.88 _ 5.88 _ No change _ No change _
3. CONCLUSIONS
The results from this study provide evidence for the following:
The Jordan River is well mixed indicating that the in situ DO probes are representative of the
river as a whole; however, the in situ DO probes may be measuring higher DO concentrations
than what is actually present.
Mill Creek is a potential source of low DO water or high DO demanding substances to the Jordan
River.
Low DO is not only a function of storm events but may occur during “dry” periods.
Little Cottonwood Creek and Mill Creek were markedly different in both magnitude and timing
of concentrations in measured water chemistry analytes during storm events. This is likely a
result of land use differences in their respective watersheds and the influence of the CVWRF
discharge on Mill Creek.
Suspended sediment from dredging can significantly decrease DO (up to 3.4 mg/L).
4. RECOMMENDATIONS
Further understanding of DO dynamics in the Jordan River would benefit from additional data collection
such as the following:
The influence of Mill Creek and other tributaries on DO concentration in the Jordan River,
specifically through contribution of DO-demanding substances (e.g., DOM) or low DO inputs
Nighttime manual measurements of DO to compare to the JR/FBWQC probes
Urban outfall stormwater chemistry characterization in the lower Jordan River
Influence of wastewater treatment plant discharge on stream chemistry, particularly with regard
to nutrients
The effect of surface sediment disturbance on DO
Additionally, there could be much added benefit to developing (and making available) a maintenance and
calibration record for the JR/FBWQC sondes to ensure that the data collected are reliable and support
accurate conclusions. Given the discrepancies between manual measurements and in situ DO probes, it is
possible that DO violations are occurring more frequently and for longer periods than previously thought.
Summary Report for Dissolved Oxygen Monitoring in the Jordan River, Salt Lake County, Utah
29
5. LITERATURE CITED
Mallin, M.A., V.L. Johnson, and S.H. Ensing. 2009. Comparative impacts of stormwater runoff on water
quality of an urban, a suburban, and rural stream. Environmental Monitoring and Assessment
159:475–491.
Salt Lake County. 2015a. Storm flow data. Available at: http://slco.org/pweng/flood/streamflow.
Accessed May 12, 2015.
———. 2015b. Storm flow data. Available at: http://slco.org/pweng/flood/streamflow. Accessed October
20, 2015.
SWCA. 2014a. Sampling and Analysis Plan Jordan River Water Quality. November 2014. Draft
submitted to Salt Lake City Department of Public Utilities. Salt Lake City, Utah: SWCA
Environmental Consultants.
———. 2014b. Dissolved Oxygen Profiling Event #1. November 2014. Memorandum submitted to Salt
Lake City Department of Public Utilities. Salt Lake City, Utah: SWCA Environmental
Consultants.
———. 2015a. Dissolved Oxygen Profiling Event #2. April 2015. Memorandum submitted to Salt Lake
City Department of Public Utilities. Salt Lake City, Utah: SWCA Environmental Consultants.
———. 2015b. Dissolved Oxygen Profiling Event #3. June 2015. Memorandum submitted to Salt Lake
City Department of Public Utilities. Salt Lake City, Utah: SWCA Environmental Consultants.
———. 2015c. Dissolved Oxygen Profiling Event #4. July 2015. Memorandum submitted to Salt Lake
City Department of Public Utilities. Salt Lake City, Utah: SWCA Environmental Consultants.
———. 2015d. Dissolved Oxygen Profiling Event #5. September 2015. Memorandum submitted to Salt
Lake City Department of Public Utilities. Salt Lake City, Utah: SWCA Environmental
Consultants.
———. 2015e. Stormwater Sampling Event #1. May 2015. Memorandum submitted to Salt Lake City
Department of Public Utilities. Salt Lake City, Utah: SWCA Environmental Consultants.
———. 2015f. Stormwater Sampling Event #2. November 2015. Memorandum submitted to Salt Lake
City Department of Public Utilities. Salt Lake City, Utah: SWCA Environmental Consultants.
———. 2015g. Dredging Event #1. March 2015. Memorandum submitted to Salt Lake City Department
of Public Utilities. Salt Lake City, Utah: SWCA Environmental Consultants.
———. 2015h. Sediment Agitation Event #1. June 2015. Memorandum submitted to Salt Lake City
Department of Public Utilities. Salt Lake City, Utah: SWCA Environmental Consultants.
———. 2015i. Sediment Agitation Event #2. August 2015. Memorandum submitted to Salt Lake City
Department of Public Utilities. Salt Lake City, Utah: SWCA Environmental Consultants.
Wunderground. 2015a. Precipitation data. Available at: http://www.wunderground.com/personal-weather-
station/dashboard?ID=KUTSALTL87#history. Accessed May 12, 2015.
———. 2015b. Precipitation data. Available at: http://www.wunderground.com/personal-weather-
station/dashboard?ID=KUTSALTL87#history. Accessed October 20, 2015.

Summary Report for Dissolved Oxygen Monitoring in the Jordan River, Salt Lake County, Utah
30
This page intentionally blank