summary of recent research on detonation wave engines at uta
TRANSCRIPT

2011 International Workshop on Detonation for Propulsion
November 14-15, 2011
Paradise Hotel, Busan, Korea
Summary of Recent Research on
Detonation Wave Engines at UTA
Donald R. Wilson,* Frank K. Lu§
University of Texas at Arlington, Arlington, Texas, 76019
Abstract
A survey of recent research at UTA on detonation waves related to propulsion is presented
in this paper. A brief historical review of the early pulse detonation engine (PDE) research at
UTA is provided to lay the background for the development of a large-scale PDE Ground
Demonstrator. Also current activities related to the development of rotating detonation wave
engines (RDE) are reviewed. System integration studies for both PDE- and RDE-based
propulsion systems are summarized, followed by a brief description of two programs focusing
on application of detonation waves to hypersonic flow simulation and power generation.
Introduction
Pulse Detonation Engine (PDE) research was initiated at UTA in 1994 with a program
funded by the University of Texas System Advanced Technology Program. This was a
collaborative effort between UTA, Lockheed Martin Aeronautics and Rocketdyne. UTA
designed and built a 7.64 cm (3-inch) diameter detonation tube, which after a series of
experimental investigations of basic detonation wave phenomena was converted to a PDE.
Analytical and computational support was provided by Lockheed Martin and Rocketdyne. From
1995-1999, we were involved in the development of a detonation-driven shock tube in order to
support the NASA/MSE MARIAH Program by providing electrical conductivity measurements of
seeded plasmas at high pressure. The development effort was conducted in collaboration with
the GASL development of the HyPulse facility. In 2000, we initiated in-house programs to
provide CFD simulation capability to support conceptual development of a multi-mode, high-
speed PDE–based propulsion system. We also worked our way up the PDE development
learning curve from 2000 through 2005 with a series of small-scale PDE experiments that led to
the initiation of a program to develop a large-scale PDE ground test demonstrator in
collaboration with the Temasek Laboratory of the National University of Singapore. From 2009
through 2010, we conducted an experimental investigation of a novel PDE-based power
___________________________________________________________________ *Professor, Aerodynamics Research Center, Department of Mechanical and Aerospace Engineering
§ Professor and Director, Aerodynamics Research Center, Department of Mechanical and
Aerospace Engineering
production concept, in collaboration with Neo Power Technology of Norway. And in 2009, we
became initiated research investigations of rotating detonation wave engines, and are currently
involved in a DARPA-funded investigation of fluidic fuel/oxidizer injection concepts. In addition,
we have on-going analytical and computational studies of PDEs and RDEs. A summary of
these various programs is presented in the following paper.
Pulse Detonation Engine Research – Early History
Detonation wave research started at UTA in 1994 in a program funded by the University of
Texas System’s Advanced Technology Program. In this program, UTA performed an
experimental investigation of fundamental detonation physics, followed by the development of a
series of small-scale PDEs. Analytical and computational support was initially provided by
Lockheed Martin Aeronautics and Rocketdyne. The initial experiments were conducted with a
7.64 cm diameter detonation tube whose length was variable up to 0.5 m. The fuels explored
were H2, CH4, and C3H8, mixed with either O2 or air as oxidizer. Detonation waves were initiated
by a high-energy arc discharge from a capacitor bank, capable of delivering up to 2 MW with
pulse duration of 75 µs. Upstream, downstream and mid-section locations of the igniter plug
were tested. We also varied pre-detonation tube pressures from 0.5 to 4.0 atm, and
investigated various DDT devices (Shchelkin spirals, orifice plates, pressure, and the use of a
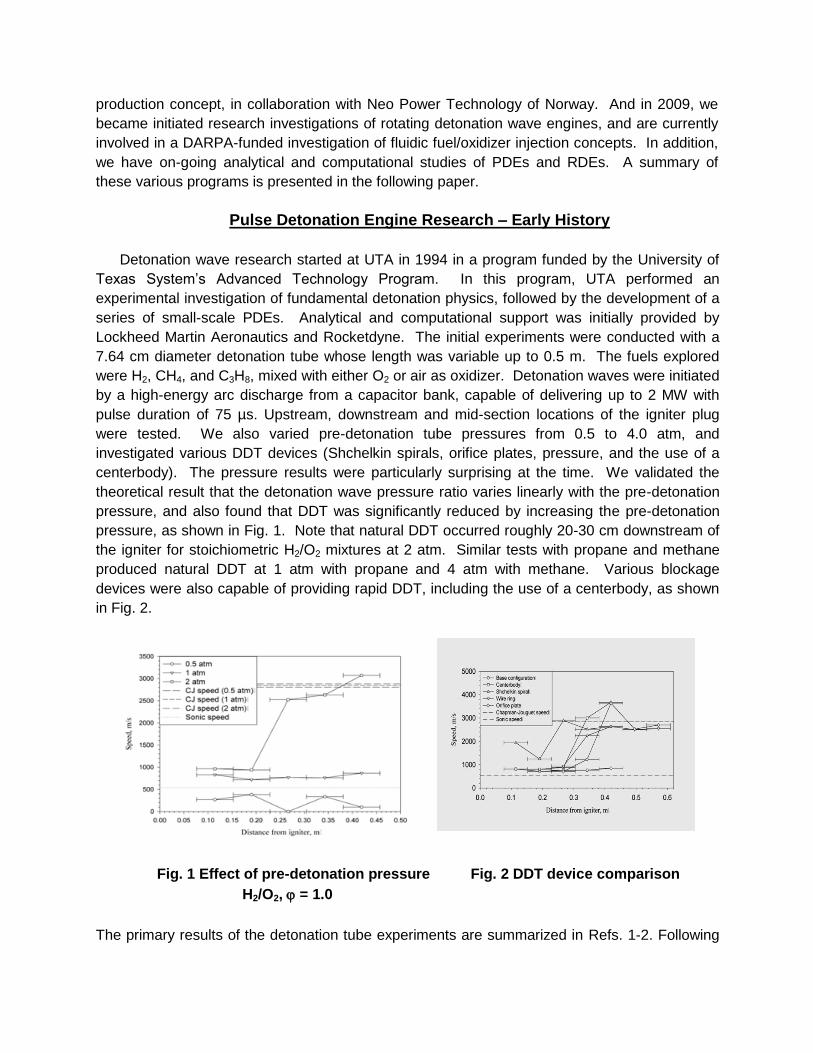
centerbody). The pressure results were particularly surprising at the time. We validated the
theoretical result that the detonation wave pressure ratio varies linearly with the pre-detonation
pressure, and also found that DDT was significantly reduced by increasing the pre-detonation
pressure, as shown in Fig. 1. Note that natural DDT occurred roughly 20-30 cm downstream of
the igniter for stoichiometric H2/O2 mixtures at 2 atm. Similar tests with propane and methane
produced natural DDT at 1 atm with propane and 4 atm with methane. Various blockage
devices were also capable of providing rapid DDT, including the use of a centerbody, as shown
in Fig. 2.
Fig. 1 Effect of pre-detonation pressure Fig. 2 DDT device comparison
H2/O2, = 1.0
The primary results of the detonation tube experiments are summarized in Refs. 1-2. Following

completion of the detonation tube experiments, rotary valves were installed in the fuel and
oxidizer lines and the necessary plumbing and control system was installed to convert the
detonation tube into the PDE, shown in Fig. 3. Operation of this engine was conducted with
hydrogen and propane as fuels and oxygen as oxidizer, at frequencies from 5 to 25 Hz.. A
Shchelkin spiral was used to promote DDT and CJ velocities were routinely achieved at lower
frequencies, but somewhat intermittently at the higher frequencies, which was attributed to
improper mixing at higher frequencies.
Fig. 3 Early PDE with rotary mechanical valves
From 2000 through 2005, we conducted a series of development tests with several 2.54 cm
diameter engines. The major development issues that were addressed included the igniter,
valves, DDT, extended test duration, cooling, improved diagnostics, improved data acquisition
systems, and finally transition to liquid fuels. The progression in engine design is illustrated in
Fig. 4. The results of this engine development program are summarized in Refs. 6-8., and led to
the initiation of a research program conducted in conjunction with Temasek Laboratories of the
National University of Singapore.
(a) Early 2000 (b) Late 2005
Fig. 4 PDE engine development
Red hot DDT
section
Shchelkin spiral
fragments
Red hot DDT
section
Shchelkin spiral
fragments

Large-scale PDE Ground Demonstrator Program
The first phase of the Temasek program involved the development of several small-scale
prototypes to provide guidance for the development of the ground demonstrator engine. A
schematic of the first prototype engine is shown in Fig. 5, and typical performance results are
shown in Fig. 6. This engine measured 800 mm long by 24 mm ID, and contained several DDT
enhancement devices. Operating with stoichiometric mixtures of propane and oxygen with STP
initial conditions, average static thrust levels from 7 to 9 N (16 to 20 lbf) were achieved at
frequencies from 10 to 15 Hz (Ref. 9).
Fig. 5 Schematic of UTA/Temasek laboratory PDE prototype
(a) Pressure profiles (b) Thrust measurements
Fig. 6 Prototype PDE performance
The subsequent prototype engine development (Refs. 10-14) evolved over several years to the
final configuration shown in Fig. 7.
PDE

a) Propane/oxygen PDE rig in late 2005 (b) Propane/oxygen PDE rig in Late 2007
Fig. 7 Small-scale prototype engines
Following completion of the prototype engine development, a large-scale ground
demonstrator engine was designed and constructed. The engine diameter was 101.6 mm (4
inch) and the length of the detonation chamber was 1 meter. The 4 inch size was chosen as it
exceeds the normal diameter for the detonation of liquid hydrocarbons based upon the sizing
rule of tube diameter D > λ / π, where λ is the detonation cell size (Ref. 15) and matches the
theoretical thrust requirement. The goal of the program was to achieve a target thrust level of
1.1 kN (250 lbf) and an operational frequency up to 50 Hz. Details of the program are reported
in Refs. 16-17. The PDE combustor was designed to run on most common fuels, including
kerosene, propane and hydrogen, with air or oxygen. A new ignition system was also built that
features multiple low energy igniters located at the head manifold section of the engine, creating
an impinging shock ignition when fired simultaneously. Instead of a separate initiator, an
energetic mixture can be introduced into the ignition section to facilitate rapid DDT. The main
sections of the combustor were fitted with fully enclosed water cooling passages. Kerosene fuel
was preheated before mixing with preheated air in a mixing chamber. The fuel/air mixture and
purge air were injected into the engine at appropriate stages of the engine cycle using dual
rotary valves, each having nine parallel ports. Air from a compressor at 14 MPa (2000 psi) was
used for the ground demonstrator in lieu of an actual air induction system. The air entering the
upper branch is heated. The liquid fuel is preheated and then injected into the hot air. This flash
vaporization system was chosen to ensure that only gaseous fuel enters the detonation
chamber, thereby avoiding the difficulties of detonating a liquid fuel directly. The gaseous
fuel/air mixture at about 2 atm is then fed through ports along the side of the detonation
chamber. After detonation, purge air from the lower branch is introduced into the detonation
chamber by a similar rotary valve system. This air is used to scavenge and cool the chamber.
A constant plasma field was also to be used to create an ion -doped environment to assist in
the cracking of the kerosene hydrocarbons. The plasma energy field was also to serve a
secondary purpose of reducing the overall high electrical energy needed for ignition so as to
increase the longevity of the spark generators. The rotary valves were driven directly by a
stepper motor. A pair of orifice plates were located downstream of the ignition zone for
inducing DDT. Dynamic pressure transducers and ion detectors were used for combustion
diagnostics within the combustor. The various components of the engine were controlled via a

LABVIEW data acquisition system, which was also used for monitoring the engine processes
and for recording data. A schematic of the engine is shown in Fig. 8.
The predicted thrust was 1.4 kN (320 lbf) by extrapolating data from propane/oxygen
operating at 10 Hz. Given that the thrust levels will be lower for a LHC/air mixture, the target
thrust level of 1.1 kN (250 lbf) can be obtained by operating the engine at higher frequency,
which is set to 20 Hz. All major sections are made of carbon steel with provision for eye bolts to
help with the assembly. A photograph of the combustor mounted on its thrust table is shown in
Fig. 9. The major components of the combustor are the head manifold, shown without the end
flange, the DDT section and the blowdown section. The large openings at the sides of the
combustor are for introducing premixed reactants (partly hidden from view) and purge air. The
fuel/air mixture and the purge air are delivered by means of two different valve systems. Fuel is
injected using high-pressure diesel injectors while the fuel/air mixture and the purge air are
delivered by means of rotary valve systems. Initial operation of the engine is shown in Fig. 10.
Fig. 8 Schematic of the PDE ground demonstrator

Fig. 9 PDE combustor Fig. 10 Initial operation
In summary, a large-scale, air breathing, liquid fuel pulse detonation engine was
designed, assembled and tested. Kerosene was used as the liquid fuel as it closely resembles
jet fuel. The modular design lends itself to being easily modified for different applications.
While initially designed for liquid fuel and air, it demonstrated versatility for modification by being
easily adapted to utilize a hydrogen/oxygen and a methane/oxygen pre-detonator to initiate
detonation. The engine developed a peak thrust of 1 kN (240 lb.). Data analysis has revealed a
sub-C-J pressure wave with velocities of 1288 to 1530 m/s, which could be sustained for the
length of the 1 m tube when significant volumes of vaporized fuel were introduced through
sidewall ports after air heating issues were resolved. Over 150 test runs were made, with no
observable deterioration of the engine. The utilization of multiple lower energy spark plugs
located circumferentially solved an initial problem of short life spans of the spark plugs. The
demonstrator engine has been operated for runs up to 13 min. The ion detectors worked as
designed, and could easily be replacements for the pressure transducers in determining wave
front velocities. These ion detectors are durable and inexpensive compared to the pressure
sensors. The corona electrodes worked as designed during their short working life, but a failure
occurred in the high-voltage delivery system or the 1 inch corona electrodes. Several issues
were discovered that must be addressed before the engine can be considered to be a
successful demonstrator, but the numerous test runs did however show that the overall engine
design is durable, replicable and reliable in its present configuration. The engine was
disassembled to make room for another project and reassembled on a mobile test cart, with
considerable reduction in the footprint of the supporting subsystems. Operation of the mobile
re-assembled PDE is shown in Fig. 11.
Rotating Detonation Wave Engine Research
Although pulsed fuel injection with mechanical valves has been successfully demonstrated
with several different concepts for pulsed detonation engines (Refs. 18-19), cycle frequencies
hardly exceed 100 Hz in a single tube. The cycle frequency limit can be due to the valve itself or
the required purging and refilling time of the tube. A related and less developed engine concept,
the rotating detonation wave engine (RDE), employs one or more detonation waves rotating
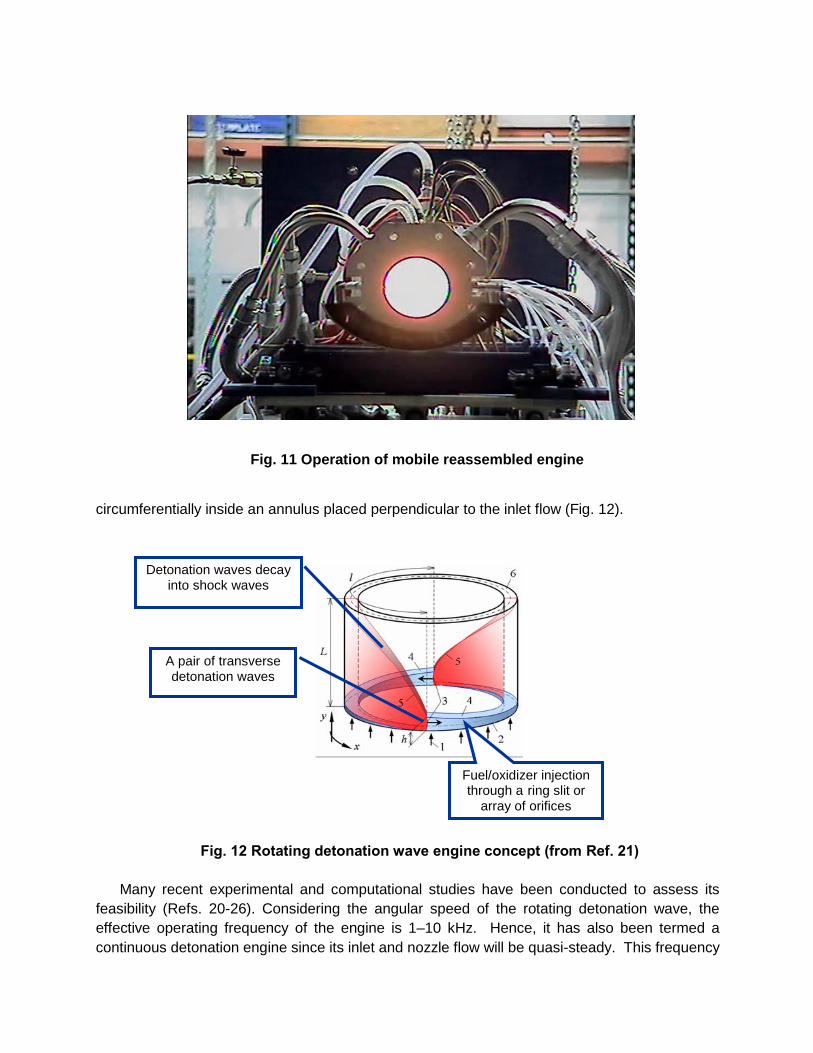
Fig. 11 Operation of mobile reassembled engine
circumferentially inside an annulus placed perpendicular to the inlet flow (Fig. 12).
Fig. 12 Rotating detonation wave engine concept (from Ref. 21)
Many recent experimental and computational studies have been conducted to assess its
feasibility (Refs. 20-26). Considering the angular speed of the rotating detonation wave, the
effective operating frequency of the engine is 1–10 kHz. Hence, it has also been termed a
continuous detonation engine since its inlet and nozzle flow will be quasi-steady. This frequency
Detonation waves decay into shock waves
A pair of transverse detonation waves
Fuel/oxidizer injection through a ring slit or
array of orifices
becomes important for satisfying flow requirements with side-mounted fuel injectors which
certainly must be able to cycle beyond mechanical valve limits. Although an air-breathing RDE
has yet to be experimentally tested, it can be expected that air should enter the annulus from an
axial direction to minimize flow losses.
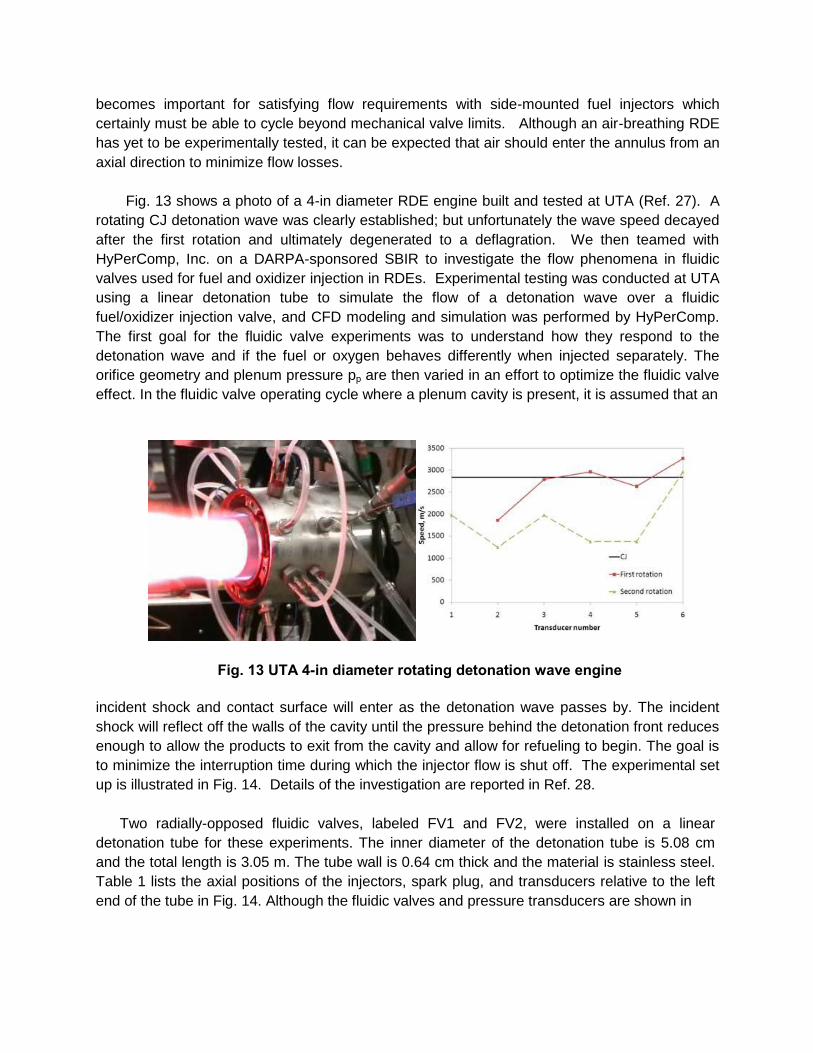
Fig. 13 shows a photo of a 4-in diameter RDE engine built and tested at UTA (Ref. 27). A
rotating CJ detonation wave was clearly established; but unfortunately the wave speed decayed
after the first rotation and ultimately degenerated to a deflagration. We then teamed with
HyPerComp, Inc. on a DARPA-sponsored SBIR to investigate the flow phenomena in fluidic
valves used for fuel and oxidizer injection in RDEs. Experimental testing was conducted at UTA
using a linear detonation tube to simulate the flow of a detonation wave over a fluidic
fuel/oxidizer injection valve, and CFD modeling and simulation was performed by HyPerComp.
The first goal for the fluidic valve experiments was to understand how they respond to the
detonation wave and if the fuel or oxygen behaves differently when injected separately. The
orifice geometry and plenum pressure pp are then varied in an effort to optimize the fluidic valve
effect. In the fluidic valve operating cycle where a plenum cavity is present, it is assumed that an
Fig. 13 UTA 4-in diameter rotating detonation wave engine
incident shock and contact surface will enter as the detonation wave passes by. The incident
shock will reflect off the walls of the cavity until the pressure behind the detonation front reduces
enough to allow the products to exit from the cavity and allow for refueling to begin. The goal is
to minimize the interruption time during which the injector flow is shut off. The experimental set
up is illustrated in Fig. 14. Details of the investigation are reported in Ref. 28.
Two radially-opposed fluidic valves, labeled FV1 and FV2, were installed on a linear
detonation tube for these experiments. The inner diameter of the detonation tube is 5.08 cm
and the total length is 3.05 m. The tube wall is 0.64 cm thick and the material is stainless steel.
Table 1 lists the axial positions of the injectors, spark plug, and transducers relative to the left
end of the tube in Fig. 14. Although the fluidic valves and pressure transducers are shown in

Fig. 14 Schematic of the linear detonation tube
Table 1 Axial position of the linear
detonation tube components
Component Axial distance (cm)
Spark plug 0
PCB 1 52.4
PCB 2 113.2
PCB 3 174.2
PCB 4 204.7
FV1, FV2 219.9
PCB 5 235.2
End; diaphragm 305.0
the same plane in this two-dimensional figure, the valves were actually placed perpendicularly
to the transducers on the circumference of the tube. PCB pressure transducers (model
111A24), rated for 7000 kPa, were used. The tube was evacuated to a pressure of about 10 torr
before the fuel and oxygen were added. Static pressure transducers (Omega model PX209-
060A5V) were mounted in the fill lines to record partial pressures for equivalence ratio
calculations. An automotive spark plug (Bosch model Platinum +2) was flush-mounted in the
center of the closed end of the tube. A Mylar diaphragm with a thickness of 100 µm was placed
between the end of the tube and the exhaust tank.
As shown in the schematic, the fluidic valve begins with an orifice mounted on the wall of the
tube. The orifice leads to a plenum cavity that operates at constant pressure. Upstream of the
cavity, the cross-sectional area is again reduced and connected to a high-pressure fitting. The
fluidic valve therefore has no moving parts. A computer-controlled, pneumatic gate valve was
connected to each in order to initiate fueling into the detonation tube just prior to ignition. Check
valves were also used to prevent a flashback from protruding through the cavity into the supply
lines. The detailed geometry of the fluidic valve cavities is shown in Fig. 15(a). The axial

coordinate system in the figure is relative to the surface of the detonation tube. The diameter of
the injector orifice was made variable as part of the parametric studies to be conducted. The
dimensions of the square cavity were fixed due to the size required for flush-mounted PCB
pressure transducers (labeled INJ1 and INJ2). The circles shown in the middle of the cavity
represent the diameter of the transducer faces. These transducers allow for the wave dynamics
in the cavity to be tracked. In each test, ignition and the operation of the fluidic valve were timed
so the detonation wave would pass over the injector orifice immediately after the gas pressure
had reached steady state. The detonation wave needed to be initiated immediately after the
steady-state pressure was reached so the overall pressure in the tube was not significantly
increased. Generally, a steady state was reached within 50 ms and the pressure rise measured
in the tube was minimal. It is important to note that the steady-state injector cavity pressure is
not a stagnation pressure due to the gas motion within. Consequently, the cavity pressure will
rise if the orifice flow is interrupted by the passage of the detonation wave.
(a) Geometry of the fluidic valve cavities (b) Pressure trace from a transducer mounted in the fluidic valve showing timing
(c) Fluidic valves before instrumentation. (d) Injector orifices.
Fig. 15 Fluidic valve assembly

Three sets of injectors were machined to connect with the square cavity and detonation tube
surface. Two sets of injectors consisted of a single hole with a diameter of 0.64 cm (0.25 in) or
0.32 cm (0.125 in). These diameters are larger than what has been used for previous RDE
studies, and the 0.64 cm diameter hole resembles operation with almost no reduction in orifice
area relative to the cavity. The third injector design consisted of an array of 25 evenly-spaced
0.5 mm diameter holes all positioned normal to the detonation tube surface. For air-breathing
RDEs, there may be a benefit if the injector diameters could be larger to reduce both flow losses
and machining expenses. However, large diameters may also create stronger transverse waves
or allow the detonation wave to propagate into the cavity. Figures 15(c) and 15(d) show
photographs of the valves and injector orifices. Note that Fig. 15(c) shows the injectors mounted
perpendicularly from the pressure transducers.
The fluidic valves were initially tested using all three injector designs to explore the effects of
cavity pressure. The initial tube pressure of the stoichiometric propane/oxygen mixture was
fixed at 120 kPa. Argon was supplied to the valve to simulate hydrocarbon fuels because of its
comparable molecular weight. An inert gas with no chance of combustion was considered
useful as a baseline. The first tests were run with the 0.32 cm diameter orifice and are
summarized in Figs. 16(a)–15(d). Figure 16(a) shows a typical pressure reading from the two
transducers in the square cavity shown in Fig. 15(a). In the figure, the cavity pressure is 620
kPa. The transducers indicated a shock wave traveling down the square channel before
reflecting off the end. The reflection created the 4100 kPa pressure spike. Subsequent
reflections were also measured until the pressure began to decrease at 0.105 s. The pressure
then was steady for about 0.5 ms before a rarefaction wave appeared as the flow began to
again move out of the fluidic valve. Figures 16(b)–16(d) depict the variation in the
valve/detonation wave interaction as the steady-state injection pressure was increased. Since a
comparison of pressure traces in the tube and cavity is desirable, the data from the transducer
downstream of the injector (PCB 5) was time shifted to match with the detonation wave over the
orifice. Hence there is a delay between the detonation wave front and the shock wave front in
the cavity because of the distance from the orifice to the first cavity transducer. During this
interaction, the chief concern is the time taken for the injector pressure to return a steady state
and the mechanisms involved. For a cavity pressure about twice that of the initial tube pressure
(Fig. 16(b)), it appears that multiple reflections occurred between 0.104–0.1043 s until the
pressure became equivalent with the main tube. Afterwards, a rarefaction wave propagates
through the cavity when the orifice flow becomes choked again as the cavity reaches steady
state conditions. If the steady-state injection pressure was raised, the time required to reach
that pressure again dropped. For example, the steady state in Fig. 16(d) is reached again in
about half the time as Fig. 16(b). This behavior inherently depends on the exponential decay of
the rarefaction wave where reaching lower pressures takes an increasingly long time. Note the
presence of a small spike in the rarefaction wave pressure in the middle of the detonation wave
trace. This stems from a reflected shock in the tube as the diaphragm bursts and is not related
to the fluidic valve actuation.
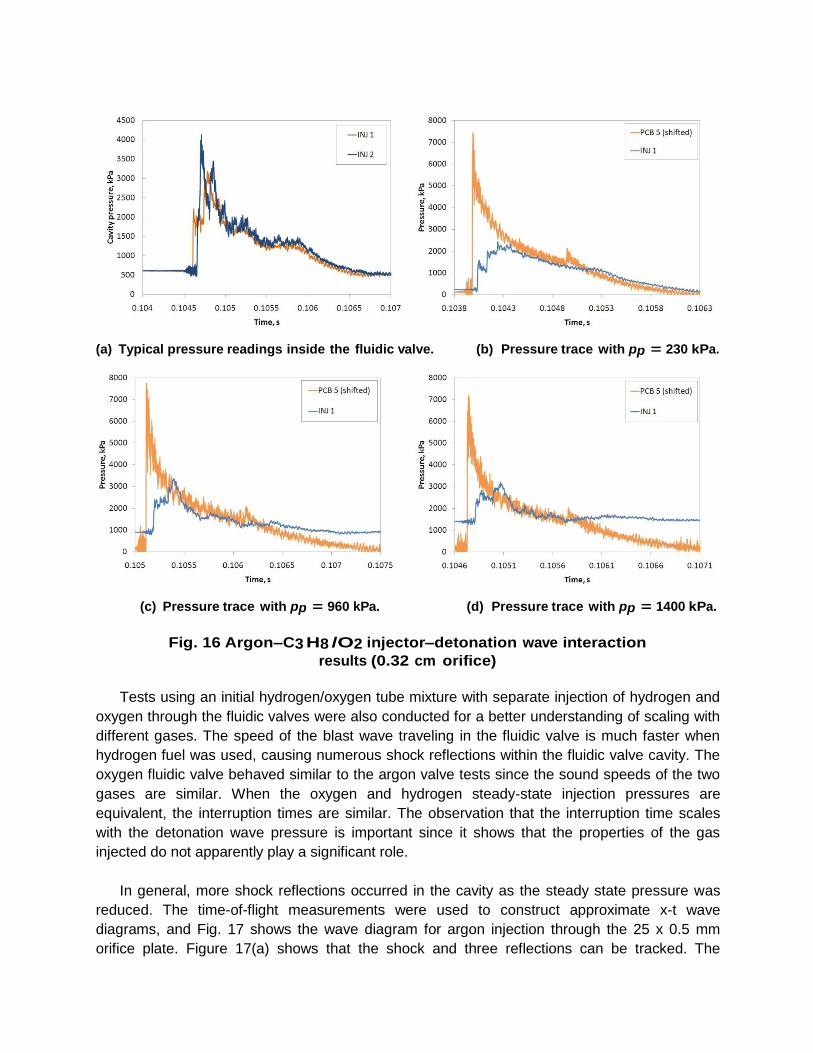
(a) Typical pressure readings inside the fluidic valve. (b) Pressure trace with pp = 230 kPa.
(c) Pressure trace with pp = 960 kPa. (d) Pressure trace with pp = 1400 kPa.
Fig. 16 Argon–C3 H8 /O2 injector–detonation wave interaction
results (0.32 cm orifice)
Tests using an initial hydrogen/oxygen tube mixture with separate injection of hydrogen and
oxygen through the fluidic valves were also conducted for a better understanding of scaling with
different gases. The speed of the blast wave traveling in the fluidic valve is much faster when
hydrogen fuel was used, causing numerous shock reflections within the fluidic valve cavity. The
oxygen fluidic valve behaved similar to the argon valve tests since the sound speeds of the two
gases are similar. When the oxygen and hydrogen steady-state injection pressures are
equivalent, the interruption times are similar. The observation that the interruption time scales
with the detonation wave pressure is important since it shows that the properties of the gas
injected do not apparently play a significant role.
In general, more shock reflections occurred in the cavity as the steady state pressure was
reduced. The time-of-flight measurements were used to construct approximate x-t wave
diagrams, and Fig. 17 shows the wave diagram for argon injection through the 25 x 0.5 mm
orifice plate. Figure 17(a) shows that the shock and three reflections can be tracked. The

reflections occur as the detonation wave pressure blocks the orifice flow, causing stagnation
conditions and a rise in the plenum pressure from its steady state value to the supply cylinder
value. Once the detonation wave pressure reduces to a low enough point, an expansion enters
the fluidic valve and causes all of the products to exit so refueling can begin. During this
process, the contact surface between the wave products and fuel is trapped in the cavity. When
the pressure is higher, only one reflection can be tracked. This occurs because the expansion
wave enters the fluidic valve much earlier. The Mach number of the incident shock also reduces
as the plenum pressure is raised. It is about 1.7 and 1.05 for Figs. 17(a) and 17(b), respectively.
(a) 380 kPa argon plenum cavity pressure (b) 2300 kPa argon plenum cavity pressure
Fig. 17 x–t diagrams of shock reflections in the valve cavity for argon,
25 x 0.5 mm injector
For this study, the interruption time is
defined as the time between the blast wave
front and the point where the plenum
pressure returns to its steady state value in
the fluidic valve (Fig. 18). As was
mentioned earlier, this interruption time is
not necessarily the backflow time. It is
limited in that it cannot be used to predict if
the steady-state flow is indeed comprised of
the detonation products or new propellants
since the contact surface position cannot be
directly measured. A true backflow time
measurement would require either a CFD
analysis or optical windows mounted on the
walls of the plenum cavity. However, this
definition of the interruption time is still
Fig. 18 Graphical method for
determining the interruption time
useful for comparisons between the experimental variables since the true backflow time and
interruption time as defined should follow the same overall trends. After calculating the
interruption time for many experimental conditions, it was found that the results could be placed

in a non-dimensional form to show the parameters that control the behavior of the fluidic valves.
The interruption time may be divided by the characteristic time of the gas dynamics in the main
detonation tube to form
int (1)/ CJ
t
L U
In Eq. (1), L is the distance from the ignition source to the fluidic valve orifice. The detonation
speed UCJ was calculated for each experiment using the time-of-flight method with the
transducers mounted along the main tube. Since the steady state injection pressure was one of
the main variables during testing, another non-dimensional term was created by dividing it by
the pressure ratio of the detonation wave.
0
0
/ (2)
/
pI
CJ CJ
p p
p p
The cavity and initial pressures are determined experimentally. The CJ wave pressure was
estimated with CEA (Ref. 29) using the molar ratio of the mixture in the tube prior to running.
Figure 19 shows the experimental data graphed with these parameters while comparing the
orifice geometry and fuel used. A linear trend is apparent between and Π. Every interruption
time measurement follows the linear trend, regardless if the injected gas was argon, oxygen, or
hydrogen. The two injector orifices used also follow the trend. Note that uncertainty in the data
is relatively high for 2.0 < < 2.5 due to the reflection that occurs in the main tube. For a rotating
detonation wave engine, the characteristic length L could be replaced with the circumference of
the annulus. If so, an optimal RDE fluidic valve mainly scales with detonation wave pressure,
injector pressure, and the frequency of the detonation wave.
(a) Orifice geometry comparison. (b) Fuel comparison.
Fig. 19 Dimensionless plots of interruption time versus
steady state injection pressure
The goal of this study was to understand how fuel injection for high-frequency RDEs or

PDEs may be accomplished since electromechanical valves likely cannot operate fast enough.
The approach taken centered upon what has been termed a fluidic valve, which incorporates a
plenum cavity that injects fuel at a steady state pressure and counteracts the detonation wave
pressure to ensure rapid refueling. Different fuels, orifice geometries, and plenum cavity
pressures were varied in several parametric studies. Early RDE studies have discussed the
possibility of backflow into the injectors from the detonation wave, but the effects and potential
solutions have not been well investigated. Pressure transducers were placed in the valve cavity
in order to understand the dynamics and interaction with a single-shot detonation wave traveling
in a linear tube. An interruption time was defined to measure the time required for the fluidic
valve to return to steady-state injection after the detonation front passes the injector orifice. The
metric is based solely on pressure readings, and a computational fluid dynamics study may be
required to reveal how this time corresponds to when fresh mixture also begins to flow out of the
valve again. The points below summarize the fluidic valve results:
• It appears possible to build a fluidic valve that can return to refueling at steady-state
conditions between detonation wave fronts. Although the single-shot experiments cannot
replicate operating frequencies that might be realized in an RDE, the fluidic valve was able
to interact with characteristic times of the detonation tube that correspond an operating
frequency of over 500 Hz. There is no current reason to believe that the orifice and cavity
geometry cannot be scaled to integrate with an RDE.
• Although different fuels and orifice geometries were used, the non-dimensional interruption
time plots show that this fluidic valve predominantly scales with a characteristic time of the
tube (or annulus) and the ratio of the injection pressure to the detonation wave pressure.
• Injectors with small sets of orifices with diameters in the 0.5 mm range have been used
previously with RDEs. Larger diameter orifices could be employed (although it is recognized
that small orifices may still be more suitable for mixing).
The study is currently being continued under a Phase II SBIR, with the goal of extending the
investigation to the interaction of a manifold of injectors being fed from a single plenum cavity. A
new test rig has been developed for this study that will permit optical access into the plenum
cavity.
Analytical and Computational Studies
Our initial effort in detonation wave research was primarily experimental and we relied on
external collaborators (Lockheed Martin Aeronautics and HyPerComp, Inc.) for analytical and
computational support. As we progressed further into detonation wave research, we extended
our in-house efforts to provide analytical and computational support. Several typical results from
this effort are discussed in this section.
Analytical Performance Models
We have developed several analytical models for PDEs and RDEs, both to provide better

understanding of the complex physics involved in these devices and to perform system
integration studies and performance predictions of propulsion systems based on either PDEs or
RDEs. Our initial analytical model for PDEs was based on the work of Endo and Fujawara
(Refs. 30-31). Their models have been implemented in the form of Excel spreadsheets and
MATLAB codes. An example of the Endo-Fujawara model used for prediction of the PDE end-
wall cyclic pressure and temperature variation is shown in Fig. 20. This particular calculation
was from a study of a hybrid PDE/Turbofan engine cycle with the PDE installed in the fan
bypass duct of a mixed-flow turbofan (Ref. 32).
(a) Pressure (b) Temperature
Fig. 20 End-wall pressure and temperature variations in a hybrid PDE/Turbofan engine
The Endo-Fujawara model for detonation wave properties in a constant area tube was
modified to accommodate the oblique shock and two-dimensional expansion occurring in the
rotating detonation wave model shown in Fig. 21 (Ref. 33), and performance estimates for an
ideal air-breathing RDE are shown in Fig. 22.
Fig. 21 Schematic of the rotating detonation wave structure
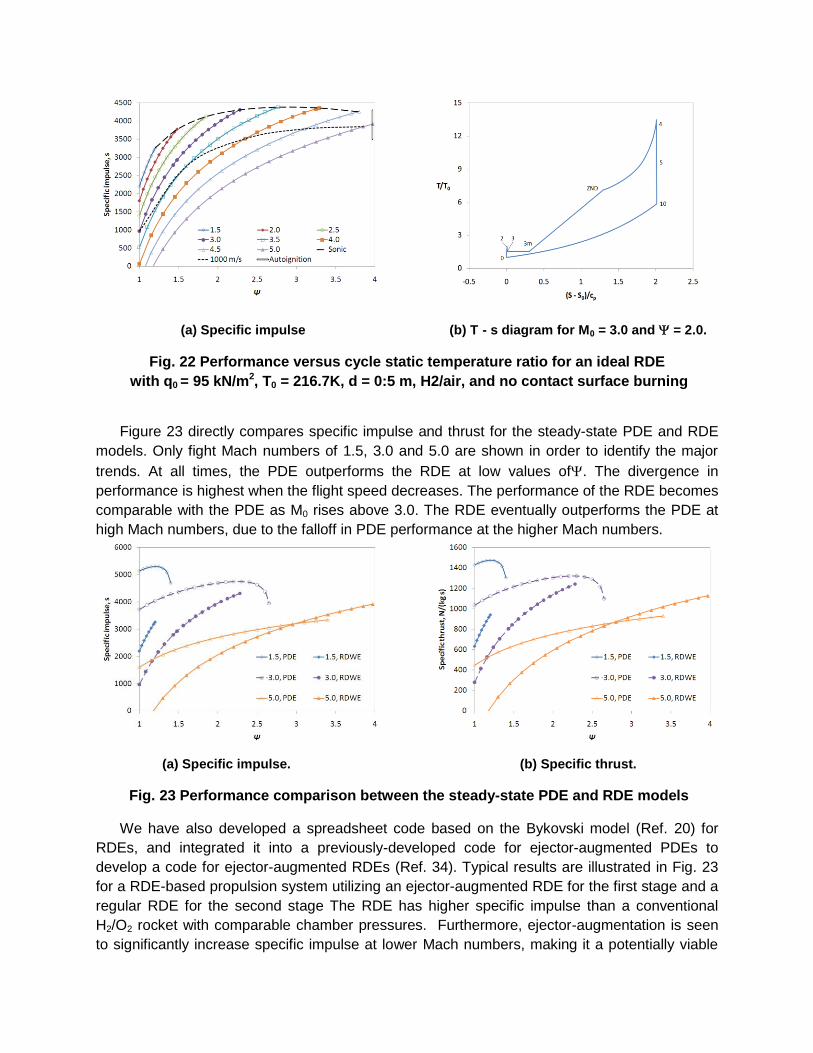
(a) Specific impulse (b) T - s diagram for M0 = 3.0 and = 2.0.
Fig. 22 Performance versus cycle static temperature ratio for an ideal RDE
with q0 = 95 kN/m2, T0 = 216.7K, d = 0:5 m, H2/air, and no contact surface burning
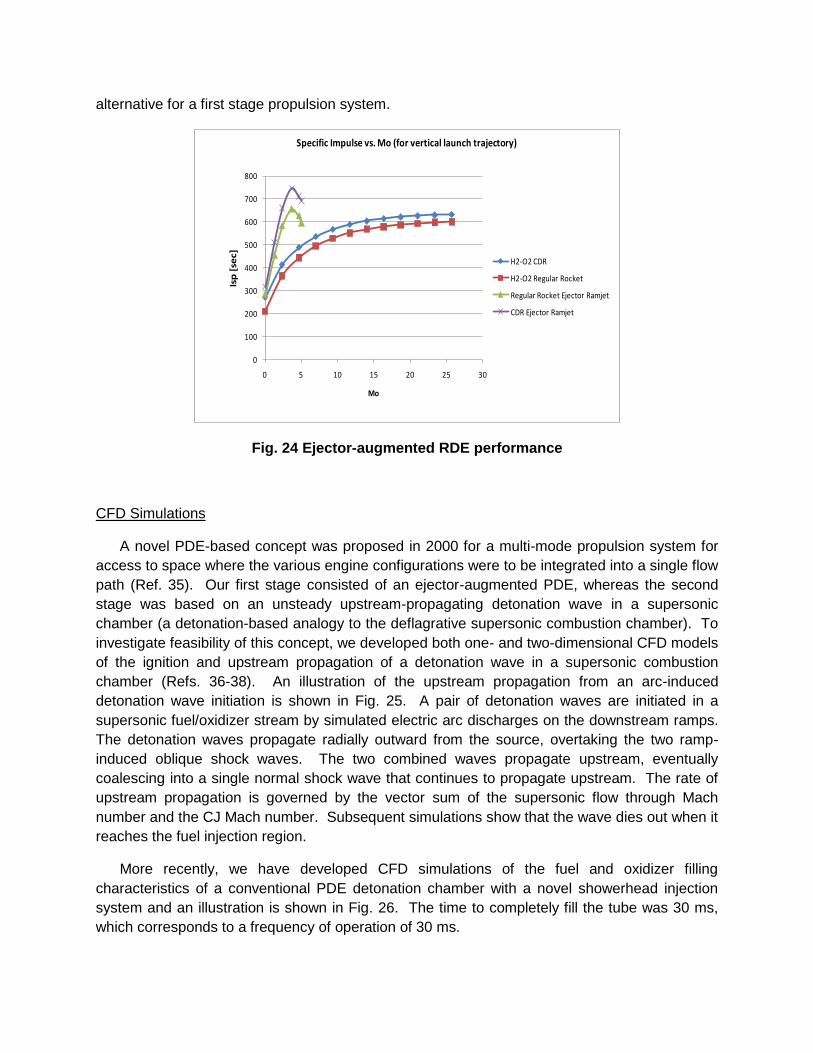
Figure 23 directly compares specific impulse and thrust for the steady-state PDE and RDE
models. Only fight Mach numbers of 1.5, 3.0 and 5.0 are shown in order to identify the major
trends. At all times, the PDE outperforms the RDE at low values of. The divergence in
performance is highest when the flight speed decreases. The performance of the RDE becomes
comparable with the PDE as M0 rises above 3.0. The RDE eventually outperforms the PDE at
high Mach numbers, due to the falloff in PDE performance at the higher Mach numbers.
(a) Specific impulse. (b) Specific thrust.
Fig. 23 Performance comparison between the steady-state PDE and RDE models
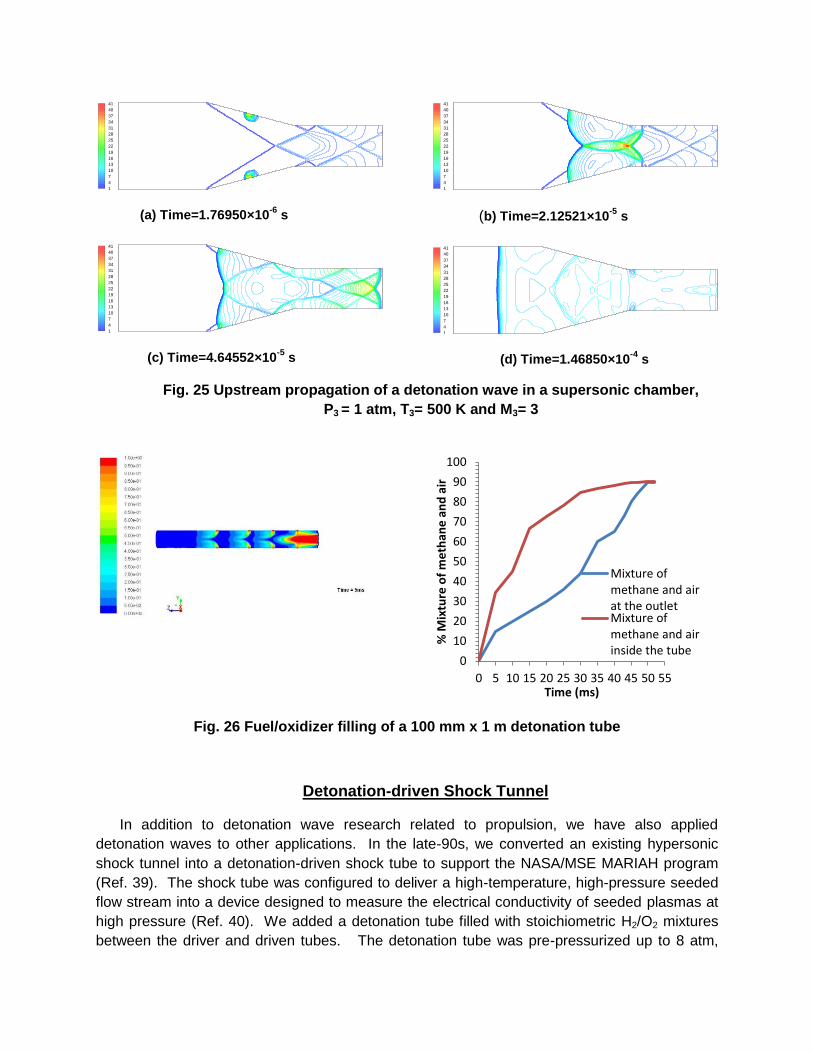
We have also developed a spreadsheet code based on the Bykovski model (Ref. 20) for
RDEs, and integrated it into a previously-developed code for ejector-augmented PDEs to
develop a code for ejector-augmented RDEs (Ref. 34). Typical results are illustrated in Fig. 23
for a RDE-based propulsion system utilizing an ejector-augmented RDE for the first stage and a
regular RDE for the second stage The RDE has higher specific impulse than a conventional
H2/O2 rocket with comparable chamber pressures. Furthermore, ejector-augmentation is seen
to significantly increase specific impulse at lower Mach numbers, making it a potentially viable
alternative for a first stage propulsion system.
Fig. 24 Ejector-augmented RDE performance
CFD Simulations
A novel PDE-based concept was proposed in 2000 for a multi-mode propulsion system for
access to space where the various engine configurations were to be integrated into a single flow
path (Ref. 35). Our first stage consisted of an ejector-augmented PDE, whereas the second
stage was based on an unsteady upstream-propagating detonation wave in a supersonic
chamber (a detonation-based analogy to the deflagrative supersonic combustion chamber). To
investigate feasibility of this concept, we developed both one- and two-dimensional CFD models
of the ignition and upstream propagation of a detonation wave in a supersonic combustion
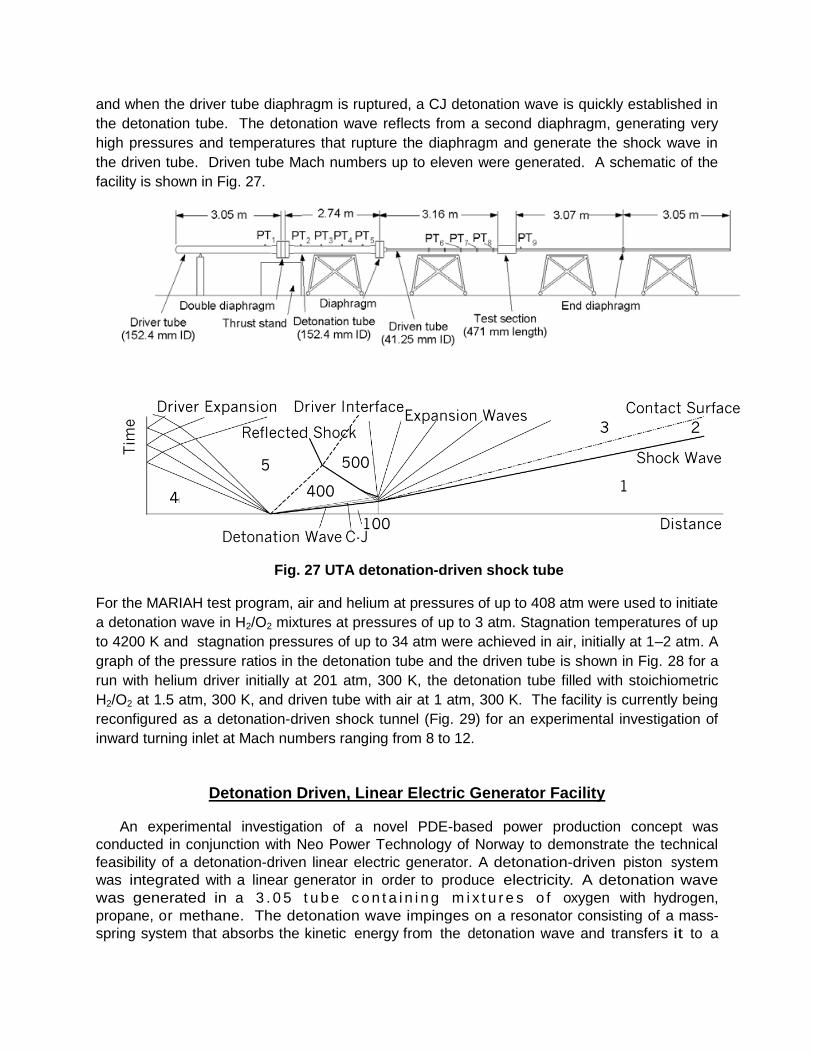
chamber (Refs. 36-38). An illustration of the upstream propagation from an arc-induced
detonation wave initiation is shown in Fig. 25. A pair of detonation waves are initiated in a
supersonic fuel/oxidizer stream by simulated electric arc discharges on the downstream ramps.
The detonation waves propagate radially outward from the source, overtaking the two ramp-
induced oblique shock waves. The two combined waves propagate upstream, eventually
coalescing into a single normal shock wave that continues to propagate upstream. The rate of
upstream propagation is governed by the vector sum of the supersonic flow through Mach
number and the CJ Mach number. Subsequent simulations show that the wave dies out when it
reaches the fuel injection region.
More recently, we have developed CFD simulations of the fuel and oxidizer filling
characteristics of a conventional PDE detonation chamber with a novel showerhead injection
system and an illustration is shown in Fig. 26. The time to completely fill the tube was 30 ms,
which corresponds to a frequency of operation of 30 ms.
0
100
200
300
400
500
600
700
800
0 5 10 15 20 25 30
Isp
[se
c]
Mo
Specific Impulse vs. Mo (for vertical launch trajectory)
H2-O2 CDR
H2-O2 Regular Rocket
Regular Rocket Ejector Ramjet
CDR Ejector Ramjet
(a) Time=1.76950×10⁻⁶
s
(c) Time=4.64552×10⁻⁵
s
(b) Time=2.12521×10⁻⁵
s
(d) Time=1.46850×10⁻⁴
s
Fig. 25 Upstream propagation of a detonation wave in a supersonic chamber,
P3 = 1 atm, T3= 500 K and M3= 3
Fig. 26 Fuel/oxidizer filling of a 100 mm x 1 m detonation tube
Detonation-driven Shock Tunnel
In addition to detonation wave research related to propulsion, we have also applied
detonation waves to other applications. In the late-90s, we converted an existing hypersonic
shock tunnel into a detonation-driven shock tube to support the NASA/MSE MARIAH program
(Ref. 39). The shock tube was configured to deliver a high-temperature, high-pressure seeded
flow stream into a device designed to measure the electrical conductivity of seeded plasmas at
high pressure (Ref. 40). We added a detonation tube filled with stoichiometric H2/O2 mixtures
between the driver and driven tubes. The detonation tube was pre-pressurized up to 8 atm,
41
40
37
34
31
28
25
22
19
16
13
10
7
4
1
41
40
37
34
31
28
25
22
19
16
13
10
7
4
1
41
40
37
34
31
28
25
22
19
16
13
10
7
4
1
41
40
37
34
31
28
25
22
19
16
13
10
7
4
1
0
10
20
30
40
50
60
70
80
90
100
0 5 10 15 20 25 30 35 40 45 50 55
% M
ixtu
re o
f m
eth
ane
an
d a
ir
Time (ms)
Mixture ofmethane and airat the outletMixture ofmethane and airinside the tube
and when the driver tube diaphragm is ruptured, a CJ detonation wave is quickly established in
the detonation tube. The detonation wave reflects from a second diaphragm, generating very
high pressures and temperatures that rupture the diaphragm and generate the shock wave in
the driven tube. Driven tube Mach numbers up to eleven were generated. A schematic of the
facility is shown in Fig. 27.
Fig. 27 UTA detonation-driven shock tube
For the MARIAH test program, air and helium at pressures of up to 408 atm were used to initiate
a detonation wave in H2/O2 mixtures at pressures of up to 3 atm. Stagnation temperatures of up
to 4200 K and stagnation pressures of up to 34 atm were achieved in air, initially at 1–2 atm. A
graph of the pressure ratios in the detonation tube and the driven tube is shown in Fig. 28 for a
run with helium driver initially at 201 atm, 300 K, the detonation tube filled with stoichiometric
H2/O2 at 1.5 atm, 300 K, and driven tube with air at 1 atm, 300 K. The facility is currently being
reconfigured as a detonation-driven shock tunnel (Fig. 29) for an experimental investigation of
inward turning inlet at Mach numbers ranging from 8 to 12.
Detonation Driven, Linear Electric Generator Facility
An experimental investigation of a novel PDE-based power production concept was
conducted in conjunction with Neo Power Technology of Norway to demonstrate the technical
feasibility of a detonation-driven linear electric generator. A detonation-driven piston system
was integrated with a linear generator in order to produce electricity. A detonation wave
was generated in a 3 . 0 5 t u b e c o n t a i n i n g m i x t u r e s o f oxygen with hydrogen,
propane, or methane. The detonation wave impinges on a resonator consisting of a mass-
spring system that absorbs the kinetic energy from the detonation wave and transfers it to a

linear electric generator. A detailed description of the research program and discussion of the
test results can be found in Ref. 41, and are briefly summarized below.
(a) Detonation tube (b) Driven tube
Fig. 28 Shock tube pressure trace
(a) Test section (b) Detonation tube, diaphragm section and Driver tube
Fig. 29 Detonation-driven hypersonic shock tunnel
Two test rigs were constructed to demonstrate the feasibility of the detonation-driven linear
generator. The first consisted of a single mass, two-spring system and was used to explore the
detonation wave interaction. A piston is mounted on one end of a linear detonation tube. An
automotive spark plug (Bosch Platinum +4) ignites the mixture c r ea t i ng a de t o na t i on
wa ve which strikes the piston. The piston then acts as the free mass in a two-spring system.
The basic concept of the single mass, two spring system is illustrated in Fig. 30.
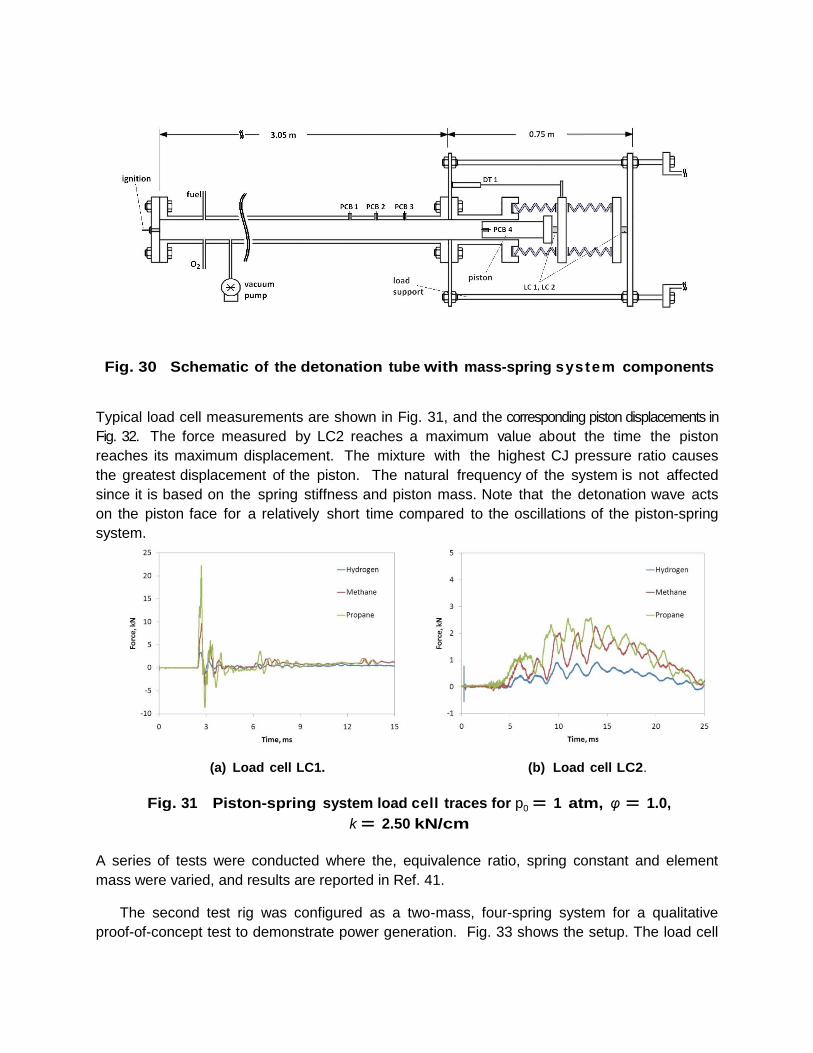
Fig. 30 Schematic of the detonation tube with mass-spring system components
Typical load cell measurements are shown in Fig. 31, and the corresponding piston displacements in
Fig. 32. The force measured by LC2 reaches a maximum value about the time the piston
reaches its maximum displacement. The mixture with the highest CJ pressure ratio causes
the greatest displacement of the piston. The natural frequency of the system is not affected
since it is based on the spring stiffness and piston mass. Note that the detonation wave acts
on the piston face for a relatively short time compared to the oscillations of the piston-spring
system.
(a) Load cell LC1. (b) Load cell LC2.
Fig. 31 Piston-spring system load cell traces for p0 = 1 atm, φ = 1.0,
k = 2.50 kN/cm
A series of tests were conducted where the, equivalence ratio, spring constant and element
mass were varied, and results are reported in Ref. 41.
The second test rig was configured as a two-mass, four-spring system for a qualitative
proof-of-concept test to demonstrate power generation. Fig. 33 shows the setup. The load cell

(a) Piston displacement comparison. (b) Displacement and pressure data for the methane case.
Fig. 32 Piston-spring system displacement traces for
p0 = 1 atm, φ = 1.0, k = 2.50 kN/cm
LC2 was removed and a new load plate was added that allowed for a spring to be placed
through the center. A LinMot P01–23x80 linear motor was placed between the two low k
springs and mounted on Lexan windows secured to the new load plate. The slider for the linear
motor contains neodymium magnets, and it can generate up to a 44 N force. The input wiring to
the motor was rearranged into the two-phase generator circuit shown in Fig. 34. The power
generated from each phase of the motor, which contains a frequency dependent on that of the
slider-spring system, is rectified and filtered to a DC signal. Low voltage diodes and capacitors
were used.
Fig. 33 Schematic of the linear power generator setup
The overall efficiency contribution from the detonation wave acting on the piston was low, but
not totally unexpected for such a preliminary facility, Regarding future work, several steps must
be taken to further develop this detonation-driven, linear electric generator concept:
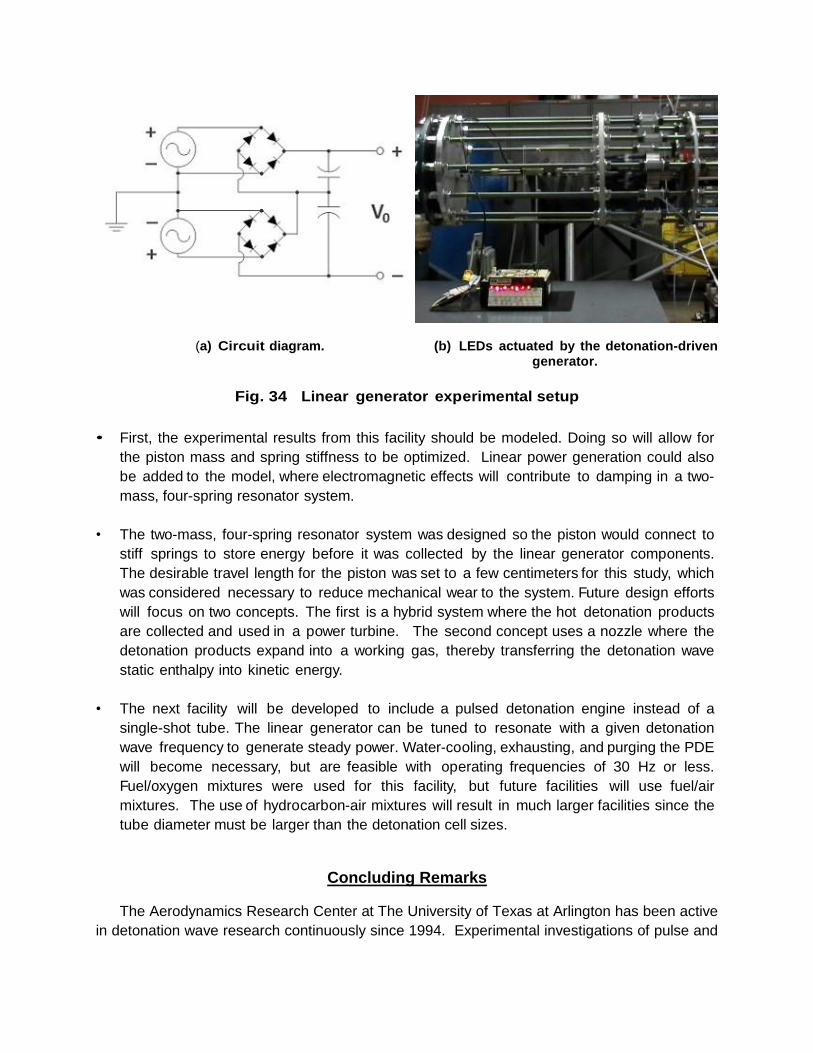
(a) Circuit diagram. (b) LEDs actuated by the detonation-driven
generator.
Fig. 34 Linear generator experimental setup
• First, the experimental results from this facility should be modeled. Doing so will allow for
the piston mass and spring stiffness to be optimized. Linear power generation could also
be added to the model, where electromagnetic effects will contribute to damping in a two-
mass, four-spring resonator system.
• The two-mass, four-spring resonator system was designed so the piston would connect to
stiff springs to store energy before it was collected by the linear generator components.
The desirable travel length for the piston was set to a few centimeters for this study, which
was considered necessary to reduce mechanical wear to the system. Future design efforts
will focus on two concepts. The first is a hybrid system where the hot detonation products
are collected and used in a power turbine. The second concept uses a nozzle where the
detonation products expand into a working gas, thereby transferring the detonation wave
static enthalpy into kinetic energy.
• The next facility will be developed to include a pulsed detonation engine instead of a
single-shot tube. The linear generator can be tuned to resonate with a given detonation
wave frequency to generate steady power. Water-cooling, exhausting, and purging the PDE
will become necessary, but are feasible with operating frequencies of 30 Hz or less.
Fuel/oxygen mixtures were used for this facility, but future facilities will use fuel/air
mixtures. The use of hydrocarbon-air mixtures will result in much larger facilities since the
tube diameter must be larger than the detonation cell sizes.
Concluding Remarks
The Aerodynamics Research Center at The University of Texas at Arlington has been active
in detonation wave research continuously since 1994. Experimental investigations of pulse and
rotaating detonation wave engines have been conducted, together with analytical and
computational simulations. In addition, detonation wave research has been applied to the
development of a hypersonic detonation-driven shock tube and shock tunnel, as well as a linear
power generation concept. Currently, we are involved in a DARPA Phase II program to extend
the research described earlier on fluidic fuel injection systems for continuous detonation wave
engines. We are also preparing our detonation-driven shock tunnel for initial operation and
continuing our analysis of detonation-based high-speed propulsion systems.
References
1. Stanley, S.B., Stuessy, W.S. and Wilson, D.R., "Experimental investigation of pulse detonation wave
phenomenon," AIAA Paper 95-2197, 1995.
2. Stanley, S.B., Burge, K.R. and Wilson, D.R., "Experimental investigation of pulse detonation wave
phenomenon as related to propulsion applications," AIAA Paper 95-2580, 1995.
3. Stuessy, W.S. and Wilson, D.R., "Experimental investigation of a multi-cycle pulsed detonation wave
engine," AIAA Paper 96-0346, 1996.
4. Stuessy, W.S. and Wilson, D.R., "Experimental investigation of an annular pulse detonation wave
engine," AIAA Paper 97–0808, 1997.
5. Stuessy, W.S. and Wilson, D.R., "Influence of nozzle geometry on the performance of a pulse
detonation wave engine," AIAA Paper 97–2745, 1997.
6. Lu F.K. and Jensen D.S. "Potential viability of a fast-acting micro-solenoid valve for pulsed detonation
fuel injection," AIAA Paper 2003–0888, 2003.
7. Lu, F.K., Meyers, J.M. and Wilson, D.R., “Experimental study of propane-fueled pulsed detonation
rocket,” AIAA Paper 2003–6974, 2003.
8. Lu, F.K., Meyers, J.M. and Wilson, D.R., “Experimental study of a pulse detonation rocket with
Shchelkin spiral,” Paper No. 1054, 24th International Symposium on Shock Waves, July 11–16, 2004,
Beijing, China.
9. Panicker, P.K., New, T., Lu, F.K., and Tsai, H., "Experimental Investigations on DDT enhancements
by Shchelkin spirals in a PDE," AIAA Paper 2006-552, 2006.
10. Panicker, P.K., Wilson, D.R., and Lu, F.K., "Operational issues affecting the practical implementation
of Pulse Detonation Engines," AIAA Paper 2006-7959, 2006.
11. New, T., Panicker, P.K., Chui, K., Tsai, H., and Lu, F.K., "Experimental study on deflagration-to-
detonation transition enhancement methods in a PDE," AIAA Paper 2006-7958, 2006.
12. Panicker, P.K., Li, J., Lu, F.K., and Wilson, D.R., "Development of a compact liquid fueled PDE with
predetonator,” AIAA Paper 2007-237, 2007.
13. Panicker, P. K., Lu, F. K. and Wilson, D. R., "Practical issues in ground testing of pulsed detonation
engines," 2007 ASME International Mechanical Engineering Congress and Exposition, November 10-
16, 2007, Seattle, Washington.
14. Panicker, P.K., Lu, F.K., and W ilson, D.R., “Practical methods for reducing the deflagration-to-
detonation transition length for pulse detonation engines,” ISAIF9 Paper 6C-2, 2009.
15. Kuo, K. K., Principles of Combustion, Wiley, New York, 2nd ed., 2005.
16. Lu, F.K., Carter, J.D., and Wilson, D.R., “Development of a Large Pulse Detonation Engine
Demonstrator,” AIAA Paper 2011-5544, 2011.
17. Carter, J.D., and Lu, F.K., “Experiences in Testing of a Large-Scale, Liquid-Fueled, Air-Breathing,
Pulse Detonation Engine,” AIAA Paper 2011-6089, 2011.
18. Kailasanath, K., “Recent Developments in the Research on Pulse Detonation Engines,” AIAA Journal,
Vol. 41, No. 2, 2003, pp. 145–159.

19. Roy, G. D., Frolov, S. M., Borisov, A. A., and Netzer, D. W., “Pulse Detonation Propulsion:
Challenges, Current Status, and Future Perspective,” Progress in Energy and Combustion Science,
Vol. 30, No. 6, 2004, pp. 545–672.
20. Bykovskii, F. A., Zhdan, S. A., and Vedernikov, E. F., “Continuous Spin Detonations,” Journal of
Propulsion and Power , Vol. 22, No. 6, 2006, pp. 1204–1216.
21. Davidenko DM, Gökalp I, Kudryavtsev AN, “Numerical study of continuous detonation wave rocket
engine,” AIAA Paper 2008–2680, 2008.
22. Hishida, M., Fujiwara, T., and Wolanski, P., “Fundamentals of Rotating Detonations,” Shock Waves,
Vol. 19, No. 1, 2009, pp. 1–10.
23. Kindracki, J., Wolanski, P., and Gut, Z., “Experimental Research on the Rotating Detonation in
Gaseous Fuels-Oxygen Mixtures,” Shock Waves, Vol. 21, No. 2, 2011, pp. 75–84.
24. Zhdan, S. A., “Mathematical Model of Continuous Detonation in an Annular Combustor with a
Supersonic Flow Velocity,” Combustion, Explosion, and Shock Waves, Vol. 44, No. 6, 2008, pp. 690–
697.
25. Yi, T.-H., Lou, J., Turangan, C., Choi, J.-Y., and Wolanski, P., “Propulsive Performance of a
Continuously Rotating Detonation Engine,” Journal of Propulsion and Power , Vol. 27, No. 1, 2011,
pp. 171–181.
26. Schwer, D. A. and Kailasanath, K., “Numerical Investigation of Rotating Detonation
Engines,” AIAA Paper 2010-6880, 2010.
27. Braun, E.M., Dunn, N.L., and Lu, F.K., “Testing of a continuous detonation wave engine with swirled
injection,” AIAA Paper 2010-0146, 2010.
28. Braun, E.M., Balcazar, T.S., Wilson, D.R., and Lu, F.K., “Experimental Study of a High-Frequency
Fluidic Valve Fuel Injector,” AIAA Paper 2011-5545, 2011.
29. Gordon, S. and McBride, B. J., “Computer Program for Calculation of Complex Chemical Equilibrium
Compositions, Rocket Performance, Incident and Reflected Shocks, and Chapman-Jouguet
Detonations,” NASA SP-273, 1971.
30. Endo, T. and Fujiwara, T., A simplified analysis on a pulse detonation engine model," Transactions of
the Japan Society for Aeronautical and Space Sciences, Vol. 44, No. 146, 2002, pp. 217-222.
31. Endo, T., Kasahara, J., Matsuo, A., Inaba, K., Sato, S., and Fujiwara, T., “Pressure History at the
Thrust Wall of a Simplified Pulse Detonation Engine,” AIAA Journal , Vol. 42, No. 9, 2004, pp.
1921–1930.
32. Sivarai, A.K., “Parametric and performance analysis of a hybrid pulse detonation/turbofan engine,”
M.S. Thesis, The University of Texas at Arlington, 2011.
33. Braun, E. M., Lu, F. K., Wilson, D. R., and Camberos, J. A., “Airbreathing Rotating Detonation
Wave Engine Cycle Analysis,” AIAA Paper 2010-7039, 2010.
34. Cao, H., “Analytical parametric cycle analysis of continuous rotating detonation ejector-augmented
rocket engine,” M.S. Thesis, The University of Texas at Arlington, 2011.
35. Wilson, D.R., Lu, F.K., Kim, H., and Munipalli, R., “Analysis of a Pulsed Normal Detonation Wave
Engine Concept,” AIAA Paper 2001-1784, 2001.
36. Yi, T.-H., Anderson, D.A., Wilson, D.R. and Lu, F.K., “Numerical Study of Two-Dimensional Viscous,
Chemically Reacting Flow,” AIAA Paper 2005–4868, 2005.
37. Yi, T.-H., Wilson, D.R. and Lu, F.K., “Numerical study of unsteady detonation wave propagation in a
supersonic combustion chamber,” Paper No. 10041, 25th International Symposium on Shock Waves,
July 17–22, 2005, Bangalore, India.
38. Yi, T.H., Wilson, D.R. and Lu, F.K., “Detonation wave propagation in an Ejector-Augmented Pulse
Detonation Rocket,” AIAA Paper 2006–0953, 2006.
39. Simmons, G.A., “Overview of the NASA MARIAH Project and summary of technical results,” AIAA
Paper 1998-2752, 1998.

40. Stuessy, W.S., Liu, H.C., Lu, F.K. and Wilson, D.R., “Initial Operation of a High-Pressure, Detonation-
Driven Shock Tube Facility,” AIAA Paper 97-0665, 1997.
41. Braun, E.M., Lu, F.K., Sagov, M.S., Wilson, D.R., and Grubyi, P., “Proof-of-principle detonation
driven, linear electric generator facility,” AIAA Paper 2010-6767, 2010.