summary of main indicators {years} - pacific-crvs.org statistics reporti… · web viewthe...
TRANSCRIPT

DRAFT VITAL STATISTICS REPORT TEMPLATE{Country} VITAL STATISTICS REPORT{YEARS}
{insert Picture}
{Department(s)}
This report was compiled by: {Authors name (affiliation), etc}
Published by: {Department Name}
Work for this project was supported by the Brisbane Accord Group of agencies under the Pacific Vital Statistics Action Plan and the Pacific Ten-Year Statistics Strategy.
© {Insert Department} {YEAR}

SUMMARY OF MAIN INDICATORS {YEARS}Indicator Value/Total Male FemalePopulation, residents onlyBirth registration completeness Death Registration completenessTotal number of birthsBirths attended by skilled personnelSex ratio at birth, M:F N/A N/ACrude Birth Rate (CBR) N/A N/ATotal Fertility rate N/A N/AAdolescent birth rate (per 1,000 females) N/A N/ATotal number of deathsCrude Death Rate (CDR) N/A N/AUnder 5 mortality rate (per 1,000 live births)
N/A N/A
Infant mortality rate (per 1,000 live births) N/A N/ANeonatal mortality rate N/A N/AMaternal deaths N/A N/AMaternal mortality ratio (per 100,000 live births)
N/A N/A
Life expectancy at birthLife expectancy at age 40 (e/40)Adult mortality rate, (45q15)Proportion of ill-defined deaths

ACKNOWLEDGEMENTParties that have contributed to the development of the vital statistics report should be mentioned here. This includes those who have contributed financially as well as those who have provided technical input to its development. Acknowledging the contribution of all those involved, (institutions) is an important way of improving working relations of the relevant stakeholders..

EXECUTIVE SUMMARY{What vital statistics are, why vital statistics are important for health policy, planning and program evaluation, plus broader application of vital statistics}
Sample textVital statistics constitute the collection of statistics on vital events in a lifetime of a person as well as relevant characteristics of the events themselves and of the person and persons concerned (UN, 2014). There are ten vital events recognized by the United Nations1. This report presents statistics pertaining to two vital events namely Live births and deaths. The report also provides statistics on causes of death, which are often recorded along with the characteristics of death. Vital statistics provide crucial and critical information on the population in a country. Accurate data on births, deaths, and causes-of-death by age group and sex are critical for: Accurate data on births, deaths and cause-of-death by age group and sex are critical for monitoring population health, identifying health priorities and evaluating the impact of health programs. This data is also important for providing basic population statistics, and planning and monitoring for a broad range of social and development programmes including, education, housing, social security and child protection.
Civil registration and vital statistics (CRVS) data are particularly important in the Pacific in the context of policy and planning and for meeting international commitments to monitor progress towards the 2030 sustainable development goals (SDGs) including tracking improvements in maternal and child health, understanding low life expectancies (which have had limited improvements over the last 20 years), and evaluating the success of programs enacted to combat non-communicable diseases (NCD’s) as a major public health emergency in the region.
{About this report – i.e. is this the first one, what years does it cover, who was it written by (institution), why is this report important in your country etc.}
{Scope of the report – which vital events does it cover, for which years and why. Here it is important to mention that the data on births is limited to live births only and therefore doesn’t include still births and foetal deaths}
{Where does the data come from, how is it collected, and broadly how complete and accurate is it – why should you trust this data}
{Key findings of interest related to births and fertility – increase or decrease in births, age patterns of women giving birth, trends over time etc.}
{Key findings of interest related to mortality –what is the age distribution of deaths, what are the regional/geographical variations, is life expectancy increasing/ decreasing, is infant and child mortality high or low etc;
{Key findings of interest related to causes of death - what is the key group of causes of premature deaths (those younger than 60)- i.e. infectious diseases, non-communicable diseases or injury}, what are the age and sex differentials in the leading causes of death etc.;
{What are the key policy implications or recommendations from the findings}
1

Table of contents
{Insert a contents table. The table of contents provides a summary of key themes and sub-themes covered in the vital statistics report. An example is provided below}
CONTENTSAcknowledgement......................................................................................................................... 3Executive Summary....................................................................................................................... 4List of Tables.................................................................................................................................... 7List of Figures.................................................................................................................................. 7List of abbreviations and acronyms......................................................................................... 8Chapter 1: Introduction and Methodology............................................................................91.1 Introduction.....................................................................................................................................91.2 Data and Methodology....................................................................................................................9
Data Sources.....................................................................................................................................9Coverage and Completeness...........................................................................................................10Birth Registration completeness......................................................................................................10Death registration and recording completeness.............................................................................11
1.3 Analysis..........................................................................................................................................11Chapter 2: Births and Fertility................................................................................................. 132.1 Birth by selected variables.............................................................................................................13
Number of Births.............................................................................................................................13Place of Birth...................................................................................................................................14Births by Age of Mother..................................................................................................................15Birth by birth weight.......................................................................................................................16Birth by gestational age..................................................................................................................17Live births by place of occurrence and place of usual residence of mother.....................................18Live births by population/ ethnicity group.......................................................................................18
2.2 Key fertility indicators....................................................................................................................19Crude Birth Rate..............................................................................................................................19Age-Specific Fertility Rates..............................................................................................................20Total Fertility Rates.........................................................................................................................21
Chapter 3. Mortality.................................................................................................................... 223.1 Deaths by selected variables.........................................................................................................22
Number of Deaths...........................................................................................................................22Deaths by age and sex of decedent.................................................................................................22Death by population group/ethnicity..............................................................................................23Deaths by place of occurrence and place of usual residence of decedent.......................................23Deaths by place of usual residence and sex of decedent.................................................................24
3.2 Summary Measures of Mortality...................................................................................................24Crude Death Rate (CDR) and Age Standardised Mortality Rate (ASMR)..........................................24Life Expectancy at Birth...................................................................................................................25
Infant and Child Mortality...................................................................................................................25Infant Mortality...............................................................................................................................25Neonatal Mortality..........................................................................................................................26Under 5 Mortality Rate (U5M)........................................................................................................27Age Specific Mortality.....................................................................................................................27Adult Mortality................................................................................................................................29Maternal Mortality..........................................................................................................................30Life Expectancy at 40 (LE40)..............................................................................................................30
Chapter 4: Causes of Death....................................................................................................... 31

4.1 Natural and non-natural causes of death......................................................................................314.2 Leading underlying natural causes of Death (all ages)...................................................................314.3 Underlying Natural causes of death by key age groups.................................................................32
Mortality in Children Aged 0-4 years...............................................................................................32Mortality in Children Aged 5-14 years.............................................................................................33Causes of death in Adults Aged 15-59 years....................................................................................33Mortality in Older Adults (Aged 60+ Years).....................................................................................34
4.4 Underlying natural causes of death by region of occurrence (Main geographical divisions).........354.5. Adult Mortality from Non-Communicable Diseases (NCDs).........................................................36
Cause-specific proportional mortality.............................................................................................36Cause-specific mortality rates from selected NCD’s........................................................................37Age-standardised mortality from NCD’s..........................................................................................37The probability of dying among adults aged 30-69 years (inclusive) from designated NCDs – WHO Indicator..........................................................................................................................................38
CONCLUSIONS (Recommendations and Policy Implications).......................................39References...................................................................................................................................... 40APPENDICES.................................................................................................................................. 41Appendix 1: Statistical Tables..............................................................................................................41
POPULATION ESTIMATES................................................................................................................41BIRTHS.............................................................................................................................................41DEATHS...........................................................................................................................................41CAUSE OF DEATHS (by ICD General mortality list – 103 causes)......................................................41POPULATION ESTIMATES................................................................................................................42BIRTHS.............................................................................................................................................42DEATHS...........................................................................................................................................42CAUSE OF DEATHS (by ICD General mortality list – 103 causes)......................................................43
Appendix 2: Standard Tabulations of Cause of Death from the International Statistics Classification of Diseases and Related Health Problems, 10th Revision (ICD-10, 2010 edition).....................................46
General Mortality List 1: 103 Cause List..........................................................................................46Appendix 3: Key Concepts and Definitions..........................................................................................49

LIST OF TABLES{Provide a summary list of the tables presented in the report. An example is provided below}
Table 1: Birth registration completeness (%) by period, (YEARS)........................................................11Table 2: Birth registration completeness (%) by region over 3-year period, (YEARS)..........................11Table 3: Death registration completeness (%) by 3 year period, (YEARS)............................................12Table 4: Total Number of Births by Sex per Year, 2007-2012..............................................................14Table 5: Average Number of births per year by 3 year period, 2007-2012..........................................14Table 6: Number of Births by Place of Birth and 3 Year Period, 2007-2012.........................................15Table 7: Percent Distribution of births by Age of mother, {Years}.......................................................16Table 8: Percent Distribution of births by birth weight category, {Years}............................................17Table 9: Percent Distribution of births by length of gestation in weeks, {Years}.................................18Table 10: Distribution of births place of occurrence and mothers place of usual residence, {Years}. .19Table 11: Percent Distribution of births by population/ethnic group, {Years}.....................................19Table 12: Crude Birth Rate with 95% Confidence Intervals by 3 year period, 2007-2012....................20Table 13: Age-specific fertility rates, {Years}.......................................................................................21Table 14: Total Fertility Rates (including 95% Confidence Intervals), {Years}......................................21Table 15: Total Number of Deaths by Sex and Year, {Years}................................................................22Table 16: Average Number of Deaths per year by {number- 3 or 5} year period, {Years}...................22Table 17: Deaths by age and sex of the deceased {Years}...................................................................22Table 18: Deaths by population/ethnic group of deceased {Years}.....................................................23Table 19: Deaths by place of occurrence and place of usual residence of deceased {Years}...............23Table 20: Deaths by usual residence and sex of decedent {Years}......................................................24Table 21: Crude death rate & Age standardised mortality Rate by period, {Years}.............................24Table 22: Life Expectancy at Birth (LE0), {Years}...................................................................................25Table 23: Infant Mortality Rates (deaths in children under age 1 per 1000 live births, including 95% Confidence Intervals), {Years}..............................................................................................................25Table 24: Neonatal Mortality Rates (deaths in live-born infants during the first 28 days of life per 1,000 live births, including 95% Confidence Intervals), {Years}...........................................................26Table 25: Under 5 Mortality Rates (deaths in children under age 5 per 1,000 live births, including 95% Confidence Intervals), {Years}..............................................................................................................27Table 26: Age Specific Mortality Rate (deaths per 1,000 people) by Sex and period, {Years}..............27Table 27: Adult Mortality (%) by sex and period, including 95% Confidence Intervals {Years}............29Table 28: Number of maternal deaths, maternal mortality ratio, and maternal mortality rate by period {Years}......................................................................................................................................30Table 29: Life Expectancy at 40 (LE40) by sex and period, including 95% Confidence Intervals {Years}30Table 30: Number of natural and non-natural deaths, {Years}............................................................31Table 31: Ten Leading Causes of Deaths (by ICD General Mortality List 1) by Sex, {Years}..................31Table 32: Cause specific Mortality by ICD {chapter or General mortality list 1} (deaths per 100,000 population, including 95% Confidence Intervals), 0-4 year olds (both sexes combined) {Years}.........32Table 33: Cause specific Mortality by ICD {chapter or General mortality list 1} (deaths per 100,000 population, including 95% Confidence Intervals), 5-14 year olds (both sexes combined) {Years}.......33

LIST OF FIGURES {Provide a summary list of the figures presented in the report. An example is provided below}
Figure 1: Diagram of the reporting and registration processes for births...........................................10Figure 2: Diagram of the reporting and registration processes for deaths..........................................11Figure 3: Average births per year (rolling average by 3 year period): (Years)......................................14Figure 4: Percent Distribution of Births by Place of Birth and 3 Year Period, 2007-2012....................15Figure 5: Percent Distribution of births by age of mother, {Years}......................................................16Figure 6: Crude Birth Rate Over 3 Year Periods with 95% Confidence Intervals: 2007-2012...............20Figure 7: Under 5 Mortality Rates (deaths in children under age 5 per 1,000 live births, including 95% Confidence Intervals), {Years}..............................................................................................................27Figure 8: Age Specific Mortality Rates by period, {years – most recent period}..................................28

LIST OF ABBREVIATIONS AND ACRONYMS{Provide a description of the acronyms and abbreviations used in the vital statistics report. An example is provided below, based on the abbreviations and acronyms used in this document}
CBR Crude Birth Rate
CDR Crude Death Rate
COD Cause of Death
CR Civil Registration
CRO Central Registration Office
CRVS Civil Registration and Vital Statistics
NSDS National Strategy for Development of Statistics
NSO National Statistics Office
TFR Total Fertility Rate
UN United Nations
UNICEF United Nations Children’s fund
WHO World Health Organization

CHAPTER 1: INTRODUCTION AND METHODOLOGY 1.1. Introduction
{What vital statistics are, why vital statistics are important for health policy, planning and program evaluation, the broader uses of vital statistics.}
{The practical applications of vital statistics in the country, which are the key beneficiary sectors and how does the country stand to lose if such statistics are not produced}
{About this report – i.e. is this the first one, what years does it cover, which vital events does it cover, who was it written by, why is this report important in your country etc.}
{About the country – population size/ location / key health and development concerns/ logistics issues – i.e. population distribution, which population groups does the data cover, where is the data sourced from, is data reporting complete in remote regions etc. – depending on audience}.
{What is the focus /objective of the report?}
Sample text
The objective of the report is :
• To present statistics on live births and deaths by selected socio-demographic and geographic characteristics for the years (state the period); and trends in mortality over a (state the period); and
• To present the causes of death for (state the period); based mainly on the underlying causes of death.
{Organisation and presentation of the report. A brief summary of what is contained in the following sections/ chapters of the report}
1.2. Data and Methodology Data Sources
{Where does the data come from (what source) – how is it collected (see an example of how the birth and death registration processes can be plotted in Figure 1), which are the key institutions involved and what are their responsibilities, Is there legislation or policy that requires births and deaths to be reported and which law, what is the frequency of such collection. (Provide an appendix of data collection forms used for different vital events where possible}}
Figure 1: Diagram of the reporting and registration processes for births2
Figure 2: Diagram of the reporting and registration processes for deaths
2 Include reference

Coverage and Completeness
{Coverage and Completeness are essential indicators of the quality of the data presented. Define what events were registered/recorded – i.e. residents only, all events on island, and what happens with overseas events – such as deaths of people who are referred overseas for medical treatment, Describe the levels of completeness (provide geographic differentials where possible)}.
Sample textCoverage and completeness levels are essential measures of how well the CRVS system is functioning.
Completeness is achieved when every vital event that has occurred to the members of the population of a particular country (or area), within a specified time period, has been registered in the system i.e. has a vital event registration record. Completeness is measured by the proportion of vital events that are legally registered.
Coverage refers to the total geographical area covered by the civil registration system. Ideally, the civil registration system should capture vital events occurring in every geographical area and in every population group of the country.
Coverage and completeness levels are essential in the interpretation of vital statistics and enabling their comparability, nationally as well as internationally.
Birth Registration completeness
{Describe how completeness was calculated and whether any adjustments were subsequently made to future calculations
Table 1: Birth registration completeness (%) by period, (YEARS)
Period
Estimated total number of births*
Number of registered births
Proportion of all births registered*
Number of births recorded (total)*
Estimated Proportion of all births recorded
* Registration is used to refer to events documented by civil registry while Recorded refers to events events documented by the health department
{Include in your discussion whether there was any difference in reporting completeness by age, sex or geography}
Table 2: Birth registration completeness (%) by region over 3-year period, (YEARS)
Period Region 1 Region 2… Proportion of all births registered

Death registration and recording completeness
{Describe how completeness was calculated and whether any adjustments were subsequently made to future calculations}.
Table 3: Death registration completeness (%) by 3 year period, (YEARS)
Period
Estimated total number of deaths* Number of
registered deaths
Proportion of all deaths registered
Number of deaths recorded (total)*
Estimated Proportion of all deaths recorded
* {Describe this source - is it health department recording? A combined list etc?}
{Include in your discussion whether there was any difference in reporting completeness by age, sex or region. These tables should be in the appendix unless there are particular findings of interest}
1.3. Analysis {Briefly describe how the analysis was conducted, mention the software used or relevant methods applied}.
Sample textBirth and death data in the first two chapters (respectively) is analysed by levels, trends and cross-tabulated by selected socio-demographic variables mainly age, sex, and geography. The second section of each of the chapters presents key demographic indicators (the formulas applied for each indicator are presented in Appendix x). The section on causes of death was computed by ranking the underlying causes of death and providing the proportions of deaths due to specific causes,
In order to minimise instability in the figures due to the small size of the population and subsequently the risk of misleading interpretation, data has been aggregated over {INSERT 3 or 5 years} year periods for calculation of all rates and trend analysis. Rolling averages have also been presented to examine trends over time. Confidence intervals are presented to highlight the uncertainty in the data. These were calculated using Poisson distributions for all rates, except crude birth and death rates where confidence intervals were calculated using normal distributions, {confirm this based on what you did} due to the small number of events.
Age-standardisation for mortality was done using the most recent period {INSERT YEARS} as the standard, in order to examine changes in mortality trends separately from any changes in the population age structure.
Life tables were calculated from empirical data using the Chiang method [#], and were also smoothed for missing data using Modmatch [#]. Confidence intervals for life expectancy, based on the variance of probability of surviving, were also calculated using the Chiang Method [#].
Cause of death data was extracted from death records with medical certificates and was tabulated by {department} to the general Mortality List 1 (104 causes) of the International Classification of Diseases v10 [#] seen in Appendix 2.

CHAPTER 2: BIRTHS AND FERTILITY2.1. Birth by selected variables
Number of Births
{ Give the average births per year, along with other interesting information such as whether there has been any significant change over time}
Table 4: Total Number of Births by Sex per Year, 2007-2012
Year of birth
Sex Grand totalMale Female Unknown
2007 1010 1003 201 22142008 1008 1001 200 22092009 1006 999 200 22052010 1004 997 199 22002011 1002 995 199 21962012 1000 993 199 2192Grand total 6030 5988 1198 13216
Table 5: Average Number of births per year by 3 year period, 2007-2012
Period Average number of births per year
2007 - 2009 22092010 - 2012 2196
The sex ratio at birth is {insert result}. This means that for every 100 live female births, there were {insert} live male births over the same time period. {Elaborate in context of country.}
{Describe trend in absolute number of births}
2008 2009 2010 201121002120214021602180220022202240226022802300
2209 2205 2200 2196
Year
Aver
age
num
ber o
f birt
hs
Figure 3: Average births per year (rolling average by 3 year period): (Years)

Place of Birth
{Describe whether births usually occur in a health facility or elsewhere and whether mothers are frequently referred overseas to give birth. Include a table looking at number and proportion of births in country vs. overseas if not all births occur in the country). If a substantial number of births occur away from health care facilities, include a table of number and proportion of births in hospital compared to births at home/ other)
Table 6: Number of Births by Place of Birth and 3 Year Period, 2007-2012
3 year periodPlace of birth
Grand total
Home Hospital Other Unknown2007-2009 100 5000 15 1513 6628
2010-2012 80 5500 12 996 6588
Grand total 180 10500 27 2509 13216
{Describe the findings and relate any changes over time to changes in the health care system. Graph using a line graph if there is a story here}.
2007-2009
2010-2012
0% 10% 20% 30% 40% 50% 60% 70% 80% 90% 100%
HospitalHomeUnknown
Figure 4: Percent Distribution of Births by Place of Birth and 3 Year Period, 2007-2012
Births by Age of Mother
{Child bearing age is generally considered to be from 15 to 49 years of age. Babies born to mothers outside this age range are possible but not common. {Comment on why births at some age groups are higher risk than others}
Table 7: Percent Distribution of births by Age of mother, {Years}

Mothers' Age-group (years) 2007-2009 2010-2012
<15 0.0 0.015-19 5.8 5.320-24 29.8 28.825-29 32.4 31.830-34 19.4 21.235-39 9.2 9.540-44 3.1 3.045-49 0.3 0.250+ 0.0 0.0Grand Total 100.0 100.0
<15 15-19 20-24 25-29 30-34 35-39 40-44 45-49 50+0.0
5.0
10.0
15.0
20.0
25.0
30.0
35.0
2007-20092010-2012
Mothers' age groups (years)
Perc
ent o
f birt
hs
Figure 5: Percent Distribution of births by age of mother, {Years}
{use a pie chart if this is only available for one period and a histogram if comparing two or more periods to show the changes in age distribution over time}
{Comment on whether the pattern of mothers’ age group has changed over time and whether there are high levels of adolescent births}.
Birth by birth weight
{Describe the characteristics of birth by birth weight and other relevant socio-economic variables such as place of residence of mother. The birth weight may be categorised into Low birth weight i.e. <2.5kg vs other.}
Table 8: Percent Distribution of births by birth weight category, {Years}
Period of Birth
Proportion of children (%) by Birth WeightGrand Total
< 2.5 kg2.5 kg or higher
Unknown
2007-2009 3.4 36.0 60.62010-2012 4.1 41.5 54.4
{Describe and graph these findings as appropriate}

2007-2009
2010-2012
0% 10% 20% 30% 40% 50% 60% 70% 80% 90% 100%
5%
6%
95%
94%Birth Weight < 2.5 kg
Birth Weight 2.5 kg or higher
Figure 6: ….
Birth by gestational age
{Describe the characteristics of birth by gestational age and other relevant socio-economic variables such as place of residence of mother.
Table 9: Percent Distribution of births by length of gestation in weeks, {Years}
Period of BirthProportion of children (%) by Gestation in weeks Grand
Total<37 37 or more
2007-2009 10.5 89.5 100.02010-2012 9.9 90.1 100.0
{The period of birth can be defined by Preterm births vs other. Preterm refers to childbirth occurring at less than 37 completed weeks or 259 days of gestation. If sufficient information is known – you may wish to break this down into further categories based on risk as defined by the WHO: extremely preterm (<28 weeks), very preterm (28 to <32 weeks); moderate to late preterm (32 to <37 weeks).} {Describe and graph these findings as appropriate}
{Describe and graph these findings as appropriate}
2007-2009
2010-2012
0% 10% 20% 30% 40% 50% 60% 70% 80% 90% 100%
10.5
9.9
89.5
90.1Gestation in weeks <37
Gestation in weeks 37 or more
Figure 7: ….

Live births by place of occurrence and place of usual residence of mother
{Describe the distribution of births by the place of occurrence and place of usual residence of the mother. Which province accounts for the highest proportion of births? Are there significant variations in births by place of occurrence and usual residence of mother within the provinces. The number of births occurring abroad and to persons from abroad may also be captured here in the category of “foreign”. }.
Table 10: Distribution of births place of occurrence and mothers place of usual residence, {Years}
Province (use relevant geographical boundary)
Province of birth occurrence
Province of usual residence of mother
Number Percentage Number Percentage
Province 1Province 2Province 3Province 4Province 5Foreign Unspecified TOTAL
Live births by population/ ethnicity group
Describe the distribution of births by the major population or ethnic groups. Which groups account for the highest proportion of deaths.
Table 11: Percent Distribution of births by population/ethnic group, {Years}
Population / ethnic group
Number of death
Percentage of deaths
Population group size
Percentage of population group
Group 1Group 2Group 3Group 4Group 5Total
2.2. Key fertility indicators Crude Birth Rate
{What is crude birth rate and why do we measure it. Discuss the trend. If CBR is increasing or decreasing is this because the number of births is changing substantially (refer to the number of births in the previous section) or is it because of changes in the population size – i.e. out-migration. You will also need to state whether the rates have been inflated due to low coverage}
Sample text The crude birth rate is the number of births per 1,000 population over a given period of time. Crude birth rates are important because they tell us how much our population is growing or decreasing. They can also

help us plan for the future so we can know how many children will be entering school in the coming years, or how many adults will be entering the workforce.
Table 12: Crude Birth Rate with 95% Confidence Intervals by 3 year period, 2007-2012
Period Crude birth rate
2007-2009 22.1 (22.2-23.0)2010-2012 20.0 (19.1-20.8)
2007-2009 2010-201217.0
18.0
19.0
20.0
21.0
22.0
23.0
24.0
25.0
3 year periods
Birt
hs p
er 1
,000
pop
ulati
on
Figure 8: Crude Birth Rate Over 3 Year Periods with 95% Confidence Intervals: 2007-2012
{Discuss the trend. If CBR is increasing or decreasing is this because the number of births is changing substantially (look at previous section) or is it because of changes in the population size – i.e. out-migration}
Age-Specific Fertility Rates
Fertility rates by age of mothers, or age-specific fertility rates, are the number of births occurring to mothers of a certain age group per 1,000 women in that age group in a given period of time. {Comment on how fertility rates by age are calculated}
Table 13: Age-specific fertility rates, {Years}
Mothers' Age-group (years)
Period
2007-2009 2010-2012
15-19 29 2920-24 149 16925-29 172 18830-34 119 13835-39 63 7240-44 21 2445-49 2 2Grand Total 555 621

{if adolescent births are high – refer findings for this age group against the MDG goals and possibly compare to neighbouring countries}
Total Fertility Rates
The total fertility rate (TFR) is the average number of children a woman would give birth to during her lifetime if she were to pass through her childbearing years experiencing the present day age-specific fertility rates.
{How total fertility is calculated and why this measure is important – refer to working table in appendix}
Table 14: Total Fertility Rates (including 95% Confidence Intervals), {Years}
PeriodTotal Fertility Rate (TFR) Confidence interval range
2007- 2009 2.8 (2.7 - 2.8)
2010-2012 3.1 (3.1 -3.2)
{Comment on what the fertility rates mean in terms of population growth/ change – and therefore provision of services. Compare figure to the most recent census and/or survey and discuss plausibility}

CHAPTER 3. MORTALITY 3.1. Deaths by selected variables
Number of Deaths
{Description including total deaths and most recent average. Discuss any events (such as natural disasters etc) which would have had a significant effect on the number of deaths for that year}
Table 15: Total Number of Deaths by Sex and Year, {Years}
Year Male Female Total2007 3602 2757 63592008 3520 2951 64712009 3480 2924 64042010 3289 2888 61772011 3660 2992 66522012 3757 3007 6764 Total 21308 17519 38827
Table 16: Average Number of Deaths per year by {number- 3 or 5} year period, {Years}
Time period Male Female Total
2007-2009 3534 2877 6411
2010-2012 3430 2921 6351
Figure 9: Average deaths per year (rolling average by 3-5 year period): (Years)
{Describe the trend in death over time. What Is the pattern, has there been an increase or decline in the levels of mortality over the past years}
{Describe trend over time}
Deaths by age and sex of decedent
{Description of distribution of deaths by age and sex over the past three years. Which age group has the highest and least number of deaths for each sex? Which of the two sexes has a higher number of deaths; describe differences in the pattern of death by sex in different age groups}
Table 17: Deaths by age and sex of the deceased {Years}
Age group Male Female Total <28 days

28 days to <1,1-45-910-1415-1920-2425-2930-3435-3940-4445-4950-5455-5960-6465-6970-7475+
Death by population group/ethnicity
Describe the distribution of deaths by the major population or ethnic groups. Which groups account for the highest proportion of deaths.
Table 18: Deaths by population/ethnic group of deceased {Years}
Population / ethnic group
Number of death
Percentage of deaths
Population group size
Percentage of population group
Group 1
Group 2
Group 3
Group 4
Group 5
Total
Deaths by place of occurrence and place of usual residence of decedent
{Describe the distribution of deaths by the place of occurrence and place of usual residence of the deceased. Which province accounts for the highest proportion of deaths? Are there significant variations in deaths by place of occurrence and usual residence of deceased within the provinces. The number of deaths occurring abroad and to persons from abroad may also be captured here in the category of “foreign”. }.
Table 19: Deaths by place of occurrence and place of usual residence of deceased {Years}
Province (use relevant Province of death Province of usual residence of

geographical boundary) occurrence decedentNumber Percentage Number Percentage
Province 1
Province 2
Province 3
Province 4
Province 5
Foreign
Unspecified
TOTAL
Deaths by place of usual residence and sex of decedent
{Describe the distribution of deaths by the usual place of residence of the deceased; categorised by the sex of the deceased. Describe any significant differences in the `distribution of males vs female deaths in any of the regions}.
Table 20: Deaths by usual residence and sex of decedent {Years}
Place of usual residence (use relevant geographical boundary)
Sex of decedentMales Females Total
Province 1Province 2Province 3Province 4Province 5
3.2. Summary Measures of MortalityCrude Death Rate (CDR) and Age Standardised Mortality Rate (ASMR)
Sample text
The following table presents both the crude death rate (deaths per 1,000 population) and the age standardised death rate. Age standardized death rates are one country’s age specific death rates applied to a standard age distribution. Age standardised rates allow the comparison of death rates over time or between two different populations without the age structure of the populations influencing the death rates. This is important as a greater proportion of older people in the population structure (as health conditions improve and people live longer) would actually result in a higher number of deaths (as everyone must eventually die). Populations with a greater proportion of older people have higher crude death rates than populations comprised of young people under identical health and social conditions.

Data has been age standardised to the most recent period shown using the WHO World Standard Population. {note also whether data was adjusted for undercount}.
Table 21: Crude death rate & Age standardised mortality Rate by period, {Years}
PeriodCrude death rate (95% CI)
Age-standardized death rate (95% CI)
2007-2009 3534 2877 64112010-2012 3430 2921 6351
{Comment on findings, include any trends over time and whether they were due to age (i.e. not reflected in the standardised rates) or were a geniune shift in health status.}
Life Expectancy at Birth
Life expectancy at birth indicates the average number of years a newborn infant would live if the current patterns of mortality at the time of its birth were to remain the same throughout its life.
Partner agencies are able to help countries with these calculations.
{This section should mention the method used – I.e. direct calculation or were the estimates smoothed. What does LE show over time and in relation to regional norms - is it plausible (see NMDI}
Table 22: Life Expectancy at Birth (LE0), {Years}
Periods Male Female Both2007-2009 3534 2877 64112010-2012 3430 2921 6351
3.3. Infant and Child MortalityInfant Mortality
The Infant Mortality Rate shows the number of infant deaths (deaths in children under age 1) a year per 1,000 live births for a given period.
Table 23: Infant Mortality Rates (deaths in children under age 1 per 1000 live births, including 95% Confidence Intervals), {Years}
Period IMR2007-2009 36.7 (25.8-50.5)2010-2012 18.0 (10.8-28.1)

Figure 6: Infant Mortality Rates (deaths in children under age 1 per 1000 live births, including 95% Confidence Intervals), {Years}
{Comment on trends, link these to MDG goals, and compare to findings from the most recent census}
Neonatal Mortality
The neonatal mortality rate is the number of deaths in live-born infants during the first 28 days of life per 1,000 live births over a specified time period. Mortality during the neonatal period (the first 28 days of life) accounts for a large proportion of child deaths, and is considered to be a useful indicator of maternal and newborn neonatal health and care. Generally, As IMR falls (for example through major improvements in environment, immunisation and nutrition), and fewer deaths are attributed to infectious diseases and environmental influences, a greater proportion of infant deaths would be expected to occur in the neonatal period. The neonatal mortality rate, however, should not increase as this occurs.
Table 24: Neonatal Mortality Rates (deaths in live-born infants during the first 28 days of life per 1,000 live births, including 95% Confidence Intervals), {Years}
Period NMR2007-2009 10.2 (4.5 - 19.7)2010-2012 12.3 (6.6 - 21.1)
{Comment on trends, link these to what is happening with IMR as a whole, if possible – also include these in figure 10}

Under 5 Mortality Rate (U5M)
The Under 5 Mortality Rate is measured as the number of deaths in children under age 5 per 1,000 live births in a given period.
Table 25: Under 5 Mortality Rates (deaths in children under age 5 per 1,000 live births, including 95% Confidence Intervals), {Years}
Period U5M2007-2009 38.7 (27.5-52.8)2010-2012 22.7 (14.6-33.8)
2008-2010 2011-20130.05.0
10.015.020.025.030.035.040.045.0
Under 5 Mortality Rate with 95% Confidence Interval by 3 Year Period, 2008-2013
U5M
Period Years
Dea
ths
in c
hild
ren
unde
r age
5 y
ears
per
1,0
00 li
ve b
irths
Figure 7: Under 5 Mortality Rates (deaths in children under age 5 per 1,000 live births, including 95% Confidence Intervals), {Years}
{Comment on trends, link these to what is happening with IMR as a whole, compare to U5M from the most recent census}
Age Specific Mortality
An age specific mortality rate is the number of deaths per 1,000 people of a given age group in a given time period. {Describe the usual pattern of age specific mortality- ie most deaths in the young and old, more deaths in males than females}
Table 26: Age Specific Mortality Rate (deaths per 1,000 people) by Sex and period, {Years}
Age group
Male Female Both sexes
Period 12007-2009
Period 2 2010-2012
Period 12007-2009
Period 22010-2012
Period 12007-2009
Period 22010-2012
0-4 8.9 5.9 5.1 3.4 7.1 4.75-9 0.5 0.6 0.6 0.0 0.5 0.3

10-14 0.9 1.2 0.3 0.6 0.6 0.915-19 1.6 1.4 0.7 0.8 1.2 1.120-24 1.6 2.7 1.3 2.7 1.5 2.725-29 3.1 4.8 3.5 4.0 3.3 4.430-34 5.4 7.1 2.6 3.4 4.0 5.335-39 8.8 11.5 2.8 3.2 6.0 7.340-44 10.3 13.5 11.6 8.2 11.0 10.945-49 18.9 18.2 10.4 11.8 14.4 14.950-54 34.6 38.0 23.3 29.1 28.6 33.255-59 29.5 28.6 28.1 25.4 28.8 26.960-64 60.4 52.5 14.7 16.5 36.3 32.065-69 89.8 98.0 53.7 65.5 69.1 78.570-74 70.7 84.8 36.6 62.9 51.8 72.275+ 108.5 105.7 106.0 101.7 107.2 103.4
0 1 - 4 5 - 14 15 - 24 25 - 34 35 - 44 45 - 54 55 - 64 65 - 74 75+0
1
10
100
1000
2004-2006
2007-2009
2010-2012
Age groups
Figure 8: Age Specific Mortality Rates by period, {years – most recent period}

0-4 5-9 10-14
15-19
20-24
25-29
30-34
35-39
40-44
45-49
50-54
55-59
60-64
65-69
70-74
75+0
0
1
10
100
1000
MaleFemale
Age groups
Figure 9: Age Specific Mortality Rates by sex, { most recent period}
{insert line graph of most recent period age-specific rates on a log scale for males and females.
{Comment on the plausibility of the pattern of deaths for males/ females and by age – for each time period, and what this means about data quality/ reporting completeness – including whether data is good enough to use for life tables or whether it should be smoothed out}. You should graph all periods to check plausibility and completeness of the pattern – but other periods can be included in the appendices unless there is a specific story of interest to warrant their inclusion in the main body of the report}
Adult Mortality
Adult mortality is the probability of dying between the ages of 15 to 59 inclusive, or the probability of a 15-year-old dying before reaching the age of 60. The table below shows adult mortality by period and sex.
Table 27: Adult Mortality (%) by sex and period, including 95% Confidence Intervals {Years}
Period Male 45q15 Female 45q15 Both sexes 45q15
{Discuss trends in adult mortality – is it getting higher or lower, how do males compare to females, is data plausible – how do these figures compare to the latest census values for adult mortality. Also consider comparing to relevant countries - ie Australia or New Zealand, the US, neighbouring Pacific countries - to highlight disparities and provide context}
Maternal Mortality
A maternal death is defined by the WHO as the death of a woman while pregnant or within 42 days of termination of pregnancy, irrespective of the duration and site of the pregnancy, from any cause

related to or aggravated by the pregnancy or its management but not from accidental or incidental causes. The maternal mortality ratio (MMR) is the ratio of the number of maternal deaths during a given time period per 100,000 live births during the same time-period. A l ive birth is defined by the WHO as the complete expulsion or extraction from its mother of a product of conception, irrespective of the duration of the pregnancy, which, after such separation, breathes or shows any other evidence of life - e.g. beating of the heart, pulsation of the umbilical cord or definite movement of voluntary muscles - whether or not the umbilical cord has been cut or the placenta is attached. Each product of such a birth is considered live born.
Table 28: Number of maternal deaths, maternal mortality ratio, and maternal mortality rate by period {Years}
Period Number of maternal deaths
Maternal Mortality Ratio
Maternal Mortality Rate
Life Expectancy at 40 (LE40)
Life expectancy at 40 years of age is also an indicative measure on premature mortality. This is the number of years a person aged 40 would be expected to live, on average, if they continued to experience current mortality rates.
Table 29: Life Expectancy at 40 (LE40) by sex and period, including 95% Confidence Intervals {Years}
Period Male LE40 Female LE40 Both Sexes LE40
{comment on how long a 40 year old is expected to live – in comparison to other pacific island countries, Australia and NZ or the US)

CHAPTER 4: CAUSES OF DEATH4.1. Natural and non-natural causes of death
{Describe the distribution of natural and non-natural cases of death. Are there any changes in the pattern of each over the past years? Describe age differentials in distribution of the two}.
Table 30: Number of natural and non-natural deaths, {Years}
Period Number of natural deaths
Number of non-natural deaths
Total
Sample textAccording to the ICD-10 codebook, all causes of death from chapters 1 to 18 of ICD-10 are classified as natural causes and chapter 20 (V01-Y98) as non-natural causes. Table x shows the actual number of natural and non- natural deaths by year of death for the period (indicate period). {Proceed to describe the pattern. Have there been increases or decreases in the number of natural and/ or unnatural causes. Discuss any factors that are likely to have contributed increases or declines in number of deaths}
Figure 10: Percentage distribution of natural and non-natural causes of death by period of death Figure 11: Percentage distribution of natural and non-natural causes of death by age,
4.2. Leading underlying natural causes of Death (all ages) Although leading causes of death for all ages is not a very useful set of information, as from a public health perspective we are most interested in early deaths.
Table 31: Ten Leading Causes of Deaths (by ICD General Mortality List 1) by Sex, {Years}
List code Disease
Male Deaths
List code Disease
Female Deaths

All Other Causes All Other Causes TOTAL
{Briefly discuss all-age causes of death and note that causes by age group will be discussed in the following sections in more detail. Discuss the differentials by sex if any. Also discuss whether the leading causes of death for either sex were Communicable or non-communicable diseases. Note that causes of death by all ages may be misleading as the leading causes of death differ by the ages of the deceased}.
{Discuss here the percentage of ill-defined cases. Describe what is meant by ill-defined causes of death. Discuss some of the the main reason contributing to ill-defined causes of death in your country}
4.3. Underlying Natural causes of death by key age groups Mortality in Children Aged 0-4 years
{ Comment on leading causes of death, and whether this is consistent with the pattern of neonatal to other infant deaths –higher numbers of deaths from infectious diseases should result in deaths being spread out throughout the whole age groups, less will mean that deaths are more likely clustered in the neonatal age bracket. If you have 2 periods of data add to the table above – repeat the last 2 columns for the second period}
Table 32: Cause specific Mortality by ICD {chapter or General mortality list 1} (deaths per 100,000 population, including 95% Confidence Intervals), 0-4 year olds (both sexes combined) {Years}
ICD Codes Disease Number
of deaths
Percent distribution of deaths by cause (95% CI)
Cause Specific Mortality Rate per 100,000 population (95% CI)
{The ICD-10 has specific tabulation lists for infants and children (BTL 3 and 4) that may be more useful than the general deaths list here. In particular, you would expect to see most deaths in chapters XV and XVI in the lower end of this age range. The specific BTL breaks these down into more useful categories. Countries may want to consider breaking the age categories down more and applying the BTL3 and BTL 4 tabulation lists for more detailed information on causes of death in these younger age groups. Partner agencies can provide assistance to countries for this process.}

Mortality in Children Aged 5-14 years
{Comment on the number of deaths in this age group. Note that cause of death is reported for both sexes combined due to small numbers leading causes. If you have 2 periods of data add to the table – repeat the last 2 columns for the second period}
Table 33: Cause specific Mortality by ICD {chapter or General mortality list 1} (deaths per 100,000 population, including 95% Confidence Intervals), 5-14 year olds (both sexes combined) {Years}
ICD Codes Disease Number of deaths
Percent distribution of deaths by cause (95% CI)
Cause Specific Mortality Rate per 100,000 population (95% CI)
Causes of death in Adults Aged 15-59 years
{Discuss the leading causes of death. Compare causes by male and female. Try where possible to compare these to previous periods so you can see trends or other countries to provide context. If NCDs are high consider discussing these in relation to whether risk factors are also high – from sources such as the STEPS report. If you have 2 periods of data add to the tables – repeat the last 2 columns for the second period. {If possible, it may be useful for countries to break this table further down into ages 15-34 and 35-59.}
Figure 12: {Pie chart} Percent Distribution of the leading causes of death in adults aged 15-59
{5 NCDs + all other causes. If possible, it would be useful for countries to break these further down into ages 15-34 and 35-59.}
Table 35: Cause specific Mortality for adult males aged 15-59 years by ICD {chapter or General mortality list 1} (deaths per 100,000 population, including 95% Confidence Intervals); {Years}
ICD Codes Disease
Number of male deaths
Percent distribution of deaths by cause excluding ill-defined causes (95% CI)
Cause Specific Mortality Rate per 100,000 population (95% CI)
I00-I99 Diseases of circulatory system
N00-N99 Diseases of the genitourinary systemV01-Y89 External causes of morbidity and mortalityE00-E88 Endorcrine, nutritional and metabolic diseases
A00-B99 Certain Infectious and parasitic diseases
K00-K92 Diseases of digestive system

C00-D48 Neoplasms
G00-G98 Diseases of nervous system
J00-J98 Diseases of respiratory system
P00-P96 Certain conditions originating in the perinatal period
R00-R99 Symptoms, and signs and abnormal clinical and laboratory findings
TOTAL
TOTAL LESS ILL-DEFINED CAUSES
Figure 13: {Pie chart} Percent Distribution of the leading causes of death in adult Males aged 15-59
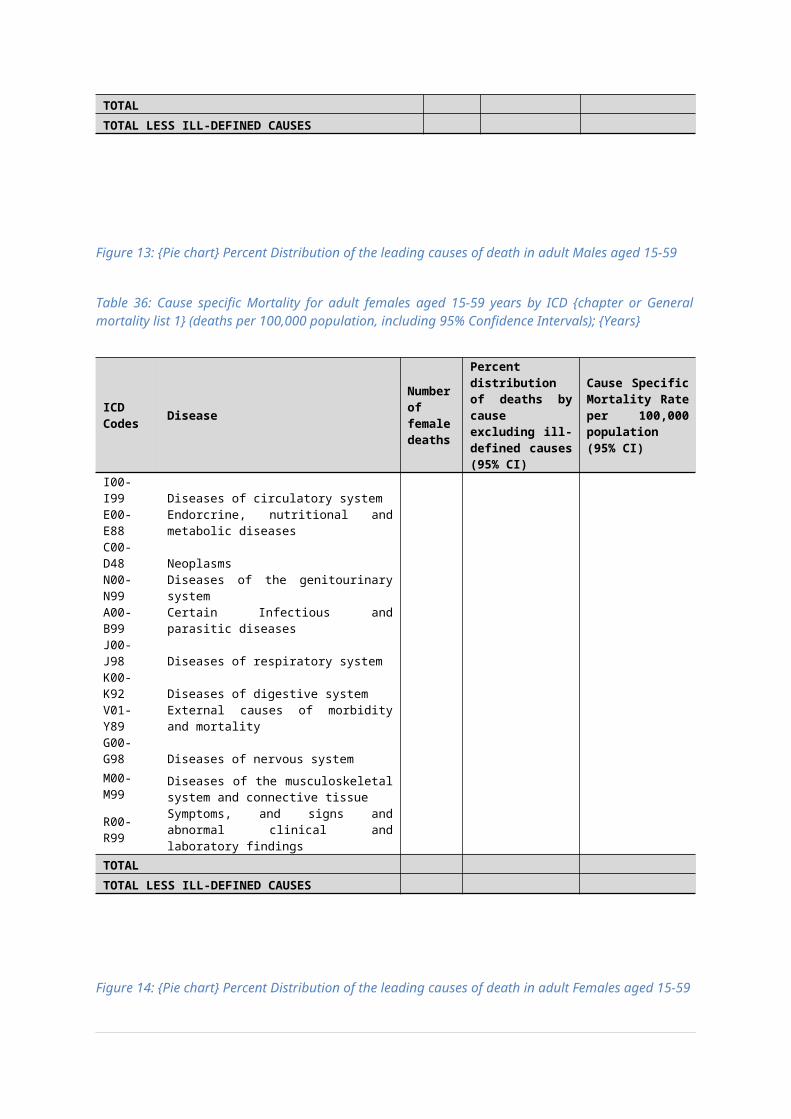
Table 36: Cause specific Mortality for adult females aged 15-59 years by ICD {chapter or General mortality list 1} (deaths per 100,000 population, including 95% Confidence Intervals); {Years}
ICD Codes Disease
Number of female deaths
Percent distribution of deaths by cause excluding ill-defined causes (95% CI)
Cause Specific Mortality Rate per 100,000 population (95% CI)
I00-I99 Diseases of circulatory system
E00-E88 Endorcrine, nutritional and metabolic diseasesC00-D48 NeoplasmsN00-N99 Diseases of the genitourinary system
A00-B99 Certain Infectious and parasitic diseases
J00-J98 Diseases of respiratory system
K00-K92 Diseases of digestive system
V01-Y89 External causes of morbidity and mortality
G00-G98 Diseases of nervous system
M00-M99 Diseases of the musculoskeletal system and connective tissue
R00-R99 Symptoms, and signs and abnormal clinical and laboratory findings
TOTAL
TOTAL LESS ILL-DEFINED CAUSES
Figure 14: {Pie chart} Percent Distribution of the leading causes of death in adult Females aged 15-59
Mortality in Older Adults (Aged 60+ Years)
{Discuss the leading causes of death. Try where possible to compare these to previous periods so you can see trends or other countries to provide context. If NCDs are high consider discussing these

in relation to whether risk factors are also high – from sources such as the STEPS report. If you have 2 periods of data add to the tables – repeat the last 2 columns for the second period. Compare causes by male and female}
Table 37: Cause specific Mortality in Adult Males Aged 60 and Older by ICD {chapter or General mortality list 1} (deaths per 100,000 population, including 95% Confidence Intervals; {Years}
ICD Codes Disease
Number of male deaths aged 60+
Percent distribution of deaths by cause excluding ill-defined causes (95% CI)
Cause Specific Mortality Rate per 100,000 population (95% CI)
TOTAL
TOTAL LESS ILL-DEFINED CAUSES
Table 38: Cause specific Mortality in Adult Females Aged 60 and Older by ICD {chapter or General mortality list 1} (deaths per 100,000 population, including 95% Confidence Intervals; {Years}
ICD Codes Disease
Number of female deaths aged 60+
Percent distribution of deaths by cause excluding ill-defined causes (95% CI)
Cause Specific Mortality Rate per 100,000 population (95% CI)
TOTAL
TOTAL LESS ILL-DEFINED CAUSES
4.4. Underlying natural causes of death by region of occurrence (Main geographical divisions)
{Discuss the distribution of the ten leading natural causes of death by the main geographical region of occurrence. Discuss the major variations by region and possible differences between the differences).
Table 39: The ten leading underlying natural causes of death for period (Years)
Causes of death (Based on ICD 10)
Region 1 Region 2 Region 3 Region 3
Rank No Rank No Rank No Rank No
1.

2.3.4.5.6.7.8.9. `10.
All causes
4.5. Adult Mortality from Non-Communicable Diseases (NCDs)
Non-communicable diseases are the leading cause of death in Pacific Islands and territories. A number of NCD-related indicators can be used to measure progress against NCD-related mortality.
Cause-specific proportional mortality
Age-specific proportional mortality for adults aged 15-59 years from specific groups of NCDs (1-026 – Neoplasms, 1-052 – Diabetes, 1-064 Diseases of the Circulatory System, 1-076 – Chronic Lower respiratory Disease, 1-080 – Diseases of the Liver) shows the proportion of deaths due to these diseases. While proportional mortality shows the relative burden from NCDs compared to other causes of death and is easy to measure, it does not provide a measure of the overall impact of NCD related deaths and does not paint a complete picture.
Figure _: {Pie chart} Percent Distribution of the leading causes of death in adults aged 15-59 {5 NCDs + all other causes. If possible, it would be useful for countries to break these further down into ages 15-34 and 35-59.}
Circulatory diseases; 30%
Diabetes; 16%Neoplasms; 10%
Chronic Lower respiratory
Diseases; 3%
Diseases of the Liver; 3%
All other causes; 38%

Cause-specific mortality rates from selected NCD’s
Age-specific mortality rates provide a direct measure of the overall impact of NCD-related deaths on the population. While these rates cannot be used to provide a comparison either between countries or over time as they will be affected by the age structure of the population, rates for 10 year age groups can be useful in providing more detailed information for targeting specific NCD-related interventions.
{Refer to the information from deaths in Males and Females aged 15-59.}
Age-standardised mortality from NCD’s
For comparison over time and across countries, age standardized rates for the selected NCD’s should be used. {Where possible, countries should also consider periodically reporting mortality from these causes for 5 year age groups from 20 to 59 years of age. This would be an optional indicator but would give PICTs a much more detailed understanding of the population affected by NCDs and an improved ability both to target and monitor interventions.}
Table 40: Age-standardized cause-specific mortality rates for adults aged 15-59 years for selected NCDs by sex (deaths per 100,000 population), {Years}
The probability of dying among adults aged 30-69 years (inclusive) from designated NCDs – WHO Indicator
The probability of dying among adults aged 30-69 years (inclusive) from specific causes has recently been introduced by WHO as an outcome indicator for the impact of NCDs. As such, estimates of mortality from selected non-communicable diseases for this age group are reported here for comparison with international reporting. These are outlined in the following table. This indicator does not include deaths from Diseases of the Liver (1-080), which are included in the earlier indicators as most deaths in these categories will be due to chronic diseases that are occurring in the Pacific region. NCDs are the leading cause of mortality in the world and the Pacific. {Say something about NCDs as a leading cause of death in 15-59 year olds as above}
Table 41: Selected non-communicable diseases (NCDs) for reporting against international targets by ICD General Mortality List 1
List code Disease ICD Codes
1-026 Neoplasms C00–D481-052 Diabetes mellitus E10–E141-064 Diseases of the circulatory system I00–I99
Selected NCDs Males Females TotalNeoplasms Diabetes Circulatory diseases Chronic Lower respiratory Diseases Diseases of the Liver
1-076 Chronic lower respiratory diseases J40–J47
Table 42: Deaths from selected NCDs in 30-69 year olds (inclusive) by sex, {Years}
CODE Diseases Males Females Total1-026 Neoplasms1-052 Diabetes mellitus
1-064 Diseases of the circulatory system
1-076 Chronic lower respiratory diseases
TOTAL
The probability of dying from these diseases is calculated using life table methods, and is noted below. This is the probability that a person aged 30 will die from the selected disease before their 70th birthday.
Table 43: Probability of dying (%) from selected NCDs in 30-69 year olds (inclusive) by sex, {Years}
CODE Diseases Males Females Total1-026 Neoplasms1-052 Diabetes mellitus
1-064 Diseases of the circulatory system
1-076 Chronic lower respiratory diseases
TOTAL
{comment on probability of dying from one of these selected NCDs}

CONCLUSIONS (RECOMMENDATIONS AND POLICY IMPLICATIONS)
Provide a summary key findings of the analysis that would have policy implications. Are the levels of fertility among teenage mothers increasing or alarmingly high? Is mortality on the rise and what are possible ways to address the rise? Is there a specific age group that requires special intervention? Also comment on the quality of the country’s data and the possible need for improvement.

REFERENCES[ # ] Murray, C. J., Ferguson, B. D., Lopez, A. D., Guillot, M., Salomon, J. A., & Ahmad, O. (2003). Modified logit life table system: principles, empirical validation, and application. Population Studies, 57(2), 165-182.
[ # ] WHO. (2012). Classifications, International Classification of Diseases (ICD). Retrieved September 2012, from World Health Organisation: http://www.who.int/classifications/icd
[ # ] Chiang, C. L. (1967). Vital Health Statistics 2. In C. L. Chiang, Variance and covariance of life table functions estimated from a sample of deaths (pp. 20:1 - 8).
[ # ] Chiang, C. L. (n.d.). Introduction to stochastic processes in Biostatistics. In The life table and its construction (pp. Chapter 9, 189.214). New York: John Wiley & Sons 1968.
[ # ] UN [United Nations] (2014): Principles and Recommendations for a Vital Statistics System. Revision 3. Department of Economic and Social Affairs, Statistics Division Statistical Papers, Series M No. 19/Rev.3, New York. http://unstats.un.org/unsd/Demographic/standmeth/principles/M19Rev3en.pdf .
[ # ] UN [United Nations] (2015): Transforming our world: the 2030 Agenda for Sustainable Development, A/70/L.1. http://www.un.org/ga/search/view_doc.asp?symbol=A/70/L.1&Lang=E .

APPENDICESAppendix 1: Statistical Tables
POPULATION ESTIMATES
Population Estimates by age group: {YEARS}Population Estimates by age group, Males: {YEARS}Population Estimates by age group, Females: {YEARS}
BIRTHS
{5} Year period of Rolling Average of Number of Births: {YEARS}Completeness – registered and reported births by age of mother {Years}Total Number of Births by Age of Mothers in Age Groups: {YEARS}Total Number of Births by Place of Birth: {YEARS}Total Fertility Rate Calculations in 5 year age groups: {YEARS}
DEATHS
{5} Year Rolling Average of Number of Deaths: {YEARS}Completeness – registered and reported deaths by sex and age {Years}Total Number of Deaths by 5 Year Age groups: {YEARS}Total Number of Deaths of Males in Age Groups: {YEARS}Total Number of Deaths of Females in 5 Year Age groups: {YEARS}Total Number of Infant Deaths in Niue: {YEARS}Total Number of Neonatal Deaths in Niue: {YEARS}Age-specific Mortality Rate (deaths per 1,000 people) by sex and period: {YEARS}Cause-Specific Mortality Rates for Adults Aged 15-59 Years for Selected NCDs by Sex and 5 Year Age
Group (deaths per 100,000 population), {Years}Life tables: Total {YEARS}Life tables: Males {YEARS}Life tables: Females {YEARS}
CAUSE OF DEATHS (by ICD General mortality list – 103 causes)
{If only ICD chapters used in the main body of the report – then include the more detailed tabulations here}

POPULATION ESTIMATES
Population Estimates by age group: {YEARS}Population Estimates by age group, Males: {YEARS}Population Estimates by age group, Females: {YEARS}
BIRTHS
{5} Year period of Rolling Average of Number of Births: {YEARS}Coverage – registered and reported births by age of mother {Years}Total Number of Births by Age of Mothers in Age Groups: {YEARS}Total Number of Births by Place of Birth: {YEARS}Total Fertility Rate Calculations in 5 year age groups: {YEARS}
DEATHS
{5} Year Rolling Average of Number of Deaths: {YEARS}Total Number of Deaths by 5 Year Age groups: {YEARS}
DEATHSBroad age group Male Female TOTAL
<5
Neonatal deaths (under 28 days) Deaths 28 days to <1 years Deaths 1-4 years Total <5
5-9 10-14 15-19 20-24 25-29 30-24 35-39 40-44 45-49 50-54 55-59 60-64 65-69 70-74 75-79 80-8485+TOTAL Number of deaths with a medical certificate or verbal autopsy Proportion of deaths with a medical certificate or verbal autopsy
Figure: Age Specific Mortality Rates by period, {years – most recent period}
Total Number of Deaths of Males in Age Groups: {YEARS}Total Number of Deaths of Females in 5 Year Age groups: {YEARS}Total Number of Infant Deaths in Niue: {YEARS}Total Number of Neonatal Deaths in Niue: {YEARS}Age-specific Mortality Rate (deaths per 1,000 people) by sex and period: {YEARS}Cause-Specific Mortality Rates for Adults Aged 15-59 Years for Selected NCDs by Sex and 5 Year Age
Group (deaths per 100,000 population), {Years}Life tables: Total {YEARS}Life tables: Males {YEARS}Life tables: Females {YEARS}
CAUSE OF DEATHS (by ICD General mortality list – 103 causes)
{If only ICD chapters used in the main body of the report – then include the more detailed tabulations here}

Sex: MALEList code Disease 0-4 5-9 10-14 15-19 20-24 25-29 30-34 35-39 40-44 45-49 50-54 55-59 60-64 65-69 70-74 75+ Total 1-001 Certain infectious and parasitic diseases 0 0 0 0 0 0 0 0 0 0 0 0 0 0 0 0 01-002 Cholera 0
1-003Diarrhoea and gastroenteritis of presumed infectious origin 0
1-004 Other intestinal infectious diseases 01-005 Respiratory tuberculosis 01-006 Other tuberculosis 01-008 Tetanus 01-009 Diphtheria 01-010 Whooping cough 01-011 Meningococcal infection 01-012 Septicaemia 0
1-013Infections with a predominantly sexual mode of transmission 0
1-014 Acute poliomyelitis 0
1-017Other arthropod-borne viral fevers and viral haemorrhagic fevers 0
1-018 Measles 01-019 Viral hepatitis 01-020 Human immunodeficiency virus [HIV] disease 01-021 Malaria 01-025 Remainder of certain infectious and parasitic diseases 01-026 Neoplasms 0 0 0 0 0 0 0 0 0 0 0 0 0 0 0 0 01-027 Malignant neoplasm of lip, oral cavity and pharynx 01-028 Malignant neoplasm of oesophagus 01-029 Malignant neoplasm of stomach 01-030 Malignant neoplasm of colon, rectum and anus 01-031 Malignant neoplasm of liver and intrahepatic bile ducts 01-032 Malignant neoplasm of pancreas 01-033 Malignant neoplasm of larynx 0
1-034 Malignant neoplasm of trachea, bronchus and lung 01-035 Malignant melanoma of skin 01-040 Malignant neoplasm of prostate 01-041 Malignant neoplasm of bladder 0
1-042Malignant neoplasm of meninges, brain and other parts of central nervous system 0
1-043 Non-Hodgkin's lymphoma 0
1-044 Multiple myeloma and malignant plasma cell neoplasms 01-045 Leukaemia 01-046 Remainder of malignant neoplasms 01-047 Remainder of neoplasms 0
1-048Diseases of the blood and blood-forming organs and certain disorders involving the immune mechanism 0 0 0 0 0 0 0 0 0 0 0 0 0 0 0 0 0
1-049 Anaemia 0
1-050
Remainder of diseases of the blood and blood-forming organs and certain disorders involving the immune mechanism 0
1-051 Endocrine, nutritional and metabolic diseases 0 0 0 0 0 0 0 0 0 0 0 0 0 0 0 0 01-052 Diabetes mellitus 01-053 Malnutrition 0
1-054Remainder of endocrine, nutritional and metabolic diseases 0
1-055 Mental and behavioural disorders 0 0 0 0 0 0 0 0 0 0 0 0 0 0 0 0 0
1-056Mental & behavioural disorders due to psychoactive substance use 0
1-057 Remainder of mental and behavioural disorders 01-058 Diseases of the nervous system 0 0 0 0 0 0 0 0 0 0 0 0 0 0 0 0 01-059 Meningitis 01-060 Alzheimer's disease 01-061 Remainder of diseases of the nervous system 01-062 Diseases of the eye and adnexa 01-063 Diseases of the ear and mastoid process 01-064 Diseases of the circulatory system 0 0 0 0 0 0 0 0 0 0 0 0 0 0 0 0 0
1-065Acute rheumatic fever and chronic rheumatic heart diseases 0
1-066 Hypertensive diseases 01-067 Ischaemic heart diseases 01-068 Other heart diseases 01-069 Cerebrovascular diseases 01-070 Atherosclerosis 01-071 Remainder of diseases of the circulatory system 01-072 Diseases of the respiratory system 0 0 0 0 0 0 0 0 0 0 0 0 0 0 0 0 01-073 Influenza 01-074 Pneumonia 01-075 Other acute lower respiratory infections 01-076 Chronic lower respiratory diseases 01-077 Remainder of diseases of the respiratory system 01-078 Diseases of the digestive system 0 0 0 0 0 0 0 0 0 0 0 0 0 0 0 0 01-079 Gastric and duodenal ulcer 01-080 Diseases of the liver 01-081 Remainder of diseases of the digestive system 01-082 Diseases of the skin and subcutaneous tissue 0
1-083Diseases of the musculoskeletal system and connective tissue 0
1-084 Diseases of the genitourinary system 0 0 0 0 0 0 0 0 0 0 0 0 0 0 0 0 01-085 Glomerular and renal tubulointerstitial diseases 01-086 Remainder of diseases of the genitourinary system 01-092 Certain conditions originating in the perinatal period 0
1-093Congenital malformations, deformations and chromosomal abnormalities 0
1-094Symptoms, signs and abnormal clinical and laboratory findings, not elsewhere classified 0
1-095 External causes of morbidity and mortality 0 0 0 0 0 0 0 0 0 0 0 0 0 0 0 0 01-096 Transport accidents 01-097 Falls 01-098 Accidental drowning and submersion 01-099 Exposure to smoke, fire and flames 0
1-100Accidental poisoning by and exposure to noxious substances 0
1-101 Intentional self-harm 01-102 Assault 01-103 All other external causes 01-901 SARS
0 0 0 0 0 0 0 0 0 0 0 0 0 0 0 0 0TOTAL

Sex: FEMALEList code Disease 0-4 5-9 10-14 15-19 20-24 25-29 30-34 35-39 40-44 45-49 50-54 55-59 60-64 65-69 70-74 75+ Total 1-001 Certain infectious and parasitic diseases 0 0 0 0 0 0 0 0 0 0 0 0 0 0 0 0 01-002 Cholera 0
1-003Diarrhoea and gastroenteritis of presumed infectious origin 0
1-004 Other intestinal infectious diseases 01-005 Respiratory tuberculosis 01-006 Other tuberculosis 01-008 Tetanus 01-009 Diphtheria 01-010 Whooping cough 01-011 Meningococcal infection 01-012 Septicaemia 0
1-013Infections with a predominantly sexual mode of transmission 0
1-014 Acute poliomyelitis 0
1-017Other arthropod-borne viral fevers and viral haemorrhagic fevers 0
1-018 Measles 01-019 Viral hepatitis 01-020 Human immunodeficiency virus [HIV] disease 01-021 Malaria 01-025 Remainder of certain infectious and parasitic diseases 01-026 Neoplasms 0 0 0 0 0 0 0 0 0 0 0 0 0 0 0 0 0
1-027 Malignant neoplasm of lip, oral cavity and pharynx 01-028 Malignant neoplasm of oesophagus 01-029 Malignant neoplasm of stomach 01-030 Malignant neoplasm of colon, rectum and anus 01-031 Malignant neoplasm of liver and intrahepatic bile ducts 01-032 Malignant neoplasm of pancreas 01-033 Malignant neoplasm of larynx 01-034 Malignant neoplasm of trachea, bronchus and lung 01-035 Malignant melanoma of skin 01-036 Malignant neoplasm of breast 01-037 Malignant neoplasm of cervix uteri 0
1-038Malignant neoplasm of other and unspecified parts of uterus 0
1-039 Malignant neoplasm of ovary 01-041 Malignant neoplasm of bladder 0
1-042Malignant neoplasm of meninges, brain and other parts of central nervous system 0
1-043 Non-Hodgkin's lymphoma 0
1-044 Multiple myeloma and malignant plasma cell neoplasms 01-045 Leukaemia 01-046 Remainder of malignant neoplasms 01-047 Remainder of neoplasms 0
1-048Diseases of the blood and blood-forming organs and certain disorders involving the immune mechanism 0 0 0 0 0 0 0 0 0 0 0 0 0 0 0 0 0
1-049 Anaemia 0
1-050
Remainder of diseases of the blood and blood-forming organs and certain disorders involving the immune mechanism 0
1-051 Endocrine, nutritional and metabolic diseases 0 0 0 0 0 0 0 0 0 0 0 0 0 0 0 0 01-052 Diabetes mellitus 01-053 Malnutrition 0
1-054Remainder of endocrine, nutritional and metabolic diseases 0
1-055 Mental and behavioural disorders 0 0 0 0 0 0 0 0 0 0 0 0 0 0 0 0 0
1-056Mental & behavioural disorders due to psychoactive substance use 0
1-057 Remainder of mental and behavioural disorders 01-058 Diseases of the nervous system 0 0 0 0 0 0 0 0 0 0 0 0 0 0 0 0 01-059 Meningitis 01-060 Alzheimer's disease 01-061 Remainder of diseases of the nervous system 01-062 Diseases of the eye and adnexa 01-063 Diseases of the ear and mastoid process 01-064 Diseases of the circulatory system 0 0 0 0 0 0 0 0 0 0 0 0 0 0 0 0 0
1-065Acute rheumatic fever and chronic rheumatic heart diseases 0
1-066 Hypertensive diseases 01-067 Ischaemic heart diseases 01-068 Other heart diseases 01-069 Cerebrovascular diseases 01-070 Atherosclerosis 01-071 Remainder of diseases of the circulatory system 01-072 Diseases of the respiratory system 0 0 0 0 0 0 0 0 0 0 0 0 0 0 0 0 01-073 Influenza 01-074 Pneumonia 01-075 Other acute lower respiratory infections 01-076 Chronic lower respiratory diseases 01-077 Remainder of diseases of the respiratory system 01-078 Diseases of the digestive system 0 0 0 0 0 0 0 0 0 0 0 0 0 0 0 0 01-079 Gastric and duodenal ulcer 01-080 Diseases of the liver 01-081 Remainder of diseases of the digestive system 01-082 Diseases of the skin and subcutaneous tissue 0
1-083Diseases of the musculoskeletal system and connective tissue 0
1-084 Diseases of the genitourinary system 0 0 0 0 0 0 0 0 0 0 0 0 0 0 0 0 01-085 Glomerular and renal tubulointerstitial diseases 0
1-086 Remainder of diseases of the genitourinary system 01-087 Pregnancy, childbirth and the puerperium 0 0 0 0 0 0 0 0 0 0 0 0 0 0 0 0 01-088 Pregnancy with abortive outcome 01-089 Other direct obstetric deaths 01-090 Indirect obstetric deaths 0
1-091 Remainder of pregnancy, childbirth and the puerperium 01-092 Certain conditions originating in the perinatal period 0
1-093Congenital malformations, deformations and chromosomal abnormalities 0
1-094Symptoms, signs and abnormal clinical and laboratory findings, not elsewhere classified 0
1-095 External causes of morbidity and mortality 0 0 0 0 0 0 0 0 0 0 0 0 0 0 0 0 01-096 Transport accidents 01-097 Falls 01-098 Accidental drowning and submersion 01-099 Exposure to smoke, fire and flames 0
1-100Accidental poisoning by and exposure to noxious substances 0
1-101 Intentional self-harm 01-102 Assault 01-103 All other external causes 01-901 SARS
0 0 0 0 0 0 0 0 0 0 0 0 0 0 0 0 0TOTAL

Appendix 2: Standard Tabulations of Cause of Death from the International Statistics Classification of Diseases and Related Health Problems, 10th Revision (ICD-10, 2010 edition)
General Mortality List 1: 103 Cause List
List code Disease ICD Codes
1-001 Certain infectious and parasitic diseases A00–B991-002 Cholera A001-003 Diarrhoea and gastroenteritis of presumed infectious origin A091-004 Other intestinal infectious diseases A01–A081-005 Respiratory tuberculosis A15–A161-006 Other tuberculosis A17–A191-007 Plague A201-008 Tetanus A33–A351-009 Diphtheria A361-010 Whooping cough A371-011 Meningococcal infection A391-012 Septicaemia A40–A411-013 Infections with a predominantly sexual mode of transmission A50–A641-014 Acute poliomyelitis A801-015 Rabies A821-016 Yellow fever A95
1-017 Other arthropod-borne viral fevers and viral haemorrhagic fevers A90–A94, A96–A99
1-018 Measles B051-019 Viral hepatitis B15–B191-020 Human immunodeficiency virus [HIV] disease B20–B241-021 Malaria B50–B541-022 Leishmaniasis B551-023 Trypanosomiasis B56–B571-024 Schistosomiasis B65
1-025 Remainder of certain infectious and parasitic diseases
A21–A32, A38, A42–A49, A65–A79, A81, A83–A89, B00–B04, B06–B09, B25–B49, B58–B64, B66–B94, B99
1-026 Neoplasms C00–D481-027 Malignant neoplasm of lip, oral cavity and pharynx C00–C141-028 Malignant neoplasm of oesophagus C151-029 Malignant neoplasm of stomach C161-030 Malignant neoplasm of colon, rectum and anus C18–C211-031 Malignant neoplasm of liver and intrahepatic bile ducts C221-032 Malignant neoplasm of pancreas C251-033 Malignant neoplasm of larynx C321-034 Malignant neoplasm of trachea, bronchus and lung C33–C341-035 Malignant melanoma of skin C43

1-036 Malignant neoplasm of breast C501-037 Malignant neoplasm of cervix uteri C531-038 Malignant neoplasm of other and unspecified parts of uterus C54–C551-039 Malignant neoplasm of ovary C561-040 Malignant neoplasm of prostate C611-041 Malignant neoplasm of bladder C67
1-042 Malignant neoplasm of meninges, brain and other parts of central nervous system C70–C72
1-043 Non-Hodgkin's lymphoma C82–C851-044 Multiple myeloma and malignant plasma cell neoplasms C901-045 Leukaemia C91–C95
1-046 Remainder of malignant neoplasms
C17, C23–C24, C26–C31, C37–C41, C44–C49, C51–C52, C57–C60, C62–C66, C68–C69, C73–C81, C88, C96–C97
1-047 Remainder of neoplasms D00–D48
1-048 Diseases of the blood and blood-forming organs and certain disorders involving the immune mechanism D50–D89
1-049 Anaemia D50–D64
1-050 Remainder of diseases of the blood and blood-forming organs and certain disorders involving the immune mechanism D65–D89
1-051 Endocrine, nutritional and metabolic diseases E00–E881-052 Diabetes mellitus E10–E141-053 Malnutrition E40–E46
1-054 Remainder of endocrine, nutritional and metabolic diseases E00–E07, E15–E34, E50–E88
1-055 Mental and behavioural disorders F01–F99
1-056 Mental & behavioural disorders due to psychoactive substance use F10–F19
1-057 Remainder of mental and behavioural disorders F01–F09, F20–F991-058 Diseases of the nervous system G00–G981-059 Meningitis G00, G031-060 Alzheimer's disease G301-061 Remainder of diseases of the nervous system G04–G25, G31–G981-062 Diseases of the eye and adnexa H00–H591-063 Diseases of the ear and mastoid process H60–H931-064 Diseases of the circulatory system I00–I991-065 Acute rheumatic fever and chronic rheumatic heart diseases I00–I091-066 Hypertensive diseases I10–I131-067 Ischaemic heart diseases I20–I251-068 Other heart diseases I26–I511-069 Cerebrovascular diseases I60–I691-070 Atherosclerosis I701-071 Remainder of diseases of the circulatory system I71–I991-072 Diseases of the respiratory system J00–J981-073 Influenza J10–J111-074 Pneumonia J12–J18

1-075 Other acute lower respiratory infections J20–J221-076 Chronic lower respiratory diseases J40–J471-077 Remainder of diseases of the respiratory system J00–J06, J30–J39, J60–J981-078 Diseases of the digestive system K00–K921-079 Gastric and duodenal ulcer K25–K271-080 Diseases of the liver K70–K76
1-081 Remainder of diseases of the digestive system K00–K22, K28–K66, K80–K92
1-082 Diseases of the skin and subcutaneous tissue L00–L981-083 Diseases of the musculoskeletal system and connective tissue M00–M991-084 Diseases of the genitourinary system N00–N991-085 Glomerular and renal tubulointerstitial diseases N00–N151-086 Remainder of diseases of the genitourinary system N17–N981-087 Pregnancy, childbirth and the puerperium O00–O991-088 Pregnancy with abortive outcome O00–O071-089 Other direct obstetric deaths O10–O921-090 Indirect obstetric deaths O98–O991-091 Remainder of pregnancy, childbirth and the puerperium O95–O971-092 Certain conditions originating in the perinatal period P00–P96
1-093 Congenital malformations, deformations and chromosomal abnormalities Q00–Q99
1-094 Symptoms, signs and abnormal clinical and laboratory findings, not elsewhere classified R00–R99
1-095 External causes of morbidity and mortality V01–Y891-096 Transport accidents V01–V991-097 Falls W00–W191-098 Accidental drowning and submersion W65–W741-099 Exposure to smoke, fire and flames X00–X091-100 Accidental poisoning by and exposure to noxious substances X40–X491-101 Intentional self-harm X60–X841-102 Assault X85–Y09
1-103 All other external causesW20–W64, W75–W99, X10–X39, X50–X59, Y10–Y89
1-901 SARS U04

Appendix 3: Key Concepts and DefinitionsAdult Mortality: The probability of dying between the ages of 15 – 59 inclusive, that is, the probability of a 15 year old dying before reaching the age of 60, if subject to current age-specific mortality rates between those ages.
Age-specific fertility rates: The number of births occurring to mothers of a certain age group per 1,000 women in that age group in a given period of time.
Age Specific Mortality Rate: The number of deaths per 1,000 people of a given age group in a given time period.
Age Standardised Death Rates: The number of deaths that would occur if subject to the same age structure as the standard population and the age-specific rate; one country’s age specific death rates applied to a standard age distribution.
Crude Birth Rate (CBR): The annual number of births occurring per 1000 mid-year populations.
Crude Death Rate (CDR): The annual number of deaths occurring per 1000 mid-year population
Infant Mortality Rate (IMR): The number of deaths in infants under age 1 per 1000 live births in a given period.
Life Expectancy: The average number of additional years a person could expect to live if current morality trends were to continue for the rest of that person’s life.
Live birth: The complete expulsion or extraction from its mother of a product of conception, irrespective of the duration of the pregnancy, which, after such separation, breathes or shows any other evidence of life - e.g. beating of the heart, pulsation of the umbilical cord or definite movement of voluntary muscles - whether or not the umbilical cord has been cut or the placenta is attached. Each product of such a birth is considered live born.
Maternal death: The death of a woman while pregnant or within 42 days of termination of pregnancy, irrespective of the duration and site of the pregnancy, from any cause related to or aggravated by the pregnancy or its management but not from accidental or incidental causes.
Maternal mortality ratio (MMR): The ratio of the number of maternal deaths during a given time period per 100,000 live births during the same time-period.
Neonatal mortality rate: The number of deaths in live-born infants aged less than 28 days per 1,000 live births over a specified time period.
Rate of Natural Increase: Rate at which a population grows (increase/decrease) during a given year, as the result of a surplus/deficit of births over deaths; expressed as a percentage of the base population.
Sex Ratio: Number of men per 100 women. Sex ratios over 100 indicate that there are more males than females, and sex ratios under 100 indicate more females than males.

Total Fertility Rate (TFR): The average number of children a woman would give birth to during her lifetime if she were to pass through her childbearing years experiencing the present day age-specific fertility rates.
Under 5 Mortality Rate: The number of deaths in children under age 5 per 1,000 live births in a given period.

Appendix 4: WHO World Standard Population DistributionFrom: AGE STANDARDIZATION OF RATES: A NEW WHO STANDARD, GPE Discussion Paper Series: No.31, EIP/GPE/EBD, World Health Organization 2001