summary and concluding analysis · summary & concluding analysis - the north european maritime...
TRANSCRIPT
SUMMARY AND CONCLUDING ANALYSIS
THE NORTH EUROPEAN MARITIME CONTAINER FEEDER MARKET
& GENERAL BUSINESS ENVIRONMENT, ECONOMY,
TRADE, TRANSPORTS AND CONTAINER MARKET CHARACTERISTICS
GÖTEBORG 2002-10-16

SJÖFARTENS ANALYS INSTITUT RESEARCH 2002-10-24 Lilla Bommen 1, 411 04 GÖTEBORG Tel: +46 31 771 25 50, Fax:+46 31 15 69 65, E-mail [email protected]

SJÖFARTENS ANALYS INSTITUT RESEARCH 2002-10-24 Lilla Bommen 1, 411 04 GÖTEBORG Tel: +46 31 771 25 50, Fax:+46 31 15 69 65, E-mail [email protected]
SUMMARY & CONCLUDING ANALYSIS
THE NORTH EUROPEAN MARITIME CONTAINER FEEDER MARKET
& GENERAL BUSINESS ENVIRONMENT, ECONOMY, TRADE, TRANSPORTS AND CONTAINER MARKET
CHARACTERISTICS
THE PROJECT RESULT IS PRESENTED IN THE FOLLOWING REPORTS:
• Summary & Concluding Analysis • The North European Maritime Container Feeder Market • General Business Environment, Economy, Trade, Transports
and Container Market Characteristics
Our reference: NEB Feeder Market - Concluding Jennie Thalenius, Kaj Rehnström

Summary & Concluding Analysis - The North European Maritime Container Feeder Market
THE INSTITUTE OF SHIPPING ANALYSIS 2002-10-24 I:\SAIEKF\RESEARCH\Vinnova\Feeder\Report\Finalreports\FinalConcluding.doc
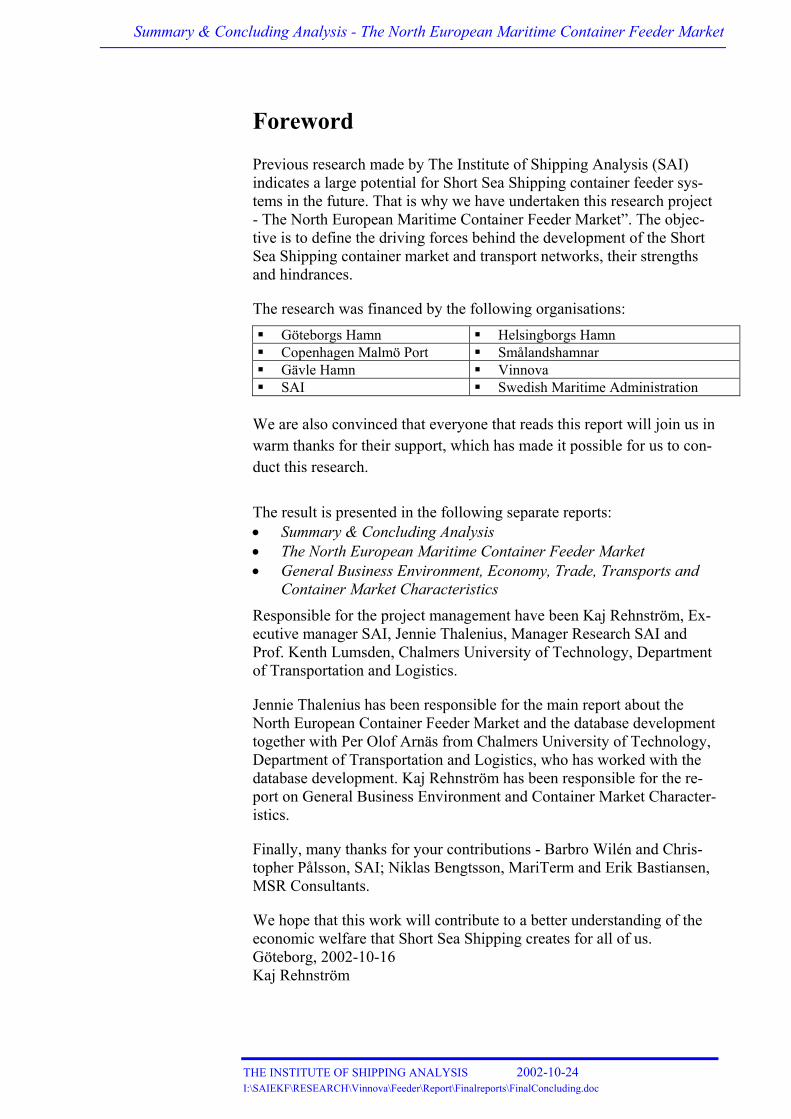
Foreword
Previous research made by The Institute of Shipping Analysis (SAI) indicates a large potential for Short Sea Shipping container feeder sys-tems in the future. That is why we have undertaken this research project - The North European Maritime Container Feeder Market”. The objec-tive is to define the driving forces behind the development of the Short Sea Shipping container market and transport networks, their strengths and hindrances.
The research was financed by the following organisations: Göteborgs Hamn Helsingborgs Hamn Copenhagen Malmö Port Smålandshamnar Gävle Hamn Vinnova SAI Swedish Maritime Administration
We are also convinced that everyone that reads this report will join us in warm thanks for their support, which has made it possible for us to con-duct this research.
The result is presented in the following separate reports: • Summary & Concluding Analysis • The North European Maritime Container Feeder Market • General Business Environment, Economy, Trade, Transports and
Container Market Characteristics
Responsible for the project management have been Kaj Rehnström, Ex-ecutive manager SAI, Jennie Thalenius, Manager Research SAI and Prof. Kenth Lumsden, Chalmers University of Technology, Department of Transportation and Logistics.
Jennie Thalenius has been responsible for the main report about the North European Container Feeder Market and the database development together with Per Olof Arnäs from Chalmers University of Technology, Department of Transportation and Logistics, who has worked with the database development. Kaj Rehnström has been responsible for the re-port on General Business Environment and Container Market Character-istics.
Finally, many thanks for your contributions - Barbro Wilén and Chris-topher Pålsson, SAI; Niklas Bengtsson, MariTerm and Erik Bastiansen, MSR Consultants.
We hope that this work will contribute to a better understanding of the economic welfare that Short Sea Shipping creates for all of us. Göteborg, 2002-10-16 Kaj Rehnström


Summary & Concluding Analysis - The North European Maritime Container Feeder Market
THE INSTITUTE OF SHIPPING ANALYSIS 2002-10-24 I:\SAIEKF\RESEARCH\Vinnova\Feeder\Report\Finalreports\FinalConcluding.doc
Table of contents 1 INTRODUCTION ............................................................................................... 1 2 GENERAL TENDENCIES IN THE GLOBAL CONTAINER TRANSPORTS .............. 1 3 DEFINING THE REGIONAL MARITIME CONTAINER FEEDER MARKET ........ 7 4 PROSPECTS AND DRIVING FORCES, STRENGTHS AND HINDRANCES............. 15 5 STRATEGIES AND IMPLICATIONS.................................................................. 17 6 THE RESEARCH IN THIS PROJECT AND COMMENTS ON RESULTS................. 24 7 FURTHER RESEARCH..................................................................................... 26 APPENDIX: BRIEF SUMMARY - THE DATABASE TOOL AND ACHIEVEMENTS .................. 28 REFERENCES .................................................................................................................... 31
Figures Figure 1: Ship price and charter rate development ..............................................................5 Figure 2: Illustration of cost development and structure for a container transport ..............5 Figure 3: North European and Baltic Region (NEB) ...........................................................8 Figure 4: Defined subregions in NEB..................................................................................8 Figure 5: Tendencies in the transport network...................................................................18 Figure 6: Strategies – Low cost and adaptation .................................................................19 Figure 7: A combination of strategies –low cost, adaptation and differentiation ..............19
Tables
Table 1: Ports in Northern Europe and Baltic Region > 1% of the container lifts.............10


Summary & Concluding Analysis - The North European Maritime Container Feeder Market
THE INSTITUTE OF SHIPPING ANALYSIS 2002-10-24 Page 1 I:\SAIEKF\RESEARCH\Vinnova\Feeder\Report\Finalreports\FinalConcluding.doc
1 Introduction
The main objective of this study is to enhance the knowledge about the structure, competitiveness and driving forces in the port and shipping market for containers within the North European and Baltic (NEB) re-gions. But, since this market to a large extent is integrated in the global container transport market, we must also consider the global develop-ment of container transports and underlying driving forces.
At the same time, it was most urgent to develop more efficient and reli-able methods to quantify market indicators in physical terms. Available statistics are fragmented, not compatible or lacking e.g. about the de-mand of transport capacity and its geographical distribution.
The report “General Business Environment, Economy, Trade, Trans-ports and Container Market Characteristics” presents more detailed analyses of the global development of container transports and underly-ing driving forces.
In the report about “The North European Maritime Container Feeder Market”, we give comments about the research and methods including findings regarding port statistics, volumes and discrepancies between sources. Our findings about structures and driving forces in the regional feeder market are based on a supply and demand perspective. The re-port also includes a comprehensive description about the database tool and achievements regarding management of data for ship movements, fleet details and container volume development.
In this report - “Concluding Analysis”, we have condensed findings about the global and regional container market, the tendencies and driv-ing forces.
2 General tendencies in the global container transports 1
The growth in world seaborne trade of containerised cargo has out-stripped the growth in world trade in general and world economic growth in particular since the introduction of the container during the 1950s on the West-East /East-West long haul trades. The seaborne vol-
1 From the report: General Business Environment, Economy, Trade, Transports and Container Market Characteristics

Summary & Concluding Analysis - The North European Maritime Container Feeder Market
THE INSTITUTE OF SHIPPING ANALYSIS 2002-10-24 Page 2 I:\SAIEKF\RESEARCH\Vinnova\Feeder\Report\Finalreports\FinalConcluding.doc
ume reached an astonishing 73 million TEU in 2001, which in turn gen-erated approximately 230 million lifts in the ports.
The development during the next few years is influenced by the slow-down of the economic growth in 2001 and 2002. At the same time, the corresponding reduction of the growth rate in seaborne container trade combined with an upturn in the supply of slot capacity has sent the con-tainer market into a recession. It will take at least two years and an up-turn in the economic growth for the market to recover. The German beneficial tax system has once again stimulated the investors to order too many container ships in the short term.
However, the prerequisites for economic growth during the next 10 years are rather good with a generally favorable technology factor lead-ing to improved productivity in the world economy and hope for no disruptions in the supply of production factors i.e. there should be no risk for inflation during the next 10 years. However, there are many uncertainties around the geopolitical situation that can influence eco-nomic growth negatively.
We expect that scrapping will increase and ordering of new tonnage will drop during 2002 and 2003 and deliveries will be reduced 2004-2006, while demand can be expected to start to increase again during this period.
The turnaround of the market can be rapid due to the relatively high growth rates in the demand for container shipment, which is expected during an upturn in the economy and a slowdown in the growth of ca-pacity.
The average fall in the long term TEU-freight rate is due to the use of larger vessels, increased co-operation, alliances etc as well as rationali-sations in the other parts of the logistic chain. Above all, the share of cost of the sea leg of the door-to-door transport has decreased substan-tially.
The main question is whether the actors in the terminal and land based part of the chain can achieve a productivity growth sufficient to im-prove the overall productivity and thereby contribute to a further drop in world logistics cost/unit.
The demand for innovations is in communications, market, general or-ganisation and technology in terminal and land systems. Focus is thus more on the side of the terminal and the transport from the port terminal to the customer/producer.

Summary & Concluding Analysis - The North European Maritime Container Feeder Market
THE INSTITUTE OF SHIPPING ANALYSIS 2002-10-24 Page 3 I:\SAIEKF\RESEARCH\Vinnova\Feeder\Report\Finalreports\FinalConcluding.doc
As the volume of container shipments becomes larger and more diversi-fied geographically and cargo wise there will be more opportunities for specialised niche operations. But specialised niche and mega operators will find the conference way more or less closed and what is left are mergers and take-overs because it seems to be the only way of getting larger if anti-trust immunity becomes fully lifted. Conferences may be replaced by discussion agreements although at this stage the European Commission does not allow these. Other forms of co-operation and spe-cialisation of services will, however emerge such as “E-Shipping”
Container shipping lines and terminal operators have continued upgrad-ing their web-sites and portals, regularly adding new products (from status information and tracking and trading to encrypted negotiable electronic Bills of Lading). Carrier groupings (this time not only the traditional alliances) are putting much emphasis on further developing their joint competing portals CargoSmart, GT Nexus and INTTRA through which shippers can communicate with the member lines and forwarders in one common electronic format.
The crucial resource for a full mega logistics provider servicing a huge amount of customers is a regular and high quality access to the shippers and to specialised transport services. Such an operator is managing a logistic net providing Logistic Chain Management. Most of the hard-ware, transport capacities (land-sea-air) and operations could be hired or taken in on Time Charter arrangements.
The transport links forming the transport chain from the first origin of cargo to the final destination have been more integrated and the trans-port of a manufacturer is increasingly out-sourced to a specialist ”Lo-gistics Company”.
The legal framework for container shipping has also changed radically as joint freight rate fixing in liner conferences has been forbidden. Thus, political decisions, inter-modality and logistic services have be-come increasingly important.
The containerisation of the container friendly goods has reached a level where the process only gives a minor contribution to the overall growth in the container trade. However the containerisation of the non-container friendly and often heavier cargoes has increased.
The market structure is thus becoming more complex than ever due to its characteristics as a net of services that could be combined to econo-mies of scale in each individual order handled by the system.

Summary & Concluding Analysis - The North European Maritime Container Feeder Market
THE INSTITUTE OF SHIPPING ANALYSIS 2002-10-24 Page 4 I:\SAIEKF\RESEARCH\Vinnova\Feeder\Report\Finalreports\FinalConcluding.doc
The container will penetrate new markets in line with the following future driving forces:
• Economic growth: Growing globalisation of economic activity and growing free trade.
• Increased political intervention: Conditions underlying political frameworks and environmental, safety and social considerations.
• The use of economies of scale in all parts of the logistic chain - tech-nically as well as organisationally. There are still economies of scale to be exploited by using larger ships, but in our view the potential is not so large anymore in the deep sea relations. Technically there are no great challenges concerning the ships
• Relatively higher growth within “new” cargo segments i.e. which are physically possible to containerise.
• Transport and logistic thinking.
• Development in the Information and Communication Technology area (ICT).
Combined, these driving forces will have a major influence on how companies configure their logistic solutions, which in turn affects ship-ping in several respects.
The following scenario is therefore based on rather cautious assump-tions for the period 2001-2010, with: • An average world GDP growth of 2% per year. • An average growth in container friendly goods by 7%, representing an
average ratio between GDP growth and container friendly goods of 3.5 compared to a little over 4 during the 1990s.
• An increase in the share of non-container friendly cargo from 7% to 10% of all container shipments.
This will increase the shipment of containers by approximately 7% per year from 73 million 2001 to 145 million 2010, which means that the yearly growth rate will be reduced from 9% as during the 1990s. Still, it will result in a doubling of the shipments in absolute figures corre-sponding to 75 million TEU compared to the 1990s, when the increase was 35 million TEU.
In 2001, the number of port lifts was 230 million TEU, which means that each shipment on the average generates about 3.1 lifts in the ports in the world. It is not unreasonable to belive that the number of lifts/shipment can increase further.

Summary & Concluding Analysis - The North European Maritime Container Feeder Market
THE INSTITUTE OF SHIPPING ANALYSIS 2002-10-24 Page 5 I:\SAIEKF\RESEARCH\Vinnova\Feeder\Report\Finalreports\FinalConcluding.doc
Ship Prices/Rates 1600 TEU
0
10
20
30
40
50
60
70
1985
1987
1989
1991
1993
1995
1997
1999
2001
2003
2005
2007
2009
024681012141618
NB Price SH 5 Year TC-USD/Day
Scenario
Mill USD 000 USD/day
Figure 1: Ship price and charter rate development
The average time charter rate for 2000-2010 is expected to fall by 2 % per year. A total sea leg representing 20-25 % of the total cost for a door-to-door shipment of containers means a contribution of approxi-mately 0.5 % per year of rationalisation in the total logistic cost.
But continued reduced potential to explore “economies of scale” in the sea part of the transport chain and a doubling of the volumes the next 10 years can lead to a scenario with rising unit costs in the next 10-20 years.
1990
2000
2010
1960
Year
Cost per unit
145 MTEUSea<20 %
Sea part
Sea part
Sea part
73 MTEU
35 MTEU
“1” MTEU
Cost per unit
Illustration of cost development and structure for a container transport – door to door
Figure 2: Illustration of cost development and structure for a container transport

Summary & Concluding Analysis - The North European Maritime Container Feeder Market
THE INSTITUTE OF SHIPPING ANALYSIS 2002-10-24 Page 6 I:\SAIEKF\RESEARCH\Vinnova\Feeder\Report\Finalreports\FinalConcluding.doc
To sum up – we emphasise the following observations about the general and global container market:
• A doubling of seaborne shipments during 2001-2010, which repre-sents a global increase by approximately 75 million TEU is not an unlikely scenario.
• The increase in volumes represents no capacity problem for the mari-time part of the transport chain, but the rationalisation potential of the sea leg of a door-to-door transport is substantially lower than in the past. The problem or key question is to what extent the other parts of the transport chain can cope with such an increase in volumes.
• The concept “sustainable development” has created new – or more differentiated policy objectives. Since the market does not fully price “sustainability”, transport pricing will partly be influenced through political processes. Transport cost calculations will include new items that may not be offset through the use of economies of scale, ICT, de-regulation and harmonisation.
• To avoid a scenario with increasing unit costs becoming a reality we can conclude that the need for innovations in the future is in commu-nications, marketing, general organisation and technology in terminal and land systems. Focus is more on the holistic commercial side to-gether with terminals and transport efficiency from the terminal to the customer/producer.
• It does not matter if your business provides a worldwide, specialised niche operation, geographically, functionally or cargo wise. The ca-pability to explore scale of operation, eliminate bottlenecks and con-trol the supply of capacity is crucial in all parts of the transport and logistic business. It is therefore crucial to define correctly what busi-ness you are part of, because that determines how to measure the scale of your operation.

Summary & Concluding Analysis - The North European Maritime Container Feeder Market
THE INSTITUTE OF SHIPPING ANALYSIS 2002-10-24 Page 7 I:\SAIEKF\RESEARCH\Vinnova\Feeder\Report\Finalreports\FinalConcluding.doc
3 Defining the Regional Maritime Container Feeder Market 2
The feeder concept and its business are truly integrated and related to global transports of containers. But, in this business we would like to include all containers shipped by feeder systems or other concepts. This demand for container transports can have its origin in:
Direct intra-regional cargo, where the geographical cargo origin and destination is within the region. The region is in this report defined as the North European and Baltic (NEB) regions.
Direct external cargo, where the cargo’s origin or destination is out-side the region and the cargo is shipped directly to destinations out-side the region.
Or, as a third possibility – transshipment cargo. The cargo origins and/or destinations are outside the region, but the cargo is trans-shipped between maritime transport links within the regional bound-ary.
The feeder system has its major business within the regional boundary, serving the trans-ocean liner traffic calling the very few large hub ports. But there is no strict business limitation – it is more a question of strate-gies and potential for further economies of scale. All container trans-ports, also the truly intra-regional, can be regarded as a potential also for feeder transport services, irrespective of mode. Therefore, in this report the sea feeder market includes maritime containers transshipped in the regional hubs and intra-regional units. Another aspect is that we cannot separate intra-regional from transshipped units in the statistics.
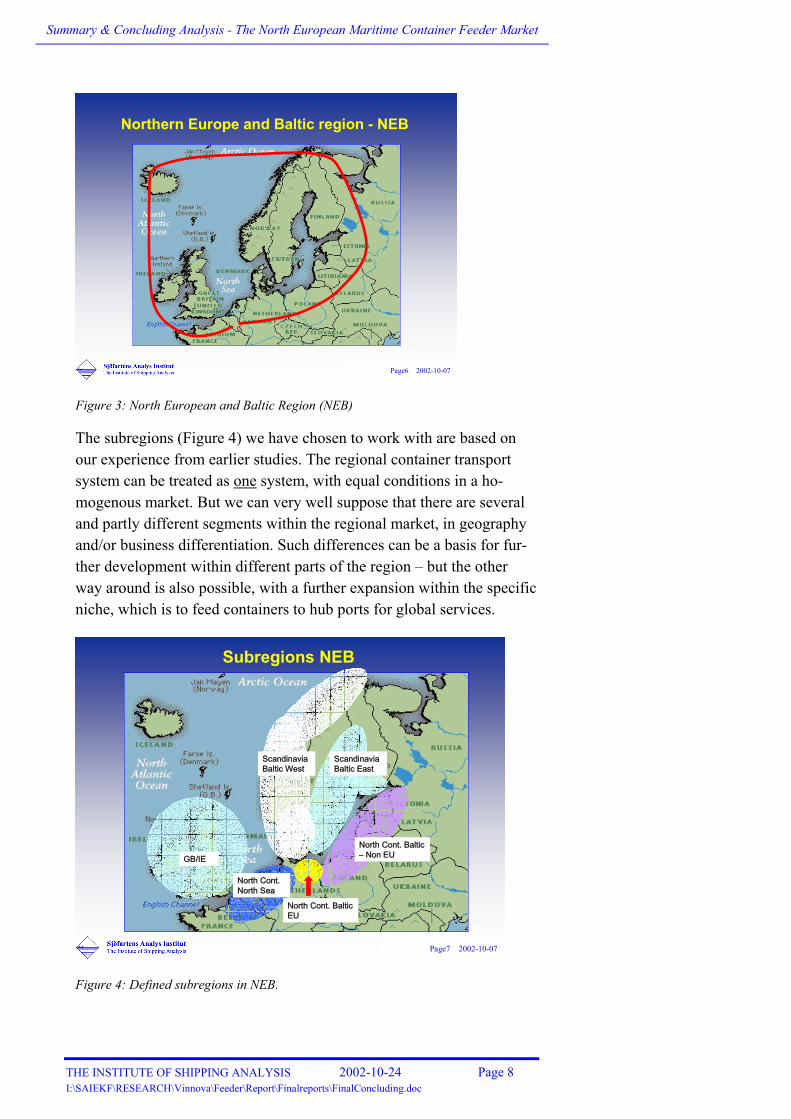
From a geographical point of view, the region we have defined includes 15 countries (Figure 3). This region is well defined as to geographical boundary and it also represents a market or operating region for Short Sea Shipping. At the same time, this region is not at all homogeneous when regarding frame components and characteristics of the shipping market.
2 From the report: “The North European Maritime Container Feeder Market”
Summary & Concluding Analysis - The North European Maritime Container Feeder Market
THE INSTITUTE OF SHIPPING ANALYSIS 2002-10-24 Page 8 I:\SAIEKF\RESEARCH\Vinnova\Feeder\Report\Finalreports\FinalConcluding.doc
Page6 2002-10-07
Northern Europe and Baltic region - NEB
Figure 3: North European and Baltic Region (NEB)
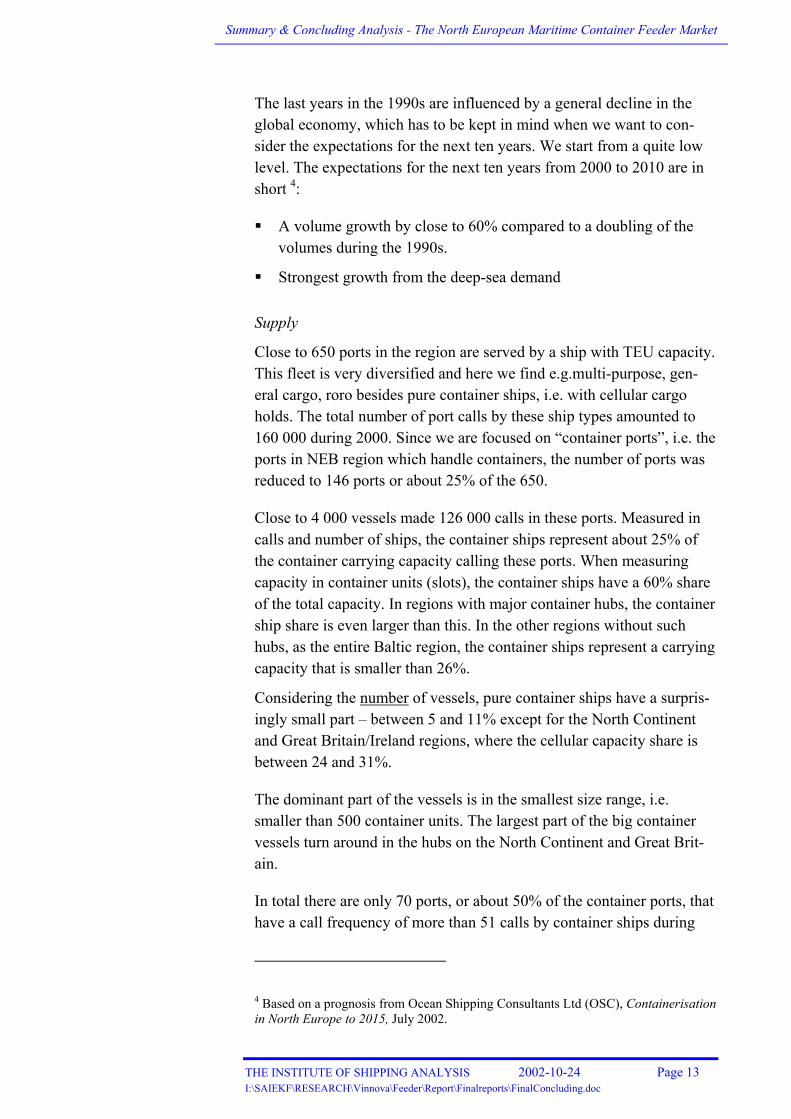
The subregions (Figure 4) we have chosen to work with are based on our experience from earlier studies. The regional container transport system can be treated as one system, with equal conditions in a ho-mogenous market. But we can very well suppose that there are several and partly different segments within the regional market, in geography and/or business differentiation. Such differences can be a basis for fur-ther development within different parts of the region – but the other way around is also possible, with a further expansion within the specific niche, which is to feed containers to hub ports for global services.
Page7 2002-10-07
Subregions NEB
GB/IE
Scandinavia Baltic West
Scandinavia Baltic East
North Cont. North Sea
North Cont. Baltic – Non EU
North Cont. Baltic EU
Figure 4: Defined subregions in NEB.

Summary & Concluding Analysis - The North European Maritime Container Feeder Market
THE INSTITUTE OF SHIPPING ANALYSIS 2002-10-24 Page 9 I:\SAIEKF\RESEARCH\Vinnova\Feeder\Report\Finalreports\FinalConcluding.doc
The “feeder” system is the regional part of the global container trans-port system, and is as such an integrated part of the transport chain from door-to-door. The feeder service function is not transport mode specific – it can be performed entirely on land or with intermodal solutions de-pending on geographical, infra-structural and economic factors but the “feeder” concept is usually associated with the maritime part of the re-gional distribution of containers to and from hub ports where the units are transferred to the deep sea links. The project frame has not included analyses of land feeder transports, mainly due to lack of statistics.
In total, the database structure now allows analyses of cargo, ship movements and fleet for 146 container ports and 25 different regional aggregates. If Eurostat data had been used instead, we would have been restricted to ports in the EU countries. This would have reduced the number of subregions, which in turn had restricted the possible analyses of differences in regional characteristics.
The fleet with capacity to carry containers in the region mirrors a mix-ture of factors, not only regarding commodities shipped and volumes but also frame components and qualitative aspects. Regarding the con-tainer segment it is probably the most standardised segment. The con-tainer unit itself is just a type of equipment - a cargo carrier unit, and it is not the commodity itself. But we usually regard containers as a com-modity, which represents a shipment of any kind of box shaped cargo, partly because the cargo carried is not classified in the statistics. But we can assume that although the container is totally standardised, the de-mand for logistics and cargo care varies considerably between specific commodities shipped.
Together, these conditions are underlying factors for wanting flexibility in analyses and database tools e.g. regarding regional aggregates – the North European and Baltic region (NEB) as an entity, parts of it or at port level.
From an initial selection of 644 ports in the geographical region, we have identified 146 ports which handle containers during the period – these are our container ports. They are grouped per 15 countries and nine defined transnational subregions including Scandinavia, the North Continent and the entire NEB region. Iceland is included in NEB in the cargo database, but not yet in our ship movement data.
Demand

Summary & Concluding Analysis - The North European Maritime Container Feeder Market
THE INSTITUTE OF SHIPPING ANALYSIS 2002-10-24 Page 10 I:\SAIEKF\RESEARCH\Vinnova\Feeder\Report\Finalreports\FinalConcluding.doc
In total, 31 million TEU were handled by these 146 container ports or port companies in the region in 2000. 84% of the container volumes were handled in Germany, Great Britain, the Netherlands and Belgium.
In fact, the ten largest ports in these countries or 7% of the ports in the entire region, handled 80% of the container volumes. The concentration of volumes to a very few hub ports is obvious – but this is only one side of the coin. When considering the feeder market, the hubs are turning points in a dense feeder network connecting a large number of origin or destination ports with these hubs.
The Nordic countries and Great Britain have over 70% of the container ports - which together build the basis for the feeder network in the re-gion. In Scandinavia, with over 50% of the ports, the volume share is just close to 10%. Port market and container distribution conditions are in this comparison very disparate between the different subregions in NEB.
At a port level, there are 13 ports of the 146 in the entire region that handle more than 1% each of the overall container throughput. Only two of these are located in Scandinavia – Göteborg and Helsinki.
Table 1: Ports in Northern Europe and Baltic Region > 1% of the container lifts
All
port
s
1000
TEU
Av
grow
th
rate
97/
00
Gro
wth
99
/00
Volu
me
Shar
e
Acc
. vol
-um
e sh
are
Acc
. no
port
s
Rotterdam 6 275 4.5% -1.1% 20.2% 20.2% 0.7%
Hamburg 4 275 8.4% 14.0% 13.6% 34.0% 1.4%
Antwerpen 4 082 11.2% 13.0% 13.2% 47.2% 2.1%
Felixstowe 2 816 7.1% 3.0% 9.1% 56.3% 2.7%
Bremen/ Bremerhaven
2 752 17.3% 25.0% 8.9% 65.1% 3.4%
Dublin 1 380 7.6% 5.8% 4.5% 69.6% 4.1%
Southampton 1 298 13.1% 39.7% 4.2% 73.8% 4.8%
Zeebrugge 965 14.2% 13.5% 3.1% 76.9% 5.5%
London 748 13.9% 2.4% 2.4% 79.3% 6.2%
Liverpool/Mersey 732 16.6% 44.3% 2.4% 81.7% 6.8%
Göteborg 685 8.9% 9.7% 2.2% 83.9% 7.5%
Medway (incl. Thamesport)
509 8.8% 3.1% 1.6% 85.5% 8.2%
Helsinki 398 0.4% 23.8% 1.3% 86.8% 8.9%
Source: SAI Cargo Database
The NEB region growth rate was 7.6% per year between 1997 and 2000 compared to the average growth rate for the 13 ports, which was 9%. This has resulted in an increased volume share from 84% 1997 to 87%

Summary & Concluding Analysis - The North European Maritime Container Feeder Market
THE INSTITUTE OF SHIPPING ANALYSIS 2002-10-24 Page 11 I:\SAIEKF\RESEARCH\Vinnova\Feeder\Report\Finalreports\FinalConcluding.doc
in the year 2000. The average figure for the other ports showed a nega-tive growth rate 3.
But, the volume figures and development vary to a large extent from port to port. Some ports have had a continuous and fast growth during the period, but from low or very low levels, especially in the Nordic countries. The ports showing a negative development include ports in almost all the countries, which can indicate a shift to other ports in these or other countries. It can also be a result of a large dependency on local industries - and their business cycles.
We have to remember that this period includes a general slow down of the economies and effects of the Asian recession. The upturn in the economy resulted in fast growth rates after 1999 measured in container lifts.
The concentration tendency or the dominance in volumes on a handful of ports does not mean a deterioration of the regional transport network. The network exists and is necessary to support the global lines with turning points in the hubs. But the rapid development in the North Con-tinental hubs can indicate that land transport feeder has gained in mar-ket shares more than the maritime feeder concept.
In the Nordic countries, the availability of efficient sea links is and has always been a prerequisite to develop the trade to external markets. The Nordic container port market can be regarded as small in a Euro-pean comparison, but it is an important part of the regional hinterland for the transshipment ports and for the feeder market, since the Scandi-navian/Baltic market together with Great Britain are the main regions for maritime containers. Of the total volume reported in Swedish ports, close to 50% is coming from or destined to Germany, the Netherlands and Belgium, 17% to and from Great Britain/Ireland and trans-ocean regions represent 23%. In Finland, as much as 76% of the containers come from or are destined to North Continental ports, where the con-tainers are transshipped.
The NEB maritime feeder market is estimated at 7 million TEU includ-ing empty containers (based on Eurostat figures). The importance of the flows between Great Britain/Ireland and Rotterdam and between Scan-dinavia and Hamburg, Bremerhaven and Rotterdam is obvious. But, we must remember that the units originated or destined to “end” ports in
3 Figures based on volume development between 1997 and 2000 for 103 ports, which together represented over 99% of the total volume in the region 2000.

Summary & Concluding Analysis - The North European Maritime Container Feeder Market
THE INSTITUTE OF SHIPPING ANALYSIS 2002-10-24 Page 12 I:\SAIEKF\RESEARCH\Vinnova\Feeder\Report\Finalreports\FinalConcluding.doc
the region are also a part of the trans-ocean flows in the hubs. In the statistics for these hubs, the units are counted as import and export from the ports of transshipment (country of transshipment) and not “end” ports.
It can be concluded that the Scandinavian countries are generating transshipment containers, especially for Germany. For the Netherlands, Great Britain/Ireland is the main generator besides the direct trans-ocean containers. Sweden has the largest part of trans-ocean direct vol-umes compared to the other Scandinavian countries, which is entirely due to the traffic in the port of Göteborg. Here the trans-ocean share is close to 30% according to Eurostat figures. In the largest North Conti-nental and Great Britain ports, the share is varying between 60 and 90%. These conditions are also affected by the maritime feeder share versus land transport feeder to and from the transshipment ports. A lar-ger share indicates that feeder by land transport modes is dominant.
Some words about the flows of empty units: We have data for 57 ports, representing 29 million TEU or 93% of the total volume in NEB. Of this volume, close to 5 million TEU are empty, which means an average share of 17% of the total number of TEU handled. The ports with a lar-ger average empty share, handle 23% of the total number of empty units but only 14% of the total TEU volume. Does this indicate that the larg-est ports are more balanced regarding the cargo flows?
The tendency is that the larger the port, the more balanced the cargo flow, i.e. fewer empty units per total handled. The variations are con-siderable though. But this indicates that the positioning of empties within the region, estimated at more than one million TEU and two mil-lion lifts, is an important part of the feeder service market. It also indi-cates a potential to take care of the capacity for intra-regional cargo.
The long term development shows that the volumes in the major North Continental and Great Britain ports were doubled between 1990 and 1999. The western part of the Nordic Baltic region had a little slower development in the last part of the 1990s, but the most remarkable ten-dency was the break in the development in the Baltic region. The major reason was the decrease of transit units to Russia, which affected the Finnish ports. If we just make a short deviation, this development can be compared to that in Southern Europe, where the volumes tripled in the major Mediterranean ports. The main reason for this tremendous growth is their new role as transshipment hubs for interchange of units between links in the global services. Now back to the North of Europe.
Summary & Concluding Analysis - The North European Maritime Container Feeder Market
THE INSTITUTE OF SHIPPING ANALYSIS 2002-10-24 Page 13 I:\SAIEKF\RESEARCH\Vinnova\Feeder\Report\Finalreports\FinalConcluding.doc
The last years in the 1990s are influenced by a general decline in the global economy, which has to be kept in mind when we want to con-sider the expectations for the next ten years. We start from a quite low level. The expectations for the next ten years from 2000 to 2010 are in short 4:
A volume growth by close to 60% compared to a doubling of the volumes during the 1990s.
Strongest growth from the deep-sea demand
Supply
Close to 650 ports in the region are served by a ship with TEU capacity. This fleet is very diversified and here we find e.g.multi-purpose, gen-eral cargo, roro besides pure container ships, i.e. with cellular cargo holds. The total number of port calls by these ship types amounted to 160 000 during 2000. Since we are focused on “container ports”, i.e. the ports in NEB region which handle containers, the number of ports was reduced to 146 ports or about 25% of the 650.
Close to 4 000 vessels made 126 000 calls in these ports. Measured in calls and number of ships, the container ships represent about 25% of the container carrying capacity calling these ports. When measuring capacity in container units (slots), the container ships have a 60% share of the total capacity. In regions with major container hubs, the container ship share is even larger than this. In the other regions without such hubs, as the entire Baltic region, the container ships represent a carrying capacity that is smaller than 26%.
Considering the number of vessels, pure container ships have a surpris-ingly small part – between 5 and 11% except for the North Continent and Great Britain/Ireland regions, where the cellular capacity share is between 24 and 31%.
The dominant part of the vessels is in the smallest size range, i.e. smaller than 500 container units. The largest part of the big container vessels turn around in the hubs on the North Continent and Great Brit-ain.
In total there are only 70 ports, or about 50% of the container ports, that have a call frequency of more than 51 calls by container ships during
4 Based on a prognosis from Ocean Shipping Consultants Ltd (OSC), Containerisation in North Europe to 2015, July 2002.

Summary & Concluding Analysis - The North European Maritime Container Feeder Market
THE INSTITUTE OF SHIPPING ANALYSIS 2002-10-24 Page 14 I:\SAIEKF\RESEARCH\Vinnova\Feeder\Report\Finalreports\FinalConcluding.doc
2000. This frequency represents at least a weekly service in these ports; a frequency that can characterise feeder services. The number of calls by container ships is closely related to the number of TEU handled in these ports. But, we can also find variations - some ports have relatively small volumes and are still frequently called by container ships; many of these ports are located in Norway, Sweden or the Baltic States. This indicates that ports are served if the deviation from the routes connect-ing the major ports is not too large. It is probably also a part of the strategies – to be present on the market. There are also examples of ports with few or no calls by container ships although the TEU volumes could be larger than for other ports served. Our conclusion is that opera-tors with other ship types with container carrying capacity, like roro and multipurpose ships are a part of this market.
Altogether, the key figures show a structure, which can be characterized as follows:
Large differences between subregions concerning supply of trans-port capacity for containers, especially on pure container ships, which is natural due to the many and relatively small container ports in the Scandinavian and Baltic regions.
Feeder services support the Scandinavian and Baltic regions with a dense and highly frequent service. Ports incorporated in the feeder services have a certain volume (concentration) and suitable geo-graphical position versus each operator’s schedules and routes.
Other ship types than pure container ships also serve the container transport market – a fleet with a large joint capacity, used for con-tainer transports or not.
The presence of the different ship types with container capacity vary between subregions and countries though, e.g for Finland, roro ships supply 40% of the total slot capacity called. Also Sweden, Denmark and Estonia are examples of this. The frequent cargo ferries in short sea operations are to the major part dedicated for transports of trailer units. But, the liner traffic with roro ships in both short and deep sea traffic have a flexible capacity for other commodities like break-bulk, containers etc.
Multi-purpose ships seem to have a complementary role to pure container ships in regions without large hubs. General cargo ships, on the other hand are the most frequent ship type in the Baltic States and Russia. But, our conclusion is that the general cargo ships are probably dedicated for non-containerised cargo.

Summary & Concluding Analysis - The North European Maritime Container Feeder Market
THE INSTITUTE OF SHIPPING ANALYSIS 2002-10-24 Page 15 I:\SAIEKF\RESEARCH\Vinnova\Feeder\Report\Finalreports\FinalConcluding.doc
4 Prospects and driving forces, strengths and hin-drances
As the volume of container shipments becomes larger and more diversi-fied in geography and cargo segments shipped, there will be more op-portunities for specialised niche as well as mega logistic operations.
One particularly interesting segment of the shipping transport service market is the slot market, where transporters can offer TEU capacity as a complement to their main business.
This market is heavily dependent on the possibilities for the transporters to sell their TEU capacity on an easily accessible market for both com-bination capacity and complete ship charters. This market is of particu-lar interest in the short-sea-shipping segment of container transporta-tion.
Efficient feeder links to an increasing number of small and medium sized ports stimulate further growth of containerisation. More highly processed cargo, smaller shipment sizes combined with highly competi-tive service levels and economies of scale promote the penetration of ”new” commodities and further volume growth within the container system. One part of the “new” container volumes is also generated from flows that have been transported by other maritime operators engaged in other niches – referring to geographical coverage and/or capacity, like operators with roro, reefer, general cargo or even bulk commodi-ties. For these operators, container cargo is probably a small but profit-able segment in addition to the basic cargo. The extent of such substitu-tion is hard to determine, since such information is strictly confidential.
The maritime system is diversified into several shipping segments, with different demand for logistical refinement. The container transport sys-tem is only one of these segments - there are also other segments with the same or even higher degree of refinement in adaptation to customer logistics. Operators and their services are in that case often more spe-cialised regarding commodities shipped and customers. Regarding the container system, it is flexible for, in principle, all commodities not exceeding the physical restrictions of the container unit itself. An open global system, with high density in the networks, high frequency ser-vice, use of standardised cargo carrying units, ability to cope with cus-tomers who have small and irregular shipments – are some factors that make the container transport system so generally applicable and com-petitive. Combined with increased economies of scale, the freight level is on such a level that this system can penetrate other than traditional high value cargoes. On the negative side are the extra costs for empty

Summary & Concluding Analysis - The North European Maritime Container Feeder Market
THE INSTITUTE OF SHIPPING ANALYSIS 2002-10-24 Page 16 I:\SAIEKF\RESEARCH\Vinnova\Feeder\Report\Finalreports\FinalConcluding.doc
units (handling and positioning) and need for a more complex control system.
Tendencies within and prerequisites for the development of the regional transport system is also to a growing extent connected to the develop-ment within the globalisation of manufacturing and demand of a global perspective on transportation. The regional transport system is an inte-grated part of this. In the Nordic countries, the sea container feeder as other shipping segments, has a strong market position due to geography, infrastructure and extensive external trade. Inland haulage to the ports is mainly performed by trucks.
Despite the increased volume concentration to the very few hubs, we have not found any tendency showing that the number of ports handling containers is decreasing. Thanks to the efficient feeder services and dense networks in combination with the long term and general increase of container volumes, we would rather expect that the number of ports served by feeder services can increase.
Short distances to several and efficient container ports served by fre-quent feeder traffic means a good access to gateways into the global container transport networks. The alternative is fewer gateways, longer distances and probably increased road haulage. The development of train shuttles – a “corridor thinking”, is positive, because rail is re-garded as a sustainable alternative to truck transports. Such solutions have an impact on short sea shipping. In a longer term perspective, when so called freight freeways by rail are introduced in the east-westerly and north-southerly direction through Europe, rail alternatives can become very efficient also for container feeder e.g. via south Euro-pean transshipment ports. This can result in new structures in the trans-port market in general and short sea shipping and the port market in particular, which is interesting to analyse further.
Conditions associated with railway system conditions and infrastructure includes a need of a further volume concentration to (very) few corri-dors and gateways. One question is if this results in an overall transport cost from shippers to the hubs that are in fact reduced. This should be compared with an already available efficient and dense network of maritime services connecting a multitude of nodes in the network. Also from a society perspective, this structure should be regarded as very flexible and cost efficient because it can relatively easily be adapted to variations in demand and last, but not least - without need of public investments.
Summary & Concluding Analysis - The North European Maritime Container Feeder Market
THE INSTITUTE OF SHIPPING ANALYSIS 2002-10-24 Page 17 I:\SAIEKF\RESEARCH\Vinnova\Feeder\Report\Finalreports\FinalConcluding.doc
The above trends will influence the network structure including the se-lection of hubs for transshipment of containers. More direct lines based on medium sized vessels for long distance trade can also be a part of this. New organisational structures can also include smaller container ports, which will be engaged in short sea operations.
5 Strategies and implications
We draw the following conclusions about the regional transport net-work:
Increased density in the network in a local perspective, driven by the general development of the demand for container transports in the ports´ hinterland, combined with the capacity offered in the dense network of feeder links.
In the regional perspective, we find an increasing concentration of volumes to the transshipment hubs in the North Continent and Great Britain.
In the EU and global perspective, mega hubs for interchange be-tween deep sea links will continue to trigger the development in these hubs (e.g. in Southern Europe). We can expect this develop-ment to continue due to further economies of scale in the global links combined with rationalisation in the global networks.
The volume growth in the major hubs will be more rapid than the average volume growth, due to increases of transshipment and in-creased use of rail transports to these hubs.
These perspectives are complementary – and not exclusive since they are all connected to the developments within the global container trans-port system. 5
5 Lumsden, K., Thalenius, J., Bottlenecks in a transport context - and in a North Sea Perspective, NTN (Nordic Transport political Network), Interreg IIC project, part 6, 2000. (www.ntn.dk)

Summary & Concluding Analysis - The North European Maritime Container Feeder Market
THE INSTITUTE OF SHIPPING ANALYSIS 2002-10-24 Page 18 I:\SAIEKF\RESEARCH\Vinnova\Feeder\Report\Finalreports\FinalConcluding.doc
TendenciesTendencies –– The NThe Networketwork
1. Local, direct transport services (higher density in the networks in a local perspective)
2. Concentration of flows and transport resourcesbut through several regions (regional perspective)
3. Strong concentration of cargo flows and transport resources in a global perspective (global transshipment hubs)
Figure 5: Tendencies in the transport network
We cannot foresee any severe constraints regarding the supply of sea transport capacity – the cargo flows will find their lanes. The major issue will be to extract continued economies of scale in the major re-gional hubs. Further concentration of transshipment units to a very few major hubs in combination with a general increase of volumes by probably 60% will strain the infrastructure and environment. A physical maximum related to environment and land use can be foreseen, partly due to the terminals´ location close to or within densely populated ar-eas.
The feeder market and network - strategies
The general strategies below can be implemented in various ways in the container transport market and its segments:
Low cost. By using economies of scale and other means to achieve the lowest cost per unit.
Differentiation. Market or product, e.g. far reaching development according to customer needs. Also building barriers against outside competition by customer integration or alliances.
Adaptation, timing. To sell, buy or make other efforts to follow market cycles and changes of trends in the markets.
Combinations of the above strategies i.e. low cost, high frequency, timing and easy access for the shipper to the services and informa-tion are the major criteria for future success.

Summary & Concluding Analysis - The North European Maritime Container Feeder Market
THE INSTITUTE OF SHIPPING ANALYSIS 2002-10-24 Page 19 I:\SAIEKF\RESEARCH\Vinnova\Feeder\Report\Finalreports\FinalConcluding.doc
Strategies Strategies -- Low cost Low cost and Adaptationand Adaptation......
Economies of scale and higher frequency
The container transport system -Flexible, generative and cost efficient
Efficient services through co-operation/integration
Flexibility in service and operation
Optimal capacity on each link means better capacity utilisation - load factor
Asset play - timing
Figure 6: Strategies – Low cost and adaptation
……and differentiationand differentiation
The Customer in Focus
Supply Chain Management
Total Quality Management
The System Paradox :
Low cost and differentiation
Key word: Supremacy in Customer relationsand Performance
Figure 7: A combination of strategies –low cost, adaptation and differentiation
A general conclusion is that the capability to implement a combination of the above strategies will determine the individual actors’ competi-tiveness.
In the report about the General Market Characteristics, we conclude that the container transport market will be influenced by the following major strategical issues where the importance of the various business strate-gies differs.
Logistic service including management that requires a considerable customer orientation and a highly differentiated service. Managing a network with a mixture of own resources, hired capacities and pure network resources. The customer is the purchaser of a complete lo-gistic service/transport.

Summary & Concluding Analysis - The North European Maritime Container Feeder Market
THE INSTITUTE OF SHIPPING ANALYSIS 2002-10-24 Page 20 I:\SAIEKF\RESEARCH\Vinnova\Feeder\Report\Finalreports\FinalConcluding.doc
Shipping transport service, providing slot capacities and/or opera-tion, which require low cost, efficient operation and timing of in-vestments. The customer could be the producer or the customer di-rectly, but normally the logistic service provider constitutes the cus-tomer.
Integration of terminal services, which requires a customer orienta-tion and a highly differentiated service but also to be able to provide terminal capacities at lowest cost including efficient operation.
The general development of the container volumes in the long term perspective is positive and nothing indicates a break in the trend. This could not automatically be regarded as guarantees for a safe and sound market development. The following factors have to be considered:
A market adapted to the long term development with high growth rates in container volumes – a future with lower growth rates, but still a doubling of the volumes in absolute figures.
Global and regional liner operators´ strategies and tactics – solu-tions for extracting productivity increases (costs/revenues) – the business has to be profitable in the medium and long term.
Further investments in economies of scale combined with high ex-pectations of results gained by this strategy.
The container shipping segment works in no way in splendid isola-tion – players in other niches (shipping and/or logistic services) are also affected by /affecting the prospects for the dedicated container system capacity - increased complexity in evaluations of the dynam-ics and consequences of changes.
Compromises needed for increased concern for public resources – and at the same time a society that is more and more depending on the transport system.
Political and cultural systems, which have an increasingly penetra-tive power in the society.
The perspectives we have to consider when discussing future strategy options for specific business segments or parts of these are:
Business – scale and scope
Time - medium, long term (short term not regarded when consider-ing strategies)
Geography (local, regional, global)
Micro – meso – macro level: Individual players - the busi-ness/branch – the society

Summary & Concluding Analysis - The North European Maritime Container Feeder Market
THE INSTITUTE OF SHIPPING ANALYSIS 2002-10-24 Page 21 I:\SAIEKF\RESEARCH\Vinnova\Feeder\Report\Finalreports\FinalConcluding.doc
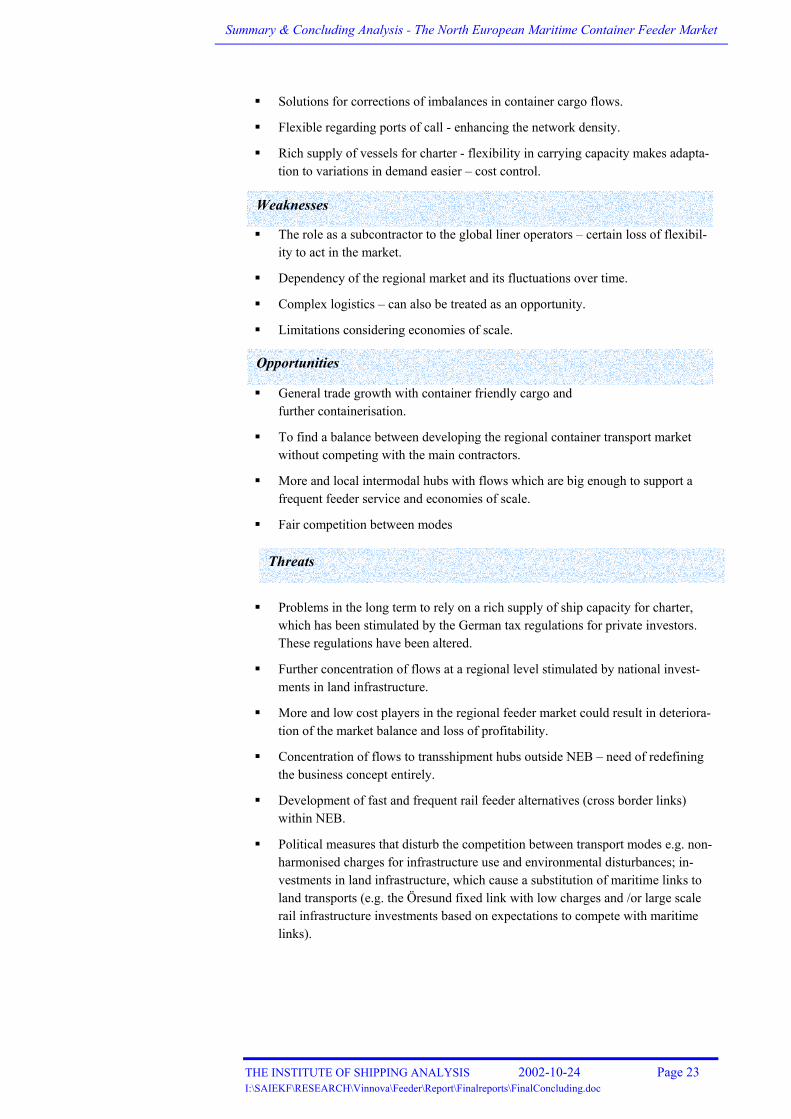
We have put together some specific characteristics concerning strengths and weaknesses, threats and opportunities from the specific points of view in this project – to identify structures and tendencies in the North European container feeder market in the medium and long term per-spective. That threats also can be opportunities is obvious.
In the short and medium term perspective, the individual players are stuck to the market. It takes time to alter the business concepts, espe-cially in international liner traffic, which is open for all customers. In-ternational liner traffic demands a relatively large land organisation, a guaranteed stability in service over time to customers. It also demands more developed networks and communication links, more refined ad-ministrative systems etc. compared to other shipping segments that are more ore less closed and dedicated to one specific customer or groups of customers with almost identical and very restricted demand of ser-vice beyond the port to port operation.
The operators with capacity to carry containers in the region are numer-ous, but they are specialised regarding geography, service and capacity. Pure container transports is a liner traffic offering very high frequency, which necessitates volumes that are stable and large enough. The added value for the shippers is the availability of an open system - irrespective of shipment size, with a continuous and well-defined service over time integrated in a global network of transport links.
The operators of feeder services are either dedicated to serve one spe-cific shipping company or are open for any customer - but the primary customers in both cases are the trans-ocean shipping lines offering the door-to-door transport to the shippers. Unifeeder and Team Lines are two of the largest feeder operators in Northern Europe and examples of independent operators – or so called common operators. Finnlines is through the acquisition of Team Lines a new part in this business, be-sides their well established European roro-traffic.
Players on the same market – yes, but with several strategy options and ways of implementation.
Unifeeder is specialised in container transports between all major North European ports as a feeder carrier, but is also an intra-European door/door operator between European countries. As a commercial feeder operator, UniFeeder offers comprehensive and efficient feeder services to all major container lines. The fleet amounts to about 30 modern container vessels with a capacity between 320 and 700 TEU.

Summary & Concluding Analysis - The North European Maritime Container Feeder Market
THE INSTITUTE OF SHIPPING ANALYSIS 2002-10-24 Page 22 I:\SAIEKF\RESEARCH\Vinnova\Feeder\Report\Finalreports\FinalConcluding.doc
Team Lines operates 22 container vessels with a capacity of 200 – 650 TEU per ship. Over 90% of the shipments are container traffic between the deepwater ports around the North Sea and ports in the Baltic and Norway. The Finnish traffic accounts for around one third of the Team Lines volume including transit traffic via Finnish ports for Russia.
The majority of the ships are time-chartered, which provides the flexi-bility the company needs to adapt to variations in trade and demand for container carrying capacity over time according to Team Lines. Such a flexibility is probably crucial due to the volatility in the Russian transit volumes.
Finnlines bought 68.2 % of Team Lines in April 2002 from its German owners and together with the former 31.8% ownership share, Finnlines now owns the company. According to Finnlines, the two organisations are kept separate since international feeder traffic and scheduled Euro-pean traffic with roro services are such different businesses with differ-ent customers, cargo flow patterns and market situation. But, in moni-toring the market situation and demand for transports and logistics from the Finnish industry, this in itself is regarded as a competitive advantage when marketing the feeder services to overseas lines.
Finnlines´ strategic goals are: Maintaining the market position in Finland-related liner services
A stronger position in Russian freight traffic
A stronger position in liner services connecting third countries in the North Sea and the Baltic area
The Finnlines group is also engaged in cargo handling and terminal operations for unitised cargo, i.e. trucks, containers and semi-trailers in Finland, St. Petersburg, Russia, as well as in stevedoring and terminal operations in the port of Oslo.
When finally characterising the maritime container feeder market and the general prerequisites for its players, we want to emphasise the fol-lowing conditions:
Large volumes and a positive growth
Frequent and reliable maritime links
A dense transport network.
Players as facilitators – enhancing the business opportunities for the customers and their customers i.e. the role as a trade motor.
Closeness to the regional market – fast recognition of business opportunities
Strengths
Summary & Concluding Analysis - The North European Maritime Container Feeder Market
THE INSTITUTE OF SHIPPING ANALYSIS 2002-10-24 Page 23 I:\SAIEKF\RESEARCH\Vinnova\Feeder\Report\Finalreports\FinalConcluding.doc
Solutions for corrections of imbalances in container cargo flows.
Flexible regarding ports of call - enhancing the network density.
Rich supply of vessels for charter - flexibility in carrying capacity makes adapta-tion to variations in demand easier – cost control.
The role as a subcontractor to the global liner operators – certain loss of flexibil-ity to act in the market.
Dependency of the regional market and its fluctuations over time.
Complex logistics – can also be treated as an opportunity.
Limitations considering economies of scale.
General trade growth with container friendly cargo and further containerisation.
To find a balance between developing the regional container transport market without competing with the main contractors.
More and local intermodal hubs with flows which are big enough to support a frequent feeder service and economies of scale.
Fair competition between modes
Problems in the long term to rely on a rich supply of ship capacity for charter, which has been stimulated by the German tax regulations for private investors. These regulations have been altered.
Further concentration of flows at a regional level stimulated by national invest-ments in land infrastructure.
More and low cost players in the regional feeder market could result in deteriora-tion of the market balance and loss of profitability.
Concentration of flows to transshipment hubs outside NEB – need of redefining the business concept entirely.
Development of fast and frequent rail feeder alternatives (cross border links) within NEB.
Political measures that disturb the competition between transport modes e.g. non-harmonised charges for infrastructure use and environmental disturbances; in-vestments in land infrastructure, which cause a substitution of maritime links to land transports (e.g. the Öresund fixed link with low charges and /or large scale rail infrastructure investments based on expectations to compete with maritime links).
Opportunities
Weaknesses
Threats
Summary & Concluding Analysis - The North European Maritime Container Feeder Market
THE INSTITUTE OF SHIPPING ANALYSIS 2002-10-24 Page 24 I:\SAIEKF\RESEARCH\Vinnova\Feeder\Report\Finalreports\FinalConcluding.doc
When summarising the strategy options for the feeder market and its players in the future, we want to emphasise the need of a multi-strategy portfolio due to:
Limited capability to use low costs as the main strategy because of the limitations in the scope of the business and also limited econo-mies of scale in the operation due to the focus on NEB regional transport of containers – the players have to adapt to variations in this market
Increased pressure on productivity (costs and revenues) - as a ser-vice provider to the global liner operators.
Differentiation – to be a short sea logistic provider requires a highly customer oriented service regardless of the choice of intermodal so-lution
Customer orientation and supply chain perspective – a promoter and a facilitator, develop marketing and communication, cooperation to achieve highly productive links with intermodal solutions.
The development within the port market – a port business that de-velops regarding organisational structures and ownership condi-tions. The hubs attract supporting activities – clusters of large im-portance for the economic growth in the nations. These networks of services include layers of different supporting or related activities that are integrated in room and time, which demands knowledge, competence, perspectives and creativity.
6 The research in this project and comments on results
Regarding the limitations in this project, some are required because of the complex market structure, but others are not. Such unwanted limita-tions are related either to lack of data or the reverse – that the amount of data is huge.
Data about the ships engaged in the regional transports and their move-ments are available in different commercial databases, but these do not cover any information at all about the cargo. That is why we have built our own cargo database. Added to this is the absolute necessity to develop an efficient tool to be able to combine and analyse information from different sources with varying structures and regional coverage. A large part of the work with the database tool has therefore been focused on our needs to integrate data to be able to follow the development of the market and its characteristics in a consistent way over time.
Summary & Concluding Analysis - The North European Maritime Container Feeder Market
THE INSTITUTE OF SHIPPING ANALYSIS 2002-10-24 Page 25 I:\SAIEKF\RESEARCH\Vinnova\Feeder\Report\Finalreports\FinalConcluding.doc
At the same time, such a tool must be flexible and adaptable for varying purposes. For instance, we can now manage different regional aggre-gates in a flexible way – the entire region as an entity, parts of it or at port level. All this holds a growing complexity because of the large and rapidly increasing amount of data when different databases are to be combined. These have to be connected successively due to the huge amount of data and in a specific order to achieve correct figures.
But, we still have to live with the fact that we cannot follow transport chains and not actual capacity utilisation. Cargo information is deduced from port data i.e. loaded and discharged units, but such data are not connected to information about the specific transport capacity used for each shipment.
In a statistical context, the development within the port business reveals an increasing complexity. The “port” cannot any more be treated as a fixed entity and is not well defined by a geographical location. The business can in fact be distributed over a geographically quite scattered region. This implies also that variations in volume figures over time can be a result of e.g. organisational changes, which are not detectable in statistics.
In analysis of long-term structural changes, long time series and compa-rable data are crucial. The time period covered in the report about mari-time container feeder transports is limited by availability of reasonably comparable and complete data for the region. We cover the period from 1997 to 2000 with statistics mainly from ports and national statistical bureaus about the maritime container volumes. This is a rather short period, since a normal business cycle in shipping evolves over 6-7 years. This limitation is an example of unwanted restrictions but can be overcome in due time if the database can be updated continuously.
The region we cover includes 15 countries and in total about 850 ports included in Lloyd´s Voyage Record, ports that have been called by at least one ship during 2000. To be able to identify ports in the region with container handling, we have made an inventory of several sources as official statistics - national and Eurostat, port statistics, figures pub-lished by institutes and magazines and industry organisations. As a complement to the rather scattered figures we have sent questionnaires to 150 ports. The ports were selected either because they were not cov-ered in national statistics at port level or that we missed volume figures for any of the years we wanted to cover.
None of these sources covers the whole region in a consistent way, which means that there is no check list, which can be used for evalua-

Summary & Concluding Analysis - The North European Maritime Container Feeder Market
THE INSTITUTE OF SHIPPING ANALYSIS 2002-10-24 Page 26 I:\SAIEKF\RESEARCH\Vinnova\Feeder\Report\Finalreports\FinalConcluding.doc
tion of our result compared to the “real” truth of the matter. It has been surprisingly problematic to evaluate the total container volume in the region. The ports are a primary source for statistics about cargo vol-umes in maritime transports. Yet, the statistics from different secondary sources like national statistical offices, EU, industry organisations and associations etc. show severe discrepancies when comparing figures at port level.
For 103 of the 146 ports we have collected TEU-figures for the years 1997 – 2000, which together represent 99.7% of the total volume of 31 million container units in 2000 in the region. When comparing SAI´s with Eurostat´s data, we have found a discrepancy of in total 4.4 million TEU, whereof the Belgian ports represent 65%. In this calculation we have compared SAI figures from ports including empty units and Euro-stat figures, which are said to exclude empty units. But, when adding empty units, as they should according to Eurostat, the discrepancy in-creases to 6.7 million TEU. The number of ports, which show devia-tions, also increases. The total deviation represents about 20% of the total number of containers handled in the region.
Our initial conclusion was that the TEU figures varied due to the fact that some ports give figures including empty units and other excluding them. To be able to confirm this, we have been in further contact with the ports that represent the major deviation. No single and common cause could be found. The accounting of empty units is only one of sev-eral explanations. Others are differences regarding treatment of EU in-ternal volumes, lift on/ lift off units versus roll on/ roll of units, conver-sion factors from units to TEU etc. But in some cases the ports could not find any other explanation than that some units seem to disappear in the transferring of figures between the statistical offices.
7 Further research
When we hear the statement – “the market forces manage it all, don’t worry”, we very much agree, but at the same time we also know that there is always a potential for doing things better. The complexity in the transport market and its underlying dynamics in combination with con-tinuously changing conditions increase the demand for development of a range of tools and ways to identify market conditions and characteris-tics. In this context we have to remember that the transport market is segmented into a scale of different services, which in turn are more or less fragmented regarding specific activities performed as well as re-sponsibilities. To this come the society perspectives, where we also

Summary & Concluding Analysis - The North European Maritime Container Feeder Market
THE INSTITUTE OF SHIPPING ANALYSIS 2002-10-24 Page 27 I:\SAIEKF\RESEARCH\Vinnova\Feeder\Report\Finalreports\FinalConcluding.doc
have to consider the (total) dependency of a well functioning transport system – including an increasing concern for common resources.
In this context, our project findings contribute to the basis for all re-search – quantitative and qualitative methods and measures to analyse conditions in the shipping market. The work with the database tool de-veloped here for handling and management of data also gives a gener-ally applicable experience. Of course, such a tool can or shall never be entirely ready; there is always a need of continued work with mainte-nance (data), adaptation and completions e.g. for new regions. This is not trivial due to the fast increasing amount of data and increasing com-plexity to connect and extract refined data from separate databases.
But – as always, there is a never ending want list regarding better knowledge and methods for analysing the transport market from differ-ent perspectives as e.g. supply chains and underlying conditions and restrictions, capacity utilisation and recognition of inefficiencies – and the sooner, the better.
Regarding more general business dimensions, probably all enterprises can agree to the conclusion that if and when the transport system fails, this has a direct and severe impact on the manufacturing industry and its supply chains. A longer period with disturbances in the transport system will indirectly also affect the society, the world economy and welfare. Therefore, the more the economy gets globalised, the more sensitive it is to disturbances. The scale makes it impossible to secure, which in-creases the demand for knowledge and methods to identify weaknesses, sensitivity, dependency relations etc. within different supply chains, parts of the transport system and in the society as a whole.
Summary & Concluding Analysis - The North European Maritime Container Feeder Market
THE INSTITUTE OF SHIPPING ANALYSIS 2002-10-24 Page 28 I:\SAIEKF\RESEARCH\Vinnova\Feeder\Report\Finalreports\FinalConcluding.doc
Appendix: Brief summary - The database tool and achievements
There are several purposes of the developed database tools, which are to:
1. Handle large amounts of data in a structured fashion
2. Provide a sound basis for complex analyses
3. Create a flexible environment that enables complex data extrac-tion
4. Enable analysis of several domains:
• Geographical regions
• Vessels
• Traffic
• Cargo flows
The database tool is composed of several modules, of different structure and origin. Some of the modules are commercially available databases, and some are developed internally. The tool performs the following functions:
• It handles a very large amount of data, from multiple sources:
o An internal cargo handling database (SAI Cargo DB) – this database has a separate interface for data main-tenance. This interface is not used in the analysis, but is critical for the entering and classification of the data.
o A database of vessels (Fairplay PC Register) – a commercial database that contains detailed informa-tion on vessels
o A database of ship movements from Lloyd´s Marine Intelligence Unit – a commercial database containing data on vessel movements
• Processes the data separately for the domains listed above (geographical, vessels, traffic and cargo flows)
o Each domain has its own data structure
o All of the domains can be linked together through data relationships
• Generates several outputs where the domains are combined in different ways

Summary & Concluding Analysis - The North European Maritime Container Feeder Market
THE INSTITUTE OF SHIPPING ANALYSIS 2002-10-24 Page 29 I:\SAIEKF\RESEARCH\Vinnova\Feeder\Report\Finalreports\FinalConcluding.doc
All of the databases are presently in Microsoft Access-format.
By constructing this database solution, a number of achievements have been made.
General solutions to specific problems. Since the data manipulation steps are saved, they can be reused on any data matching the same relationship structure. By changing cer-tain conditions in the extraction, different areas altogether can be analysed using the same tool. The number of conditions that is spe-cific to the completion of this project has been kept to a minimum, keeping reconfiguration efforts for future analyses down.
Increased reliability. Since the tool is standardised, the human factor involvement has been kept to a minimum. Traditional analyses of this magnitude have been laden with human interaction and manual elements, af-fecting the reliability and repeatability.
Handles very large amounts of data. An analysis of this kind would, due to the amount of data, be almost impossible to perform manually. The task of counting unique ves-sels, for instance, requires that vessels are identified individually for each region. It is not possible to aggregate the results from sub re-gions leading to a new count for each new region that is added (some of the regions are very large, like NEB).
Today, the cargo database contains values for four years (1997 - 2000) and close to 150 ports. If the number of ports is increased to include other areas, such as the Mediterranean, or if more than one year is regis-tered the number of rows in the database will increase significantly. For each activity value, a minimum of three rows is registered. The envi-ronment that is used (MS Access) can handle fairly large tables (0.5 million rows at least). The larger the tables, however, the longer it takes to process them. Therefore, it may be advisable to do one or more of the following in the future:
• Keep separate databases for different years. This way, the size of each database will be kept to a manageable state.
• Convert to another database engine, like MS SQL Server or Ora-cle. A conversion to a high-grade professional database engine increases capacity and speed dramatically. The cost for introduc-ing such an engine is however considerable.
This project is limited to container traffic in a specific region. However, the cargo database can handle any type of goods in any region. To run

Summary & Concluding Analysis - The North European Maritime Container Feeder Market
THE INSTITUTE OF SHIPPING ANALYSIS 2002-10-24 Page 30 I:\SAIEKF\RESEARCH\Vinnova\Feeder\Report\Finalreports\FinalConcluding.doc
analyses on any domain, the query interface may need some small adap-tations due to necessary delimitations. Some of the queries in the analy-sis database have conditions that are necessary to keep the number of rows in the set of results down. These conditions may change if the do-main of analysis changes. An interface to easily change these conditions will be useful.
The management of data in the cargo database must be user friendly as well as flexible. There is a definite trade-off between these two proper-ties, however. Because of this, two interfaces have been constructed:
• Batch interface.
o The user defines an import filter that is used to import batches of data in another format, for instance Excel. The definition of the filter must be made once per import type.
o The batch can be handled as one unit
o The user can create a “template activity” for a region and then create a time series based on this template. Activity data for the whole time series can then be pasted from for instance Excel.
• Single item interface
o Allows the user to add, edit and delete a single activity value. This interface is very flexible, but requires more knowledge from the user.
The development of the database tools (cargo database and query data-base) is not meant to stagnate. As the tools are used, needs for further enhancements will be identified. These needs will trigger new devel-opment cycles.
Future development of the maintenance interface may include:
• Enhancements in defining import filters. A generic import func-tion may be possible.
• More advanced batch-editing functions.
• Browsing and searching functions.
The maintenance interface is not intended to provide an advanced filter-ing mechanism, which is what the query database is for. There is, how-ever, a need for basic navigation and search functions, especially when working in the single item interface.

Summary & Concluding Analysis - The North European Maritime Container Feeder Market
THE INSTITUTE OF SHIPPING ANALYSIS 2002-10-24 Page 31 I:\SAIEKF\RESEARCH\Vinnova\Feeder\Report\Finalreports\FinalConcluding.doc
References
Commission of the European Communities, 1992, Green paper on the impact of transport on the environment. A Community strategy for "sus-tainable mobility"
Commission of the European Communities, 1992, Communication from the Commission concerning the future development of the common transport policy. A global approach to the construction of a Community framework for sustainable mobility
Commission of the European Communities, 1994, Trans-European Networks, Office for Official Publications of the European Communi-ties
Commission of the European Communities, 1993, Transport in the 1990s, Office for Official Publications of the European Communities
Commission of the European Communities, 1993, The future develop-ment of the common transport policy. A global approach to the con-struction of a Community framework for sustainable mobility, Bulletin Supplement 3/93
Commission of the European Communities, 1995, Communication from the Commission, The development of short sea shipping in Europe: Prospects and challenges
Commission of the European Communities, 1997, Communication from the Commission, guidelines for state aid
Commission of the European Communities , Council Directive 95/64/CE of 8 December 1995 on statistics relating to the carriage of goods and passengers by sea
Commission of the European Communities, White Paper “Fair Payment for Infrastructure Use: A phased approach to a common transport infra-structure charging framework in the European Union”, COM (1998) 466 final
Clarkson Research Studies, Container Intelligence Monthly, various issues.
Clarkson Research Studies, Shipping Review and Outlook, autumn 2001
Containerisation International, Containerisation Yearbook, various is-sues
Drewry, Container Market Outlook, October 1999.
Drewry, Global Container Markets, Prospects and Profitability in a High Growth Era, 1996.

Summary & Concluding Analysis - The North European Maritime Container Feeder Market
THE INSTITUTE OF SHIPPING ANALYSIS 2002-10-24 Page 32 I:\SAIEKF\RESEARCH\Vinnova\Feeder\Report\Finalreports\FinalConcluding.doc
Drewry, Annual Container Market Review and Forecast, September 2001
Enright, M.J. (1998), Regional clusters and firm strategy, In: Chandler, A.D. - P. Hagström -Ö.Sölvell (eds), The Dynamic Firm. The role of technology, strategy, organization and regions, Oxford: Oxford Uni-versity Press.
European Community Shipowners’ Associations, 1997, State aid guide-lines on maritime transport
ESPO, European Sea Ports Organisation, 1994, Miljöpolicy - med re-kommendationer till miljöåtgärder, (Brussels)
Federal Marine Commission, The Ocean Shipping Reform Act, June 2000
Harlaftis, G., A History of Greek-Owned Shipping
Swedish Ministry of Finance, Ds 1999:47, Att reda sig själv – en ESO-rapport om rederier och subventioner, Lars Hultkrantz, ESO (Group of experts for studies in public sector economics)
Jonsson, O. - A. Malmberg - L.O. Olander (1996), Geografisk närhet och konkurrenskraft, Stockholm: Ministry of Industry and Employ-ment, report no. 2.
Krugman, P. (1994) Development, Geography and Economic Theory, Cambridge MA: MIT Press.
Lundquist, K-J (1996), Företag, regioner och internationell konkur-rens: Om regionala resursers betydelse, Meddelande från Lunds Uni-versitets Geografiska Institutioner, nr 129.Lund: Lund University Press.
Marshall, A. (1890), Principles of Economics, London: Macmillan.
Maskell, P. - H.Eskelinen - I. Hannibalsson - A. Malmberg - E. Vatne (1998), Competitiveness, localised learning and regional development: Specialisation and prosperity in small open economies, London: Routledge.
MDS Transmodal, The European Container Freight Market; Contain-ers By Sea, 1998
Mitsui O.S.K. Lines, Containerisation, Today and Tomorrow – for Sus-taining Economic Growth, 2001.
North, C.D., 1993, Institutionerna, tillväxten och välståndet, (Stock-holm: SNS)
NTN (Nordiskt Transportpolitiskt Nätverk), Interreg IIC (www.ntn.dk): Nordisk transport i framtiden. Krav till bærekraft og effektivitet, (Del-projekt 5), Carsten Jahn Hansen, Karl G. Høyer, Emin Tengström

Summary & Concluding Analysis - The North European Maritime Container Feeder Market
THE INSTITUTE OF SHIPPING ANALYSIS 2002-10-24 Page 33 I:\SAIEKF\RESEARCH\Vinnova\Feeder\Report\Finalreports\FinalConcluding.doc
Flaskhalsar i ett transportsammanhang - och i ett Nordsjöperspektiv, Delprojekt 6, Kenth Lumsden, Jennie Thalenius
Ocean Shipping Consultants, Containerisation in North Europe to 2015, July 2002
Porter E.M., The Competitive Advantage of Nations, 1998, London: The Macmillan Press
Saxenian, A. (1994), Regional Advantage. Culture and competition in Silicon Valley and Route 128, Cambridge MA: Harvard University Press.
Seaborne Commerce Asia, various issues.
The Institute of Shipping Analysis, (Göteborg) Baltic Maritime Outlook 2000, December 1999 Containertransporterna och feedermarknaden, 1997 Den sjöfartstekniska utvecklingen inom RoRo-, Ropax-, färje- och containersjöfarten, 1996 Market reports, 1996-2002 North European shipping entrance fees and cost structure, 1996 Shipping a Theoretical Framework, 1997 Shipping Trade and Ports, 1996 The competitiveness of Swedish shipping companies, 1996, 1997 The European Ferry Markets, 1995 The Swedish Marine Industry, 1996
Swedish Maritime Administration, Action programme for the Baltic Sea region, 1999
SOU 1995:112, Svensk sjöfart – Näring för framtiden, Report of the Shipping Policy Committee
SOU 1997:171, Den svenskflaggade handelsflottans konkurrenskraft, Report no. 1 of the Committee on Shipping Structure and Capital Situa-tion
SOU 1998:129, Svensk sjöfartsnäring – hot och möjligheter, Final re-port of the Committee on Shipping Structure and Capital Situation (SSK)
SOU 2000:8, Framtida godstransporter – transportköparnas krav på transportsystem, Report of the Goods Transport Delegation
Stopford M., 1993, Maritime Economics, (London: Routledge)
Thalenius J., 1990, Cargo Carrier Flows and Utilisation, Thesis for the degree of Licentiate of Philosophy, Chalmers University of Technology
Wergeland T. & Wijnolst N., 1996, Shipping

Summary & Concluding Analysis - The North European Maritime Container Feeder Market
THE INSTITUTE OF SHIPPING ANALYSIS 2002-10-24 Page 34 I:\SAIEKF\RESEARCH\Vinnova\Feeder\Report\Finalreports\FinalConcluding.doc
Wergeland T., Minsaas A., Omtvedt P.C., Sødal S., Fremtidig utvikling i skipsfarten og skipsfartens markeder, SNF 24/00, Stiftelsen for sam-funns- og næringslivsforskning, 2000
Wijnolst N. et. al., Malacca-Max Container Shipping Network Econ-omy, Delft Marine Technology Series, 2000
Wijnolst N. et. al., Analysis of the containership charter market 1983-1992, Delft University Press1993
World Commission on Environment and Development (WCED, Our Common Future (Brundtland Report), 1987 Other sources: Dynamar Eurostat Statistics FAO FearnResearch Federal Maritime Commission Finnlines, home page Hamburg Container Terminal Burchardkai, web IMF Lloyd´s Marine Intelligence Unit (LMIU) Lloyd's Register - Fairplay Limited OECD Team Lines, home page The Scandinavian Shipping Gazette UN Unifeeder Container Service, home page WTO