sumitomo realty & development co., ltd. 2002 annual …
TRANSCRIPT

2002 Annual Report
P u r s u i t o f g r o u n d b r e a k i n g g r o w t h
SU
MIT
OM
O R
EA
LT
Y &
DE
VE
LO
PM
EN
T C
O., L
TD
. 2002 AN
NU
AL
RE
PO
RT

Sumitomo Realty & Development Co., Ltd., a core member of the Sumitomo
Group, is one of Japan’s premier real estate companies. The Company is well
established as a comprehensive developer and supplier of high-quality office
buildings and condominiums in urban areas.
The Company is also engaged in a broad array of businesses, including real
estate brokerage, housing construction, home remodeling and building
management services. While continuing to create comfortable working and
living environments that contribute to a higher quality of life, the Company is
poised to begin a new phase of growth in the 21st century.
Contents
Cautionary Statements with Respect to Forward-Looking StatementsStatements made in this annual report with respect to plans, targets and future performance thatare not historical fact are forward-looking statements. These statements are based onmanagement’s assumptions and beliefs in light of the information currently available to it.Sumitomo Realty & Development Co., Ltd. cautions that a number of factors could cause actualresults to differ materially from those discussed in the forward-looking statements. Such factorsinclude but are not limited to macroeconomic conditions, supply and demand in the real estatemarket and interest rate trends.
Five-Year Financial Highlights ..................................................... 1
To Our Shareholders .................................................................. 2
Our History ............................................................................... 4
Sumitomo Realty & Development Group ........................................ 4
Outline of Operations ................................................................ 5
Financial Section ..................................................................... 13
Board of Directors and Auditors ................................................. 34
Corporate Data........................................................................ 34
Share Price and Trading Volume on Tokyo Stock Exchange ........... 35
Profile

SUMITOMO REALTY & DEVELOPMENT CO., LTD. 1
Revenue from Operations (Billions of yen)
1998 1999 2000 2001 2002
365
389
422
459
498
Operating Profit (Billions of yen)
1998 1999 2000 2001 2002
45
57
7175
80
Ordinary Profit (Billions of yen)
1998 1999 2000 2001 2002
5
22
27
39
47
Net Income (Loss) (Billions of yen)
1998 1999 2000 2001 2002
(66)
1115
(18)
23
Total Assets (Billions of yen)
1998 1999 2000 2001 2002
1,850
1,827
1,9161,904
1,973
Total Shareholder’s Equity (Billions of yen)
1998 1999 2000 2001 2002
175
199
211
193
214
Five-Year Financial HighlightsSumitomo Realty & Development Co., Ltd.
Thousands ofMillions of yen U.S. dollars
2002 2001 2000 1999 1998 2002
Consolidated:
Revenue from operations ¥ 497,877 ¥ 459,245 ¥ 421,587 ¥ 389,136 ¥ 364,858 $ 3,736,413
Revenue from leasing business 176,244 163,047 151,268 150,976 143,676 1,322,657
Revenue from sales business 170,428 149,196 150,483 137,735 125,327 1,279,009
Revenue from construction business 108,336 104,549 80,064 61,191 56,339 813,028
Revenue from brokerage business 35,966 34,702 31,633 27,829 27,421 269,914
Revenue from other business 6,903 7,751 8,139 11,405 12,095 51,805
Operating profit 80,370 75,218 70,548 56,516 45,412 603,152
Ordinary profit 47,142 38,509 27,069 21,688 4,985 353,786
Net income (loss) 22,996 (18,008) 14,737 10,983 (66,048) 172,578
Total assets 1,972,735 1,903,529 1,916,343 1,827,146 1,849,953 14,804,765
Total shareholders’ equity 213,767 193,442 211,140 198,498 174,528 1,604,255
Yen U.S. dollars
Per share:
Net income (loss) ¥ 56.50 ¥ (44.27) ¥ 36.23 ¥ 27.00 ¥ (162.36) $ 0.42
Shareholders’ equity 525.17 475.51 519.01 487.94 429.02 3.94
Dividend 6.00 6.00 6.00 6.00 6.00 0.05
Note: The 2002 yen amounts have been translated into U.S. dollars, for convenience only, at the rate of ¥133.25 = U.S.$1, the approximate exchange rate on March 31, 2002.

2 SUMITOMO REALTY & DEVELOPMENT CO., LTD.
Junji Takashima, President
To Our Shareholders
Sumitomo Realty achieved the goals of its Five-Year Business
Reconstruction Plan in the March 31, 2001 fiscal year, a year ahead
of schedule. The achievement of the objectives of this plan, which
was intented to counter the business difficulties encountered by the
Company as a result of the collapse of the bubble economy, opened
the door to the pursuit of groundbreaking growth in revenues and
profits outlined in our New Three-Year Plan, launched in the March
31, 2002 fiscal year.
Performance
In the fiscal year under review, the first year of our New Three-Year
Plan, all four of our core businesses (leasing, sales, construction, and
brokerage services) achieved growth in revenues. As a result,
consolidated revenue from operations was ¥498 billion, operating
profit was ¥80 billion, ordinary profit was ¥47 billion, and net income
was ¥23 billion. All these figures set new records, and fulfilled our
plan for the year, although some businesses were better than others.
The Performance Goals of the New Three-Year Plan
Goals for performance in the final year of the New Three-Year Plan,
the March 31, 2004 term, are as follows:
Consolidated revenues from operations: ¥600 billion(a 30% increase over the March 31, 2001 fiscal year)
Consolidated operating profit: ¥105 billion(a 40% increase over the March 31, 2001 fiscal year)
Consolidated ordinary profit: ¥70 billion(an 82% increase over the March 31, 2001 fiscal year)
Under the Five-Year Business Reconstruction Plan, the three
mainstay businesses of leasing, sales, and brokerage services drove
performance improvements. Under the New Three-Year Plan,
however, construction (of housing) has been developed into a
mainstay business, a fourth pillar supporting the expansion of the
Company’s operations. As a result of the balanced strengthening of
these four mainstay businesses, with their differing revenue structures
and characters of business risk, the Company will continue the efforts
to maintain growth in revenue as well as operating and ordinary profit,
as it has done in each of the five fiscal years beginning with the March
31, 1998 term.
Operating revenue goals for each segment are as follows:
The leasing business will complete and open 18 new office buildings,
increasing leased floor space by approximately 30%, which is forecast
to increase revenue from operations to ¥210 billion in the March 31,
2004 fiscal year (an increase of 28% over the March 31, 2001 fiscal
year).
The goal of our sales business is to sell more than 4,000
condominiums per year, thereby keeping the position of being in the
list of the top five firms in terms of market share. This will enable the
sales business to increase revenue from operations to over ¥200
billion in the March 31, 2004 fiscal year (an increase of 34% over the
March 31, 2001 term).
By the March 31, 2004 fiscal year, the construction business intends
to increase revenue from operations to ¥140 billion (23% higher than
in the March 31, 2001 fiscal year) on projects involving 8,000 homes
from three sources: custom-built, two-by-four homes through
Sumitomo Fudosan Home Co., Ltd.; standardized homes marketed
under the “Sereies of World Home Designs” brand name; and
This Company’s Business (Primary business)
Leasing : Commercial Buildings development and leasing.
Sales : Condominium development and sales to the homeowner.
Construction : Custom Home contracted and built for homeowners.
Brokerage : Brokerage of new and existing residential homes, and of someincome producing commercial properties.

SUMITOMO REALTY & DEVELOPMENT CO., LTD. 3
remodeling projects using a new system called Shinchiku Sokkurisan
(“As Good as New”).
In the brokerage business, the performance of Sumitomo Real
Estate Sales Co., Ltd. has proved its position as the leader of its
industry. By steadily increasing its market share, this business is
working toward a goal of over ¥40 billion in revenue from operations
in the March 31, 2004 fiscal year (an increase of 15% over the
March 31, 2001 fiscal year).
Progress in Resolving Asset Quality Issues
Under the Five-Year Business Reconstruction Plan, the Company
reduced real estate properties held for resale, wrote off the bad loans
of our finance subsidiary, and disposed of the unrealized capital losses
of our subleasing operations and overseas operations. This resulted in
a total extraordinary loss of ¥209 billion, which virtually completed the
disposal of these liabilities. At the same time, Sumitomo Realty moved
aggressively in response to renewed accounting standards, the
Company adopted new accounting standard on consolidated financial
statements, new accounting standards for financial instruments and
actuarial methods of measuring projected benefit obligations. The last
of these issues to be considered is the impairment of long-lived
assets. This will become compulsory in the March 31, 2006 fiscal
year, but when early application of this accounting method becomes
allowed in the March 2004 fiscal year, which in our final year of the
New Three-Year Plan.
As for fixed assets in the leasing segment, the yield on total
leasing assets * has improved by approximately two percentage points
over the last seven years, rising to 4.5% at the end of the fiscal year
under review. Yield on total leasing assets is forecast to go up to
almost 6% by the end of the March 31, 2004 fiscal year. Average
yield on assets in operation exceeds 6%, and is expected to rise to
7%. Because the details of the impairment accounting method are
not clear, we cannot at this point in time precisely calculate the
monetary effect its implementation will have. However, considering
this rapid improvement in the yield on leasing assets together with
forecasts of ¥170 billion in ordinary profit during the New Three-Year
Plan, we believe that we have enough room to absorb the impairment
in full.
As soon as method of impairment accounting and asset valuation
standards are finalized, Sumitomo Realty will, as always, take positive
steps to implement them.
*Yield on total leasing assets =
(operating profit from leasing operations + depreciation expenses)÷
(total assets in the leasing segment, net of security deposit received).
Strengthening our Financial Structure
In the interest of building a stable financial base, which is identified in
the New Three-Year Plan as an important issue for the Company, we
are working to reduce total interest-bearing liabilities of the Sumitomo
Realty Group (the total of bank loans, bonds, commercial paper, and
liabilities on guarantees, and conditional guarantees) to ten times
operating profit by the March 31, 2004 fiscal year.
With the accomplishment of this goal, the company will be able to
sustain future increases in interest rates and to establish a strong
profit structure.
The disposition of latent losses conducted during the execution of
our Five-Year Business Reconstruction Plan caused the contraction of
shareholders’ equity. The Company is striving to strengthen
shareholders’ equity in response to this, as well as to raise the
company’s credit rating by improving its debt-equity ratio.
Fixed-rate liabilities already account for 70% of the Company’s
interest-bearing liabilities, and we intend to maintain this throughout
the New Three-Year Plan.
Sumitomo Realty requests the continued understanding and
support of its shareholders, as the Company bends its utmost efforts
to the attainment of the goals of its management plan.
Junji Takashima, President
July 2002

4 SUMITOMO REALTY & DEVELOPMENT CO., LTD.
BROKERAGE BUSINESS
Sumitomo Real Estate Sales Co., Ltd.
LEASING BUSINESS
Building Development Division
Building Management Division
Shintoshin Real Estate Co., Ltd.
Sumitomo Fudosan Tatemono Service Co., Ltd.
Shinjuku Sumitomo Building
Management Co., Ltd.
SALES BUSINESS
Condominium Development Division
CONSTRUCTION BUSINESS
Housing Business Division Number IHousing Business Division Number IISumitomo Fudosan Home Co., Ltd.
Sumitomo Fudosan Syscon Co., Ltd.
Universal Home Inc.
OTHER BUSINESS
Sumitomo Fudosan Fitness Co., Ltd.
Izumi Restaurant Co., Ltd.
Sumitomo Fudosan Finance Co., Ltd.
KS Techno Co., Ltd.
Our History
Sumitomo Realty & Development Group
1949 Izumi Real Estate Co., Ltd. established as the successor to the holding company of the Sumitomo zaibatsu following the breakup of the conglomerate.
1957 Izumi Real Estate Co., Ltd. changed its name to Sumitomo Realty & Development Co., Ltd.
1963 Mergered the holding company of the former Sumitomo zaibatsu during its liquidation.
1964 Entered the condominium sales business with the Hama-Ashiya Mansion, located in Kobe, Hyogo Prefecture.
1970 Listed stocks on the Tokyo and Osaka stock exchanges market.
1973 Established Sumitomo Fudosan Tatemono Service Co., Ltd., a consolidated subsidiary.
1974 Completed construction of the 52-story Shinjuku Sumitomo Building in Shinjuku, Tokyo, and company headquarters moved there from the Tokyo
Sumitomo Building in Marunouchi,Tokyo.
1975 Established Sumitomo Real Estate Sales Co., Ltd., a consolidated subsidiary.
1982 Established Sumitomo Fudosan Home Co., Ltd., a consolidated subsidiary. Completed construction of the 30-story Shinjuku NS Building in Shinjuku,
Tokyo; company headquarters moved there from Shinjuku Sumitomo Building.
1995 Commenced “American Comfort” standardized housing construction business.
1996 Commenced “Shinchiku Sokkurisan” remodeling business.
1998 Sumitomo Real Estate Sales Co., Ltd., a consolidated subsidiary listed stocks on the Tokyo Stock Exchange market.
1999 Universal Home Inc., a consolidated subsidiary listed on JASDAQ (over the counter with the Japan Securities Dealers Association.)
2002 The Izumi Garden City (Roppongi 1-Chome Redevelopment project) scheduled for completion.

SUMITOMO REALTY & DEVELOPMENT CO., LTD. 5
LEASINGOutline of Operations
Outline
The Strengths of the Company’s Leasing Operations
The Company entered the field of office building leasing in the
second half of the 1970s, much later than its competitors. For that
reason, Sumitomo Realty’s leasing operations have the characteristics
shown below.
Because investments have been primarily directed at
central Tokyo, the Company has an outstanding real-estate
portfolio.
Central 3 Wards 46% Central 5 Wards 66%
Central 7 Wards 77% Central 14 Wards 89%
Central 3 Wards: Chiyoda, Minato, and Chuo
Central 5 Wards: Central 3 wards plus Shinjuku and Shibuya
Central 7 Wards: Central 5 wards plus Shinagawa and Bunkyo
Central 14 Wards: Central 7 wards plus Taito, Koto, Toshima, Sumida,
Meguro, Ota, and Nakano
In Japan, the tendency toward concentration of commercial activity
to central Tokyo is growing, particularly in the service sector.
Sumitomo Realty’s office building portfolio, heavily weighted as it is
in central Tokyo, therefore offers both stable revenues and potential
for future growth.
The Company’s portfolio includes many comparatively new,
upscale buildings.
Buildings less than 10 years old 48%
Buildings less than 20 years old 92%
As the IT revolution continues, the level of support facilities demanded
by office building tenants grows higher every day, and buildings that do
not provide IT support or earthquake protection are quickly growing
less desirable. As many of Sumitomo Realty’s buildings are of recent
construction, they retain their competitive edge. Buildings now under
Concentrationin Tokyo CBD (%)
Young Portfolio (%)
89 92
construction will offer quake-absorbent structures and separate climate
control systems for each suite, as well as reinforced floors for heavy
loads, high-capacity electricity systems, high ceilings, and many other
features to satisfy tenants.
In addition, as our buildings are newer we need to make few investments
in refurbishment. Therefore, more funds can be allotted to investment in
new construction.
Because the Company’s employees are directly involved in
each stage of its development operations, Sumitomo Realty is
amassing a wealth of knowledge in the construction and
management of large buildings.
Sumitomo Realty has adopted the method of being directly involved
in sorting out complex tangles of land ownership and rights, and
assembling lands for the construction of office buildings. This has
significantly reduced the cost of acquiring land for development, and
has fostered for the Company a wealth of in-house expertise in land
acquisition and development.
The Company’s highly capable corps of sales personnel maintains
contact with potential corporate clients, quickly identifies needs for
relocation or additional floor space, and negotiates lease
arrangements directly with the tenants. As a result, the value of
office space can be decided without interference from third-party
real estate agents, and it becomes possible for us to develop office
buildings that not only incorporate the very newest specifications,
but also reflect the direction of trends in tenant requirements.
The Company’s office buildings are managed by Sumitomo Group
personnel, which also allows the precise and prompt identification of
tenant needs for relocation or a larger space, which allows us to
offer precise and detailed service to each tenant.
The NS Building [Completed Sep. 1982]

6 SUMITOMO REALTY & DEVELOPMENT CO., LTD.
Performance
The market for office space in Tokyo in the
March 31, 2001 fiscal year saw flourishing
expansion demand from information and
communications firms and foreign firms, but
new construction was limited. This caused a
rapid decline in the vacancy rate, which
produced a supply-and-demand crunch and
caused rents to rise throughout central
Tokyo.
However situation has changed for this
fiscal year. The worldwide slump in IT-related
industries caused corporate performance to
a reversal of the rapid increases in market
rents for new buildings, seen a year earlier.
Even though the vacancy rate in our existing
buildings had risen to 4% at the end of the
fiscal year, market vacancy kept the 3%
level. This produced a tight supply and
demand situation, which made it possible to
maintain the level of market rates.
Benefiting from the steady decline in the
vacancy rate and the increase in rental
income, Sumitomo Realty’s leasing business
achieved a counterturn growth in revenues
from existing buildings. The Iidabashi First
Building, the Shiba Koen First Building, and
other buildings completed during the
previous term, contributed a full year rental
income during the fiscal year under review.
These factors, together with revenue from
the recently opened Sumitomo Realty Shiba
Koen Tower, helped revenue from real-
estate leasing to rise by ¥13,458 million, to
¥178,034 million. Operating profit in this
business increased by ¥2,787 million to
¥49,225 million.
show a downward adjustment and brought
wide-scale restructuring. The terrorist attacks
on September 11 and the subsequent U.S.-
led military operations caused confidence in
the business community to weaken further,
and tenant relocation and expansion of space
temporarily declined. Demand, therefore,
remained latent. Developers in Tokyo
commenced full-scale pre-leasing activities
for buildings to be completed during calender
year, 2003 , in the teeth of fierce
competition for major tenants, which caused
The Sumitomo Fudosan Shibakoen Tower [Completed Jul. 2001]
The Sumitomo Fudosan Iidabashi Building Number3[Completed Mar. 2002]
LEASING

SUMITOMO REALTY & DEVELOPMENT CO., LTD. 7
Outlook
The future of the economy remains opaque,
preventing meaningful forecasts. At the end
of 2001, though, we saw signs of a recovery
in tenant relocation needs and space
expansion. As our buildings under
construction near completion, we are seeing
strong interest from potential tenants. As
activities of advance leasing of large buildings
in the Tokyo market scheduled for opening in
year 2003 , comes to an end after the
successful lease-up that is forcasted takes
place, we might start to see renewed balance
in the supply and demand for newer,
competitive buildings from as early as the
third quarter of this next fiscal year.
The shift of office demand from the
provinces to Tokyo and an increase in per-
capita floor-space requirements justify a
prediction that demand for office space in
Tokyo will continue to grow in the medium to
long term. Since, the concentration of
demand for office buildings with facilities that
Total of Gross Floor Areas for Leasing (Thousands of m2)
1998 1999 2000 2001 2002 2003F 2004F
2,027 2,083 2,0512,232
2,360
2,7452,852
Other Tokyo 23 Wards New Operation
Operating Profit
LEASING BUSINESSRevenue & Operating Profit (Billions of yen)
1998 1999 2000 2001 2002 2003F 2004F
14537
15244
15346
16546
17849
19356
21066
Revenue
meet the requirements of the IT revolution
will lead to further remodeling or scrap-and-
build replacement of less competitive office
buildings, this increase in supply seems to
cause little chance that the supply and
demand imbalance will persist over the long
term.
Sumitomo Realty’s buildings are relatively
new, and therefore highly competitive. Newly
opened buildings and buildings opening in the
term to come are forecast to bring increases
in revenues and profits. However, securing
tenants in preparation for the completion of
large scale projects such as the Roppongi 1-
Chome Redevelopment Project, the Nishi-
Shinjuku 6-Chome Redevelopment Project in
the term to come is the biggest issue bearing
on meeting the goals of the New Three-Year
Plan. To accomplish this challenge, the
Company will be intensifying its already
vigorous marketing activities.
The Roppongi 1-Chome Redevelopment Project( The Izumi Garden City building complex)
Information and communications firms and foreign corporations are concentrated in Roppongi
district, and the area has become a prominent commercial center in Tokyo. In October 2002, the
Izumi Garden City will open in Roppongi to serve this business community.
Roppongi 1-chome has been a high-status area since the days of the Shoguns, and is near to
the famous Hotel Okura and the U.S. Embassy. In this highly regarded area, Sumitomo Realty is
constructing the landmark super high-rise Izumi Garden Tower office building complex on a
23,869m2 site. It will be accompanied by the Izumi Garden Residence luxury condominiums, a hotel,
a fitness club, restaurants, and other facilities.
Greenery from the Edo-era estate of the Sumitomo clan will be used to landscape a public
garden crossed by footpaths, and Sumitomo clan artifacts and heirlooms will be on display in an art
museum. This facility represents the fusion of Japanese history, culture, and tradition with a highly
functional urban environment.
The Izumi Garden Tower itself boasts state-of-the-art earthquake resistant design, individually
controlled air conditioning and heating systems for each suite, and all-glass walls that offer
spectacular views. With a ceiling height of 3.0 meters and 0.3 meters of under-floor cable space,
and a backup power system, this building will offer the most advanced office infrastructure in Japan
that is capable of accommodating the most advanced IT functionality. This is a city unto itself,
reflecting Sumitomo Realty’s accumulated development expertise in residential, commercial, and
recreational facilities.
Outline of the “Izumi Garden Tower” Total floor space: 157,365m2
Standard Floor Area: 2,737m2
Floors: 45 floors, 2 basementsHeight: 201 metersStructure: Steel encased in Reinforced Concrete
(SRC) + CFT columns
LEASING

8 SUMITOMO REALTY & DEVELOPMENT CO., LTD.
Outlook
In the fiscal year ending March 31, 2003,
Sumitomo Realty expects a temporary
worsening of profitability due to a rise in
construction costs. The Company plans to
compensate for this with an increase in sales
volume and intends to keep the level of
operating income as in the fiscal year under
review. Condominium sales contracts are
expected to be brisk in the coming fiscal
year. Of the 4,400 units that Sumitomo
Realty plans to sell in the fiscal year ending
March 31, 2003, which would represent a
10.0% increase from the previous fiscal year,
the Company already had concluded
contracts for 52% of these at the beginning
of the fiscal year (up 4 percentage points
from the previous fiscal year).
Over the medium term, despite such
fundamental problems as a persistent sense
of uncertainty about the economy, there is
Performance
Repeating a trend observed in the previous
fiscal year, overall favorable conditions
prevailed thanks to a supportive environment
that included a tax-reducing housing loan tax
credit program which was enacted at the end
of 1998 and continued low housing loan
interest rates. In the Tokyo metropolitan area
there was considerable consumer interest in
high-rise tower condominium and large
condominium projects situated near stations,
which mirrored a conspicuous rise in the
popularity of condominiums in central Tokyo.
In addition, demand segments expanded due
to improved locations and product planning,
which led to vigorous purchases of
condominiums by consumers in upper age
groups as well as by single persons. As a
result, condominiums that we supplied in
Tokyo successfully attracted numerous
customers, and there were even instances of
sales prices rising. Conversely, sales prices
for the average condominiums in suburban
areas in general, continued to decline. The
trends that prevailed in Tokyo were observed
in other cities as well.
Amid this environment, the sales
business recorded total sales of
condominiums, detached houses and
residential land of 4,146 units, up 520 units
from the previous fiscal year, thanks largely
to land acquisition strategies that emphasized
large-sized condominiums and locations in
central urban areas. The sales business
achieved sharp growth in both revenue and
profit, with revenue rising ¥21,232 million to
¥170,428 million, and operating income
increasing ¥4,694 million to ¥24,388 million.
Condominium sales contracts totaled 4,358
units, an increase of 143 units over the
previous year, and represented a new all-time
high.
The Park Square Yokohama [Completed Sep. 2001]
Exterior and interior of The Central Residence Shinjuku City Tower[Completed Dec. 2001]
SALES

SUMITOMO REALTY & DEVELOPMENT CO., LTD. 9
Operating Profit
SALES BUSINESSRevenue & Operating Profit (Billions of yen)
1998 1999 2000 2001 2002 2003F 2004F
1267
1387
15119
14920
17024
18924
20025
Revenue
Ranking of Condominium Suppliers
1997 1998 1999 2000 2001
2,2722,585
3,8854,278 4,335
10th9th
7th
6th 3rd
Number of Units Supplied
Outline
Comprising the core of Sumitomo Realty’s sales
business, development and sales of
condominiums account for 95% of total sales in
this segment. Sumitomo Realty commenced its
condominium sales business earlier than almost
all its competitors, enabling the Company to
earn the distinction of being Japan’s
Condominium Pioneer.
The Company’s condominium operations
are focused mainly on Japan’s six largest
urban areas: the Tokyo metropolitan area,
Osaka/Kobe, Sapporo, Sendai, Nagoya, and
Fukuoka. In 2001, Sumitomo Realty
significantly increased its market share,
jumping from the sixth position to the No. 3
ranking for all of Japan in terms of number of
units provided during the year. Looking
ahead, the Company will carry out its
operations with the aim of firmly maintaining
its ranking within the top five condominium
providers.
As with its leasing business, Sumitomo
Realty and the entire Sumitomo Realty Group
engage directly in purchasing land for
development, planning products, selling
condominium units, and managing properties
after condominium sales. This approach
enables the Company to provide high-quality
products and well-focused service with
feedback of customer needs.
Our investment turnover ratio and high
operating margin are at the top of the
industry. Since market fluctuation risk is a
given in this condominium business, it is our
policy to level this market risk by offering
stable supplies and pursuing brand-
enhancement strategies through the continued
sale of high-quality units and products.
likely to be a continuation of macroeconomic
factors supporting the sales of condominiums
for sometime, such as tax reductions, lower
interest rates, and stable prices. However,
there are concerns of a rise in land prices
due to the slowing pace of land being
released for sale in the market by corporate
sources. There is a possibility this could lead
to a decline in the supply of condominiums
and a rise in prices of condominiums. When
considering that stable prices for
condominiums is a vital element of favorable
market conditions, the previously mentioned
rise in prices is a risk factor that could
adversely affect future market conditions.
As a result of the advance procurement
of lands for large-scale condominiums, as of
the end of the fiscal year under review we
had secured lands for development planed to
be completed for the fiscal year ending
March 31, 2004. For the following two
years, we have already completed over 50%
of our planned land purchases.
The Osaka City Tower [Scheduled for completion in Dec. 2003]
SALES

10 SUMITOMO REALTY & DEVELOPMENT CO., LTD.
Performance
Business conditions deteriorated throughout
Japan in the fiscal year ended March 31,
2002 owing to a rise in the unemployment
rate and widening perceptions of a recession
as well as a shift in demand away from
detached houses toward condominiums.
Sumitomo Realty was not immune to these
trends, and the Company’s orders for new
detached houses unavoidably declined. We
compensated for this decline with an
increase in orders for Shinchiku Sokkurisan,
a new system for replacing houses, that
brought total new orders to ¥112,172
Number of Orders Year-on-Year Number of Units Year-on-Year(units) Received Increase Completed Increase
In addition, revenue from the construction
business, which includes general
refurbishments and interior and exterior work,
amounted to ¥115,329 million, an increase
Product Lineup
1. New Detached House Construction
The Company has in the past contracted for
the construction of detached houses with
purchasers of residential lots which the
company has developed and subdivided. But
in 1982, the company established Sumitomo
Fudosan Home and to take on and develop
this business. In the early years of this
business Sumitomo Fudosan Home adopted
designs and construction methods in and
around Los Angeles, introduced by its sister
company in California, Sumitomo Realty &
Development, CA Inc. (then La Solana
Corporation), and engaged primarily in the
construction of custom-designed, midrange
and upscale wood-frame houses. However,
since competition from large builders of
midrange and upscale homes was intense,
this company went through a long-term
struggle, just keeping the 1,000 units per
year supply, without a chance to expand its
business.
Sumitomo Realty’s Housing Business
Division Number 1, which handles the
construction of standardized houses, took a
hint from the construction of emergency
housing for victims of the Hanshin-Awaji
Shinchiku Sokkurisan 3,770 +819 3,547 +833
American Comfort 1,254 -244 1,358 +54
Sumitomo Fudosan Home 1,108 -195 1,189 -110
2. The Shinchiku Sokkurisan FullRemodeling Package
In the renovation market in Japan, customers
often carry the risk of cost overruns, and it is
said that the high cost of renovation
sometimes does not make it less expensive
to rebuilt. This is due to an outdated industry
standard in construction management .
In 1996, Sumitomo Realty overturned this
prevalent assumption with its Shinchiku
Sokkurisan business model. Providing the
customer with a transparent fixed price per
floor area menu, the customer can expect to
fully remodel his/her house with half the cost
and half the construction period of that of
rebuilding.
Earthquake, and in 1995 developed its line
of high-quality, low-cost, Western-style
“American Comfort” homes. This business
has attracted a good deal of attention in the
industry by achieving an annual growth rate
of over 30%. However, the number of
competing products in this price range has
increased, and growth has sagged over the
past two years. In response, the Company
expanded its design portfolio to cover nine
styles of seven countries, with the addition of
a new Mediterranean style product line in
2002. All with the same unit price, these
homes are marketed under the “Series of
World Home Designs” line.
million, up ¥2,467 million from the previous
fiscal year.
of ¥1,780 million from the previous fiscal
year. Operating profit totaled ¥4,772 million,
up ¥755 million from the previous fiscal year.
Before After
CONSTRUCTION
Business results for the year under review were as follows.
Shinchiku Sokkurisan

SUMITOMO REALTY & DEVELOPMENT CO., LTD. 11
Operating Profit
HOUSING BUSINESSRevenue & Operating Profit (Billions of yen)
1998 1999 2000 2001 2002 2003F 2004F
62(0.1)
672.4
874.8
1144.0
1154.8
1306.0
1407.0
Revenue
1997 1998 1999 2000 2001 2002 2003F 2004F
New Detached House Shinchiku Sokkurisan
Housing Units Sold By Key Commodities (Units)
1,967 1,627 1,8352,405
2,8012,362 2,450 2,600191 462
695
1,569
2,9513,770
4,8005,400
Outlook
There are no particular signs of an
improvement in market conditions in the
coming fiscal year and the difficult
environment for orders for detached houses
is expected to persist. In the fiscal year
ended March 31, 2002, the Company
implemented cost-reduction measures, which
included closing model homes unable to
satisfactorily attract customers, consolidating
its marketing bases, and reducing business
expenses. These measures enabled the
Company to lower its breakeven point. On
the other hand, to enhance the appeal of its
products with the aim of securing an increase
in new orders, Sumitomo Realty added a new
Mediterranean style home to its American
Comfort Series, while reevaluating its existing
lineup of homes and launching its “Series of
World Home Designs”. In October 2002, the
business of Sumitomo Realty Homes will be
transferred to and mergered by Sumitomo
Realty’s Housing Business Division Number
1. As a result, we will have integrated our
custom-built home business with the “Series
of World Home Designs” standardized homes
business. We are working to reduce costs by
raising the efficiency of our administrative
divisions and after-service divisions and by
strengthening materials procurement
functions. We are also striving to expand our
business by fortifying our Product
Development Division and by expanding and
upgrading our network of sales offices.
Our Shinchiku Sokkurisan system boasts
revolutionary new product features that
include enabling a 50% reduction in costs
and construction periods compared with
rebuilding houses and our business model
have succeeded in earning strong consumer
support. The Shinchiku Sokkurisan system
debuted five years ago and is expected to
achieve annual growth of 20% or higher in
the years ahead. Accordingly, we plan to
continue to vigorously expand and upgrade
our network of sales offices and add new
staff.
In this manner, by formulating strategies
that enable an immediate response to the
business environment, we will step up our
efforts to establish this business as the fourth
pillar of our operations.
Power Column 30Sumitomo Realty has developed the Power Column 30 (patent pending) design method, which
increases earthquake resistance by 30% conpared to its existing product by reinforcing the four
corners of the 2×4 wood frame houses. Power Column 30 is a new concept that increasesearthquake resistance by designing the product with focus attention on the twisting mechanism by
which an earthquake destroys a building. Houses incorporating the new design method will be able
to withstand even an earthquake 1.4 times more severe than the 1995 Hanshin-Awaji Earthquake,
a size that the possible “Tokai earth quake” to come may reach.
A 30% improvement in earthquake resistance over2×4 method of construction.
Series of World Home Designs
CONSTRUCTION

12 SUMITOMO REALTY & DEVELOPMENT CO., LTD.
Operating Profit
BROKERAGE BUSINESSRevenue & Operating Profit (Billions of yen)
1998 1999 2000 2001 2002 2003F 2004F
284.7
285.3
327.2
358.7
368
388.5
409
Revenue
1997 1998 1999 2000 2001 2002 2003F
18,65017,063 17,734
21,43123,051
23,96825,595
Chart of Brokerage Business
Number of brokerage transactions
BROKERAGE
Past and Present
Sumitomo Real Estate Sales Co., Ltd., which
carries out the Company’s real estate
brokerage business, was established in 1975
to handle the sale of condominiums
developed by Sumitomo Realty. In 1979,
Sumitomo Real Estate Sales entered the real
estate brokerage sector, where it has
achieved significant success, and
subsequently listed its shares on the Tokyo
Stock Exchange in 1998.
Sumitomo Real Estate Sales operates a
network of branch offices under the
Sumitomo Real Estate Sales STEP brand
name, and these offices maintain close ties
with the local communities they serve. This
company has steadily increased its business
by expanding and upgrading its network of
brokerage offices. Sumitomo Real Estate
Sales recorded a noteworthy milestone in
December 2001 when it opened its 200th
brokerage office. All brokerage offices are
directly managed and boast high profit
margins, and Sumitomo Real Estate Sales
holds the No. 1 position in the industry in
terms of brokerage revenues on a non-
consolidated basis. We plan to further
expand our marketing base and steadily
increase our market share.
Performance
Before the fiscal year under review, a sense
of price affordability along with tax reductions
on home purchases and low interest rates
supported a continued favorable environment
in the market for existing housing. However,
in the fiscal year ended March 31, 2002, in
addition to a continued downtrend in
transaction prices, transactions in the overall
market declined because of worsening
economic sentiment resulting from such
factors as a rising unemployment rate.
Amid this environment, the brokerage
business opened eight new directly managed
brokerage offices in the fiscal year under
review (achieving its target of establishing a
nationwide network of 200 brokerage
offices) and also worked to expand its
revenues. Although we achieved growth in
the number of transactions and expanded our
market share, revenues from fees per
transaction shrank because of declining sales
prices. These factors held revenue from the
brokerage business to ¥36,184 million, an
increase of ¥1,302 million. Operating income
declined ¥767 million to ¥7,953 million,
marking the first decrease in operating profit
in five years.
Outlook
Prospects are dim in the fiscal year ending
March 31, 2003 for a revival of the market
for existing housing as well as for a halt in
the decline in sales prices.
We will continue to open new brokerage
offices and upgrade the marketing force and
raise the productivity of our existing
brokerage offices by sharing information on
houses through the full-fledged start up of a
Customer Relationship Management system.
At the same time, we will diversify our
business into areas such as commercial
brokerage in response to the needs of our
growing number of corporate customers, and
into brokerage of residential leases. By
covering all of these challenges we will make
efforts to expand our business as we
respond to a harsh environment.
The Headoffice of Sumitomo Real Estate Sales Co.,Ltd.

Financial Review .............................................................................. 14
Consolidated Balance Sheets............................................................ 16
Consolidated Statements of Operations ............................................ 18
Consolidated Statements of Shareholders’ Equity ............................... 19
Consolidated Statements of Cash Flows ............................................ 20
Notes to Consolidated Financial Statements ...................................... 21
Report of Independent Public Accountants ......................................... 33
Financial Section
SUMITOMO REALTY & DEVELOPMENT CO., LTD. 13

14 SUMITOMO REALTY & DEVELOPMENT CO., LTD.
Financial Review
1. Earnings StructureThe Company’s four principal businesses are leasing, sales, construction, and brokerage services. Incomparison with the March 31, 1995 fiscal year, which was the previous low point in performance,operating profit in the leasing business is up by 45%, in the sales business by 85%, in theconstruction business by 171%, and in the brokerage business by 42%.
The leasing and sales businesses require large amounts of operating capital but only small laborforces, and their acquisitions of land for development of office buildings and condominiums precedeleasing and sales activity. In these sectors, production are in progress based on market projections.In the construction and brokerage businesses, little capital is needed, but labor requirements areheavy. In these sectors, production follows order of clients required. Therefore, the cost structuresof the various businesses vary, as do their requirements for resources and their characters ofbusiness risks. The achievement of a balanced allocation of management resources among thesefour business areas will allow Sumitomo Realty to grow, while at the same time allow the companyto responding to changes in the management environment and manage business risks.
In the March 31, 2002 fiscal year, the leasing business accounted for 61% of operating profit, thesales business for 30%, the construction business for 6%, and the brokerage business for 10%,while other businesses and overhead costs accounted for -7%.
The leasing and Sales businesses which make a large contribution to earnings require a largevolume of capital resourses. Thus, almost all of the cost of funds that were posted under otherexpenses were attributable to these businesses. In contrast, since the construction and brokeragebusinesses require no infusion of funds, their operating profit can be nearly equal to their currentprofit. These two businesses accounted for 27% of ordinary profit much higher than 16% ofoperating profit.
2. Growth ForecastsThe New Three-Year Plan, commenced in the fiscal year ended March 31, 2001 and running untilMarch 31, 2004, sets a high goal of almost doubling current profit.
During the period of this plan, several large office buildings representing substantial investmentsin land will complete, after a long time of land assemblage and this is forecast to bring a 30%increase in the Company’s total floor space for leasing. As a result, the leasing business is expectedto show 27% growth in operating revenues, to ¥45 billion, and 42% growth in operating profit, to¥20 billion. Because the average age of the Company’s buildings is low, little investment in repairsor maintenance is needed, and cash flows from periodic income can be applied to investments innew buildings. In addition, since the Company constructs buildings on already acquired and holdinglands, a maximum return on additional investments can be reached from up to 10% to 20%.Although there is a degree of rental market risk we are in a stage of reaping the fruits of pastinvestment in office development. This is why the leasing business is expected to be the primarydriver of growth during the New Three-Year Plan.
We are also achieving substantial success in our other three primary businesses. Tax cuts, lowinterest rates, and an abundant supply of land have stabilized costs in the condominium developmentfield, which is the nucleus of our sales business. Supported by this macro-environment, favorablemarket conditions continue. Maximizing the benefits of this tailwind, Sumitomo Realty continues toexpand revenues and profits. Although orders for new detached houses remain weak, ourconstruction business is seeing high growth in its Shinchiku Sokkurisan operations. Our brokerageservice business is commanding a higher market share, and is growing steadily.
It is axiomatic that our operations always go with various business risks and market risks, but webelieve that a balanced portfolio will allow us to achieve our management goals.
1998 1999
Leasing Business Revenue
2000 2001 2002 2003F 2004F
144 151 153 165 178 193 210125 138 151 149 170 189 20062 67 87 114 115 130 14027 28 32 35 36 38 40
Revenue from Operations By Segment(Billions of yen)
Housing Business RevenueSales Business RevenueBrokerage Business Revenue
Operating Profit
Revenue & Operation Profit From Operations(Billions of yen)
1997 1998 1999 2000 2001 2002 2003F 2004F
339 365 389 422 459 498 550 60043 45 57 71 75 80 90 105
Revenue
Interest-Bearing Debt / Operating Profit Ratio(Times)
1997 1998 1999 2000 2001 2002 2003F 2004F
3534
26
19
1615
10
ROE (%)
1997 1998 1999 2000 2001 2002
(0.7)
(30.8)
5.7 7.0
(8.8)
11.3

SUMITOMO REALTY & DEVELOPMENT CO., LTD. 15
3. AssetsThe collapse of the bubble economy and subsequent asset deflation have dealt the Company’sassets a severe blow. However, during the course of the Five-Year Business Reconstruction Plan,which was terminated a year early as goals were met during the March 31, 2001 fiscal year, anextraordinary loss of ¥209 billion was posted. This significantly improved the condition of our assets.We have also complied with new accounting standards and dealt with the effects.
We dealt with the March 2000 fiscal year loss on revaluation of real estate for sale and work inprogress investory.
In the March 1998 and 2001 fiscal years, Sumitomo Fudosan Finance wrote down a total of¥130 billion in bad loans, reducing them from a peak of ¥333 billion to ¥16 billion .
In the March 2000 fiscal year, most overseas assets were liquidated and capital recovered inconnection with a loss posted on business reorganization, and total investments were cut from ahigh point of ¥176 billion to ¥14 billion.
Standards for actual authority within the scope of consolidation were promulgated in the March2000 fiscal year, in advance of the deadline.
The Company switched to current value accounting for financial products in the March 2001fiscal year, in advance of the deadline.
In the fiscal year ended March 31, 2001, the Company switched to current value accounting forretirement benefit obligations, and wrote off the entire transition cost.
As a result, the only issue remaining with respect to assets is the conversion to impairmentaccounting for fixed assets. As soon as concrete standards for asset accounting and valuation arefixed, the Company intends to, as always, implement them in advance.
In the fiscal year under review, total assets grew by ¥69 billion to ¥1,972 billion. This wasprimarily the result of investments in leasing properties, which caused tangible fixed assets toincrease by ¥53 billion.
To create an opportunity for real-estate development operations without burdening the balancesheets, the Company established special purpose vehicles (SPV) for equity investment. These SPVstook out non-recourse loans to finance the acquisition of lands for development. To clarify theamount of the Company’s investment in these SPVs we added a new “equity in real estate for sale”balance sheet line item under current assets.
4. Liabilities and Shareholders’ EquityThe Company’s shareholders’ equity ratio is a low 10.8%, and its debt-equity ratio of 5.55 times isquite high. We therefore regard improving the financial structure as an important management issue.
We have already taken steps to recoup a portion of our investments, selling overseas assets andsecuritizing domestic assets to reduce interest-bearing liabilities, which was one issue dealt with inthe Five-Year Business Reconstruction Plan. The effect of these measures was a 29%, ¥493 billionreduction in the Group’s total interest-bearing liabilities (the total of borrowed money, bonds,commercial paper, guarantees, and conditional guarantees) at March 31, 2002, from the peak of¥1,686 billion. From the previous to this fiscal year under review, this represents a contraction of7%, or ¥93 billion, to ¥1,193 billion.
The Sumitomo Fudosan Fund, a real estate investment fund specializing in lease properties, soldshares worth ¥31 billion during the period of this report, and an investment fund specializing incondominium construction sold ¥61 billion in shares. These two funds are operated through a“tokumei-kumiai” partnership in which Sumitomo Realty is managing the capital of the investors.Japanese accounting standards require that all assets and liabilities of this tokumei-kumiaipartnership to be reported on Sumitomo Realty’s balance sheets. To keep this separate fromSumitomo Realty’s shareholders’ equity, these are posted under long-term deposits. For the fiscalyear under review, the total for the leasing fund and the condominium construction fund is ¥166billion.
ROA (%)
1997 1998 1999 2000 2001 2002
2.52.6
3.2
3.94.0
4.2
Yield On Leasing Assets (%)
1995 1996 1997 1998 1999 2000 2001 2002 2003F 2004F
6.12.7
5.92.8
6.53.4
6.53.4
6.23.7
6.53.8
6.24.1
6.34.4
6.75.0
7.05.6
Yield On Properties In OperationYield On Total Leasing Assets
Interest-Bearing Debt (Billions of yen)
1998 1999 2000 2001 2002
1,6861,618
1,3821,286
1,193
Capital Composition (Billions of yen)
1998 1999 2000 2001 2002
1,686 1,618 1,382 1,286 1,193218 238 334 434 573175 198 211 193 214
Interest-Bearing Debt+GuaranteeOther Debt Shareholder’s Equity

16 SUMITOMO REALTY & DEVELOPMENT CO., LTD.
Consolidated Balance SheetsMarch 31, 2002 and 2001
Thousands ofMillions of yen U.S. dollars (Note 1)
Assets 2002 2001 2002
Current assets:Cash, time and notice deposits (Note 4) ¥ 87,472 ¥ 91,986 $ 656,450Marketable securities (Note 8) 129 401 968Securitized properties for sale (Note 8) 21,915 — 164,465Notes and accounts receivable-trade 20,347 19,436 152,698Trading loans receivable 106,696 107,394 800,720Allowance for doubtful accounts (Note 3) (37,738) (37,067) (283,212)Inventories (Note 5) 156,535 149,215 1,174,747Deferred income taxes (Note 11) 20,619 16,369 154,739Other current assets 29,024 26,594 217,816
Total current assets 404,999 374,328 3,039,391
Investments and advances:Investments in and advances to unconsolidatedsubsidiaries and affiliated companies (Note 6) 9,874 7,712 74,101
Investments in securities and other (Note 8) 71,937 85,183 539,865Allowance for doubtful accounts (Note 3) (26,154) (38,116) (196,277)
Total investments and advances 55,657 54,779 417,689
Property and equipment (Notes 7 and 9):Land 925,283 916,447 6,943,962Buildings and structures 334,601 306,671 2,511,077Machinery and equipment 16,636 15,143 124,848Construction in progress 47,371 24,274 355,505
1,323,891 1,262,535 9,935,392Accumulated depreciation (123,839) (115,534) (929,373)
Net property and equipment 1,200,052 1,147,001 9,006,019
Other assets:Guarantee and lease deposits paid to lessors 187,653 196,242 1,408,278Leasehold rights and other intangible assets 68,986 72,534 517,719Deferred income taxes (Note 11) 5,187 20,153 38,927Miscellaneous 50,201 38,492 376,742
Total other assets 312,027 327,421 2,341,666¥ 1,972,735 ¥ 1,903,529 $ 14,804,765
See accompanying notes.

SUMITOMO REALTY & DEVELOPMENT CO., LTD. 17
Thousands ofMillions of yen U.S. dollars (Note 1)
Liabilities and Shareholders’ Equity 2002 2001 2002
Current liabilities:Short-term bank loans (Note 9) ¥ 311,457 ¥ 317,745 $ 2,337,388Long-term debt due within one year (Note 9) 272,599 243,800 2,045,771Notes and accounts payable-trade 37,823 30,207 283,850Accrued income taxes (Note 11) 2,453 2,827 18,409Accrued bonuses 2,408 2,487 18,071Deferred income taxes (Note 11) 19 31 143Other current liabilities 138,647 112,363 1,040,503
Total current liabilities 765,406 709,460 5,744,135
Long-term debt due after one year (Note 9) 603,804 716,141 4,531,362Guarantee and deposits received (Note 12) 372,251 268,841 2,793,629Deferred income taxes (Note 11) 47 82 353Allowance for employees’ severance and retirement benefits (Notes 3 and 10) 3,743 3,387 28,090Directors’ and corporate auditors’ retirement benefits 282 256 2,116Other long-term liabilities 1,045 860 7,842
Minority interests 12,390 11,060 92,983
Contingent liabilities (Note 16)
Shareholders’ equity (Note 13):Common stock
Authorized — 780,000 thousand sharesIssued — 407,086 thousand shares (406,810 thousand shares in 2001) 86,787 86,773 651,310
Additional paid-in capital 96,822 96,822 726,619Retained earnings 32,165 11,673 241,388
215,774 195,268 1,619,317Net unrealized holding gains (losses) on securities (2,159) 1,016 (16,203)Foreign currency translation adjustments 182 (2,840) 1,366Treasury stock (30) (2) (225)
Total shareholders’ equity 213,767 193,442 1,604,255¥ 1,972,735 ¥ 1,903,529 $ 14,804,765

18 SUMITOMO REALTY & DEVELOPMENT CO., LTD.
Consolidated Statements of OperationsYears ended March 31, 2002, 2001 and 2000
Thousands ofMillions of yen U.S. dollars (Note 1)
2002 2001 2000 2002
Revenue from operations (Note 3) ¥ 497,877 ¥ 459,245 ¥ 421,587 $ 3,736,413Costs and expenses:
Cost of revenue from operations (Note 3) 377,199 349,597 319,997 2,830,762Selling, general and administrative expenses (Note 3) 40,308 34,430 31,042 302,499
417,507 384,027 351,039 3,133,261Operating income 80,370 75,218 70,548 603,152 Other income (expenses):
Interest expense—net (28,200) (34,491) (39,547) (211,632)Dividend income 526 283 241 3,947 Gain (Loss) on sale of property and equipment (202) (375) 62,477 (1,516)Gain (Loss) on sale of marketable securities — — 130 —Gain on sale of investments in subsidiary — — 419 —Loss on devaluation of investments in securities (3,750) — — (28,143)Write-off of bad debt — — (4,272) —Loss on devaluation of marketable securities — — (2,897) —Provision for allowance for doubtful accounts — (14,828) — —Foreign exchange gains (losses) 375 14 (17) 2,814Loss from write-down of property and equipment (478) (501) (486) (3,587)Loss from devaluation of inventories — — (24,864) —Loss from restructuring of overseas business — — (22,641) — Loss on adjustment of prior year’s rent — — (14,168) —Loss from sale and write-off of loans receivable — (50,111) — —Net transition obligation — (1,681) — —Other—net (Note 3) (6,307) (2,613) (2,740) (47,331)
(38,036) (104,303) (48,365) (285,448)Income (Loss) before income taxes and minority interest (Note 3): 42,334 (29,085) 22,183 317,704Income taxes (Note 11):
Current 4,608 5,097 4,740 34,582Deferred 13,109 (18,221) 1,091 98,379
Total 17,717 (13,124) 5,831 132,961
Minority interest 1,621 2,047 1,615 12,165
Net income (loss) ¥ 22,996 ¥ (18,008) ¥ 14,737 $ 172,578
Yen U.S. dollars (Note 1)
Amounts per share of common stock:Net income (loss) ¥ 56.50 ¥ (44.27) ¥ 36.23 $ 0.42Cash dividend applicable to the year 6.00 6.00 6.00 0.05
See accompanying notes.

SUMITOMO REALTY & DEVELOPMENT CO., LTD. 19
Consolidated Statements of Shareholders’ EquityYears ended March 31, 2002, 2001 and 2000
Thousands Millions of yenNet unrealized Foreign
Number of Additional holding gains currencyshares of Common paid-in Retained (losses) on translation Treasury
common stock stock capital earnings securities adjustments stock
Balance at March 31, 1999 406,810 ¥86,773 ¥96,822 ¥ 23,584 ¥ — ¥ (8,679) ¥(2)Decrease due to change in consolidated
subsidiaries (3,925)Net income — — — 14,737 — — —Adjustments from translation of foreign
currency (Note 2) — — — — — 4,284 —Treasury stock — — — — — — 0Cash dividends paid
(¥6 per share) — — — (2,440) — — —Bonus to directors — — — (14) — — —
Balance at March 31, 2000 406,810 86,773 96,822 31,942 — (4,395) (2)Increase due to change in consolidated
subsidiaries 195Net loss (18,008)Adjustments from translation of foreign
currency (Note 2) — — — — — 1,555 —Adoption of new accounting standard
for financial instruments — — — — 1,016 — —Treasury stock — — — — — — 0Cash dividends paid
(¥6 per share) — — — (2,441) — — —Bonus to directors — — — (15) — — —
Balance at March 31, 2001 406,810 86,773 96,822 11,673 1,016 (2,840) (2)Decrease due to change in consolidated
subsidiaries — — — (45) — — —Net income — — — 22,996 — — —Foreign currency translation adjustments — — — — — 3,022 —Net unrealized holding losses on securities — — — — (3,175) — —Stock issued under exchange offerings (Note 13) 276 14 — — — — —Treasury stock — — — — — — (28)Cash dividends paid
(¥6 per share) — — — (2,441) — — —Bonus to directors — — — (18) — — —
Balance at March 31, 2002 407,086 ¥86,787 ¥96,822 ¥32,165 ¥(2,159) ¥182 ¥(30)
Thousands of U.S. dollars (Note 1)Net unrealized Foreign
Additional holding gains currencyCommon paid-in Retained (losses) on translation Treasury
stock capital earnings securities adjustments stock
Balance at March 31, 2001 $651,205 $726,619 $87,602 $ 7,625 $(21,313) $(15)Decrease due to change in consolidated subsidiaries — — (338) — — —Net income — — 172,578 — — —Foreign currency translation adjustments — — — — 22,679 —Net unrealized holding losses on securities — — — (23,828) — —Stock issued under exchange offerings (Note 13) 105 — — — — —Treasury stock — — — — — (210)Cash dividends paid
($0.05 per share) — — (18,319) — — —Bonus to directors — — (135) — — —
Balance at March 31, 2002 $651,310 $726,619 $241,388 $(16,203) $1,366 $(225)
See accompanying notes.

20 SUMITOMO REALTY & DEVELOPMENT CO., LTD.
Consolidated Statements of Cash FlowsYears ended March 31, 2002, 2001 and 2000
Thousands ofMillions of yen U.S. dollars (Note 1)
2002 2001 2000 2002
Cash flows from operating activities:Income (Loss) before income tax and minority interest ¥ 42,334 ¥ (29,085) ¥ 22,183 $ 317,704
Depreciation and amortization 10,731 10,377 11,269 80,533Provision for allowance for doubtful accounts—net (11,292) (36,259) (9,306) (84,743)Loss on devaluation of marketable securities — — 2,897Loss on devaluation of investments in securities 3,750 — — 28,143Gain on sale of investments in subsidiaries — — (419) —Increase in employees' severance and retirement benefits 355 1,818 994 2,664Interest and dividend income (1,026) (1,187) (1,784) (7,700)Interest expense 28,701 35,395 41,090 215,392Gain on sale of marketable securities — — (130) —Loss (Gain) on sale of property and equipment 202 375 (62,477) 1,516Loss from reduction of overseas business — — 22,641 —Increase in securitized properties for sale (9,112) — — (68,383)Decrease (Increase) in notes and accounts receivable-trade (859) 272 8,476 (6,447)Decrease in trade loans receivable 12,565 96,302 15,740 94,296Decrease (Increase) in inventories (7,363) (21,195) 9,899 (55,257)Increase in advances received 2,823 7,384 3,861 21,186Increase (Decrease) in notes and accounts payable-trade 7,588 (12,340) 7,251 56,946Other—net (1,260) (7,041) 7,142 (9,457)
Total 78,137 44,816 79,327 586,393
Proceeds from interest and dividend income 858 1,328 1,942 6,439Payments for interest (29,894) (37,202) (39,963) (224,345)Payments for income tax and other taxes (4,974) (5,686) (2,867) (37,328)
Net cash provided by operating activities 44,127 3,256 38,439 331,159
Cash flows from investing activities:Proceeds from sale of property and equipment 4,264 79,582 167,238 32,000Payments for purchases of property and equipment (56,241) (55,015) (97,965) (422,071)Increase in marketable securities — — (7,063) —Proceeds from sale of securities — — 8,719 —Payments for purchases investments in securities (22,134) (18,429) — (166,109)Proceeds from sale of investments in securities — 2,659 — —Increase in short-term loans — 178 1,886 —Decrease in guarantee and lease deposits paid to lessors 8,508 50,897 44,582 63,850Increase (Decrease) in guarantee and lease deposits received (1,792) 8,392 2,187 (13,448)Capital expenditure (12,346) (12,271) (7,198) (92,653)Receipts of deposits to partnerships 97,392 55,397 29,768 730,897 Restitution of deposits to partnerships (5,245) — — (39,362) Other—net (198) 201 (9,709) (1,487)
Net cash provided by investing activities 12,208 111,591 132,445 91,617
Cash flows from financing activities:Decrease in short-term bank loans (6,288) (33,096) (349,006) (47,189)Proceeds from issuance of bonds and notes 61,258 70,000 130,000 459,722Repayments of bonds and notes (145,684) (133,690) (90,000) (1,093,313)Increase in long-term debt 853 4,877 102,788 6,402Proceeds from issuance of common stock to minority shareholders — — 987 —Proceeds from assignment of advances received 15,938 29,149 — 119,610Other—net 14,059 2,550 (2,246) 105,508Cash dividends paid (2,678) (2,643) (2,569) (20,098)
Net cash used in financing activities (62,542) (62,853) (210,046) (469,358)
Effect of exchange rate changes on cash and cash equivalents 1,395 151 (261) 10,469
Net increase (decrease) in cash and cash equivalents (4,812) 52,145 (39,423) (36,113)Cash and cash equivalents at beginning of year 92,379 40,236 79,614 693,276Increase (Decrease) in cash and cash equivalents resulting from
changes in the number of consolidated of subsidiaries (0) (2) 45 (0)Cash and cash equivalents at end of year (Note 4) ¥ 87,567 ¥ 92,379 ¥ 40,236 $ 657,163
See accompanying notes.

Sumitomo Realty & Development Co., Ltd. (the “Company”), and itsconsolidated domestic subsidiaries maintain their official accountingrecords in Japanese yen and in accordance with the provisions set forth inthe Japanese Commercial Code and accounting principles and practicesgenerally accepted in Japan (“Japanese GAAP”). The accounts ofoverseas subsidiaries are based on their accounting records maintained inconformity with generally accepted accounting principles and practicesprevailing in the respective countries of domicile. Certain accountingprinciples and practices generally accepted in Japan are different fromInternational Accounting Standards and standards in other countries incertain respects as to application and disclosure requirements.Accordingly, the accompanying financial statements are intended for useby those who are informed about Japanese accounting principles andpractices.
The accompanying financial statements have been restructured and
translated into English (with some expanded descriptions and the inclusionof statements of shareholders’ equity) from the consolidated financialstatements of the Company prepared in accordance with Japanese GAAPand filed with the appropriate Local Finance Bureau of the Ministry ofFinance as required by the Securities and Exchange Law. Somesupplementary information included in the statutory Japanese languageconsolidated financial statements, but not required for fair presentation, isnot presented in the accompanying financial statements.
The translation of the Japanese yen amounts into U.S. dollars areincluded solely for the convenience of readers, using the prevailingexchange rate at March 31, 2002, which was ¥133.25 to U.S. $1. Theconvenience translations should not be construed as representations thatthe Japanese yen amounts have been, could have been, or could in thefuture be, converted into U.S. dollars at this or any other rate of exchange.
(1) Principles of consolidationEffective from the year ended March 31, 2000, companies are required toconsolidate all significant investees which are controlled through substantialownership of majority voting rights or existence of certain conditions. As aresult , three additional subsidiaries have been included in theconsolidation. However, the effect of the change is immaterial.
The accompanying consolidated financial statements include theaccounts of the Company and significant companies over which theCompany has power of control through majority voting right or existence ofcertain conditions evidencing control by the Company.
In the elimination of investments in subsidiaries, the assets andliabilities of the subsidiaries, including the portion attributable to minorityshareholders, are recorded based on the fair value at the time theCompany acquired control of the respective subsidiaries.
All significant intercompany balances, transactions and profits havebeen eliminated in consolidation.
(2) Foreign currency translationReceivables and payables denominated in foreign currencies are translatedinto Japanese yen at the year-end rates. Prior to April 1, 2000, long-termreceivables and payable denominated in foreign currencies were translatedat historical rates.
Effective April 1, 2000, the Company and its consolidated subsidiariesadopted the revised accounting standard for foreign currency translation,“Opinion Concerning Revision of Accounting Standard for ForeignCurrency Translation”, issued by the Business Accounting DeliberationCouncil on October 22, 1999 (the “Revised Accounting Standard”). Underthe Revised Accounting Standard, long-term receivables and payablesdenominated in foreign currencies are also translated into Japanese yen atthe year-end rate.
The effect on the consolidated statement of operations of adopting theRevised Accounting Standard was immaterial.
Financial statements of consolidated overseas subsidiaries aretranslated into Japanese yen at the year-end rate, except thatshareholders’ equity accounts are translated at historical rates and incomestatement items resulting from transactions with the Company at the ratesused by the Company.
Due to the adoption of the Revised Accounting Standard, theCompany and its domestic subsidiaries report foreign currency translationadjustments in the shareholders’ equity. The prior years’ amounts, whichwere included in assets, have been reclassified to conform to the 2001presentation.
(3) Cash and cash equivalents In preparing the consolidated statements of cash flows, cash on hand,readily-available deposits and short-term highly liquid investments withmaturity of not exceeding three months at the time of purchase areconsidered to be cash and cash equivalents.
(4) Recognition of revenueRevenues from sales of land and residential houses are recognized whenunits are delivered and accepted by customers. Revenues from leasing ofoffice space, shops and apartments are recognized as rent accrues overthe life of the lease.
Effective April 1, 2001, as explained in Note 3, the Company changedthe method of recognition of revenue and expense from the real estatebusiness which used Special Purpose Companies (“ SPC ”) to record inrevenue from operations.
(5) InventoriesInventories are stated at cost which is determined by the specificidentification cost method.
In the prior years, the costs of consignment sales were recognized asexpense in the period they were incurred. In the year ended March 31,2001, the Company introduced cost accounting system with the intent tobetter manage consignment sales activities, by matching revenue fromsales of consigned properties and costs associated to such properties, thisresulted in recording the costs of non-delivered estate amounting to ¥966million as inventories at that date.
Consequently this change resulted an increase of ¥966 million inoperating income and net loss before income taxes compared with whatwould have been reported under the prior method.
The effect on segment information is explained in Note 18.
(6) SecuritiesPrior to April 1, 2000, securities quoted on stock exchanges are primarilystated at the lower of market or cost, determined by the moving-averagemethod. Other securities were stated at cost, determined by the moving-average method.
Effective April 1, 2000, the Company and its consolidated subsidiariesadopted new Japanese accounting standard for financial instruments(“Opinion Concerning Establishment of Accounting Standard for FinancialInstruments” issued by the Business Accounting Deliberation Council onJanuary 22, 1999).
Upon applying the new accounting standard, all companies arerequired to examine the intent of holding each security and classify those
1. Basis of financial statements
2. Accounting policies
SUMITOMO REALTY & DEVELOPMENT CO., LTD. 21
Notes to Consolidated Financial StatementsYears ended March 31, 2002, 2001 and 2000

securities as (a) securities held for trading purposes (hereafter, “tradingsecurities”), (b) debt securities intended to be held to maturity (hereafter,“held-to-maturity debt securities”), (c) equity securities issued bysubsidiaries and affiliated companies, and (d) for all other securities thatare not classified in any of the above categories (hereafter, “available-for-sale securities”)
Held-to-maturity debt securities are stated at amortized cost. Equitysecurity issued by affiliated company which is not consolidated oraccounted for using the equity method is stated at moving-average cost.Available-for-sale securities with available fair market values are stated atfair market value. Unrealized gains and unrealized losses on thesesecurities are reported, net of applicable income taxes, as a separatecomponent of shareholders’ equity. Realized gains and losses on sale ofsuch securities are computed using moving-average cost.
Securitized properties for sale is stated at cost which is determined bythe specific identification cost method and securities with no available fairmarket value are stated at moving-average cost.
If the market value of held-to-maturity debt securities, equity securitiesissued by affiliated company, and available-for-sale securities, declinessignificantly, such securities are stated at fair market value and thedifference between fair market value and the carrying amount isrecognized as loss in the period of the decline. If the fair market value ofequity securities issued by unconsolidated subsidiaries and affiliatedcompanies not on the equity method is not readily available, such securitiesshould be written down to net asset value with a corresponding charge inthe income statement in the event net asset value declines significantly. Inthese cases, such fair market value or the net asset value will be thecarrying amount of the securities at the beginning of the next year.
As a result of adopting the new accounting standard for financialinstruments, loss before income taxes decreased by ¥1,548 million. Also,based on the examination of the intent of holding each security uponapplication of the new accounting standard on April 1, 2000, held-to-maturity debt securities and available-for-sale securities maturing withinone year from the balance sheet date are included in current assets, andother securities are included in investments and other assets. As a result,at April 1, 2000, securities in current assets decreased by ¥9,156 million,securities loaned in current assets decreased by ¥15,727 million andinvestment securities increased by ¥24,883 million compared with whatwould have been reported under the previous accounting policy.
(7) Property and equipmentThe Company and domestic consolidated subsidiaries depreciate propertyand equipment using the declining-balance method at rates determinedbased on the useful lives prescribed in the Japanese tax regulations exceptthat the Company and two domestic subsidiaries depreciate buildings usingthe straight-line method and certain other domestic subsidiaries depreciatebuildings, excluding building fixtures, acquired after March 31, 1998 usingthe straight-line method. Overseas consolidated subsidiaries depreciateproperty and equipment using primarily the straight-line method inaccordance with the accounting principles in the respective countries.
Estimated useful lives used in the computation of depreciation aregenerally as follows:Buildings and structures ..................6 to 60 yearsMachinery and equipment................2 to 20 years
(8) Software CostSoftware costs are amortized using the straight-line method over theestimated useful lives (five years).
In accordance with the provisional rule of the JICPA’s AccountingCommittee Report No.12 “Practical Guidance for Accounting for Researchand Development Costs, etc.”(the “Report”), the Company accounts forsoftware which was included in Leasehold rights and other intangibleassets in the same manner in 2000. Pursuant to the Report, however, the
Company depreciated it using the straight-line method over the estimateduseful lives (five years).
(9)Allowance for doubtful accountAllowance for doubtful accounts is provided in amounts sufficient to coverprobable losses on collection. It consists of the estimated amountconsidered to be uncollectible based on the evaluation of certain identifiedtrade notes, accounts and loans receivable, and an amount calculated byapplying the percentage of collection losses experienced in certain periodin the past to the remaining receivables in 2000, when the Companychanged the accounting policy as explained in Note 3.
(10) Finance LeasesFinance leases except those leases for which the ownership of the leasedassets is considered to be transferred to the lessee, are accounted for inthe same manner as operating leases.
(11) Income taxesIncome taxes are provided for on the basis of income for financialstatement purposes. The tax effect of temporary differences between thecarrying amounts of assets and liabilities for financial statements andincome tax purposes is recognized as deferred income taxes.
(12) Employees’ retirement benefitsThe Company and some of its consolidated subsidiaries provide two typesof post-employment benefit plans, unfunded lump-sum payment plans andfunded non-contributory pension plans, under which all eligible employeesare entitled to benefits based on their current rate of pay, length of service,and the conditions under which the termination occurs.
Prior to April 1, 2000, consolidated subsidiaries accrued liabilities forlump-sum severance and retirement payments equal to 40% of theamount required had all eligible employees voluntarily terminated theiremployment at the balance sheet date, except that, at March 31, 2000,one consolidated subsidiary provided liabilities for severance and retirementbenefits based on the Net-Present-Value method as discussed in Note 3.The Company and its consolidated subsidiaries (“the Companies”)recognized pension expense when, and to the extent, payments weremade to the pension plans.
Effective April 1, 2000, the Companies adopted the new accountingstandard (“Opinion on Setting Accounting Standard for Employees’Severance and Pension Benefits”, issued by the Business AccountingDeliberation council on June 16, 1998).
Under the new accounting standard, liabilities and expenses forseverance and retirement benefits are determined based on the amountsactuarially calculated using certain assumptions.
The Companies provided allowance for employees’ severance andretirement benefits at March 31, 2002 and 2001 based on the estimatedamount of projected benefit obligation at those dates.
The excess of the projected benefit obligation over the total of the fairvalue of pension assets as of April 1, 2000 and the liabilities for severanceand retirement benefits recorded as of April 1, 2000 (the “net transitionobligation”) amounted to ¥1,681 million. All of this was recognized inexpenses in the year ended March 31, 2001. Actuarial gains and lossesare recognized in expenses in the succeeding period.
As a result of the adoption of the new accounting standard, in the yearended March 31, 2001, severance and retirement benefit expensesincreased by ¥1,721 million, operating income decreased by ¥41 millionand loss before income taxes increased by ¥1,721 million compared withwhat would have been recorded under the previous accounting standard.
(13) Derivative transaction and hedge accountingThe new accounting standard for financial instruments, effective from theyear ended March 31, 2001, requires companies to state derivative
22 SUMITOMO REALTY & DEVELOPMENT CO., LTD.

financial instruments at fair value and to recognize changes in the fair valueas gains or losses unless derivative financial instruments are used forhedging purposes.
If derivative financial instruments are used as hedges and meet certainhedging criteria, the Company and its consolidated subsidiaries deferrecognition of gains or losses resulting from changes in fair value ofderivative financial instruments until the related losses or gains on thehedged items are recognized.
However, in cases where forward foreign exchange contracts are usedas hedges and meet certain hedging criteria, forward foreign exchangecontracts and hedged items are accounted for in the following manner:1. If a forward foreign exchange contract is executed to hedge an existing
foreign currency receivable or payable, (a) the difference, if any, between the Japanese yen amount of the
hedged foreign currency receivable or payable translated using the spotrate at the inception date of the contract and the book value of thereceivable or payable is recognized in the income statement in theperiod which includes the inception date, and
(b) the discount or premium on the contract (that is, the differencebetween the Japanese yen amount of the contract translated using thecontracted forward rate and that translated using the spot rate at theinception date of the contract) is recognized over the term of thecontract
2. If a forward foreign exchange contract is executed to hedge a futuretransaction denominated in a foreign currency, the future transactionwill be recorded using the contracted forward rate, and no gains orlosses on the forward foreign exchange contract are recognized.
Also, if interest rate swap contracts are used as hedge and meet certainhedging criteria, the net amount to be paid or received under the interestrate swap contract is added to or deducted from the interest on the assetsor liabilities for which the swap contract was executed.
(14) Amounts per share of common stockThe computation of net income per share is based on the weighted-average number of shares of common stock outstanding during each year.
Diluted net income per share is not presented, since the Company hasnever issued any securities with dilutive effect.
Cash dividends per share represent actual amounts applicable to therespective year.
(15) ReclassificationsCertain prior years amounts have been reclassified to conform to the 2002presentation. These changes had no impact on previously reported resultsof operations.
(1) Effective April 1, 2001, the Company changed the method ofrecognition of revenue and expense from the real estate businesswhich used SPC. The old method recorded in either Other operatingincome account or Other operating expense account. The new methodrecorded in the Revenue from operations account.
The reason for the change is that the Company altered theArticles of Incorporation at the general meeting of shareholders onJune 28, 2002. The Company has included investment, purchase,sales, brokerage and management of SPC related business and J-REIT business as the Company’s core businesses. Therefore, theCompany has decided to incorporate revenues from the above-mentioned new businesses in the Revenue from operations account.
The effect of the change increased the Revenue from operationsand Operating income by ¥3,426 million ($25,711 thousand) and todecrease Other income by the same amount, therefore there was aneffect on net income.
The effect on segment information of these changes is explainedin Note 18.
(2) Allowance for doubtful accounts is provided in amounts sufficient tocover probable losses on collection. It consists of the estimatedamount considered to be uncollectible based on the evaluation ofcertain identified trade notes, accounts and loans receivables, and an
amount calculated by applying the percentage of collection lossesexperienced in certain period in the past to the remaining receivables in2002, 2001 and 2000. Prior to 2000, allowance for doubtfulaccounts was provided at an estimated amount of probable bad debtsplus the maximum amount allowed under the Japanese tax regulations.
The effect of this change was to increase income before incometaxes for the year ended March 31, 2000 by ¥50 million comparedwith what would have been reported under the previous method.
The effect on segment information of these changes is explainedin Note 18.
(3) Effective April 1, 1999, one consolidated subsidiary changed itsmethod of accounting for employees’ retirement benefits. Previouslythe subsidiary provided for such benefits at 40% of the amount whichwould be required if all eligible employees had voluntarily retired orterminated their employment at the balance sheet date. Effective fromthe year ended March 31, 2000, the subsidiary adopted the NetPresent Value method, under which amounts based on the presentvalue of estimated future payments of severance and retirementbenefits upon termination or retirement are used in the computation ofthe liabilities and expenses for such benefits.
The effect on segment information of these changes is explainedin Note 18.
3. Changes in accounting policies
4. Cash and cash equivalentsCash and cash equivalents at March 31,2002, 2001 and 2000 consisted of the following: Thousands of
Millions of yen U.S. dollars
2002 2001 2000 2002
Cash, time and notice deposits ¥87,472 ¥91,986 ¥39,728 $656,450Time deposits over three months (9) (8) (3) (67)Marketable securities 104 401 511 780 Cash and cash equivalents ¥87,567 ¥92,379 ¥40,236 $657,163
SUMITOMO REALTY & DEVELOPMENT CO., LTD. 23

5. InventoriesInventories at March 31, 2002 and 2001, were as follows: Thousands of
Millions of yen U.S. dollars
2002 2001 2002
Land and houses for sale ¥ 23,905 ¥ 20,593 $ 179,399Land and houses projects in progress 74,760 61,211 561,051Land held for development 53,121 61,701 398,657Other 4,749 5,710 35,640 Total ¥156,535 ¥149,215 $1,174,747
6. Investments in and advances to unconsolidated subsidiaries and affiliated companies Investments in and advances to unconsolidated subsidiaries and affiliated companies at March 31, 2002 and 2001, consisted of the following:
Thousands ofMillions of yen U.S. dollars
2002 2001 2002
Investments in common stock, at cost ¥5,806 ¥5,800 $43,572 Advances 4,068 1,912 30,529Total ¥9,874 ¥7,712 $74,101
7. Properties in trustThe Company has properties which are the object of real estate trust contracts. Such properties included in property and equipment in the consolidated balance sheets at March 31, 2002 and 2001, were as follows:
Thousands ofMillions of yen U.S. dollars
2002 2001 2002
Buildings and structures ¥ 7,261 ¥ 7,606 $ 54,492Land 18,628 18,628 139,797Machinery and equipment 97 113 728Total ¥25,986 ¥26,347 $195,017
8. SecuritiesFor 2002A. The following tables summarize acquisition costs, book values and fair value of securities with available fair values as of March 31, 2002:(a) Held-to-maturity debt securities:
Millions of yen Thousands of U.S. dollars
Book value Fair value Difference Book value Fair value Difference
Securities whose market fair value exceeds book valueNational and local government bonds, etc. ¥1,169 ¥1,188 ¥19 $8,773 $8,916 $143
Securities whose market fair value does not exceed book valueNational and local government bonds, etc. 10 10 (0) 75 75 (0)
Total ¥1,179 ¥1,198 ¥19 $8,848 $8,991 $143
(b) Available-for-sale securities:Millions of yen Thousands of U.S. dollars
Acquisition cost Book value Difference Acquisition cost Book value Difference
Securities whose book value exceeds acquisition costEquity securities ¥11,287 ¥14,256 ¥2,969 ¥84,705 ¥106,986 ¥22,281Others 1 1 0 8 8 0Sub total 11,288 14,257 2,969 84,713 106,994 22,281
Securities whose book value does not exceed acquisition costEquity securities 31,895 25,659 (6,236) 239,362 192,563 (46,799)Others 1,328 1,247 (81) 9,966 9,358 (608)Sub total 33,223 26,906 (6,317) 249,328 201,921 (47,407)
Total ¥44,511 ¥41,163 ¥(3,348) $334,041 $308,915 $(25,126)
Investments in securities were devaluated and the loss amounted to ¥3,724 million ($27,947 thousand), consisted of equity securities included Available-for-sale securities amounted to ¥3,559 million ($26,709 thousand) and others amounted to ¥165 million ($1,238 thousand).
24 SUMITOMO REALTY & DEVELOPMENT CO., LTD.

B. The following table summarizes book values of securities with no available fair values as of March 31, 2002:Available-for-sale securities:
Book valueThousands of
Millions of yen U.S. dollars
MMF ¥ 104 $ 780Non-listed equity securities 968 7,265Senior securities 23,033 172,856Total ¥24,105 $180,901
Senior securities included securitized properties for sale amounted to ¥21,915 million ($164,465 thousand).
C. Available-for-sale securities with maturities and held-to-maturity debt securities are as follows:Millions of yen
1 year or less 1 to 5 years 5 to 10 years Over 10 year
Available-for-sale securities ¥203 ¥ 976 ¥600 ¥—Held-to-maturity debt securities:
National and local government bonds, etc. — 737 — —Total ¥203 ¥1,713 ¥600 ¥—
Thousands of U.S. dollars1 year or less 1 to 5 years 5 to 10 years Over 10 year
Available-for- sale securities $1,524 $7,325 $4,503 ¥—Held-to-maturity debt securities:
National and local government bonds, etc. — 5,531 — —Total $1,524 $12,856 $4,503 ¥—
D. Total sales of available-for-sale securities sold in the year ended March 31, 2002 amounted to ¥596 million ($4,473 thousand) and the related gains andlosses amounted to ¥241 million ($1,809 thousand) and ¥172 million ($1,291 thousand), respectively.
E. The account “Securitized properties for sale” means the Company sells underlying property assets through SPC. “Securitized asset” means PreferredSubscription Certificates and Tokumei Kumiai Investments etc., which are issued by SPC.In the year ended March 31, 2002, the Company transferred ¥12,803 million ($96,083 thousand) from Investment in securities account to securitizedproperties for sale account. The effect of the above-mentioned change is explained in Note 18.“Tokumei Kumiai” can be used as a vehicle for investment allowed under the Japanese Commercial Code.
For 2001A. The following tables summarize acquisition costs, book values and fair value of securities with available fair values as of March 31, 2001:(a) Held-to-maturity debt securities:
Millions of yen
Book value Fair value Difference
Securities whose market fair value exceeds book valueNational and local government bonds, etc. ¥1,232 ¥1,261 ¥29
(b) Available-for-sale securities:Millions of yen
Acquisition cost Book value Difference
Securities whose book value exceeds acquisition costEquity securities ¥11,310 ¥16,188 ¥4,878
Securities whose book value does not exceed acquisition costEquity securities 14,620 12,035 (2,585)Others 1,719 1,314 (405)Sub total 16,339 13,349 (2,990)
Total ¥27,649 ¥29,537 ¥1,888
B. The following table summarizes book values of securities with no available fair values as of March 31, 2001:Book value
Millions of yen
MMF ¥ 401Non-listed equity securities 1,404Senior securities 12,903Total ¥14,708
SUMITOMO REALTY & DEVELOPMENT CO., LTD. 25
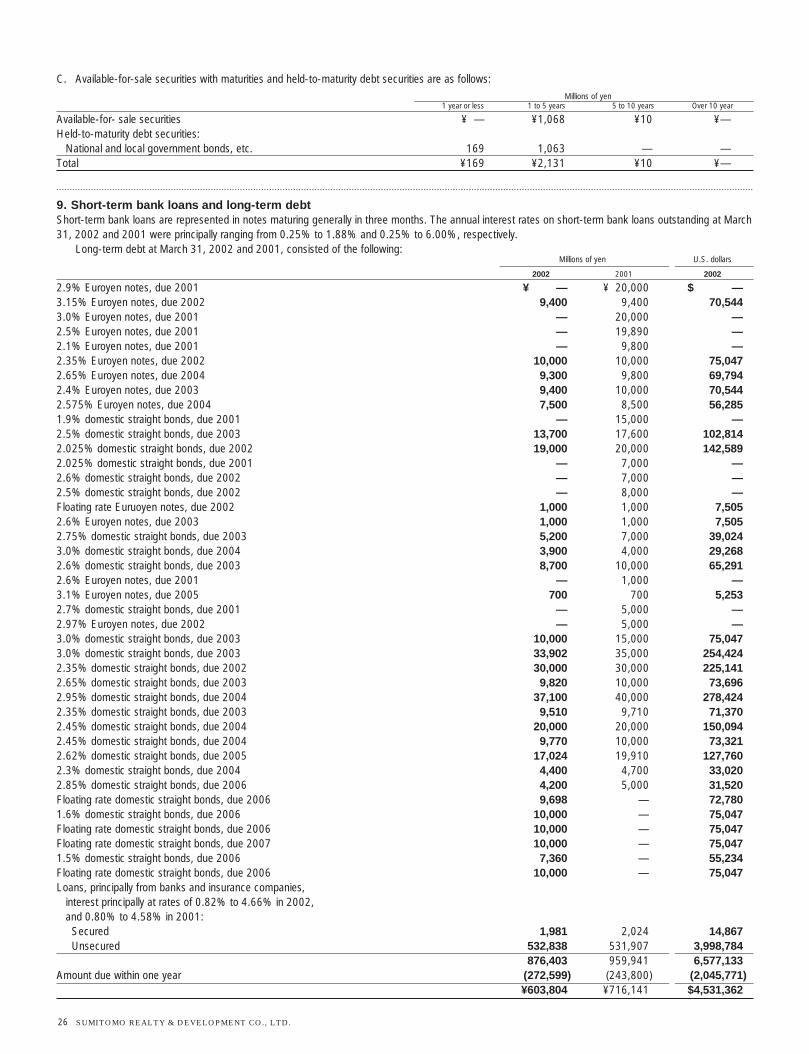
C. Available-for-sale securities with maturities and held-to-maturity debt securities are as follows:Millions of yen
1 year or less 1 to 5 years 5 to 10 years Over 10 year
Available-for- sale securities ¥ — ¥1,068 ¥10 ¥—Held-to-maturity debt securities:
National and local government bonds, etc. 169 1,063 — —Total ¥169 ¥2,131 ¥10 ¥—
9. Short-term bank loans and long-term debtShort-term bank loans are represented in notes maturing generally in three months. The annual interest rates on short-term bank loans outstanding at March31, 2002 and 2001 were principally ranging from 0.25% to 1.88% and 0.25% to 6.00%, respectively.
Long-term debt at March 31, 2002 and 2001, consisted of the following:Millions of yen U.S. dollars
2002 2001 2002
2.9% Euroyen notes, due 2001 ¥ — ¥ 20,000 $ —3.15% Euroyen notes, due 2002 9,400 9,400 70,5443.0% Euroyen notes, due 2001 — 20,000 —2.5% Euroyen notes, due 2001 — 19,890 —2.1% Euroyen notes, due 2001 — 9,800 —2.35% Euroyen notes, due 2002 10,000 10,000 75,047 2.65% Euroyen notes, due 2004 9,300 9,800 69,7942.4% Euroyen notes, due 2003 9,400 10,000 70,5442.575% Euroyen notes, due 2004 7,500 8,500 56,2851.9% domestic straight bonds, due 2001 — 15,000 —2.5% domestic straight bonds, due 2003 13,700 17,600 102,8142.025% domestic straight bonds, due 2002 19,000 20,000 142,5892.025% domestic straight bonds, due 2001 — 7,000 —2.6% domestic straight bonds, due 2002 — 7,000 —2.5% domestic straight bonds, due 2002 — 8,000 —Floating rate Euruoyen notes, due 2002 1,000 1,000 7,5052.6% Euroyen notes, due 2003 1,000 1,000 7,5052.75% domestic straight bonds, due 2003 5,200 7,000 39,0243.0% domestic straight bonds, due 2004 3,900 4,000 29,2682.6% domestic straight bonds, due 2003 8,700 10,000 65,2912.6% Euroyen notes, due 2001 — 1,000 —3.1% Euroyen notes, due 2005 700 700 5,2532.7% domestic straight bonds, due 2001 — 5,000 —2.97% Euroyen notes, due 2002 — 5,000 —3.0% domestic straight bonds, due 2003 10,000 15,000 75,0473.0% domestic straight bonds, due 2003 33,902 35,000 254,4242.35% domestic straight bonds, due 2002 30,000 30,000 225,1412.65% domestic straight bonds, due 2003 9,820 10,000 73,6962.95% domestic straight bonds, due 2004 37,100 40,000 278,4242.35% domestic straight bonds, due 2003 9,510 9,710 71,3702.45% domestic straight bonds, due 2004 20,000 20,000 150,0942.45% domestic straight bonds, due 2004 9,770 10,000 73,3212.62% domestic straight bonds, due 2005 17,024 19,910 127,7602.3% domestic straight bonds, due 2004 4,400 4,700 33,0202.85% domestic straight bonds, due 2006 4,200 5,000 31,520Floating rate domestic straight bonds, due 2006 9,698 — 72,7801.6% domestic straight bonds, due 2006 10,000 — 75,047Floating rate domestic straight bonds, due 2006 10,000 — 75,047Floating rate domestic straight bonds, due 2007 10,000 — 75,0471.5% domestic straight bonds, due 2006 7,360 — 55,234 Floating rate domestic straight bonds, due 2006 10,000 — 75,047Loans, principally from banks and insurance companies,
interest principally at rates of 0.82% to 4.66% in 2002, and 0.80% to 4.58% in 2001:Secured 1,981 2,024 14,867Unsecured 532,838 531,907 3,998,784
876,403 959,941 6,577,133Amount due within one year (272,599) (243,800) (2,045,771)
¥603,804 ¥716,141 $4,531,362
26 SUMITOMO REALTY & DEVELOPMENT CO., LTD.

The aggregate annual maturities of long-term debt at March 31, 2002, are as follows:Thousands of
Year ending March 31 Millions of yen U.S. dollars
2003 ¥272,599 $2,045,771 2004 203,212 1,525,043 2005 170,388 1,278,709 2006 64,735 485,816 2007 113,845 854,372 2008 and thereafter 51,624 387,422
Net book value of property and equipment (mainly land and buildings) in the amount of ¥1,413 million ($10,604 thousand) was pledged as security for short-term bank loans and long-term debt at March 31, 2002.
As is customary in Japan, security must be given if requested by lending banks under certain circumstances, and generally banks have the right to offsetcash deposited with them against any debt or obligations payable to the bank that becomes due in case default and certain other specified events. TheCompany has never received such request.
As explained in Note 2 (12), effective April 1, 2000, the Companiesadopted the new accounting standard for employees’ severance andretirement benefits, under which the liabilities and expenses for severanceand retirement benefits are determined based on the amounts obtained by
actuarial calculations.The liabilities for severance and retirement benefits included in the
liability section of the consolidated balance sheets as of March 31, 2002and 2001 consisted of the following:
10. Employees’ severance and retirement benefits
Thousands ofMillions of yen U.S. dollars
2002 2001 2002
Projected benefit obligation ¥6,276 ¥5,624 $47,100Unrecognized actuarial differences (431) (145) (3,235)Less fair value of pension assets (2,102) (2,092) (15,775)Liability for severance and retirement benefits ¥3,743 ¥3,387 $28,090
Included in the consolidated statements of operations for the years ended March 31, 2002 and 2001 are severance and retirement benefit expensescomprised of the following:
Thousands ofMillions of yen U.S. dollars
2002 2001 2002
Service costs - benefits earned during the year ¥444 ¥ 398 $3,332Interest cost on projected benefit obligation 154 146 1,156Expected return on plan assets (61) (56) (458)Amortization of actuarial differences 145 — 1,088Amortization of net transition obligation — 1,681 —Severance and retirement benefit expenses ¥682 ¥2,169 $5,118
The discount rate and the rate of expected return on plan assets for yearsended March 31, 2002 and 2001 used by the Company are 2.5% and3%, respectively (the discount rates used by one consolidated subsidiary is2.0% and 2.5%, respectively). The estimated amount of all retirement
benefits to be paid at the future retirement date is allocated equally to eachservice year using the estimated number of total service years. Actuarialgains and losses are recognized in income statement in the next year.
SUMITOMO REALTY & DEVELOPMENT CO., LTD. 27

Details of deferred tax assets and liabilities at March 31, 2002 and 2001 are as follows:Thousands of
Millions of yen U.S. dollars
2002 2001 2002
Deferred tax assets:Net operating loss carryforwards ¥24,398 ¥34,157 $183,099Loss from devaluation of inventories 6,612 7,562 49,621Unrealized inter-company profits 3,937 3,919 29,546Net realized holding losses on securities 1,515 — 11,370 Other 4,927 3,693 36,976
Total deferred tax assets 41,389 49,331 310,612 Valuation allowance (15,583) (11,372) (116,946)
Net deferred tax assets 25,806 37,959 193,666
Deferred tax liabilities:Net unrealized holding gains on securities (47) (793) (353)Other (19) (757) (143)
Total deferred tax liabilities (66) (1,550) (496)
Net deferred tax assets ¥25,740 ¥36,409 $193,170
12. Guarantee and deposits receivedGuarantee and deposits received at March 31, 2002 and 2001, were summarized as follows: Thousands of
Millions of yen U.S. dollars
2002 2001 2002
Guarantee and lease deposits from tenants ¥185,678 ¥187,464 $1,393,456Long-term deposits 186,573 81,377 1,400,173
¥372,251 ¥268,841 $2,793,629
28 SUMITOMO REALTY & DEVELOPMENT CO., LTD.
The normal effective statutory income tax rate in Japan arising out ofaggregation of corporate, enterprise and inhabitants taxes wasapproximately 42.05 % for the years ended March 31, 2002, 2001 and2000.
The difference between the statutory tax rate and the Company’seffective tax rate for financial statement purposes for the years endedMarch 31, 2002 and 2001 were not significant. Therefore the breakdownof the differences of such tax rates is not disclosed.
11. Income taxes
Under the Commercial Code of Japan (the “Code”), the entire amount ofthe issue price of shares is required to be accounted for as capital,although a company may, by resolution of its board of directors, accountfor an amount not exceeding one-half of the issue price of the new sharesas additional paid-in capital.
Effective October 1, 2001, the Code provides that an amount equal toat least 10% of cash dividends and other cash appropriations shall beappropriated and set aside as a legal reserve until the total amount of legalreserve and additional paid-in capital equals 25% of common stock. Thelegal reserve and additional paid-in capital may be used to eliminate orreduce a deficit by resolution of the shareholders’ meeting or may be
capitalized by resolution of the Board of Directors. On condition that thetotal amount of legal reserve and additional paid-in capital remains beingequal to or exceeding 25% of common stock, they are available fordistribution by the resolution of shareholders’ meeting. Legal reserve isincluded in retained earnings in the accompanying financial statements.
The maximum amount that the Company can distribute as dividends iscalculated based on the non-consolidated financial statements of theCompany in accordance with the Code.
In 2002, the Company made IZUMI KAIHATSU CO., LTD as thewholly owned subsidiary company through exchange offerings.
13. Shareholders’ equity
Finance leases which do not transfer ownership to lessees are notcapitalized and accounted for in the same manner as operating leases.
Certain information for such non-capitalized finance leases was as follows.
14. Information for certain lease transactions

As lesseeA summary of assumed amounts (inclusive of interest) of acquisition cost, accumulated depreciation and net book value at March 31, 2002 and 2001 wereas follows:
Thousands ofMillions of yen U.S. dollars
2002 2001 2002
Acqusition cost:Buildings and structures ¥9,865 ¥3,377 $74,034Other 1,441 1,065 10,814
Accumulated depreciation (2,020) (1,460) (15,159)Net book value ¥9,286 ¥2,982 $69,689
Depreciation equivalent of ¥1,012 million ($7,595 thousand) and ¥825 million for 2002 and 2001, repectively, are computed using the straight-line methodover the lease terms assuming no residual value or residual indemnity.
Lease expenses under finance leases, inclusive of interest, for the years ended March 31, 2002 and 2001, amounted to ¥1,012 million ($7,595thousand) and ¥825 million, respectively.
Future lease payments and receipts under such finance leases and non-cancelable operating leases at March 31, 2002 and 2001, were as follows:
Thousands ofMillions of yen U.S. dollars
2002 2001 2002
Finance leasesFuture lease payments:
Due within one year ¥ 1,698 ¥ 708 $ 12,743Due after one year 7,588 2,274 56,946
Total ¥ 9,286 ¥ 2,982 $ 69,689
Future sub-lease payments:Due within one year ¥ 7 ¥ 12 $ 52 Due after one year 1 8 8
Total ¥ 8 ¥ 20 $ 60
Future sub-lease receipts:Due within one year ¥ 49 ¥51 $ 368Due after one year 42 91 315
Total ¥ 91 ¥ 142 $ 683
Operating leasesFuture lease payments:
Due within one year ¥ 4,910 ¥ 4,901 $ 36,848Due after one year 54,964 59,821 412,488
Total ¥59,874 ¥64,722 $449,336
Future lease receipts:Due within one year ¥ 89 ¥ 97 $ 668Due after one year 922 1,020 6,919
Total ¥ 1,011 ¥ 1,117 $ 7,587
The Company and its subsidiaries utilize financial derivative transactionsonly for the purpose of hedging the currency risk associated with foreigncurrency denominated transactions or hedging the interest rate riskassociated with the Company’s loans payable.
Forward foreign currency and interest rate swap contracts are subjectto risks of foreign exchange rate changes and interest rate changes,respectively. The derivative financial instruments are executed withcreditworthy financial institutions, and the Company’s managementbelieves there is little risk of default by counterparties.
The derivative transactions are executed by the Company’s FinanceDepartment in accordance with the decisions in the conference whosechairman is the director of finance department. The Finance Departmentprepares reports on derivative transactions and informs them to the
director of finance department periodically.The following summarizes hedging derivative financial instruments
used by the Companies and items hedged:Hedging instruments: Hedged items:Foreign exchange contracts Foreign currency monetary liabilities and
foreign provisional transactionInterest rate swap contracts Bank loan, bonds and deposits
The Companies evaluate hedge effectiveness by comparing the cumulativechanges in cash flows from or the changes in fair value of hedged itemsand the corresponding changes in the hedging derivative instruments.
Evaluating hedge effectiveness of interest rate swap at years endedMarch 31, 2002 and 2001 is omitted as special hedge accounting has
15. Derivative transactions
SUMITOMO REALTY & DEVELOPMENT CO., LTD. 29

been applied to derivative transactions of interest rate swap contracts.Also, evaluating hedge effectiveness of foreign exchange at years endedMarch 31, 2002 and 2001 is omitted because significant terms ofhedging instruments and those of the items hedged are the same and therisk of changes in foreign exchange rates would be entirely eliminated.
The contract amounts and unrealized gain or loss of outstandingderivative transactions at March 31, 2002 and 2001were not disclosedbecause all derivative transactions were used as hedges and hedgeaccounting was applied.
During the year ended March 31, 2002, a consolidated subsidiary of theCompany assigned its bank loan of ¥2,000 million ($15,009 thousand)and certain assets deemed to be sufficient for the repayment to a SPC.Under an agreement among the Company, the bank and the SPC, theSPC accepted the liability as a primary debtor, whereas the consolidatedsubsidiary remains as a secondary debtor. In cases of the delay inpayment by the SPC as set forth in the agreement, the consolidatedsubsidiary may be subject to certain recourse by the bank.
(Lawsuits)The Company was a defendant in the following lawsuits, in which, basedon the Leased Land and House Lease Law, the Company claimed thereduction of the rental payments.
Two lawsuits are pending in court.
A lawsuit was brought in the Tokyo District Court against the Companyin 1994 (Case A) and another one in 1995 (Case B), relating to claims torecover the difference between the rental payments based on the leaseagreements and the amounts the Company paid taking a position underLeased Land and House Lease Law. While the District Court issuedjudgements against the Company in August and October of 1998, theCompany appealed to the Tokyo Higher Court in September andNovember of 1998 as the Company believed that the judgements werecontradictory to the previous legal interpretations.
In case A, the Tokyo Higher Court issued judgement for the Companyin October of 1999. And the lessor appealed to the Supreme Court inNovember of 1999.
In case B, the Tokyo Higher Court issued judgement against theCompany in January of 2000 that, the Company believed, wascontradictory to the previous legal interpretations. So the Companyappealed to the Supreme Court in January of 2000.
The Company issued 1.75 % ¥10,000 million ($75,047 million) domesticstraight bonds due 2005 on April 26, 2002, 1.85% ¥8,000 million($60,038 million) domestic straight bonds due 2006 on May 17, 2002,1.85% ¥20,000 million ($150,094 million) domestic straight bonds due2006 on May 20, 2002, and 2.00% ¥10,000 million ($75,047 million)
domestic straight bonds due 2007 on June 26, 2002. On June 27, 2002, the shareholders of the Company approved
payments of a year-end cash dividend of ¥6 ($0.05) per share or a total¥2,442 million ($18,326 thousand) to shareholders of record at March 31,2002.
17. Subsequent events
30 SUMITOMO REALTY & DEVELOPMENT CO., LTD.
At March 31, 2002, the Company and its consolidated subsidiaries were contingently liable as guarantors of borrowings by affiliates and others as follows:
Thousands ofMillions of yen U.S. dollars
Affiliates ¥1,580 $11,858 Other 5,386 40,420
Total ¥6,966 $52,278
Also, at March 31, 2002, the Company and its consolidated subsidiaries had outstanding commitments to guarantee loans of certain affiliates and others.Certain information them as follows:
Thousands ofMillions of yen U.S. dollars
Affiliates ¥— $— Other 10 75
Total ¥10 $75
16. Contingent liabilities

The Company and its consolidated subsidiaries mainly operate their business in five segments: leasing of buildings and shopping centers, etc.; sale ofdetached homes; construction of housing and buildings; brokerage business; and other business.
Information by industry segments for the years ended March 31, 2002, 2001 and 2000 is summarized as follows:
Millions of yen
Leasing Sales Construction Brokerage Other Eliminationbusiness business business business business Total and/or corporate Consolidated
Year Ended March 31, 2002I Net sales
Customers ¥ 176,244 ¥ 170,428 ¥ 108,336 ¥ 35,966 ¥ 6,903 ¥ 497,877 ¥ — ¥ 497,877Intersegment 1,790 — 6,993 218 3,494 12,495 (12,495) —
Total 178,034 170,428 115,329 36,184 10,397 510,372 (12,495) 497,877Costs and expenses 128,809 146,040 110,557 28,231 10,384 424,021 (6,514) 417,507Operating income ¥ 49,225 ¥ 24,388 ¥ 4,772 ¥ 7,953 ¥ 13 ¥ 86,351 ¥ (5,981) ¥ 80,370
II Identifiable assets ¥ 1,506,120 ¥ 193,374 ¥ 20,299 ¥ 21,044 ¥ 110,412 ¥ 1,851,249 ¥ 121,486 ¥ 1,972,735Depreciation expense 9,942 99 176 212 71 10,500 231 10,731Capital expenditures 63,839 414 211 274 71 64,809 654 65,463
Year Ended March 31, 2001I Net sales
Customers ¥ 163,047 ¥ 149,196 ¥ 104,549 ¥ 34,702 ¥ 7,751 ¥ 459,245 ¥ — ¥ 459,245Intersegment 1,528 — 9,000 179 6,461 17,168 (17,168) —
Total 164,575 149,196 113,549 34,881 14,212 476,413 (17,168) 459,245Costs and expenses 118,137 129,502 109,533 26,160 8,865 392,197 (8,170) 384,027Operating income ¥ 46,438 ¥ 19,694 ¥ 4,016 ¥ 8,721 ¥ 5,347 ¥ 84,216 ¥ (8,998) ¥ 75,218
II Identifiable assets ¥ 1,415,770 ¥ 152,264 ¥ 25,266 ¥ 27,200 ¥ 115,332 ¥ 1,735,832 ¥ 167,697 ¥ 1,903,529 Depreciation expense 9,707 51 187 178 85 10,208 169 10,377 Capital expenditures 45,721 515 334 732 125 47,427 454 47,881
Millions of yen
Leasing Sales Construction Brokerage Loans Other EliminationFor 2000 business business business business business business Total and/or corporate Consolidated
I Net salesCustomers ¥ 151,268 ¥ 150,483 ¥ 80,064 ¥ 31,633 ¥ 2,192 ¥ 5,947 ¥ 421,587 ¥ — ¥ 421,587Intersegment 1,535 3 7,102 290 4,089 965 13,984 (13,984) —
Total 152,803 150,486 87,166 31,923 6,281 6,912 435,571 (13,984) 421,587 Costs and expenses 107,050 131,912 82,412 24,698 4,069 6,382 356,523 (5,484) 351,039Operating income ¥ 45,753 ¥ 18,574 ¥ 4,754 ¥ 7,225 ¥ 2,212 ¥ 530 ¥ 79,048 ¥ (8,500) ¥ 70,548
II Identifiable assets ¥1,492,129 ¥ 128,572 ¥ 22,664 ¥ 21,124 ¥ 372,083 ¥ 7,835 ¥ 2,044,407 ¥ (128,064) ¥ 1,916,343Depreciation expense 10,649 28 209 163 3 82 11,134 135 11,269 Capital expenditures 104,567 464 129 121 — 25 105,306 443 105,749
Thousands of U.S.dollars
Leasing Sales Construction Brokerage Other EliminationFor 2002 business business business business business Total and/or corporate Consolidated
I Net salesCustomers $ 1,322,657 $ 1,279,009 $ 813,028 $ 269,914 $ 51,805 $ 3,736,413 $ — $ 3,736,413Intersegment 13,433 0 52,480 1,636 26,222 93,771 (93,771) —
Total 1,336,090 1,279,009 865,508 271,550 78,027 3,830,184 (93,771) 3,736,413Costs and expenses 966,671 1,095,985 829,696 211,865 77,929 3,182,146 (48,885) 3,133,261Operating income $ 369,419 $ 183,024 $ 35,812 $ 59,685 $ 98 $ 648,038 $ (44,886) $ 603,152
II Identifiable assets $ 11,302,964 $ 1,451,212 $ 152,338 $ 157,929 $ 828,607 $ 13,893,050 $ 911,715 $ 14,804,765Depreciation expense 74,611 743 1,321 1,591 533 78,799 1,734 80,533Capital expenditures 479,092 3,107 1,584 2,056 533 486,372 4,908 491,280
In the year ended March 31, 2002, the Company changed the method of recognition of revenue and expense from the real estate business which used SPC as statedin Note 3, “Changes in accounting policies”. Also, as described in Note 8, the Company transferred certain investment in securities to securitized properties for sale onApril 1, 2001.
18. Segment information
SUMITOMO REALTY & DEVELOPMENT CO., LTD. 31

32 SUMITOMO REALTY & DEVELOPMENT CO., LTD.
In the year ended March 31, 2001, several changes were made affectingsegment disclosures as follows :
A. From the year ended March 31, 2001, Loans business segment isincluded in Other business segment as the segment accounted forless than 10% of all segments in net sales, operating income andidentifiable assets. Information on Loans business segment for the year ended March 31,2001, is summarized as follows:
Millions of yenLoans
business
I Net sales Customers ¥1,784Intersegment 5,009
Total 6,793Costs and expenses 1,750
Operating income ¥5,043
II Identifiable assets ¥112,193Depreciation expense 7Capital expenditures 27
As described in Note 3 to the Consolidated Financial Statements, from theyear ended March 31, 2000, employees retirement benefits were providedby the Net Present Value method, and allowance for doubtful accounts isprovided using the average percentage of write–off in the past.
The effects of the changes on operating income for the year endedMarch 31, 2001, were as follows:
Millions of yen
Sales business ¥ (7)Brokerage business (64)Loans business (1)Elimination and/or corporate 50
B. As described in Note 2(5) to the Consolidated Financial Statements,from the year ended March 31, 2001, one domestic consolidatedsubsidiary introduced cost accounting system.The effect of this adoption on operating income for the year endedMarch 31, 2001, was as follows:
Millions of yen
Sales business ¥624Brokerage business 341
C. As described in Note 2(12) to the Consolidated Financial Statements,from the year ended March 31, 2001, the Company and itsconsolidated subsidiaries adopted the new accounting standard forseverance and retirement benefits.The effect of this adoption on operating income for the year endedMarch 31, 2001, was as follows:
Millions of yen
Leasing business ¥(15)Construction business (18)Other business (3)Elimination and/or corporate 3
D. As described in Notes 2(6) and 2(13) to the Consolidated FinancialStatements, from the year ended March 31, 2001, the Company andits consolidated subsidiaries adopted the new accounting standard forfinancial instruments.The effect of these adoptions on operating income for the year endedMarch 31, 2001, was as follows:
Millions of yen
Leasing business ¥4
The effects of these changes on operating income and identifiable assets at and for the year ended March 31, 2002, were as follows:
Millions of yen Thousands of U.S. dollarsOperating income Identifiable assets Operating income Identifiable assets
Leasing business ¥3,426 ¥44,221 $25,711 $331,865Sales business — 22,102 — 165,869Elimination and/or corporate — (66,323) — (497,734)

To the Shareholders and the Board of Directors of
Sumitomo Realty & Development Co., Ltd.:
We have audited the accompanying consolidated balance sheets of Sumitomo Realty & Development Co., Ltd. (a Japanese corporation) and
subsidiaries as of March 31, 2002 and 2001, and the related consolidated statements of operations, shareholders’ equity and cash flows for each
of the three years in the period ended March 31, 2002, expressed in Japanese yen. Our audits were made in accordance with generally accepted
auditing standards in Japan and, accordingly, included such tests of the accounting records and such other auditing procedures as we considered
necessary in the circumstances.
In our opinion, the consolidated financial statements referred to above present fairly the consolidated financial position of Sumitomo Realty &
Development Co., Ltd. and subsidiaries as of March 31, 2002 and 2001, and the consolidated results of their operations and their cash flows for
each of the three years in the period ended March 31, 2002 in conformity with accounting principles generally accepted in Japan ( Note 1) applied
on a consistent basis during the periods, except as noted in the following paragraph.
As explained in Note 2, Sumitomo Realty & Development Co., Ltd. and subsidiaries adopted, on a prospective basis in all cases, new Japanese
accounting standards for financial instruments, employees’ severance and retirement benefits and foreign currency translation effective April 1,
2000, and for consolidation and equity method accounting and research and development costs effective April 1, 1999. Also, as explained in Note
3, Sumitomo Realty & Development Co., Ltd. and a domestic subsidiary changed the method of providing allowance for doubtful accounts,
employees’ retirement benefits, effective April 1, 1999 and Sumitomo Realty & Development Co., Ltd. changed the method of recognition of
revenue and expense from the real estate business which used SPC, effective April 1, 2001, with which we concur.
Also, in our opinion, the U.S. dollar amounts in the accompanying consolidated financial statements have been translated from Japanese yen on the
basis set forth in Note 1.
Tokyo, Japan
June 27, 2002
SUMITOMO REALTY & DEVELOPMENT CO., LTD. 33
Report of Independent Public Accountants

34 SUMITOMO REALTY & DEVELOPMENT CO., LTD.
Chairman of the BoardShinichiro Takagi
PresidentJunji Takashima
Director and AdvisorTaro Ando
Senior Managing DirectorsHirohisa IchikawaYoichi NakamuraTetsuro TsurutaHisao MatsuiMasayoshi Ohashi
Managing DirectorsMitsuru MoriSadao UshimaruKazuo MasuokaKenichi Onodera
DirectorsKenichiro SugimotoAkira KandaHaruo FukumuroKenichi KameyamaYozo AkiyamaShozo SuzukiYasushi KinoshitaSatoru MiyashitaTsutomu OyamaHiroyuki AsanoYoshifumi Nakamura
Statutory AuditorsShinsaku SanmotoRyoichi NomuraTadashi KitamuraKunio Kobayashi
Board of Directors and Auditors(As of June 28, 2002)
Corporate Data(As of March 31, 2002)
Sumitomo Realty & Development Co., Ltd.
Head OfficeShinjuku NS Building4-1, Nishi-Shinjuku 2-chomeShinjuku-ku, Tokyo 163-0820, JapanPhone: 03-3346-2342Facsimile: 03-3346-1652http://www.sumitomo-rd.co.jp
Date of EstablishmentDecember 1, 1949
Paid-in Capital¥86,787 million
Common Stock Issued and Outstanding407,085,978
Number of Shareholders31,855
Number of Employees6,329
Major Consolidated SubsidiariesSumitomo Real Estate Sales Co., Ltd.Sumitomo Fudosan Home Co., Ltd.Sumitomo Fudosan Syscon Co., Ltd.Sumitomo Fudosan Tatemono Service Co., Ltd.Sumitomo Fudosan Fitness Co., Ltd.Izumi Restaurant Co., Ltd.Sumitomo Fudosan Finance Co., Ltd.Shintoshin Real Estate Co., Ltd.Universal Home Inc.
Stock Exchange ListingsTokyo and Osaka

Share Price and Trading Volume on Tokyo Stock Exchange(As of June 28, 2002)
1997 1998 1999 2000 2001 2002
0
20
60
40
100
120
140
80
¥200
¥600
* Simple average of monthly highs and lows.
¥400
¥0
¥1,000
Share price (left scale)
*TOPIX average (right scale)
Trading volume (million shares)
¥800
¥1,200
¥800
¥1,200
¥1,000
¥600
¥1,600
¥1,400
¥1,800

Shinjuku NS Building, 4-1, Nishi-Shinjuku 2-chome Shinjuku-ku, Tokyo 163-0820, JapanPhone: 03-3346-2342 Facsimile: 03-3346-1652http://www.sumitomo-rd.co.jp
Printed in Japan