sumitomo heavy industries, ltd. - shi.co.jp€¦ · sumitomo heavy industries, ltd. consolidated...
TRANSCRIPT

Sumitomo Heavy Industries, Ltd. CONSOLIDATED FINANCIAL REPORT
For the Full Year Ended March 31, 2016
All financial information has been prepared in accordance with generally accepted accounting principles in Japan. This document
has been translated from the Japanese original as a guide to non-Japanese investors, and contains forward-looking statements that
are based on management’s estimates, assumptions, and projections at the time of publication. A number of factors could cause
actual results to differ materially from expectations. Amounts shown in this financial statement have been rounded to the nearest
million yen.

Consolidated Results for the Full Year Ended March 31, 2016
2
Summary of Consolidated Financial Results For the Full Year Ended March 31, 2016
Presented May 10, 2016
Sumitomo Heavy Industries, Ltd. Listed exchanges Tokyo Stock Exchange
Stock code 6302
Head office Tokyo
President Shunsuke Betsukawa
URL www.shi.co.jp
Inquiries Tsuneyoshi Sato General Manager, Corporate Communications Dept.
Telephone +81 3 6737 2331
Scheduled date of ordinary shareholders’ meeting
June 29, 2016
Scheduled date of payment of cash dividends
June 30, 2016
Scheduled date of securities report filing June 29, 2016
Availability of supplementary explanatory materials for financial statement
Yes
Holding of meeting to explain financial statement
Yes (for analysts)
1. FY 2015 Consolidated Results (April 1, 2015, to March 31, 2016) (1) Business Results
(Unit: million yen)
Current Full Term
April 1, 2015 to March 31, 2016
Previous Full Term April 1, 2014
to March 31, 2015
% change % change
Net sales 700,838 5.1 667,099 8.4
Operating income 50,568 9.9 45,998 34.0
Ordinary income 49,131 8.9 45,113 36.7
Net income attributed to shareholders of the parent company
33,133 36.1 24,348 36.1
Net income per share (yen) 54.06 39.71
Fully diluted net income per share ― ―
Return on equity (ROE, %) 9.0 7.1
Return on assets (%) 6.3 6.0
Ordinary income to net sales (%) 7.2 6.9
Note: Comprehensive income:
Fiscal year ended March 31, 2016: 20,410 million yen (-48.9%) Fiscal year ended March 31, 2015: 39,922 million yen (-5.4%)
Reference: Equity method investment profit and loss: Fiscal year ended March 31, 2016: (2,083 million yen gain) Fiscal year ended March 31, 2015: (1,549 million yen gain)

Consolidated Results for the Full Year Ended March 31, 2016
3
(2) Financial Position
(Unit: million yen)
End of Current Full Year
March 31, 2016 End of Previous Full Year
March 31, 2015
Total assets 782,859 786,027
Net assets 382,817 365,101
Equity ratio (%) 48.1 45.8
Net assets per share (yen) 614.51 587.37
Reference: Equity:
Fiscal year ended March 31, 2016: 376,619 million yen Fiscal year ended March 31, 2015: 360,079 million yen
(3) Cash Flows
(Unit: million yen)
Current Full Year April 1, 2015 to March 31, 2016
Previous Full Year April 1, 2014 to March 31, 2015
Cash flows from operating activities 18,345 62,170
Cash flows from investing activities (15,350) (14,112)
Cash flows from financing activities (23,789) (36,889)
Cash and cash equivalents at end of period 68,625 90,324
2. Dividends (Unit: yen)
Year Ended March 31,
2015 Year Ended March 31,
2016 Year Ending March 31,
2017 (forecast)
Annual dividends per share
First quarter ― ― ―
Second quarter 5.00 7.00 7.00
Third quarter ― ― ―
End of term 7.00 9.00 7.00
Annual dividends 12.00 16.00 14.00
Total dividends (million yen) 7,356 9,806
Payout ratio (consolidated, %) 30.2 29.6 30.6
Net assets dividend yield (consolidated, %) 2.0 2.6
Consolidated Results for the Full Year Ended March 31, 2016
4
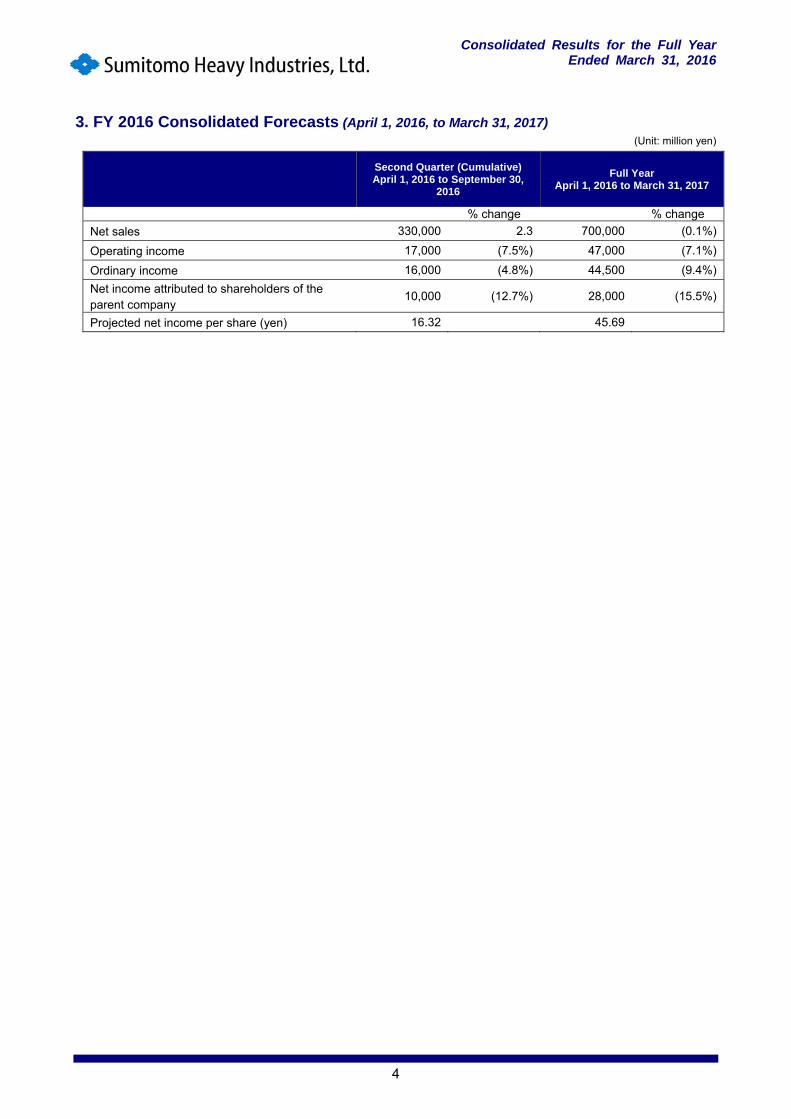
3. FY 2016 Consolidated Forecasts (April 1, 2016, to March 31, 2017) (Unit: million yen)
Second Quarter (Cumulative) April 1, 2016 to September 30,
2016
Full Year April 1, 2016 to March 31, 2017
% change % change
Net sales 330,000 2.3 700,000 (0.1%)
Operating income 17,000 (7.5%) 47,000 (7.1%)
Ordinary income 16,000 (4.8%) 44,500 (9.4%)
Net income attributed to shareholders of the parent company
10,000 (12.7%) 28,000 (15.5%)
Projected net income per share (yen) 16.32 45.69

Consolidated Results for the Full Year Ended March 31, 2016
5
Additional Notes (1) Transfers of important subsidiaries during the fiscal period (moves of specific subsidiaries due to change in scope of
consolidation): None
Newly consolidated: None
Excluded from consolidation: None
(2) Changes to accounting policies, changes to accounting estimates, and retrospective restatements
(i) Changes to accounting policies due to revisions to accounting standards: Yes
(ii) Changes to accounting policies not otherwise stated in (i): None
(iii) Changes to accounting estimates: None
(iv) Retrospective restatements: None
(3) Number of shares issued (common shares)
(i) Number of shares issued at end of fiscal period (including treasury stock):
As of March 31, 2016 614,527,405 shares
As of March 31, 2015 614,527,405 shares
(ii) Number of treasury shares at end of fiscal period:
As of March 31, 2016 1,647,819 shares
As of March 31, 2015 1,495,994 shares
(iii) Average number of shares during fiscal period:
As of March 31, 2016 612,933,747 shares
As of March 31, 2015 613,122,326 shares
Disclosure of Present Status of Audit Procedures
In compliance with the Financial Instruments and Exchange Act, audit procedures for financial statements are performed when the Consolidated Financial Results are announced.
Explanations and Other Special Items regarding the Pertinent Reasons for the Earnings Forecast
Earnings forecasts and outlooks concerning future financial results are believed to be reasonable based on information available at the time of publication. Actual financial results may vary from the above forecast and outlook due to a variety of factors. For information on the assumptions that form the basis of the earnings forecast and items to note concerning the use of earnings forecasts, please refer to the Analysis of Operating Results in the Supplementary Materials section beginning on page 7.

Consolidated Results for the Full Year Ended March 31, 2016
6
Supplementary Materials – Table of Contents
I. Results of Operations ..................................................................................................................... 7
1. Analysis of Operating Results ......................................................................................................... 7 2. Analysis of Financial Condition ..................................................................................................... 10 3. Basic Policy on Earnings Appropriation and Dividend for the Consolidated Fiscal Year Under
Review as well as the Current Fiscal Year Ending March 31, 2015 .............................................. 11 II. Status of the Business Group ...................................................................................................... 12 III. Management Policies .................................................................................................................... 14
1. Basic Management Policy ............................................................................................................ 14 2. Medium- to Long-Term Management Strategy, Target Management Benchmarks and Action Items
for the Group ................................................................................................................................. 14 IV. Selection of Accounting Standards ......................................................................................... 1716 V. Consolidated Financial Statements ............................................................................................ 1817
1. Consolidated Balance Sheets .................................................................................................... 1817 2. Consolidated Income Statements and Consolidated Statement of Comprehensive Income ...... 2221 3. Consolidated Statements of Changes to Stockholders' Equity ................................................... 2423 4. Consolidated Cash Flows Statement ......................................................................................... 2625 5. Items of Special Note Concerning the Consolidated Financial Statements ................................ 2827
(Significant Events or Conditions that Question the Premise of a Going Concern) ..................... 2827 (Changes to Accounting Policies) ................................................................................................ 2827 (Segment Information) ................................................................................................................. 2928 (Per Share Information) ................................................................................................................... 32 (Subsequent Events of Significant Importance) .............................................................................. 32
VI. Supplemental Information .............................................................................................................. 33 Orders Received, Sales, and Balance of Orders Received, by Segment ........................................... 33

Consolidated Results for the Full Year Ended March 31, 2016
7
I. Results of Operations
1. Analysis of Operating Results (1) Summary of Economic Climate during the Consolidated Fiscal Year
During the current consolidated fiscal year under review, personal consumption levels in Japan did not show any signs of
strengthening mainly due to a negative consumer mindset leading from factors such as the lack of growth in real wages
and the drop in share prices during the second half of the fiscal year. On the corporate side, although an improvement in
financial performance resulted in an upward trend in capital investment levels, the cautious stance of businesses to make
such investments grew stronger due to stagnating export levels. These two dynamics slowed the recovery of the Japanese
economy.
Outside of Japan, the U.S. economy continued to recover as their fiscal policies shifted to a more normalized state. The
Eurozone also continued on a path of gentle recovery. On the other hand, the slowdown of the Chinese economy became
more apparent, while other emerging market economies struggled to grow not only because of the knock-on effect from
the stagnating Chinese economy but also because of a drop in resource prices, with crude oil prices leading the way. As
a result, the overall global economy showed signs of a gentle slowdown during the current consolidated fiscal year under
review.
Under these conditions, the Sumitomo Heavy Industries Group (hereinafter referred to as “SHI” or the “Group”) continued
to execute on the “Medium Term Management Plan 2016 (hereinafter referred to as “MTMP16” or the “Plan”)” that was
initiated during the previous fiscal year. More specifically, the Group carried out business operations on the basis of the
following key policies:
(i) “Steady growth” to establish a foundation for sustainable growth
(a) “Globalization (Expansion)”
In the plastics machinery business, ties with the Group’s German subsidiary, SUMITOMO (SHI) DEMAG PLASTICS
MACHINERY, continued to strengthen for the sale and development of electric injection molding machines. At the same
time, the SUMITOMO (SHI) DEMAG PLASTICS MACHINERY opened a new plant in China to enhance its capabilities to
respond to demand from China and the broader Asian market.
In the gear reducer business, the Group pushed forward with optimizing the number of overseas locations operated by its
Belgian subsidiary, HANSEN INDUSTRIAL TRANSMISSIONS NV. Moreover, the supply chain for the manufacturing of
large-scale gear reducers in Japan and Asia was revamped. Through these moves, the Group looked to improve its cost
competitiveness in this product area.
Finally, in the cryogenic coolers business, the Group enhanced its sales and service capabilities through the establishment
of a new facility in China, a market where significant growth can be anticipated for this product line in the future.
(b) “Innovation (Change)”
In the area of plastics machines, the Group focused on the development of a fully electric-driven medium-scale injection
molding machine. In addition, the sale of the SEEV-A-HD was launched, bringing excitement to the market because this
new product series is capable of being equipped with larger molds as compared to previous models, improving the
productivity of molded pieces. In the area of industrial machinery, the Group pushed forward with development of cutting-
edge cancer treatment technology. More specifically, the approval of the Boron Neutron Capture Therapy (BNCT) system
that the Group is developing, which combines a cyclotron neutron irradiation system with a boron-based compound, came
one step closer to officially being approved as a medical device with the commencement of clinical trials to study its
effectiveness in treating cancer.
(c) “Group Synergies (Connect)”
The Group was able to achieve increase sales of its hybrid hydraulic excavators as well as its field view monitors which
enable improved rear visibility for excavators; two product differentiation innovations that were achieved through the use
of system control technologies that were developed internally by SHI over many years. Moreover, in the Group’s focus
area of energy, cooperation between the boiler business and turbine business was strengthened, with the aim to improve
competitiveness and internal synergies.

Consolidated Results for the Full Year Ended March 31, 2016
8
(ii) "Return to higher levels of profitability"
An improvement in sales and profitability of the Precision Machinery Division that includes the plastics machinery business
and semiconductor-related business was achieved mainly due to the increased ability to respond to customer needs
through product differentiation. Sales and profitability of the material handling business also improved mainly due to
increased productivity arising from the transition to a “repeatability-based production model”. Finally, a focus on
strengthening the aftermarket service business across all of the Group’s divisions, a key strategy outlined in the MTMP16,
greatly contributed to securing profitability amidst a fluid operating environment.
(iii) "Persistent efforts for operational quality improvements"
The Group continued to implement measures to strengthen its product quality management functions with the Corporate
Quality Group located in the Head Office leading the charge. In the area of safety, the Group continued on the second
execution phase of the Health and Safety Improvement Plan, with the aim to strengthen health and safety management
capabilities and to eliminate workplace injuries.
(iv) Thoroughly Implement Compliance Measures
In line with the Group’s guiding principle of “Prioritizing Compliance Above All Else”, the Group carried out trainings,
discussion-based education activities, and e-learning in the area of anti-competitive behaviors to emphasize the
importance of compliance during the current consolidated fiscal year under review. In addition, the Group carried out
discussion-based compliance training across its China operations to strengthen the overall compliance-based mindset of
employees based in the country.
As a result of the above-mentioned activities, the current consolidated fiscal year under review saw orders finish at
JPY685.9 billion, a 7.4% decline as compared to the previous fiscal year, and sales finish at JPY700.8 billion, a 5.1%
improvement as compared to the previous fiscal year.
In terms of profitability, the Group posted operating income of JPY50.6 billion, a 9.9% improvement as compared to the
previous fiscal year, and ordinary income of JPY49.1 billion, an 8.9% improvement as compared to the previous fiscal year.
Net income attributed to shareholders of the parent company for the current consolidated fiscal year under review increased
by 36.1% to finish at JPY33.1 billion. Finally, the after-tax ROIC* ended at 7.6%.
On a non-consolidated basis, the fiscal year under review saw orders finish at JPY173.9 billion and sales finish at JPY196.8
billion. Further, the Group posted a non-consolidated operating income of JPY5.4 billion, a non-consolidated ordinary
income of JPY20.9 billion and a non-consolidated net income of JPY18.9 billion for the fiscal year under review.
After considering the aforementioned financial performance and the Group’s fiscal condition, the dividend from retained
earnings for the current consolidated fiscal year under review has been set at JPY16 per share, an increase of JPY4 as
compared to the previous fiscal year. It should be noted that this figure already includes the JPY7 per share that was
announced as an interim dividend.
* ROIC is an abbreviation for Return on Invested Capital, and it measures the amount of profit generated from invested capital (the sum of shareholders’ equity and interest-bearing liabilities) as well as profitability as compared to the cost of capital.
(2) Group Results by Segment
(i) Machinery Components
Although there was a slowdown in the China market, there was positive movement in market conditions for both North
America and Japan. As a result, both orders and sales increased as compared to the previous fiscal year.
More specifically, orders stayed at almost same level as compared to the previous fiscal year to finish at JPY105.0 billion,
and sales increased by 5% as compared to the previous fiscal year to finish at JPY107.6 billion. The segment posted an
operating income of JPY8.9 billion, a 35% increase as compared to the previous fiscal year.

Consolidated Results for the Full Year Ended March 31, 2016
9
(ii) Precision Machinery
With respect to plastics machinery business, strong demand from the IT industry in Asia slowed, while positive market
conditions trended positively in Japan as well as the Eurozone and North America. As a result, both orders and sales
increased as compared to the previous fiscal year. In other product areas, although orders in the semiconductor-related
equipment business fell, sales continued to rise.
As a result of the above, orders across the segment stayed at almost same level as compared to the previous fiscal year
to finish at JPY154.6 billion, while sales increased by 6% as compared to the previous fiscal year to finish at JPY154.6
billion. The segment posted an operating income of JPY18.7 billion, a 38% increase as compared to the previous fiscal
year.
(iii) Construction Machinery
The hydraulic excavator business saw a drop in both orders and sales mainly due to a significant drop off in demand in the
China market, and a slowdown in domestic sales following the temporary jump in demand arising from the rush to purchase
models prior to the implementation of new emission regulations in the prior fiscal year. With respect to the mobile crane
business, orders decreased as compared to the previous fiscal year, mainly due to a slowdown in demand from the North
American market, while sales increased.
As a result of the above, orders across the segment decreased by 5% as compared to the previous fiscal year to finish at
JPY197.1 billion, and sales stayed at almost same level as compared to the previous fiscal year to finish at JPY201.9
billion. The segment posted an operating income of JPY4.4 billion, a 63% decrease as compared to the previous fiscal
year.
(iv) Industrial Machinery
The material handling business posted improved results for orders and sales as demand from the domestic shipbuilding
sector trended positively. In the area of industrial machinery equipment business, it was able to secure an order for a
proton cancer therapy equipment. As a result, orders and sales across the entire segment showed improvement as
compared to the previous fiscal year.
As a result of the above, orders across the segment increased by 3% as compared to the previous fiscal year to finish at
JPY92.6 billion, and sales increased by 16% as compared to the previous fiscal year to finish at JPY87.9 billion. The
segment posted an operating income of JPY10.0 billion, a 73% increase as compared to the previous fiscal year.
(v) Ships
Although the market for medium-size tankers which the Group specializes in remained comparatively stable, overall
conditions of shipbuilding market became tougher. This resulted in the segment receiving orders for only two new vessels
during the current consolidated fiscal year under review, a drop of seven vessels as compared to the previous fiscal year.
With regard to sales, three vessels were handed over during the current fiscal year, which was the same number as the
previous fiscal year.
As a result of the above, orders across the segment decreased by 64% as compared to the previous fiscal year to finish
at JPY22.5 billion, while sales increased by 11% as compared to the previous fiscal year to finish at JPY29.0 billion. The
segment also posted an operating income of JPY1.0 billion for the current consolidated fiscal year under review.
(vi) Environmental Facilities & Plants
Although the energy plant business was able to secure orders for circulating fluidized bed boilers from overseas-based
Independent Power Producer (IPP) customers as well as biomass-fueled power generation boiler projects in Japan, overall
orders fell mainly due to a drop in the number of order-receiving projects. On the other hand sales grew in this area of the
segment. Both orders and sales in the water treatment plant business increased mainly due receiving an order for a large-
scale refurbishment project.
As a result of the above, orders across the segment decreased by 7% as compared to the previous fiscal year to finish at
JPY106.1 billion, while sales increased by 4% as compared to the previous fiscal year to finish at JPY109.7 billion. The
segment posted an operating income of JPY5.8 billion, a 23% decrease as compared to the previous fiscal year.
Consolidated Results for the Full Year Ended March 31, 2016
10
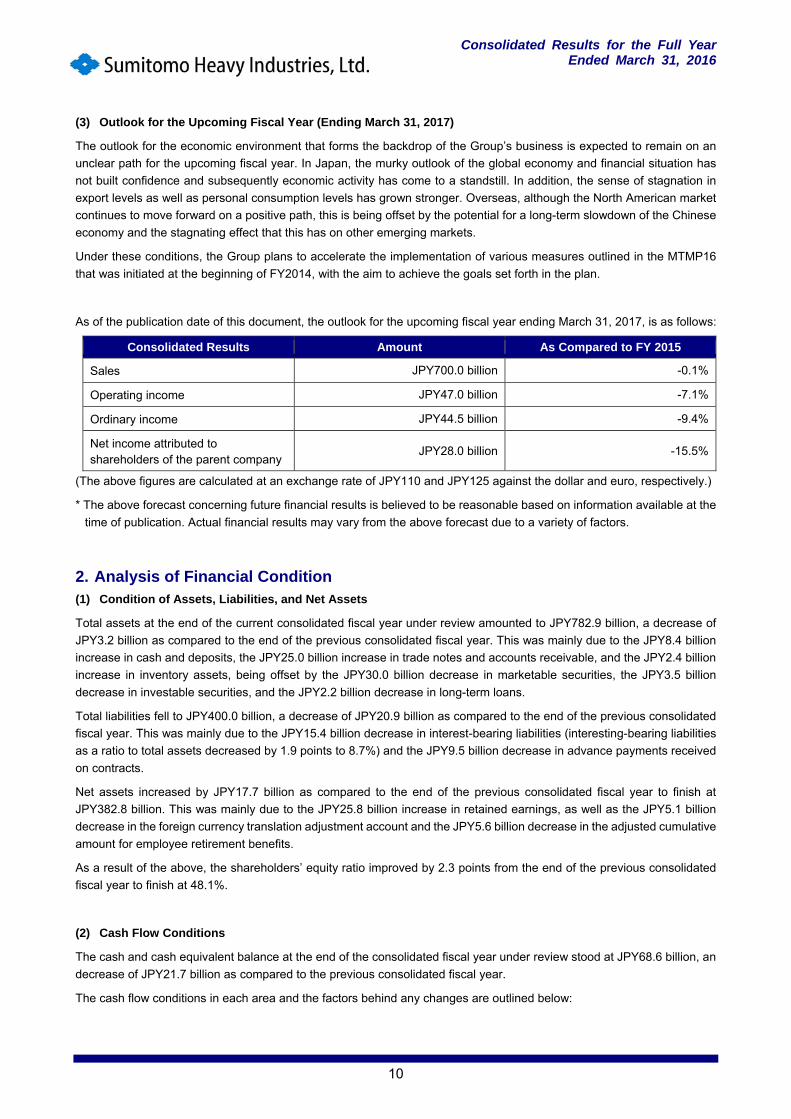
(3) Outlook for the Upcoming Fiscal Year (Ending March 31, 2017)
The outlook for the economic environment that forms the backdrop of the Group’s business is expected to remain on an
unclear path for the upcoming fiscal year. In Japan, the murky outlook of the global economy and financial situation has
not built confidence and subsequently economic activity has come to a standstill. In addition, the sense of stagnation in
export levels as well as personal consumption levels has grown stronger. Overseas, although the North American market
continues to move forward on a positive path, this is being offset by the potential for a long-term slowdown of the Chinese
economy and the stagnating effect that this has on other emerging markets.
Under these conditions, the Group plans to accelerate the implementation of various measures outlined in the MTMP16
that was initiated at the beginning of FY2014, with the aim to achieve the goals set forth in the plan.
As of the publication date of this document, the outlook for the upcoming fiscal year ending March 31, 2017, is as follows:
Consolidated Results Amount As Compared to FY 2015
Sales JPY700.0 billion -0.1%
Operating income JPY47.0 billion -7.1%
Ordinary income JPY44.5 billion -9.4%
Net income attributed to shareholders of the parent company
JPY28.0 billion -15.5%
(The above figures are calculated at an exchange rate of JPY110 and JPY125 against the dollar and euro, respectively.)
* The above forecast concerning future financial results is believed to be reasonable based on information available at the
time of publication. Actual financial results may vary from the above forecast due to a variety of factors.
2. Analysis of Financial Condition (1) Condition of Assets, Liabilities, and Net Assets
Total assets at the end of the current consolidated fiscal year under review amounted to JPY782.9 billion, a decrease of
JPY3.2 billion as compared to the end of the previous consolidated fiscal year. This was mainly due to the JPY8.4 billion
increase in cash and deposits, the JPY25.0 billion increase in trade notes and accounts receivable, and the JPY2.4 billion
increase in inventory assets, being offset by the JPY30.0 billion decrease in marketable securities, the JPY3.5 billion
decrease in investable securities, and the JPY2.2 billion decrease in long-term loans.
Total liabilities fell to JPY400.0 billion, a decrease of JPY20.9 billion as compared to the end of the previous consolidated
fiscal year. This was mainly due to the JPY15.4 billion decrease in interest-bearing liabilities (interesting-bearing liabilities
as a ratio to total assets decreased by 1.9 points to 8.7%) and the JPY9.5 billion decrease in advance payments received
on contracts.
Net assets increased by JPY17.7 billion as compared to the end of the previous consolidated fiscal year to finish at
JPY382.8 billion. This was mainly due to the JPY25.8 billion increase in retained earnings, as well as the JPY5.1 billion
decrease in the foreign currency translation adjustment account and the JPY5.6 billion decrease in the adjusted cumulative
amount for employee retirement benefits.
As a result of the above, the shareholders’ equity ratio improved by 2.3 points from the end of the previous consolidated
fiscal year to finish at 48.1%.
(2) Cash Flow Conditions
The cash and cash equivalent balance at the end of the consolidated fiscal year under review stood at JPY68.6 billion, an
decrease of JPY21.7 billion as compared to the previous consolidated fiscal year.
The cash flow conditions in each area and the factors behind any changes are outlined below:

Consolidated Results for the Full Year Ended March 31, 2016
11
(Cash Flow from Operating Activities)
The increase in cash flow from operating activities was JPY18.3 billion (as compared to an increase in cash flow of JPY62.2
billion in the previous fiscal year). The main sources of cash flow were net income before taxes and other adjustments of
JPY47.2 billion, depreciation of JPY19.7 billion and the JPY2.8 billion increase in trade payables. The main reasons for
the cash outflow from operating activities were because of the JPY31.0 billion increase in trade receivables and the
JPY16.4 billion used for the payment of corporate and other taxes.
(Cash Flow from Investing Activities)
The decrease in cash flow as a result of investing activities was JPY15.4 billion (as compared to a decrease in cash flow
of JPY14.1 billion in the previous fiscal year). The main reason for the cash outflow was the JPY19.2 billion used to acquire
fixed assets.
(Cash Flow from Financing Activities)
The decrease in cash flow as a result of financing activities was JPY23.8 billion (as compared to a decrease in cash flow
of JPY36.9 billion in the previous fiscal year). The main reasons for the cash outflow were the JPY13.1 billion (net amount
with cash inflow of loans) used to repay loans and the JPY8.6 billion used to pay dividends.
Trends in the Group’s cash flow indices are provided below:
FY 2011 FY 2012 FY 2013 FY 2014 FY 2015
Shareholders’ equity ratio (%) 40.3 44.6 45.1 45.8 48.1
Shareholders’ equity ratio on a market price basis (%)
40.8 36.1 35.5 61.4 36.4
Redemption period (years) 4.1 37.0 1.7 1.3 3.7
Interest coverage ratio (multiples) 14.0 1.3 24.5 29.3 9.1
Shareholders’ equity ratio = shareholders’ equity / total assets
Shareholders’ equity ratio on market price basis = total market value of shares / total assets
Redemption period = outstanding interest-bearing debt / operating cash flow
Interest coverage ratio = operating cash flow / interest expense
3. Basic Policy on Earnings Appropriation and Dividend for the Consolidated Fiscal Year Under Review as well as the Fiscal Year Ending March 31, 2017
The Group’s basic stance on profit sharing is to pay a dividend amount commensurate to the income earned during the
period, and to keep that amount as high as possible. However, the decision on the actual amount of the dividend is made
after making considerations for the level of retained earnings necessary to ensure that the Group is able to sustain a stable
business model in the long term. In the current medium-term management plan, the Group has set a target of 30% for the
consolidated dividend payout ratio.
For the consolidated fiscal year under review, the Group is forecasting a dividend of JPY16 per share (inclusive of the
JPY7 per share interim dividend), an increase of JPY4 per share from the previous year.
For the fiscal year ending March 2017, the Group is forecasting a dividend of JPY14 per share.

Consolidated Results for the Full Year Ended March 31, 2016
12
II. Status of the Business Group The main business areas of the Group and the positioning of major Group companies in these areas are outlined below.
1. Machinery Components In the area of power transmission equipment, both Sumitomo Heavy Industries and Seisa Gear, Ltd. *1 are responsible for
the overall product manufacturing and distribution. The responsibility for global manufacturing and distribution of these
products falls to Sumitomo Machinery Corporation of America in North America; Sumitomo (SHI) Cyclo Drive Germany
GmbH and Hansen Industrial Transmissions NV in Europe; and Sumitomo (SHI) Cyclo Drive Asia Pacific Pte., Ltd. in
Southeast Asia. In China, Sumitomo Heavy Industries (Tangshan) Ltd. carries out manufacturing while Sumitomo (SHI)
Cyclo Drive China, Ltd. carries out manufacturing and is also responsible for the overall distribution of products in the
country. Product distribution in Japan is the responsibility of Sumitomo Heavy Industries PTC Sales Co., Ltd.
*1 Effective April 1, 2016, Seisa Gear, Ltd. has been renamed Sumitomo Heavy Industries Gearbox Co., Ltd.
2. Precision Machinery In the area of plastics machinery equipment, Sumitomo Heavy Industries, Ltd. is responsible for the overall manufacturing,
distribution, and after-sales service of the product line. Sumitomo (SHI) Demag Plastics Machinery North America, Inc. is
responsible for the overall distribution of the product line in the North American market, and Sumitomo (SHI) Demag
Plastics Machinery GmbH is responsible for manufacturing and distribution of the product line in Europe.
Sumitomo Heavy Industries, Ltd. is responsible for overall manufacturing and distribution of laser processing systems,
cryocoolers, precision positioning equipment, control system equipment, and defense equipment.
In the area of semiconductor production equipment, both Sumitomo Heavy Industries and Sumitomo Heavy Industries Ion
Technology Co., Ltd. are responsible for overall manufacturing and distribution.
Finally, Sumitomo Nacco Materials Handling Co., Ltd.*2 is responsible for the overall manufacturing and distribution of
forklift products.
*2 Effective April 1, 2016, Sumitomo Nacco Material Handling Co., Ltd. has been renamed Sumitomo Nacco Forklift Co.,
Ltd.
3. Construction Machinery In the area of hydraulic excavators and road construction machinery, Sumitomo (S.H.I.) Construction Machinery Co., Ltd.
is responsible for the manufacturing and distribution of products to overseas markets; Sumitomo (S.H.I.) Construction
Machinery (Tangshan) Co., Ltd. is responsible for the manufacturing of products in China; Sumiju SCE (Xiamen)
Construction Machinery Co., Ltd. is responsible for the distribution of products in China, PT. Sumitomo S.H.I. Construction
Machinery Indonesia is responsible for the manufacturing of products in Indonesia; and Sumitomo (S.H.I.) Construction
Machinery Sales Co., Ltd. is responsible for the distribution of products in Japan.
In the area of mobile cranes, Hitachi Sumitomo Heavy Industries Construction Crane Co., Ltd. is responsible for overall
development, distribution, and manufacturing of products for the Japanese market, while Link-Belt Construction Equipment
Company, L.P., LLLP mainly oversees the overall manufacturing and sales of products for the North American market.
4. Industrial Machinery Sumitomo Heavy Industries is responsible for the overall manufacturing and distribution of accelerators, LCD display
production equipment, and forging machines.
Sumitomo Heavy Industries Material Handling Systems Co., Ltd. is responsible for overall manufacturing and distribution
of material handling systems, logistics and handling systems, and automated parking systems.
Shin Nippon Machinery Co., Ltd. is responsible for the overall manufacturing and distribution of industrial turbines and
pumps.

Consolidated Results for the Full Year Ended March 31, 2016
13
5. Ships In this segment, shipbuilding is carried out by Sumitomo Heavy Industries Marine & Engineering Co., Ltd., while Sumitomo
Heavy Industries is responsible for the distribution of the finished product.
6. Environmental Facilities & Plants In the areas of boiler systems, industrial waste treatment systems, pulp and paper machinery, and air pollution prevention
equipment, both Sumitomo Heavy Industries and Nihon Spindle Manufacturing Co., Ltd. are responsible for overall
manufacturing and distribution.
Sumitomo Heavy Industries Environment Co., Ltd. is responsible for the overall manufacturing and distribution of water
treatment systems.
Further, the manufacturing and distribution of reactor vessels is handled by Sumitomo Heavy Industries and Sumitomo
Heavy Industries Process Equipment Co., Ltd.
Finally, Izumi Food Machinery Co., Ltd. is responsible for the overall manufacturing and distribution of food machinery.

Consolidated Results for the Full Year Ended March 31, 2016
14
III. Management Policies
1. Basic Management Policy The Group is guided by the Sumitomo Business Spirit. The two components of the philosophy, namely “the placing of
prime importance on conducting business with integrity and sound management” and “not pursuing easy gains or acting
imprudently under any circumstances”, form the basis of the Group’s vision in any environment, regardless of the era or
the state of the economy. The Group rigorously complies with the spirit of the philosophy, and actively pursues structural
reforms to its business organization to ensure that it is able to build a strong corporate culture.
The Group also believes that by focusing on creating customer value, and thereby earning customers’ long-term trust, it
can achieve sustainable growth and increase overall corporate value. Further, succeeding in this task will also lead to the
Group meeting its corporate citizenship responsibilities to its shareholders, employees, and surrounding communities.
To ensure a highly stable growth trajectory on the global stage, the Group is committed to becoming a “Systematic
Knowledge-Creating Company” that is able to sustainably supply customers with first-class products. Moreover, the Group
is actively strengthening its functional efficiencies in the areas of marketing, development, and production in pursuit of the
ultimate level of workmanship.
2. Medium- to Long-Term Management Strategy, Target Management Benchmarks and Action Items for the Group
In Japan, the murky outlook for the global economy and financial situation is now being reflected in the yen strengthening
that has been seen in the market as well as the negative interest rate policy announced by the Bank of Japan. This has
resulted in a wait-and-see approach in the Japanese economy, slowing down any signs of positive growth. In addition,
although the employment situation is good, the lack of growth in real wages has led to stagnation in personal consumption
levels. Moreover, on the corporate side, stagnant personal consumption levels and exports has led to seesaw conditions
in both manufacturing and shipments, while the temporary jump in capital investment levels has now dissipated.
Overseas, although the North American market continues to move forward on a positive path, this is being offset by the
potential for a long-term slowdown of the Chinese economy and the stagnating effect that this has on other emerging
markets. This has resulted in a murky outlook for the global economy.
(1) “Medium-Term Management Plan 2016”
In the MTMP16 that was launched in the previous fiscal year, the Group established a target of JPY700.0 billion in sales,
and an operating profit margin of 7.5% by FY2016. ROIC continues to be the Group’s key performance indicator and the
plan calls for ROIC to remain greater than 7%.
In order to achieve these targets, the Group is aiming to become a first-class supplier of products. It will focus on achieving
steady growth to build a solid foundation that ensures a return to high levels of profitability.
Also, across the wide range of businesses that the Group operates in, the MTMP16 has specifically identified the healthcare
and energy-related sectors as areas of demand expansion and growth. With this in mind, the Group is looking to actively
develop and promote business activities targeting these segments of the economy.
Moreover, as the Group executes on the plan, it will continue to maintain fiscal discipline while targeting a dividend payout
ratio of 30% during the three-year implementation period of the plan.
(2) Key Areas of Focus for the Fiscal Year Ending March 31, 2017
During FY2016 which is the final implementation year of MTMP16, the Group will focus on the following activities:
(i) “Steady growth” to establish a foundation for sustainable growth
Although strategies will differ because of the external environment and business environment of each operation, focused
and timely investments will be made to optimize the Group’s overall operations with the aim to achieve steady growth. In
addition, the unique technologies developed for each product type will be refreshed, while at the same time, the
strengthening of product capabilities will be promoted through the use of common technologies in areas such as materials
and controls.

Consolidated Results for the Full Year Ended March 31, 2016
15
Innovation activities in the manufacturing area will also be promoted. For example, innovation activities will be pursued in
areas of production technologies such as bonding and processing, which form the foundations of the manufacturing
process, with the aim to achieve sustainable improvement and manufacturing breakthroughs. In addition, innovation
activities to strengthen engineering-related areas will also be pursued. At the Group-level, the Corporate Technology
Management Group will lead efforts to develop next-generation products with these technologies at its core, and the entire
group will promote activities that utilize ICT.
Moreover, the strengthening of the service-related businesses has been positioned as a common goal across the entire
Group as part of a broader strategy to form synergies across the various business units. More specifically, the office
network will be expanded, and areas such as marketing, human resources and informatization, which form the basis of the
service-related activities, will be strengthened. By doing so, innovation across the entire operations process can be
promoted and the business can subsequently grow.
(ii) “Return to higher levels of profitability”
As part of the Group’s portfolio management activities, the growth stage and external environment of each business unit
will be taken into account before clearly establishing target profitability levels and key priorities. With this understanding,
management resources can be re-distributed accordingly and the business can be restructured in an appropriate manner.
At the head office level, an external consulting firm will be employed to assist in ways in which the Group can reduce
indirect expenses.
Aggressive target levels will be set for the Group’s leading business segments such as Machinery Components and
Precision Machinery in order to drive high profitability levels. At the same time, baseline targets for all businesses,
segments, product types and regions will be established. Through this, the Group will aim to transform itself into a highly
profitable company with strong business units at its core.
(iii) “Persistent efforts for operational quality improvements”
(a) Improvements to Product Quality
The Group will implement a management style that puts quality first through such efforts as creating stronger cooperation
between the Head Office and the various businesses to ensure that every effort is being made to increase product quality.
(b) Thorough Implementation of Compliance Measures
The Group firmly believes that ensuring compliance across all of its business activities is one of the most, if not the most,
important responsibilities that it has. With this in mind various compliance-related training and education activities will be
carried out across the Group for all directors and employees to ensure that recognition of the importance of compliance
permeates.
(c) Safety-Related Activities
FY2016 marks the final year of implementing the second phase of the Group’s Basic Health and Safety Improvement Plan.
During this year, various activities to strengthen health and safety management functions, and promote the elimination of
occupational injuries as well as health monitoring will be carried out with the aim to achieve the objectives set forth in the
plan.
(3) Formulation of a New Medium-Term Management Plan
As mentioned before, FY2016 marks the final year of implementing the current medium-term management plan, “MTMP16”.
Due to various factors including the murky outlook of global economic conditions and financial situation, along with the
prospect of a long-term decline in the Chinese economy and the resultant stagnation of growth in emerging market
economies, it will be difficult for the Group to achieve the financial objectives set forth in the original plan. Despite these
difficult conditions, the Group is confident that is has made steady progress in achieving the key objectives of the plan
which is to achieve "steady growth”, “return to higher levels of profitability”, and make “persistent efforts for operational
quality improvements”.

Consolidated Results for the Full Year Ended March 31, 2016
16
After taking into consideration the results of the MTMP16 and the changing operating environment, the Group will develop
a new medium-term management plan and begin execution at the beginning of FY2017. Under the new management
philosophy, the Group will put customers first, tackle changing conditions, and continue to be a machinery manufacturer
that provides first-class products and services globally. By doing so, the Group will pursue its corporate mission of
contributing towards the development of society. In order to achieve this, the Group intends to steadily execute and promote
the above measures.

Consolidated Results for the Full Year Ended March 31, 2016
17
IV. Selection of Accounting Standards The Group plans to continue utilizing Japanese accounting standards for the foreseeable future. With regard to the use of
international accounting standards in the future, the Group will take into account the situation across various domestic and
international markets and take appropriate action if deemed necessary.

Consolidated Results for the Full Year Ended March 31, 2016
18
V. Consolidated Financial Statements
1. Consolidated Balance Sheets (Unit: million yen)
End of Full Year As of March 31, 2015
End of Full Year As of March 31, 2016
Amount Amount
Assets
Current assets
Cash and deposits 57,423 65,804
Notes and accounts receivable 194,916 219,929
Marketable securities 35,000 5,000
Products 67,920 70,356
Works in progress 54,762 56,777
Raw materials and stock 31,154 29,137
Deferred income taxes 17,176 15,405
Other 34,852 32,268
Allowance for doubtful accounts (1,202) (1,674)
Total current assets 492,000 493,002
Fixed assets
Tangible fixed assets
Buildings and structures 151,984 154,038
Accumulated depreciation (101,431) (103,701)
Buildings and structures (net) 50,553 50,338
Machinery and transportation tools 167,445 167,859
Accumulated depreciation (113,028) (115,732)
Machinery and transportation tools (net) 54,417 52,127
Land 108,749 108,285
Construction in progress 3,288 3,302
Other 42,346 46,363
Accumulated depreciation (31,053) (32,645)
Other (net) 11,294 13,717
Total tangible fixed assets 228,302 227,769
Intangible fixed assets
Other 9,333 11,219
Total intangible fixed assets 9,333 11,219
Investments and other assets
Investment securities 29,509 25,987
Long-term loans 8,340 6,170

Consolidated Results for the Full Year Ended March 31, 2016
19
End of Full Year As of March 31, 2015
End of Full Year As of March 31, 2016
Amount Amount
Deferred income taxes 9,607 13,153
Other 11,121 9,929
Allowance for doubtful accounts (2,184) (4,371)
Total investments and other assets 56,392 50,868
Total Fixed assets 294,027 289,857
Total assets 786,027 782,859
Consolidated Results for the Full Year Ended March 31, 2016
20
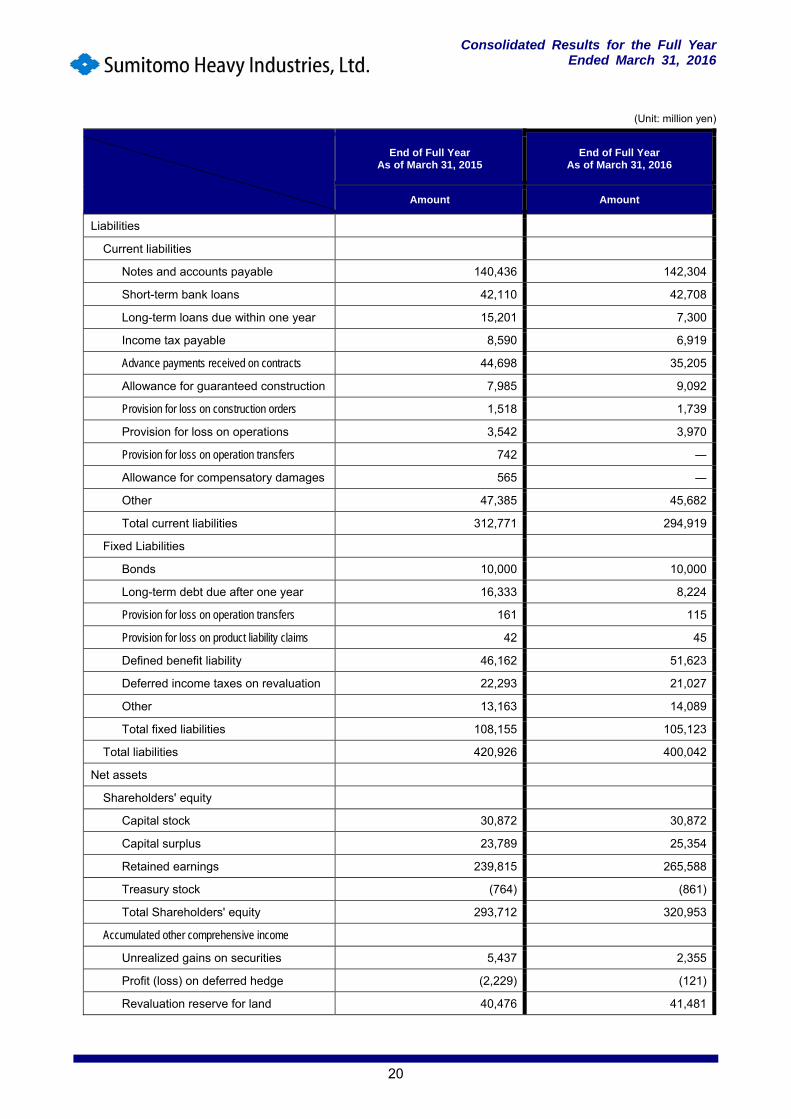
(Unit: million yen)
End of Full Year As of March 31, 2015
End of Full Year As of March 31, 2016
Amount Amount
Liabilities
Current liabilities
Notes and accounts payable 140,436 142,304
Short-term bank loans 42,110 42,708
Long-term loans due within one year 15,201 7,300
Income tax payable 8,590 6,919
Advance payments received on contracts 44,698 35,205
Allowance for guaranteed construction 7,985 9,092
Provision for loss on construction orders 1,518 1,739
Provision for loss on operations 3,542 3,970
Provision for loss on operation transfers 742 ―
Allowance for compensatory damages 565 ―
Other 47,385 45,682
Total current liabilities 312,771 294,919
Fixed Liabilities
Bonds 10,000 10,000
Long-term debt due after one year 16,333 8,224
Provision for loss on operation transfers 161 115
Provision for loss on product liability claims 42 45
Defined benefit liability 46,162 51,623
Deferred income taxes on revaluation 22,293 21,027
Other 13,163 14,089
Total fixed liabilities 108,155 105,123
Total liabilities 420,926 400,042
Net assets
Shareholders' equity
Capital stock 30,872 30,872
Capital surplus 23,789 25,354
Retained earnings 239,815 265,588
Treasury stock (764) (861)
Total Shareholders' equity 293,712 320,953
Accumulated other comprehensive income
Unrealized gains on securities 5,437 2,355
Profit (loss) on deferred hedge (2,229) (121)
Revaluation reserve for land 40,476 41,481

Consolidated Results for the Full Year Ended March 31, 2016
21
End of Full Year As of March 31, 2015
End of Full Year As of March 31, 2016
Amount Amount
Foreign currency translation adjustments 26,641 21,558
Re-measurement of defined benefit plans (3,957) (9,607)
Total accumulated other comprehensive income
66,367 55,667
Non-controlling interests 5,022 6,197
Total net assets 365,101 382,817
Total liabilities and net assets 786,027 782,859

Consolidated Results for the Full Year Ended March 31, 2016
22
2. Consolidated Income Statements and Consolidated Statement of Comprehensive Income
Consolidated Income Statements
(Unit: million yen)
Previous Full Year
April 1, 2014 to March 31, 2015
Current Full Year April 1, 2015 to March 31, 2016
Amount Amount
Net sales 667,099 700,838
Cost of sales 516,735 537,502
Gross income 150,364 163,337
Selling, general and administrative expenses 104,366 112,768
Operating income 45,998 50,568
Non-operating income
Interest income 473 544
Dividend income 986 1,114
Investment gain on equity method 1,549 2,083
Gain on foreign currency exchange 1,807 ―
Other 2,028 2,679
Total non-operating income 6,843 6,421
Non-operating expenses
Interest expenses 2,148 1,829
Loss on foreign currency exchange ― 509
Other 5,580 5,519
Total non-operating expenses 7,728 7,858
Ordinary income 45,113 49,131
Extraordinary losses
Compensation expenses 1,071 1,448
Loss on impaired assets 3,463 524
Business structure improvement costs 1,852 ―
Total extraordinary losses 6,386 1,972
Income before income taxes 38,727 47,159
Corporate income tax current 16,622 15,074
Corporate income tax deferred (2,235) 1,016
Total corporate income taxes 14,387 16,090
Net income 24,339 31,070
Net income (or loss) attributable to non-controlling interests
(9) (2,063)
Net income attributed to shareholders of the parent company
24,348 33,133

Consolidated Results for the Full Year Ended March 31, 2016
23
Consolidated Statement of Comprehensive Income
(Unit: million yen)
Previous Full Year
April 1, 2014 to March 31, 2015 Current Full Year
April 1, 2015 to March 31, 2016
Amount Amount
Net income 24,339 31,070
Other comprehensive income
Unrealized gains on securities 1,682 (3,078)
Profit (loss) on deferred hedge (1,886) 2,135
Revaluation reserve for land 2,275 1,174
Foreign currency translation adjustments 15,096 (5,211)
Adjustment to retirement benefits (1,628) (5,655)
Amount applied for equity method accounting of affiliates 44 (25)
Total other comprehensive income 15,582 (10,660)
Comprehensive income 39,922 20,410
(Breakdown)
Comprehensive income relating to shareholders of the parent company
39,483 22,601
Comprehensive income relating to non-controlling interests 438 (2,192)

Consolidated Results for the Full Year Ended March 31, 2016
24
3. Consolidated Statements of Changes to Stockholders' Equity Previous Full Year April 1, 2014 to March 31, 2015
(Unit: million yen)
Stockholders’ equity
Capital stock
Capital surplus
Retained earnings
Treasury stock
Total Stockholders'
equity
Balance at beginning of period 30,872 23,789 221,101 (632) 275,130
Cumulative effects of changes in accounting policies (1,475) (1,475)
Restated balance 30,872 23,789 219,626 (632) 273,655
Fluctuation in the period
Dividends (5,519) (5,519)
Net income attributed to shareholders of the parent company 24,348 24,348
Acquisition of treasury stock (135) (135)
Disposal of treasury stock 0 3 3
Difference from transfer of revaluation reserve for land 72 72Increase from addition of consolidated subsidiaries accompanying changes in scope of consolidation 1,287 1,287
Fluctuations other than stockholders' equity in the period (net)
Total fluctuation in the period ― ― 20,189 (132) 20,057
Balance at end of period 30,872 23,789 239,815 (764) 293,712
Accumulated other comprehensive income
No
n-c
on
tro
llin
g in
tere
sts
To
tal
ne
t as
sets
Un
real
ized
gai
ns
on
se
curi
tie
s
Pro
fit
(lo
ss)
on
def
erre
d
hed
ge
Rev
alu
ati
on
res
erve
fo
r la
nd
Fo
reig
n c
urr
en
cy
tran
sla
tio
n a
dju
stm
en
ts
Re-
mea
sure
me
nt
of
de
fin
ed
b
ene
fit
pla
ns
To
tal
accu
mu
late
d o
ther
co
mp
reh
en
sive
in
com
e
Balance at beginning of period 3,753 (379) 38,272 11,993 (2,336) 51,304 4,626 331,059Cumulative effects of changes in accounting policies (1,475)
Restated balance 3,753 (379) 38,272 11,993 (2,336) 51,304 4,626 329,584
Fluctuation in the period
Dividends (5,519)Net income attributed to shareholders of the parent company 24,348
Acquisition of treasury stock (135)
Disposal of treasury stock 3Difference from transfer of revaluation reserve for land 72
Increase from addition of consolidated subsidiaries accompanying changes in scope of consolidation
1,287
Fluctuations other than stockholders' equity in the period (net) 1,683 (1,850) 2,203 14,648 (1,621)
15,063 396 15,460
Total fluctuation in the period 1,683 (1,850) 2,203 14,648 (1,621) 15,063 396 35,516
Balance at end of period 5,437 (2,229) 40,476 26,641 (3,957) 66,367 5,022 365,101

Consolidated Results for the Full Year Ended March 31, 2016
25
Current Full Year April 1, 2015 to March 31, 2016
(Unit: million yen)
Stockholders’ equity
Capital stock
Capital surplus
Retained earnings
Treasury stock
Total Stockholders'
equity
Balance at beginning of period 30,872 23,789 239,815 (764) 293,712
Cumulative effects of changes in accounting policies
Restated balance 30,872 23,789 239,815 (764) 293,712
Fluctuation in the period
Dividends (8,582) (8,582)
Net income attributed to shareholders of the parent company 33,133 33,133
Acquisition of treasury stock (99) (99)
Disposal of treasury stock 0 1 2
Difference from transfer of revaluation reserve for land 169 169Increase from addition of consolidated subsidiaries accompanying changes in scope of consolidation 1,053 1,053
Changes to parent company equity due to transactions with non-controlling shareholders 1,565 1,565
Fluctuations other than stockholders' equity in the period (net)
Total fluctuation in the period ― 1,565 25,773 (98) 27,241
Balance at end of period 30,872 25,354 265,588 (861) 320,953
Accumulated other comprehensive income
No
n-c
on
tro
llin
g in
tere
sts
To
tal
ne
t as
sets
Un
real
ized
gai
ns
on
se
curi
tie
s
Pro
fit
(lo
ss)
on
def
erre
d
hed
ge
Rev
alu
ati
on
res
erve
fo
r la
nd
Fo
reig
n c
urr
en
cy
tran
sla
tio
n a
dju
stm
en
ts
Re-
mea
sure
me
nt
of
def
ined
ben
efi
t p
lan
s
To
tal
accu
mu
late
d o
ther
co
mp
reh
en
sive
in
com
e
Balance at beginning of period 5,437 (2,229) 40,476 26,641 (3,957) 66,367 5,022 365,101Cumulative effects of changes in accounting policies
Restated balance 5,437 (2,229) 40,476 26,641 (3,957) 66,367 5,022 365,101
Fluctuation in the period
Dividends (8,582)Net income attributed to shareholders of the parent company 33,133
Acquisition of treasury stock (99)
Disposal of treasury stock 2Difference from transfer of revaluation reserve for land 169
Increase from addition of consolidated subsidiaries accompanying changes in scope of consolidation
1,053
Changes to parent company equity due to transactions with non-controlling shareholders
1,565
Fluctuations other than stockholders' equity in the period (net) (3,081) 2,108 1,005 (5,083) (5,649) (10,700) 1,175 (9,525)
Total fluctuation in the period (3,081) 2,108 1,005 (5,083) (5,649) (10,700) 1,175 17,716
Balance at end of period 2,355 (121) 41,481 21,558 (9,607) 55,667 6,197 382,817

Consolidated Results for the Full Year Ended March 31, 2016
26
4. Consolidated Cash Flows Statement (Unit: million yen)
Previous Full Year
April 1, 2014 to March 31, 2015
Current Full Year
April 1, 2015 to March 31, 2016
Cash flows from operating activities
Income before income taxes 38,727 47,159
Depreciation 16,281 19,720
Compensation expenses 1,071 1,448
Loss on impaired assets 3,463 524
Business structure improvement costs 1,852 ―
Interest and dividend income (1,459) (1,658)
Interest expenses 2,148 1,829
Increase (decrease) in reserve amount 3,075 3,227
(Increase) decrease in notes and accounts receivable 6,458 (30,952)
(Increase) decrease in inventories (4,526) (6,452)
Increase (decrease) in notes and accounts payable 9,750 2,818
Other 1,984 (3,769)
Subtotal 78,825 33,895
Interest and dividends received 1,791 2,791
Interest expenses (2,121) (2,019)
Payments for income taxes (16,324) (16,353)
Net cash provided by operating activities 62,170 18,315
Cash flows from investing activities
Cash outflow due to the acquisition of tangible and intangible fixed assets (17,349) (19,180)
Cash flow from the sale of tangible and intangible fixed assets 1,420 1,661
Proceeds from sale of securities 841 840
(Increase) decrease in short-term loans 1,297 23
Payments of loans receivable (1,388) (7)
Cash flow from loan recoveries 1,779 2,142
Other (710) (830)
Net cash used in investing activities (14,112) (15,350)
Cash flows from financing activities
Net increase (decrease) in short-term loans (15,432) 2,550
Proceeds from long-term debt 4,771 2,300
Repayments for long-term debt (18,859) (17,995)
Cash flow from the issuance of corporate bonds 10,000 ―
Cash outflow due to the repayment of corporate bonds (10,000) ―
Cash dividends paid (5,533) (8,581)
Payment of dividends to non-controlling stockholders (42) (61)
Other (1,793) (2,002)
Net cash used in financing activities (36,889) (23,789)
Effect of exchange rate changes on cash and cash equivalents 2,812 (1,606)
Net increase (decrease) in cash and cash equivalents 13,980 (22,430)

Consolidated Results for the Full Year Ended March 31, 2016
27
Previous Full Year
April 1, 2014 to March 31, 2015
Current Full Year
April 1, 2015 to March 31, 2016
Cash and cash equivalents at beginning of year 76,418 90,324
Increase due to new consolidated companies 46 731
Decrease in cash and cash equivalents due to the exclusion of consolidated subsidiaries (120) ―
Cash and cash equivalents at end of year 90,324 68,625

Consolidated Results for the Full Year Ended March 31, 2016
28
5. Items of Special Note Concerning the Consolidated Financial Statements (Significant Events or Conditions that Question the Premise of a Going Concern)
There are no applicable items.
(Changes to Accounting Policies)
The “Revised Accounting Standards for Business Combination” (Accounting Standards Board of Japan (ASBJ) Accounting
Standard – ASBJ Statement No. 21 dated September 13, 2013; hereinafter referred to as the “Revised Business
Combination Accounting Standards”), the “Revised Accounting Standard for Consolidated Financial Statements”
(Accounting Standards Board of Japan (ASBJ) Accounting Standard – ASBJ Statement No. 22 dated September 13, 2013;
hereinafter referred to as the “Revised Consolidated Financial Statements Accounting Standards"), and the “Revised
Accounting Standards for Business Divestitures” (Accounting Standards Board of Japan (ASBJ) Accounting Standard –
ASBJ Statement No. 7 dated September 13, 2013; hereinafter referred to as the “Revised Business Divestitures Accounting
Standards") have been adopted from the current consolidated fiscal year under review. Where control of certain
subsidiaries continues under the new accounting standards, the differential change in equity of the Group is reported as
additional paid-in capital. In addition, a change was made to account for acquisition-related costs as an expense item in
the consolidated fiscal year where such costs are incurred.
Further, with regard to business combinations executed after the beginning of the current consolidated fiscal year under
review, the allocated acquisition cost resulting from the provisional accounting of the item will now be reflected in the
quarterly consolidated financial report for the quarter in which the business integration is completed. Moreover, the way in
which quarterly net income is denoted has been changed, and the term minority interest has been changed to non-
controlling interests. In order to reflect such changes, the quarterly consolidated financial statements and the full
consolidated year financial statements for the previous consolidated fiscal year have been reclassified.
The implementation of the Revised Business Combination Accounting Standards has been carried out in accordance with
Article 58-2(4) of the Revised Business Combination Accounting Standards, Article 44-5(4) of the Revised Consolidated
Financial Statements Accounting Standards, and Article 57-4(4) of the Revised Business Divestitures Accounting
Standards which allow for transitional treatment. The new standards have been adopted since the beginning of the current
consolidated fiscal year under review.
As a result of the above, operating income and ordinary income has reduced by JPY206 million respectively for the current
consolidated fiscal year under review. Net income before taxes and other adjustments also decreased by JPY1.771 million.
The additional paid-in capital amount at the end of the current consolidated fiscal year under review increased by JPY1.565
million.
With regard to the Consolidated Statement of Cash Flow for the current consolidated fiscal year under review, the cash
flow used to acquire shares of those subsidiaries that do not result in a change in the scope of consolidation is categorized
under “cash flows from financing activities”. In addition, the expenses generated from the acquisition of shares of those
subsidiaries that do not result in a change in the scope of consolidation are categorized under “cash flows from operating
activities”.
The fiscal year-end balance of additional paid-in capital under the Consolidated Statement of Changes in Net Assets for
the current consolidated fiscal year under review has increased by JPY1.565 million. The impact on a per-share basis is
shown on the appropriate sections of the table.

Consolidated Results for the Full Year Ended March 31, 2016
29
(Segment Information)
1. Summary of Reporting Segments
The Group’s reporting segments are based on those units within the Group where separate financial information is available
and where the Group’s Board of Directors periodically deliberates over such matters as the distribution of management
resources and the financial performance of such segments.
The Group formulates a comprehensive international and domestic strategy for individual products and services for the
head office and for each consolidated subsidiary, and executes such strategies at the operating level. Consequently, the
Group comprises segments that are split by categories of products and services offered by the head office and consolidated
subsidiaries. More specifically, the six reporting segments of the Group are “Machinery Components”, “Precision
Machinery”, “Construction Machinery”, “Industrial Machinery”, “Ships”, and “Environmental Facilities & Plants”.
Businesses Main Products
Machinery Components Power transmission and control equipment
Precision Machinery
Plastics machinery, film forming machines, semiconductor production equipment, laser processing systems, cryogenic equipment, precision positioning equipment, precision forgings, control components, defense equipment, machining tools
Construction Machinery Hydraulic excavators, mobile cranes, road machinery
Industrial Machinery Ion accelerators, medical machines and equipment, plasma coating systems for LCDs, forging press machines, material handling systems, logistics systems, automated parking systems, turbines, pumps
Ships Ships
Environmental Facilities & Plants
Private power generation facilities, boilers, industrial waste treatment facilities, air pollution control equipment, water and sewage treatment systems, process equipment, pressure vessels, mixing vessels, air-conditioning equipment, food processing machinery

Consolidated Results for the Full Year Ended March 31, 2016
30
2. Information Regarding Net Sales, Profits, Assets, Liabilities, and Other Items by Reporting Segment
Previous Full Year (April 1, 2014, to March 31, 2015) (Unit: million yen)
Segment Item
A B C D
E F Subtotal Other1
Total
G2 H
Net sales
(1) Sales to external customers
102,624 146,424 202,002 75,817 26,085 105,539 658,491 8,608 667,099 ― 667,099
(2) Internal sales between segments or exchanges
2,060 1,497 16 1,020 103 614 5,309 3,073 8,382 (8,382) ―
Total 104,683 147,921 202,018 76,836 26,188 106,153 663,800 11,681 675,481 (8,382) 667,099
Segment profit (loss)3 6,635 13,527 11,949 5,758 (1,249) 7,537 44,158 1,874 46,031 (34) 45,998
Segment assets 110,995 147,656 230,131 61,668 51,407 72,648 674,504 52,339 726,843 59,184 786,027
Other categories
Depreciation expense 4,320 3,219 6,655 859 289 672 16,015 266 16,281 ― 16,281
Increase in tangible and intangible assets 2,899 4,464 9,317 1,115 552 1,609 19,958 712 20,670 ― 20,670
Segments:
A: Machinery Components
B: Precision Machinery
C: Construction Machinery
D: Industrial Machinery
E: Ships
F: Environmental Facilities & Plants
G: Adjustments
H: Value included on the consolidated income statement
Notes:
1. “Other” represents businesses that are not included in the reporting segments. This includes the Group’s real-estate businesses, software-related business, and other businesses.
2. Mainly due to the deletion of intersegment transactions
3. Segment profit or loss have been adjusted as compared to the operating income recorded in the Consolidated Income Statement.

Consolidated Results for the Full Year Ended March 31, 2016
31
Current Full Year (April 1, 2015, to March 31, 2016) (Unit: million yen)
Segment Item
A B C D
E F Subtotal Other1
Total
G2 H
Net sales
(1) Sales to external customers
107,614 154,556 201,916 87,939 28,974 109,706 690,706 10,133 700,838 ― 700,838
(2) Internal sales between segments or exchanges
2,315 1,309 21 1,711 107 822 6,285 3,363 9,648 (9,648) ―
Total 109,929 155,865 201,937 89,650 29,081 110,528 696,990 13,496 710,486 (9,648) 700,838
Segment profit 8,929 18,718 4,409 9,977 967 5,787 48,788 1,843 50,631 (63) 50,568
Segment assets 109,506 154,722 222,088 82,027 52,988 67,688 688,999 61,204 750,203 32,743 782,946
Other categories
Depreciation expense 4,570 3,673 8,205 1,366 531 777 19,122 599 19,720 ― 19,720
Increase in tangible and intangible assets 4,267 5,387 8,814 1,616 1,248 1,412 22,744 976 23,721 ― 23,721
Segments:
A: Machinery Components
B: Precision Machinery
C: Construction Machinery
D: Industrial Machinery
E: Ships
F: Environmental Facilities & Plants
G: Adjustments
H: Value included on the consolidated income statement
Notes:
1. “Other” represents businesses that are not included in the reporting segments. This includes the Group’s real-estate businesses, software-related business, and other businesses.
2. Mainly due to the deletion of intersegment transactions
3. Segment profits have been adjusted as compared to the operating income recorded in the Consolidated Income Statement.

Consolidated Results for the Full Year Ended March 31, 2016
32
(Per Share Information)
Previous Full Year
April 1, 2014 to March 31, 2015
Current Full Year April 1, 2015 to March 31, 2016
Net assets per share 587.37 yen 614.51 yen
Net income per share 39.71 yen 54.51 yen
Notes:
1. The diluted net income per share is not listed because there are no dilutive shares.
2. As noted in the “Changes to Accounting Policies” section, the “Revised Accounting Standards for Business
Combinations has been adopted. As a result, the net asset per share has decreased by JPY0.34 and the net
income per share has decreased by JPY2.89 for the current consolidated fiscal year under review.
3. The basis for calculating the net income per share is outlined below:
Item Previous Full Year
April 1, 2014 to March 31, 2015
Current Full Year April 1, 2015 to March 31, 2016
Net income attributed to shareholders of the parent company
24,348 million yen 33,133 million yen
Value not attributable to common stockholders
― ―
Net income attributed to shareholders of the parent company’s holdings of common stock
24,348 million yen 33,133 million yen
Average number of outstanding shares for the term
613,122,000 shares 612,934,000 shares
(Subsequent Events of Significant Importance)
There are no applicable items.

Consolidated Results for the Full Year Ended March 31, 2016
33
VI. Supplemental Information Orders Received, Sales, and Balance of Orders Received, by Segment (1) Orders Received
(Unit: million yen)
Segment
April 1, 2014 to March 31, 2015
April 1, 2015 to March 31, 2016
Y/Y Change
Amount % Amount % Amount %
Machinery Components 104,690 14.1 105,047 15.3 357 0.3
Precision Machinery 154,625 20.9 154,571 22.5 (54) (0.0)
Construction Machinery 206,461 27.9 197,060 28.7 (9,401) (4.6)
Industrial Machinery 89,623 12.1 92,591 13.5 2,968 3.3
Ships 61,923 8.3 22,500 3.3 (39,423) (63.7)
Environmental Facilities & Plants 113,406 15.3 106,089 15.5 (7,317) (6.5)
Others 10,096 1.4 8,085 1.2 (2,010) (19.9)
Total 740,824 100.0 685,943 100.0 (54,881) (7.4)
(2) Sales (Unit: million yen)
Segment
April 1, 2014 to March 31, 2015
April 1, 2015 to March 31, 2016
Y/Y Change
Amount % Amount % Amount %
Machinery Components 102,624 15.4 107,614 15.4 4,991 4.9
Precision Machinery 146,424 21.9 154,556 22.1 8,132 5.6
Construction Machinery 202,002 30.3 201,916 28.8 (86) (0.0)
Industrial Machinery 75,817 11.4 87,939 12.5 12,122 16.0
Ships 26,085 3.9 28,974 4.1 2,889 11.1
Environmental Facilities & Plants 105,539 15.8 109,706 15.7 4,168 3.9
Others 8,608 1.3 10,133 1.4 1,525 17.7
Total 667,099 100.0 700,838 100.0 33,740 5.1
(3) Balance of Orders Received
(Unit: million yen)
Segment
End of Full Year As of March 31, 2015
End of Full Year As of March 31, 2016
Y/Y Change
Amount % Amount % Amount %
Machinery Components 30,734 7.8 28,167 7.5 (2,568) (8.4)
Precision Machinery 47,404 12.1 47,419 12.6 15 0.0
Construction Machinery 33,712 8.6 28,856 7.6 (4,857) (14.4)
Industrial Machinery 98,078 25.0 102,730 27.2 4,652 4.7
Ships 65,185 16.6 58,711 15.5 (6,474) (9.9)
Environmental Facilities & Plants 113,542 28.9 109,925 29.1 (3,617) (3.2)
Others 3,987 1.0 1,939 0.5 (2,047) (51.4)
Total 392,643 100.0 377,747 100.0 (14,895) (3.8)