sugar sweetened beverage tax 10 leading causes of mortality: philippines, 2014 source: department of...
TRANSCRIPT

DRAFT FOR DISCUSSION. SUBJECT TO CHANGE.
Tax Reform for Acceleration and Inclusion
Package 1 – Sugar sweetened beverage tax
As of August 30, 2017 4:54 PM
DRAFT FOR DISCUSSION. SUBJECT TO CHANGE.
Table of contents1. Key messages and highlights
2. Obesity
3. Diabetes
4. Sugar consumption
5. SSB consumption
6. SSB tax and better health
7. The reform: SSB tax
8. Arguments to tax certain products; Tax options
9. Economic impact
10. Overall impact on the people
11. Cross-country experience
12. Data on sugars and HFCS
13. Revenue estimates and methodology
14. Responding to critiques
15. SSB products and price impact
16. Summary price impact
17. Non-tax measures
8/30/2017 DEPARTMENT OF FINANCE 2

DRAFT FOR DISCUSSION. SUBJECT TO CHANGE.
Key messages and highlights
8/30/2017 DEPARTMENT OF FINANCE 3
DRAFT FOR DISCUSSION. SUBJECT TO CHANGE.
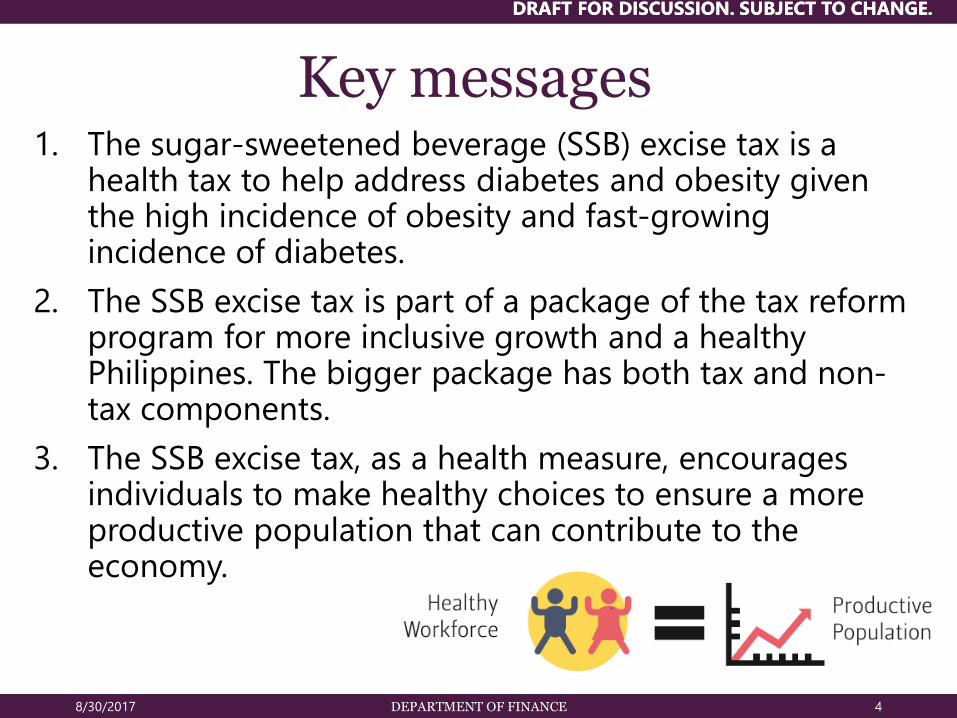
Key messages1. The sugar-sweetened beverage (SSB) excise tax is a
health tax to help address diabetes and obesity given the high incidence of obesity and fast-growing incidence of diabetes.
2. The SSB excise tax is part of a package of the tax reform program for more inclusive growth and a healthy Philippines. The bigger package has both tax and non-tax components.
3. The SSB excise tax, as a health measure, encourages individuals to make healthy choices to ensure a more productive population that can contribute to the economy.
8/30/2017 DEPARTMENT OF FINANCE 4
DRAFT FOR DISCUSSION. SUBJECT TO CHANGE.

DRAFT FOR DISCUSSION. SUBJECT TO CHANGE.
Key messages3. Why an SSB excise tax?
o Discourage consumption.
o Encourage consumption of healthier products.
o Raise public awareness of harms.
o Incentive for industry to develop healthier products.
o Raise revenues for health and education.
o Note that the regressivity argument is not valid for a non-essential or non-good.
4. Why tax SSB and not sugar broadly?
o Unnecessary: it has empty calories and little or no nutritional value, they do not replace rice or food, and we do not tell our children to drink them every day because they are healthy.
o Affordable: especially to the poor and youth, and sometimes cheaper than water
o Accessible: available in almost every corner, often not aware of the consequences. This is why SSB tax is a public policy.
8/30/2017 DEPARTMENT OF FINANCE 5

DRAFT FOR DISCUSSION. SUBJECT TO CHANGE.
Obesity
8/30/2017 DEPARTMENT OF FINANCE 6

DRAFT FOR DISCUSSION. SUBJECT TO CHANGE.
8/30/2017 DEPARTMENT OF FINANCE 7
Article published by BusinessMirror Health & Fitness July 20-26, 2017

DRAFT FOR DISCUSSION. SUBJECT TO CHANGE.
8/30/2017 DEPARTMENT OF FINANCE 8

DRAFT FOR DISCUSSION. SUBJECT TO CHANGE.
8/30/2017 DEPARTMENT OF FINANCE 9
DRAFT FOR DISCUSSION. SUBJECT TO CHANGE.
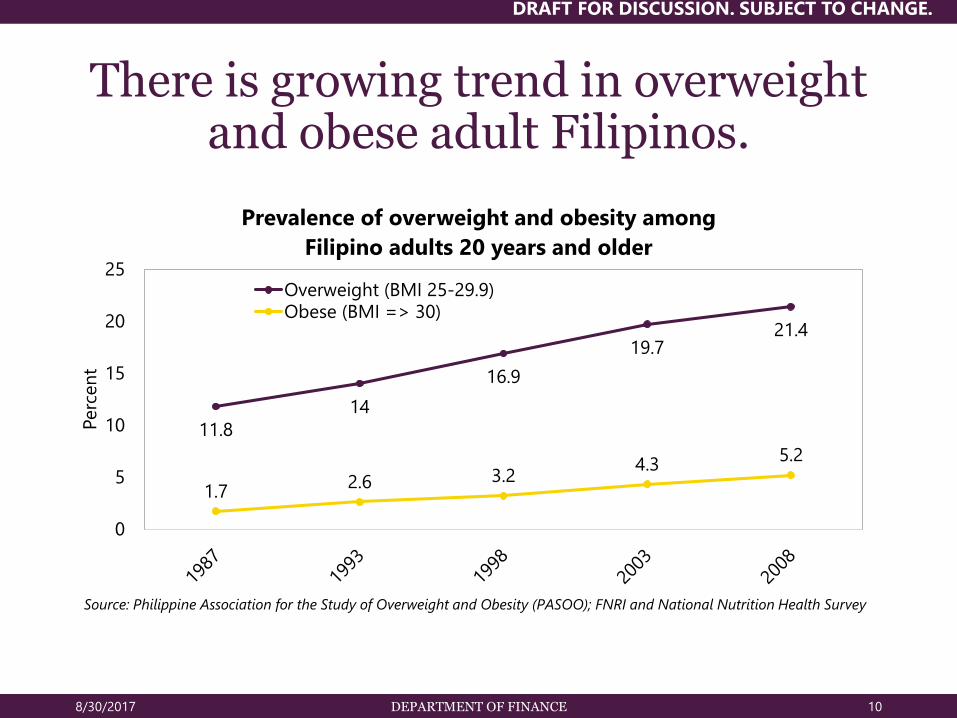
There is growing trend in overweight and obese adult Filipinos.
8/30/2017 DEPARTMENT OF FINANCE 10
11.8
14
16.9
19.721.4
1.72.6 3.2
4.35.2
0
5
10
15
20
25
Perc
en
t
Prevalence of overweight and obesity among
Filipino adults 20 years and older
Overweight (BMI 25-29.9)Obese (BMI => 30)
Source: Philippine Association for the Study of Overweight and Obesity (PASOO); FNRI and National Nutrition Health Survey

DRAFT FOR DISCUSSION. SUBJECT TO CHANGE.
The prevalence of malnutrition is inversely related to wealth, while the prevalence of overweightness and
obesity is positively related to wealth.
Wealth and residence breakdown of adult obesity
and chronic energy deficiency incidence
8/30/2017 DEPARTMENT OF FINANCE 11
Source: 8th NNS
DRAFT FOR DISCUSSION. SUBJECT TO CHANGE.
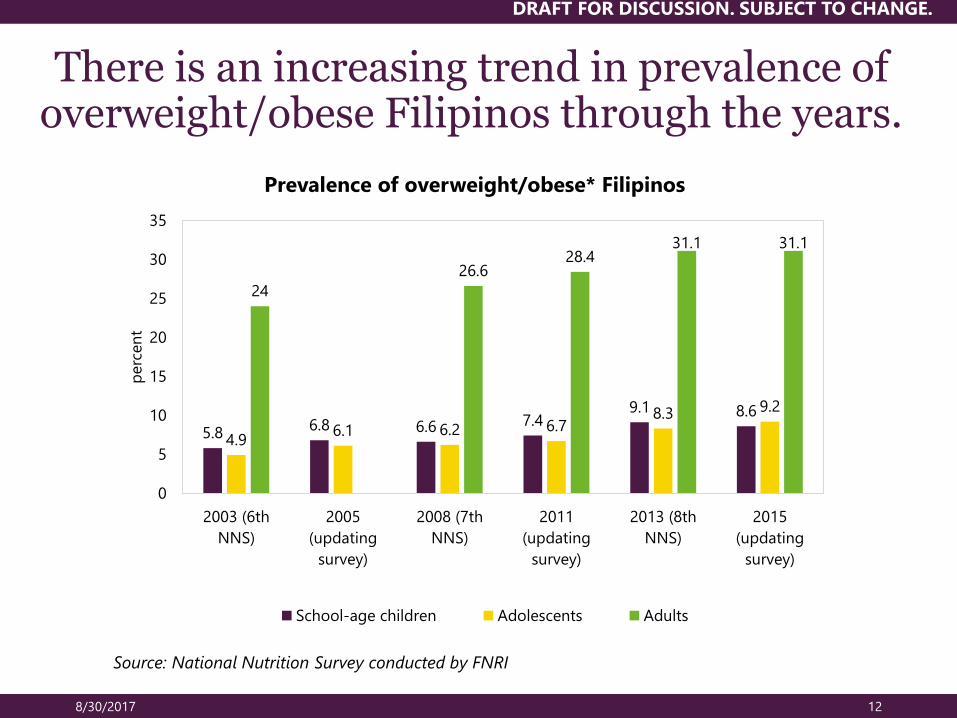
There is an increasing trend in prevalence of overweight/obese Filipinos through the years.
8/30/2017 12
5.86.8 6.6 7.4
9.1 8.6
4.96.1 6.2 6.7
8.3 9.2
24
26.628.4
31.1 31.1
0
5
10
15
20
25
30
35
2003 (6th
NNS)
2005
(updating
survey)
2008 (7th
NNS)
2011
(updating
survey)
2013 (8th
NNS)
2015
(updating
survey)
perc
en
t
Prevalence of overweight/obese* Filipinos
School-age children Adolescents Adults
Source: National Nutrition Survey conducted by FNRI
DRAFT FOR DISCUSSION. SUBJECT TO CHANGE.
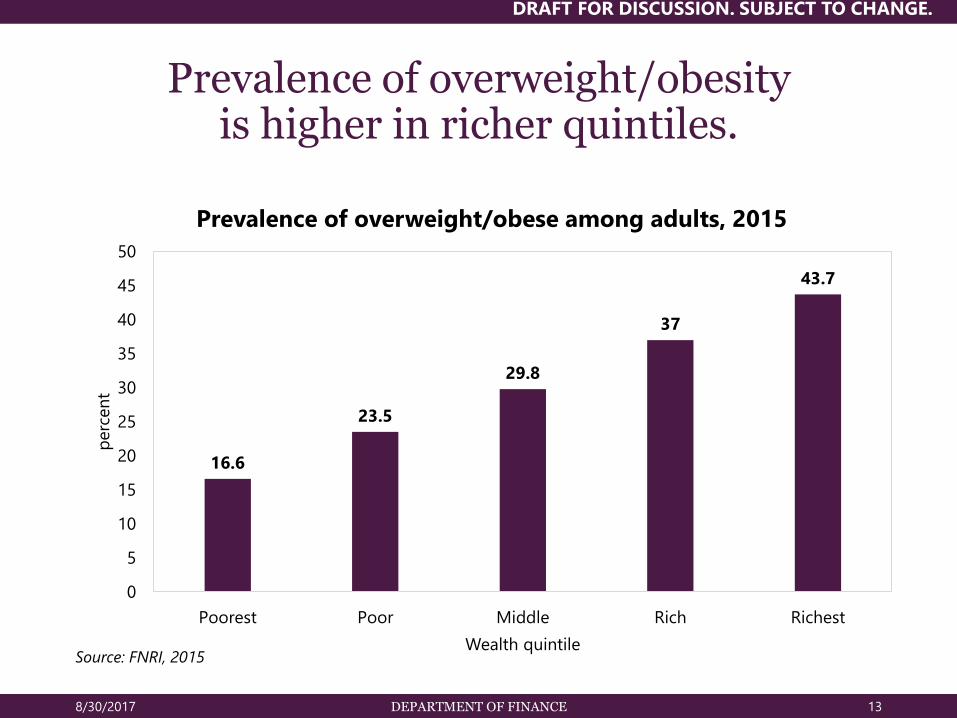
Prevalence of overweight/obesity is higher in richer quintiles.
8/30/2017 DEPARTMENT OF FINANCE 13
16.6
23.5
29.8
37
43.7
0
5
10
15
20
25
30
35
40
45
50
Poorest Poor Middle Rich Richest
perc
en
t
Wealth quintile
Prevalence of overweight/obese among adults, 2015
Source: FNRI, 2015

DRAFT FOR DISCUSSION. SUBJECT TO CHANGE.
8/30/2017 DEPARTMENT OF FINANCE 14
Individuals with body mass exceeding 25 are considered overweight/obese.
Classification BMI (in metric) BMI (in imperial)
Underweight < 18.50 < 3.79
Normal range 18.50 to 24.99 3.79 to 5.12
Overweight 25.00 to 29.99 5.13 to 6.14
Obese class I 30.00 to 34.99 6.15 to 7.16
Obese class II 35.00 to 39.99 7.17 to 8.18
Obese class III > 40.00 > 8.18
Based on WHO standards
DRAFT FOR DISCUSSION. SUBJECT TO CHANGE.
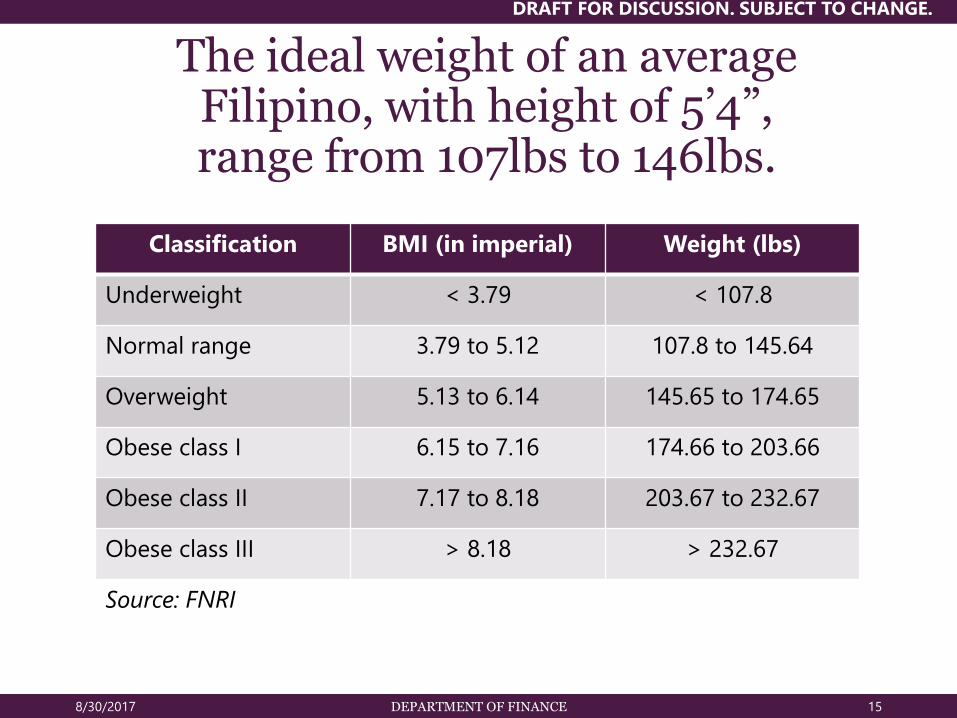
The ideal weight of an average Filipino, with height of 5’4”, range from 107lbs to 146lbs.
8/30/2017 DEPARTMENT OF FINANCE 15
Classification BMI (in imperial) Weight (lbs)
Underweight < 3.79 < 107.8
Normal range 3.79 to 5.12 107.8 to 145.64
Overweight 5.13 to 6.14 145.65 to 174.65
Obese class I 6.15 to 7.16 174.66 to 203.66
Obese class II 7.17 to 8.18 203.67 to 232.67
Obese class III > 8.18 > 232.67
Source: FNRI

DRAFT FOR DISCUSSION. SUBJECT TO CHANGE.
The ideal weight of an average Filipina with height 5’0”, range
from 95lbs to 128 lbs.
8/30/2017 DEPARTMENT OF FINANCE 16
Classification BMI (in imperial) Weight (lbs)
Underweight < 3.79 < 94.75
Normal range 3.79 to 5.12 94.75 to 128
Overweight 5.13 to 6.14 128.1 to 153.5
Obese class I 6.15 to 7.16 153.6 to 179
Obese class II 7.17 to 8.18 179.1 to 204.5
Obese class III > 8.18 > 204.5
Source: FNRI
DRAFT FOR DISCUSSION. SUBJECT TO CHANGE.
Diabetes
8/30/2017 DEPARTMENT OF FINANCE 17

In 2015, there were around 3.6 million cases of diabetes in the Philippines*Source: International Diabetes Foundation

DRAFT FOR DISCUSSION. SUBJECT TO CHANGE.
8/30/2017 DEPARTMENT OF FINANCE 19
DRAFT FOR DISCUSSION. SUBJECT TO CHANGE.
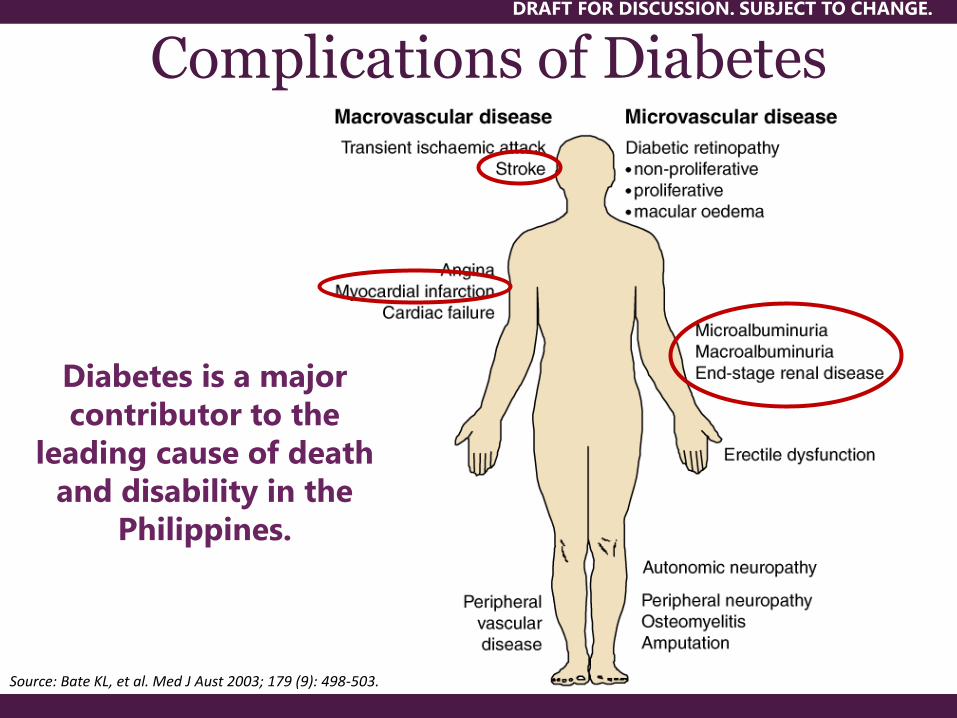
Complications of Diabetes
Source: Bate KL, et al. Med J Aust 2003; 179 (9): 498-503.
Diabetes is a major
contributor to the
leading cause of death
and disability in the
Philippines.

DRAFT FOR DISCUSSION. SUBJECT TO CHANGE.
Diabetes is a major contributor to the leading cause of death and disability in the Philippines.
8/30/2017 DEPARTMENT OF FINANCE 21
10
15
25
25
32
44
55
56
70
126
0 50 100 150
10. Certain conditions originating in the perinatal period
9. Nephritis, nephrotic syndrome and nephrosis
8. Tuberculosis, all forms
7. Chronic lower respiratory diseases
6. Diabetes mellitus
5. Accidents
4. Pneumonia
3. Malignant neoplasm
2. Diseases of the vascular system
1. Diseases of the heart
count in persons (in '000)
Top 10 leading causes of mortality: Philippines, 2014
Source: Department of Health

DRAFT FOR DISCUSSION. SUBJECT TO CHANGE.
Diabetes is a major contributor to the leading cause of death and disability in the Philippines.
8/30/2017 DEPARTMENT OF FINANCE 22
1.8
2.7
4.4
4.4
5.6
7.7
9.7
9.9
12.3
22.2
0 5 10 15 20 25
10. Certain conditions originating in the perinatal period
9. Nephritis, nephrotic syndrome and nephrosis
8. Tuberculosis, all forms
7. Chronic lower respiratory diseases
6. Diabetes mellitus
5. Accidents
4. Pneumonia
3. Malignant neoplasm
2. Diseases of the vascular system
1. Diseases of the heart
Percent distribution
Top 10 leading causes of death: Philippines, 2014
Source: Department of Health

DRAFT FOR DISCUSSION. SUBJECT TO CHANGE.
Diabetes is a major contributor to the leading cause of death and disability in the Philippines.
Cause Number Rate (per 100,000
population)
1. Diseases of the heart 125,906 126.1
2. Diseases of the vascular system 69,913 70
3. Malignant neoplasm 56,219 56.3
4. Pneumonia 54,877 54.9
5. Accidents 43,853 43.9
6. Diabetes mellitus 31,687 31.7
7. Chronic lower respiratory diseases 25,114 25.1
8. Tuberculosis, all forms 24,929 25
9. Nephritis, nephrotic syndrome and nephrosis 15,359 15.4
10. Certain conditions originating in the perinatal period 10,174 10.2
Source: Department of Health (2014)
8/30/2017 DEPARTMENT OF FINANCE 23
DRAFT FOR DISCUSSION. SUBJECT TO CHANGE.
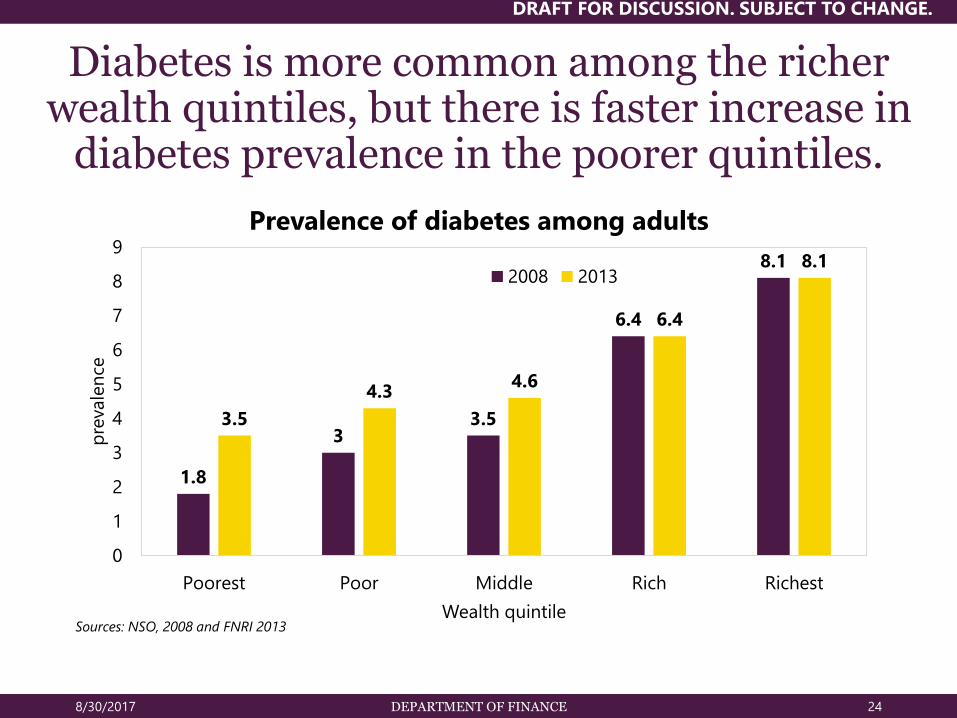
Diabetes is more common among the richer wealth quintiles, but there is faster increase in
diabetes prevalence in the poorer quintiles.
8/30/2017 DEPARTMENT OF FINANCE 24
1.8
33.5
6.4
8.1
3.5
4.34.6
6.4
8.1
0
1
2
3
4
5
6
7
8
9
Poorest Poor Middle Rich Richest
pre
vale
nce
Wealth quintile
Prevalence of diabetes among adults
2008 2013
Sources: NSO, 2008 and FNRI 2013

DRAFT FOR DISCUSSION. SUBJECT TO CHANGE.
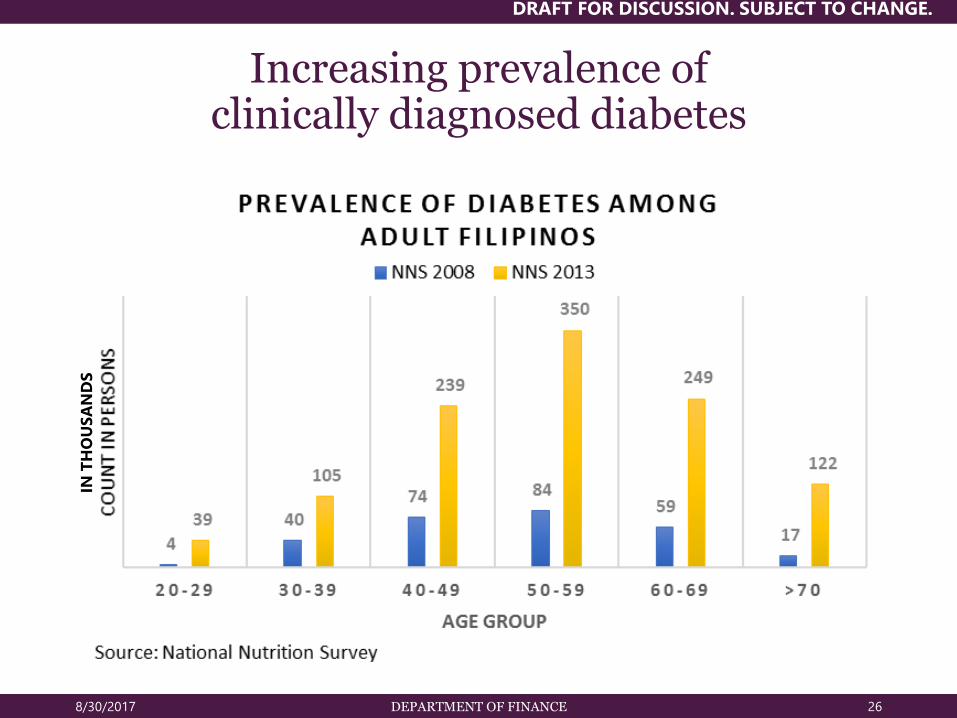
Increasing prevalence of clinically diagnosed diabetes
8/30/2017 25
Source: National Nutrition Survey conducted by FNRI
DRAFT FOR DISCUSSION. SUBJECT TO CHANGE.
8/30/2017 DEPARTMENT OF FINANCE 26
Increasing prevalence of clinically diagnosed diabetes
IN T
HO
US
AN
DS

DRAFT FOR DISCUSSION. SUBJECT TO CHANGE.
Prevalence of diabetes, by income class
8/30/2017 DEPARTMENT OF FINANCE 27
3.44
4.4
6
7.7
0
1
2
3
4
5
6
7
8
9
Per
cen
t
Household income class
Prevalence of diabetes, 2013
Source: FNRI

DRAFT FOR DISCUSSION. SUBJECT TO CHANGE.
Prevalence of diabetes, by location
8/30/2017 DEPARTMENT OF FINANCE 28
4.3
6
0
1
2
3
4
5
6
7
Per
cen
t
Location
Prevalence of diabetes, 2013
Source: FNRI
DRAFT FOR DISCUSSION. SUBJECT TO CHANGE.
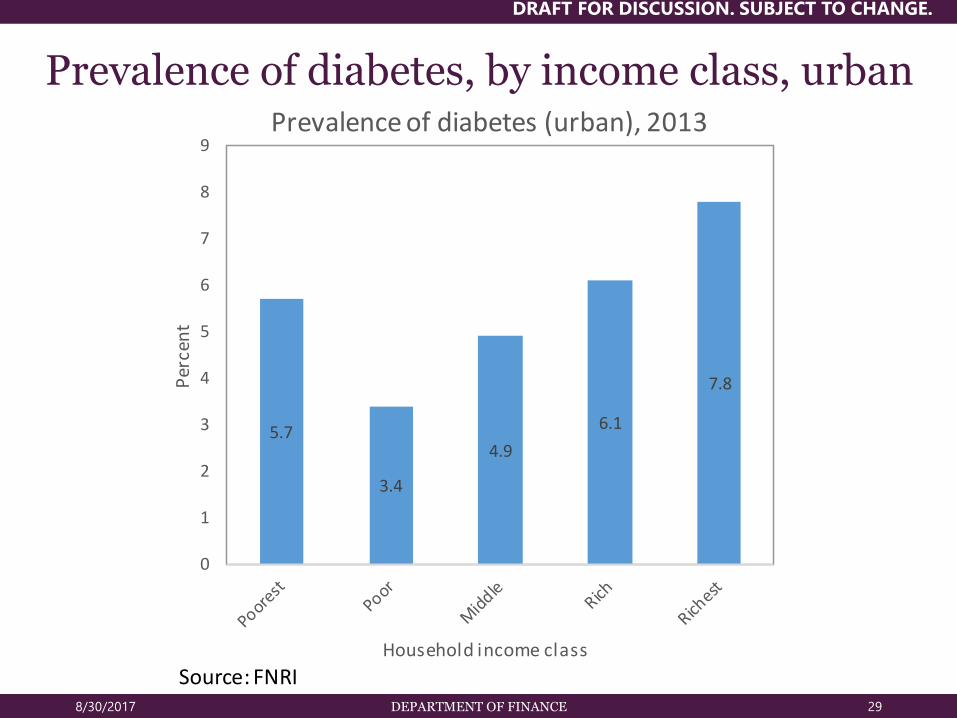
Prevalence of diabetes, by income class, urban
8/30/2017 DEPARTMENT OF FINANCE 29
5.7
3.4
4.9
6.1
7.8
0
1
2
3
4
5
6
7
8
9
Per
cen
t
Household income class
Prevalence of diabetes (urban), 2013
Source: FNRI

DRAFT FOR DISCUSSION. SUBJECT TO CHANGE.
Prevalence of diabetes, by income class, rural
8/30/2017 DEPARTMENT OF FINANCE 30
2.6
4.43.8
5.9
7.4
0
1
2
3
4
5
6
7
8
Per
cen
t
Household income class
Prevalence of diabetes (rural), 2013
Source: FNRI

DRAFT FOR DISCUSSION. SUBJECT TO CHANGE.
Sugar consumption
8/30/2017 DEPARTMENT OF FINANCE 31

DRAFT FOR DISCUSSION. SUBJECT TO CHANGE.
8/30/2017 DEPARTMENT OF FINANCE 33
866 grams

DRAFT FOR DISCUSSION. SUBJECT TO CHANGE.
8/30/2017 DEPARTMENT OF FINANCE 34
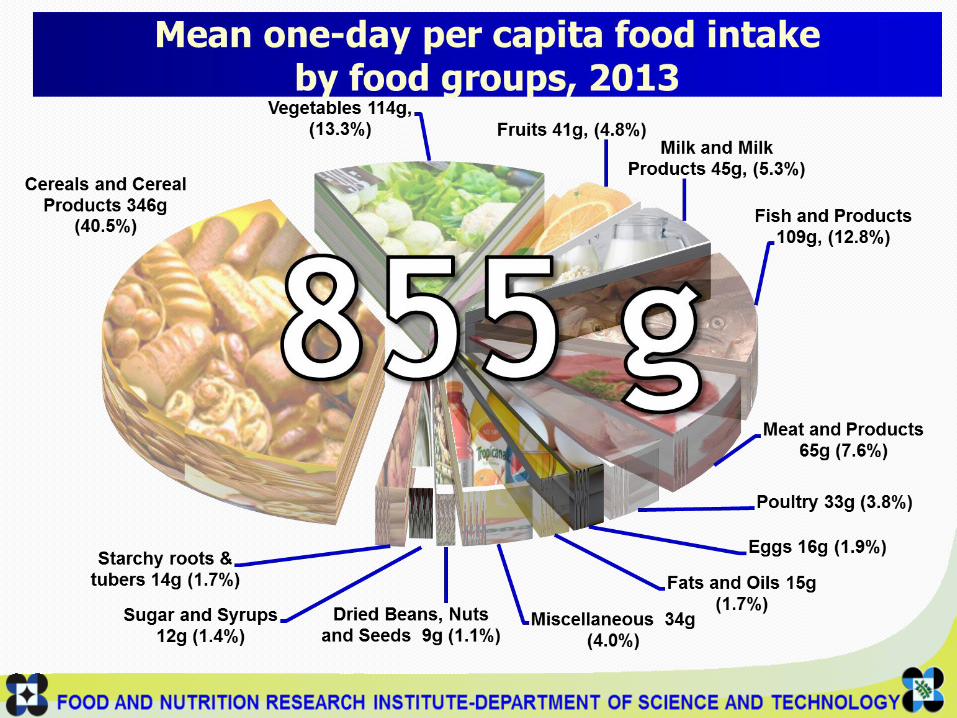
855 grams
Source: FNRI

DRAFT FOR DISCUSSION. SUBJECT TO CHANGE.
Products in “miscellaneous" food group include beverages,
condiments and others.
8/30/2017 DEPARTMENT OF FINANCE 35
Source: FNRI, Philippine figures: Facts and Nutrition
DRAFT FOR DISCUSSION. SUBJECT TO CHANGE.
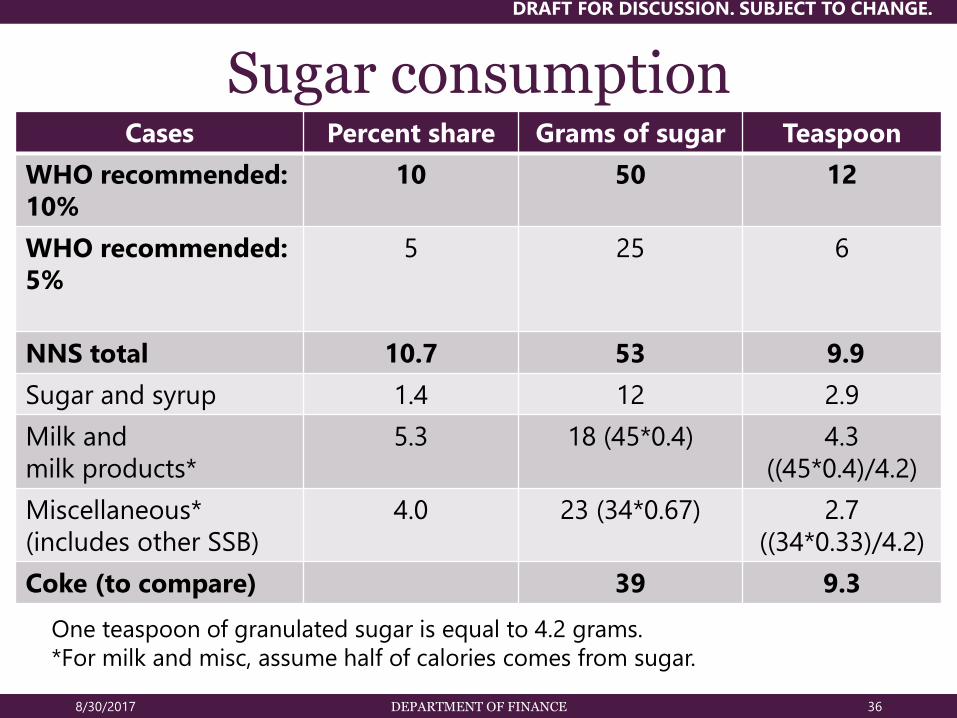
Sugar consumption
8/30/2017 DEPARTMENT OF FINANCE 36
Cases Percent share Grams of sugar Teaspoon
WHO recommended:
10%
10 50 12
WHO recommended:
5%
5 25 6
NNS total 10.7 53 9.9
Sugar and syrup 1.4 12 2.9
Milk and
milk products*
5.3 18 (45*0.4) 4.3
((45*0.4)/4.2)
Miscellaneous*
(includes other SSB)
4.0 23 (34*0.67) 2.7
((34*0.33)/4.2)
Coke (to compare) 39 9.3
One teaspoon of granulated sugar is equal to 4.2 grams.
*For milk and misc, assume half of calories comes from sugar.

DRAFT FOR DISCUSSION. SUBJECT TO CHANGE.

DRAFT FOR DISCUSSION. SUBJECT TO CHANGE.
SSB consumption
8/30/2017 DEPARTMENT OF FINANCE 38

DRAFT FOR DISCUSSION. SUBJECT TO CHANGE.
What are sugar sweetened beverages (SSBs)?
• SSBs are pre-packed drinks with free/added sugar.o Free sugars are monosaccharides and disaccharides
that are added to foods and beverages by the manufacturer, cook, or consumer, and sugars that are naturally present in honey, syrups, fruit juices, and fruit concentrates.
• One gram of sugar has 3.9 calories.
• One teaspoon of granulated sugar is equal to 4.2 grams.
8/30/2017 DEPARTMENT OF FINANCE 39

DRAFT FOR DISCUSSION. SUBJECT TO CHANGE.
Trends in SSB consumption
• Philippines ranked 11th worldwide in the consumption of soft drinks. In 2009, Filipinos consumed around 1.6 billion liters or an average of 17.8 liters per capita. (World Health Organization).
• FNRI list of most consumed products with sugar: 3-in-1 coffee, sugar brown and white, powdered milk, pandesal bread, soft drink, and chocolate flavoured drinks .
8/30/2017 DEPARTMENT OF FINANCE 40

DRAFT FOR DISCUSSION. SUBJECT TO CHANGE.
Sugar consumption from SSBs has been increasing over the years. Highest
consumption is from the richest quintile.
8/30/2017 DEPARTMENT OF FINANCE 41
Income quintile 2003 2006 2009
Poorest 454 590 780
Poorer 1,037 1,247 1,521
Middle 1,755 1,970 2,256
Richer 2,734 2,847 3,177
Richest 4,873 4,929 5,179
National average 2,031 2,217 2,484
Sources: FIES and DOH staff estimatesNumbers are in grams per person per year calculated based on the PSA Family Income and Expenditure Surveys.

DRAFT FOR DISCUSSION. SUBJECT TO CHANGE.
The top 3 deciles consume more than 50 percent of total SSBs in the Philippines
8/30/2017 DEPARTMENT OF FINANCE 42

DRAFT FOR DISCUSSION. SUBJECT TO CHANGE.
The top 3 deciles consume more than 50 percent of total SSBs in the Philippines
8/30/2017 DEPARTMENT OF FINANCE 43

DRAFT FOR DISCUSSION. SUBJECT TO CHANGE.
The poor spend around 4 percent of their income on SSBs (unadjusted)
8/30/2017 DEPARTMENT OF FINANCE 44
Income
decile
Total income
(PHP)
Total
expenditure
(PHP)
SSB
expenditure
(PHP)
Share of SSB
exp. to
total income
(percent)
Share of SSB
exp. to total
exp. (percent)
1 55,489 56,976 2,299 4.1 4.0
2 87,841 85,781 3,711 4.2 4.3
3 111,800 104,970 4,864 4.4 4.6
4 135,731 124,655 5,859 4.3 4.7
5 163,435 147,290 6,779 4.1 4.6
6 199,148 174,528 8,179 4.1 4.7
7 248,691 213,466 9,664 3.9 4.5
8 319,221 265,497 11,715 3.7 4.4
9 439,779 350,851 13,824 3.1 3.9
10 908,654 624,251 18,937 2.1 3.0
Average 266,962 214,816 8,583 3.2 4.0
Sources: PSA and DOF staff estimates
Note: Sugar sweetened beverages include softdrinks, fruit juices, and sweetened milk, among others.
Average income, expenditure, and SSB expenditure per income decile (unadjusted)

DRAFT FOR DISCUSSION. SUBJECT TO CHANGE.
The poor spend around 4 percent of their income on SSBs (adjusted)
8/30/2017 DEPARTMENT OF FINANCE 45
Income
decile
Total income
(PHP)
Total
expenditure
(PHP)
SSB
expenditure
(PHP)
Share of SSB
exp. to
total income
(percent)
Share of SSB
exp. to total
exp. (percent)
1 55,489 56,976 2,299 4.1 4.0
2 87,841 85,781 3,711 4.2 4.3
3 111,801 104,971 4,864 4.4 4.6
4 135,738 124,661 5,859 4.3 4.7
5 163,473 147,324 6,781 4.1 4.6
6 199,354 174,709 8,188 4.1 4.7
7 249,844 214,456 9,709 3.9 4.5
8 325,857 271,016 11,958 3.7 4.4
9 480,750 383,536 15,112 3.1 3.9
10 1,288,033 884,887 26,843 2.1 3.0
Average 281,310 226,361 9,044 3.2 4.0
Sources: PSA and DOF staff estimates
Average income, expenditure, and SSB expenditure per income decile (adjusted)

DRAFT FOR DISCUSSION. SUBJECT TO CHANGE.
Detailed consumption of SSB, total unadjusted
8/30/2017 DEPARTMENT OF FINANCE 46
Income decile SoftdrinksFruit juice and
concentrates
Coffee and
cocoa, instantEnergy drinks
Condensed,
evaporated, and
other
sweetened milk
Total SSB
consumption
1 235 189 1,109 22 744 2,299
2 398 330 1,674 41 1,268 3,711
3 527 410 2,146 56 1,726 4,864
4 600 533 2,509 71 2,146 5,859
5 721 615 2,745 93 2,605 6,779
6 822 758 3,191 95 3,313 8,179
7 952 900 3,554 117 4,141 9,664
8 1,081 1,056 3,936 150 5,491 11,715
9 1,278 1,302 4,351 166 6,727 13,824
10 1,607 2,099 4,597 286 10,348 18,937
Total 822 819 2,981 110 3,851 8,583
Sources: PSA, DOF staff estimates
Average annual detailed SSB consumption, total unadjusted, PHP

DRAFT FOR DISCUSSION. SUBJECT TO CHANGE.
Detailed consumption of SSB, total adjusted
8/30/2017 DEPARTMENT OF FINANCE 47
Income decile SoftdrinksFruit juice and
concentrates
Coffee and
cocoa, instantEnergy drinks
Condensed,
evaporated, and
other
sweetened milk
Total SSB
consumption
1 235 189 1,109 22 744 2,299
2 398 330 1,674 41 1,268 3,711
3 527 410 2,146 56 1,726 4,864
4 600 533 2,509 71 2,146 5,859
5 721 616 2,746 93 2,606 6,781
6 823 759 3,195 95 3,316 8,188
7 956 904 3,571 118 4,160 9,709
8 1,104 1,078 4,018 153 5,606 11,958
9 1,397 1,424 4,756 181 7,354 15,112
10 2,278 2,975 6,516 405 14,669 26,843
Total 866 863 3,141 115 4,058 9,044
Sources: PSA, DOF staff estimates
Average annual detailed SSB consumption, total adjusted, PHP

DRAFT FOR DISCUSSION. SUBJECT TO CHANGE.
Detailed consumption of SSB, per capita unadjusted
8/30/2017 DEPARTMENT OF FINANCE 48
Income decile SoftdrinksFruit juice and
concentrates
Coffee and
cocoa, instantEnergy drinks
Condensed,
evaporated, and
other
sweetened milk
Total SSB
consumption
1 79 64 375 7 252 777
2 98 82 414 10 313 918
3 120 94 490 13 394 1,111
4 131 116 547 16 468 1,277
5 153 131 584 20 555 1,443
6 170 157 661 20 686 1,693
7 192 181 716 24 834 1,947
8 214 209 780 30 1,088 2,321
9 246 251 837 32 1,295 2,661
10 303 395 866 54 1,949 3,566
Total 179 178 648 24 837 1,865
Sources: PSA, DOF staff estimates
Average annual detailed SSB consumption, per capita unadjusted, PHP

DRAFT FOR DISCUSSION. SUBJECT TO CHANGE.
Detailed consumption of SSB, per capita adjusted
8/30/2017 DEPARTMENT OF FINANCE 49
Income decile SoftdrinksFruit juice and
concentrates
Coffee and
cocoa, instantEnergy drinks
Condensed,
evaporated, and
other
sweetened milk
Total SSB
consumption
1 79 64 375 7 252 777
2 98 82 414 10 313 918
3 120 94 490 13 394 1,111
4 131 116 547 16 468 1,277
5 153 131 584 20 555 1,443
6 170 157 661 20 687 1,695
7 193 182 720 24 838 1,956
8 219 214 796 30 1,111 2,370
9 269 274 915 35 1,416 2,909
10 429 560 1,227 76 2,763 5,055
Total 188 188 683 25 882 1,966
Sources: PSA, DOF staff estimates
Average annual detailed SSB consumption, per capita adjusted, PHP

DRAFT FOR DISCUSSION. SUBJECT TO CHANGE.
Young people “outgrow” milk products and “graduate” to other SSBs.
8/30/2017 DEPARTMENT OF FINANCE 50
2,425
1,551
790
1,015
28
3,040
2,108
1,337
2,310
284
1,382
1,020
1,678
2,534
529
-
500
1,000
1,500
2,000
2,500
3,000
3,500
Plain milk Chocolate milk Softdrinks Coffee & tea Energy drinks
Co
un
t, in
th
ou
san
d p
ers
on
s
Consumption of SSBs by population groups
Pre-school School-age Adolescents
Source: National Nutrition Survey, 2008

DRAFT FOR DISCUSSION. SUBJECT TO CHANGE.
Young people “outgrow” milk products and “graduate” to other SSBs.
8/30/2017 51
Source: National Nutrition Survey conducted by FNRI

DRAFT FOR DISCUSSION. SUBJECT TO CHANGE.
Students who usually drink carbonated soft drinks
8/30/2017 DEPARTMENT OF FINANCE 52
77
6257 54 52 50
46 45 44 4238
34 34 33 31 29 2622 19
0
10
20
30
40
50
60
70
80
90
Per
cen
tStudents (ages 13-17) who usually drink carbonated soft
drinks one or more times per day during the past 30 days, percent
Source: Youth risk behavior surveillance system

DRAFT FOR DISCUSSION. SUBJECT TO CHANGE.
Beverage Pre-school children School-aged children Adolescents
Male Female Male Female Male Female
Milk 85.25 86.50 37.55 37.83 18.57 23.15
Chocolate-based
beverages
29.69 25.66 26.58 25.31 14.80 16.23
Soy-based
beverages
0.00 0.10 0.00 0.00 0.00 0.00
Fruit-flavored
juice drinks
0.17 0.25 0.32 0.21 0.23 0.40
Soft drinks 14.07 13.46 16.20 16.73 24.66 26.67
Coffee and Tea 18.97 16.50 28.74 28.24 41.59 35.65
Energy drinks 1.14 0.00 7.00 0.00 15.81 1.77
Alcoholic
beverages
0.00 0.00 0.00 0.07 1.80 0.31
Other beverages 15.65 16.87 20.71 22.08 15.84 20.76
Proportion (%) of pre-school children, school-aged
children and adolescents consuming different types
of beverages by sex, NNS, Philippines: 2008
Golloso-Gubat MJ et al. Philippine Journal of Science, 144 (1): 31-41, June 2015
DRAFT FOR DISCUSSION. SUBJECT TO CHANGE.
SSB tax and better health
8/30/2017 DEPARTMENT OF FINANCE 54

DRAFT FOR DISCUSSION. SUBJECT TO CHANGE.
8/30/2017 DEPARTMENT OF FINANCE 55
Source: Institute for Health Metrics
and Evaluation (2015)
51
97
31
6
87
0
20
40
60
80
100
120
Overweight/ Obesity Diabetes Dental caries
in p
erc
en
t
National prevalence: Obesity,
diabetes and dental caries (2015)
Children Adults
Source: National Nutrition Survey, International Diabetes Federation, National Monitoring and
Evaluation Dental Survey, Philippine National Oral Health Survey (2015)
SSB excise tax can help address the growing problem of obesity.
Diabetes is the
leading cause
of disability in
the Philippines.4th

DRAFT FOR DISCUSSION. SUBJECT TO CHANGE.
Why impose excise tax on SSBs?
• SSBs contribute to obesity, diabetes, and dental caries.o Soft drink consumption is significantly linked to overweight,
obesity, and diabetes worldwide, including in low- and middle-income countries.
o Habitual consumption of SSBs is associated with greater incidence of Type 2 diabetes, independently of adiposity; consumption of SSBs over years may be related to a substantial number of cases of new onset diabetes.
o Higher consumption of SSBs is associated with development of metabolic syndrome, Type 2 diabetes and weight gain.
• Diabetes, in turn, increases the risk of other NCDs such as cardiovascular diseases (stroke, heart attack), hypertension, chronic kidney diseases.
Sources: DOH, Basu, Imamura, and Malik
8/30/2017 DEPARTMENT OF FINANCE 56

DRAFT FOR DISCUSSION. SUBJECT TO CHANGE.
High SSB consumption is linked to increased obesity and diabetes incidence• Soft drink consumption is significantly linked to overweight, obesity,
and diabetes worldwide, including in low and middle-income countries (Sanjay, Basu et. al).
• Many studies show that drinking 1-2 SSBs a day increases the risk of developing type 2 diabetes by 26%. (Malik, et. al, 2010).
• Higher consumption of SSBs is associated with development of metabolic syndrome, Type 2 diabetes, and weight gain (Vasanti, Malik et. al).
• The more sugars are consumed, the more dental caries in both adults and children.
• Habitual consumption of SSBs is associated with greater incidence of Type 2 diabetes, independently of adiposity; consumption of SSBs over years may be related to a substantial number of cases of new onset diabetes (Fumiaki, Imamura et. al).
8/30/2017 DEPARTMENT OF FINANCE 57

DRAFT FOR DISCUSSION. SUBJECT TO CHANGE.
Increased consumption of artificially sweetened beverages increase the
risk of obesity, diabetes, and stroke
• Artificially sweetened soft drink consumption was associated with a higher risk of stroke anddementia (Pase, et. al., 2017).
8/30/2017 DEPARTMENT OF FINANCE 58
DRAFT FOR DISCUSSION. SUBJECT TO CHANGE.
Case studies on effectiveness of SSB taxation in other countries
• Sustained SSB taxation at a high tax rate could mitigate rising obesity and type 2 diabetes in India among both urban and rural subpopulations (Basu, et. al, 2014).
8/30/2017 DEPARTMENT OF FINANCE 59
DRAFT FOR DISCUSSION. SUBJECT TO CHANGE.
Reading the evidence right
• Health impact: overweight, diabetes, obesity, dental caries, and even heart ailments. But takes long to see the link.
• The short-term evidence is reduction in consumption.
• Studies should be of long duration to show evidence. It must be published in peer reviewed journals.
• Renowned health agencies supportive: US institute of medicine, European food safety agency, World cancer research fund, and American heart association.
8/30/2017 DEPARTMENT OF FINANCE 60

DRAFT FOR DISCUSSION. SUBJECT TO CHANGE.
The SSB tax
8/30/2017 DEPARTMENT OF FINANCE 61

DRAFT FOR DISCUSSION. SUBJECT TO CHANGE.
8/30/2017 62

DRAFT FOR DISCUSSION. SUBJECT TO CHANGE.
8/30/2017 63
CTRP-Package-ONE_SSB-HB292 -
Copy.png

DRAFT FOR DISCUSSION. SUBJECT TO CHANGE.
Proposed products in HB 5636 to be excluded from the SSB excise tax
8/30/2017 DEPARTMENT OF FINANCE 64
ALL MILK PRODUCTS
including infant formula
and milk alternatives
(soy milk, almond milk,
flavored milk such as
chocolate milk)
100% NATURAL
VEGETABLE JUICES
MEDICALLY INDICATED
BEVERAGES
Meal replacement
therapies
PLAIN MILK
& MILK DRINK
PRODUCTS
without added
sugar
GROUND
COFFEE
UNSWEETENED
TEA
100% NATURAL
FRUIT JUICES

DRAFT FOR DISCUSSION. SUBJECT TO CHANGE.
Rationale on the proposed rate
• The proposed rate is based on Powell, Chriqui, Khan, Wada & Chaloupka ( 2013 ), which stated that in order to reduce soda consumption, the tax rate should raise prices by at least 20 percent. This is equivalent to 10 pesos per liter for the most popular brand.
8/30/2017 DEPARTMENT OF FINANCE 65

DRAFT FOR DISCUSSION. SUBJECT TO CHANGE.
Proposed earmarking provisions for SSB excise tax in HB 5636
• 85% of the tax collected shall accrue to the general fund supporting:
o Operationalization and monitoring of non-tax measures to prevent NCDs including:
– Regulatory measures on marketing
– Mandatory labeling and sale of unhealthy food and beverages
– Nationwide information and advocacy measures to curb lifestyle related risk factors
– Direct provisions and incentive-based measures increasing access and affordability of healthier products
– Promotion of oral health
o Provision of sports facilities for public schools and access to potable drinking water supply in all public places.
o Develop and sustain school-based feeding programs.
o Prevention and awareness programs against obesity, overweight and dental caries.
o Funding FDA to fulfill its mandate of ensuring safety and quality of health products.
8/30/2017 DEPARTMENT OF FINANCE 66

DRAFT FOR DISCUSSION. SUBJECT TO CHANGE.
Proposed earmarking provisions for SSB excise tax in HB 5636
• 15% of the tax collection shall accrue to fund programs under the Sugarcane Industry Development act of 2015oTo help farmers increase productivity.
oTo provide livelihood opportunities, develop alternative farming systems and ultimately enhance farmers’ income.
8/30/2017 DEPARTMENT OF FINANCE 67

DRAFT FOR DISCUSSION. SUBJECT TO CHANGE.
Arguments to tax certain products;Tax options
8/30/2017 DEPARTMENT OF FINANCE 68
DRAFT FOR DISCUSSION. SUBJECT TO CHANGE.

DRAFT FOR DISCUSSION. SUBJECT TO CHANGE.
Implementing a volume-based SSB tax
8/30/2017 DEPARTMENT OF FINANCE 69
Pros Cons
• It is simple, transparent, and easy to administer.
• It is fair and neutral with respect to volume.
• Almost all countries that impose tax on SSBs have single
rate applied on all forms.
• Tax burden increases with quantity consume, therefore it is
progressive.
• Differentiating the tax structure to accommodate product
forms leads to unequal tax burden in the long-run. For
instance, applying a lower effective tax rate to powdered
forms of SSBs will shift consumption to those forms relative
to ready-to-drink forms of the same volume.
May not directly
address the health
objectives

DRAFT FOR DISCUSSION. SUBJECT TO CHANGE.
Implementing a sugar-based SSB tax
8/30/2017 DEPARTMENT OF FINANCE 70
Pros Cons
It is an ideal practice since it can address
the health objective
Difficult to implement.
Not all products in available in the market
have sugar content in the nutrition label.
It would entail FDA to validate the
declared and actual sugar content of each
product.
It is not a transparent way of taxing unlike
the volume excise tax and would be more
costly to operationalize and administer.

Some are obviously SSB, but there is no sugar content in the nutrition label.
8/30/2017 DEPARTMENT OF FINANCE 71

DRAFT FOR DISCUSSION. SUBJECT TO CHANGE.
Why sodas should be taxed• A 375 ml (12 fluid oz) Coke product has approximately 40g
of added sugar, equivalent to 10 teaspoons of sugar.
• A person does not manually add 10 teaspoons of sugar in his drink on a daily basis.
• SSBs basically contain sugar levels that an average person won't usually add for his personal consumption as part of his daily routine.
• Since SSBs are a non-core food, they are not recommended for consumption in government dietary advice. Consuming just one serving of SSBs will bring a person above the recommended intake for sugars (and this has yet to take into consideration the food products and other drinks that a person will be consuming for the rest of the day).
8/30/2017 DEPARTMENT OF FINANCE 72

DRAFT FOR DISCUSSION. SUBJECT TO CHANGE.
Why 3-in-1 powdered coffee should be taxed
• 3-in-1 coffee has approximately 12 g of added sugar which is equivalent to 3 teaspoons of sugar/3 sugar packets.
• An average person does not sweeten his cup of brewed coffee with 3 sugar packets on a daily basis.
8/30/2017 DEPARTMENT OF FINANCE 73

DRAFT FOR DISCUSSION. SUBJECT TO CHANGE.
It is cheaper to make a cup of coffee and mix the ingredients
than buying 3-in-1 powder coffee
Coffee 3-in-1 DIY 3-in-1 preparation
Actual price: PHP 5.50
Breakdown:
12.5 grams of sugar
5 grams of creamer
2.5 grams of coffee
Estimated price: PHP 3.30
Estimated cost:
12.5 grams of sugar: PHP 0.1
5 grams of creamer: PHP 1.20
2.5 grams of coffee: PHP 2
Estimated price after excise: PHP 7.00 Estimated price after excise: PHP 3.30
Price change: 27% Price change: 0% (no excise imposed
on raw sugar)
8/30/2017 DEPARTMENT OF FINANCE 74
DRAFT FOR DISCUSSION. SUBJECT TO CHANGE.
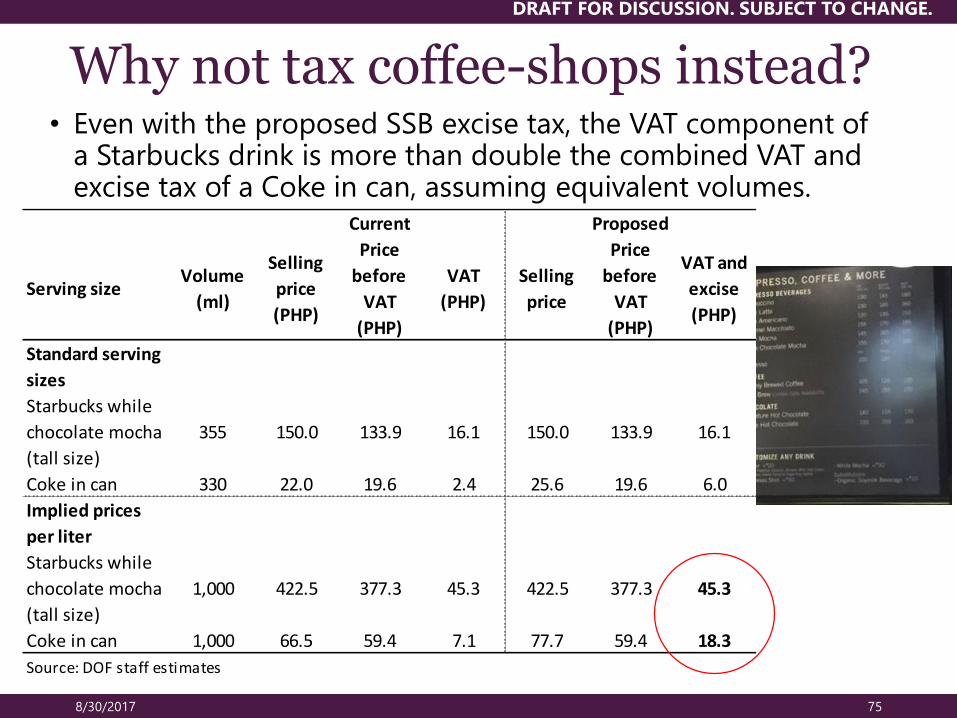
Serving sizeVolume
(ml)
Selling
price
(PHP)
Price
before
VAT
(PHP)
VAT
(PHP)
Selling
price
Price
before
VAT
(PHP)
VAT and
excise
(PHP)
Standard serving
sizes
Starbucks while
chocolate mocha
(tall size)
355 150.0 133.9 16.1 150.0 133.9 16.1
Coke in can 330 22.0 19.6 2.4 25.6 19.6 6.0
Implied prices
per liter
Starbucks while
chocolate mocha
(tall size)
1,000 422.5 377.3 45.3 422.5 377.3 45.3
Coke in can 1,000 66.5 59.4 7.1 77.7 59.4 18.3
Source: DOF staff estimates
Current Proposed
Why not tax coffee-shops instead?• Even with the proposed SSB excise tax, the VAT component of
a Starbucks drink is more than double the combined VAT and excise tax of a Coke in can, assuming equivalent volumes.
8/30/2017 75

DRAFT FOR DISCUSSION. SUBJECT TO CHANGE.
Economic cost
8/30/2017 DEPARTMENT OF FINANCE 76

DRAFT FOR DISCUSSION. SUBJECT TO CHANGE.
Health cost of diabetes• Most people are short-sighted, especially the poor and less
educated, so we need to use public policy to help them. They do not know or factor in well the true cost of SSB.
• In 2015, the government reimbursements on hemodialysis patients totaled to about PHP 7.4 billion to cover 1.1 million patients.
• Each hemodialysis session costs approximately PHP 4,000. PhilHealth covers 90 days of sessions at PHP 2,600/session.
• Depending on the severity of the case, a complete HD for an entire year is typically 120-150 sessions so the costs can go up to PHP 480,000 to 600,000. The patient only gets 90 sessions covered.
• This is considerable wastage for PhilHealth especially on benefit payout for diseases that are preventable with evidence-based and recommended public policy interventions.
8/30/2017 DEPARTMENT OF FINANCE 77
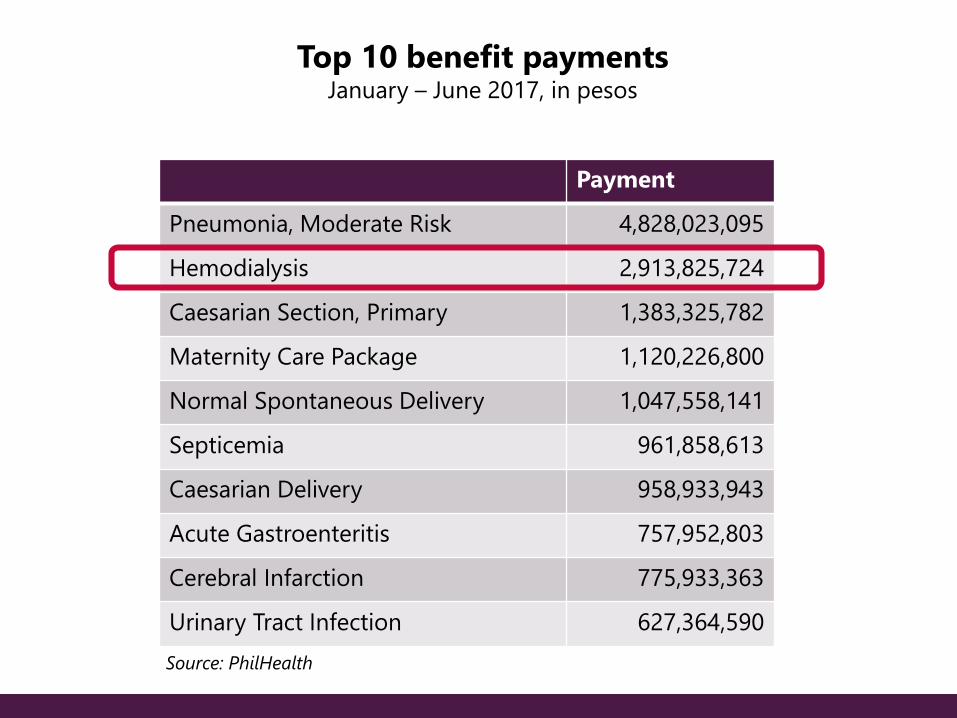
Payment
Pneumonia, Moderate Risk 4,828,023,095
Hemodialysis 2,913,825,724
Caesarian Section, Primary 1,383,325,782
Maternity Care Package 1,120,226,800
Normal Spontaneous Delivery 1,047,558,141
Septicemia 961,858,613
Caesarian Delivery 958,933,943
Acute Gastroenteritis 757,952,803
Cerebral Infarction 775,933,363
Urinary Tract Infection 627,364,590
Top 10 benefit paymentsJanuary – June 2017, in pesos
Source: PhilHealth

DRAFT FOR DISCUSSION. SUBJECT TO CHANGE.
8/30/2017 79
PhilHealth case rates
Case Subsidy (PHP)
Non-insulin dependent diabetes 2,800
Insulin dependent diabetes with no complications 2,800
Diabetes with complications other than coma or ketosis 12,600
Diabetes with coma or ketosis 15,800
Source: PhilHealth

DRAFT FOR DISCUSSION. SUBJECT TO CHANGE.
8/30/2017 80
Health cost of diabetes
Case Day (PHP) Month (PHP) Year (PHP)
Type 2 diabetes 60 1,825 21,900
+ hypertension 26 780 9,360
+ cholesterol 30 900 10,800
+ blood test ~13 ~400 4,800
+ kidney dialysis ~1,000 ~30,000 ~360,000
Total (without complications) 60 1,825 21,900
Total (without dialysis) ~125 ~3,750 ~45,000
Total (with dialysis) ~1,130 ~34,000 ~408,000
Note: Numbers may not fully add up, as the frequencies for each treatment vary (i.e., dialysis is usually held
twice a week, while a blood test is usually help once every two or three months.

DRAFT FOR DISCUSSION. SUBJECT TO CHANGE.
Health cost of diabetes
• Monthly maintenance is PHP5,000 or PHP60,000 per year for those taking medicines. This is not affordable for 80 percent of the population. If 5 million are taking medicines, this costs us 300 billion pesos per year.
• Direct cost related to obesity 0.06 to 0.5 percent of GDP and total cost from 1.5 to 9.9 percent of total healthcare expenditure in other countries. We have yet to do this.
• US: Obese people spend 30 percent more than normal people n health care.
• Japan: 9.8 and 22 percent more health spending for overweight and obese respectively.
8/30/2017 DEPARTMENT OF FINANCE 81

DRAFT FOR DISCUSSION. SUBJECT TO CHANGE.
Economic cost
• From 2011 to 2030, loss in GDP due to diabetes, total USD 1.7 trillion, of which 800 billion in low and middle income country.
• In the Philippines this is expected to grow as the country becomes richer and NCD the main driver of sickness. Economic cost is huge given our young labor force. Instead of being productive, they are sick and waste potential life.
8/30/2017 DEPARTMENT OF FINANCE 82

DRAFT FOR DISCUSSION. SUBJECT TO CHANGE.
Industry sales will still be strong
• However, industry sales will still be strong due tooHigher disposable income due to lower PIT
oRising middle class
o Fast growing economy (6.5%)
o Fast growing population (1.8%)
oModerate inflation (3%)
o Falling poverty and unemployment
oSubstitute products
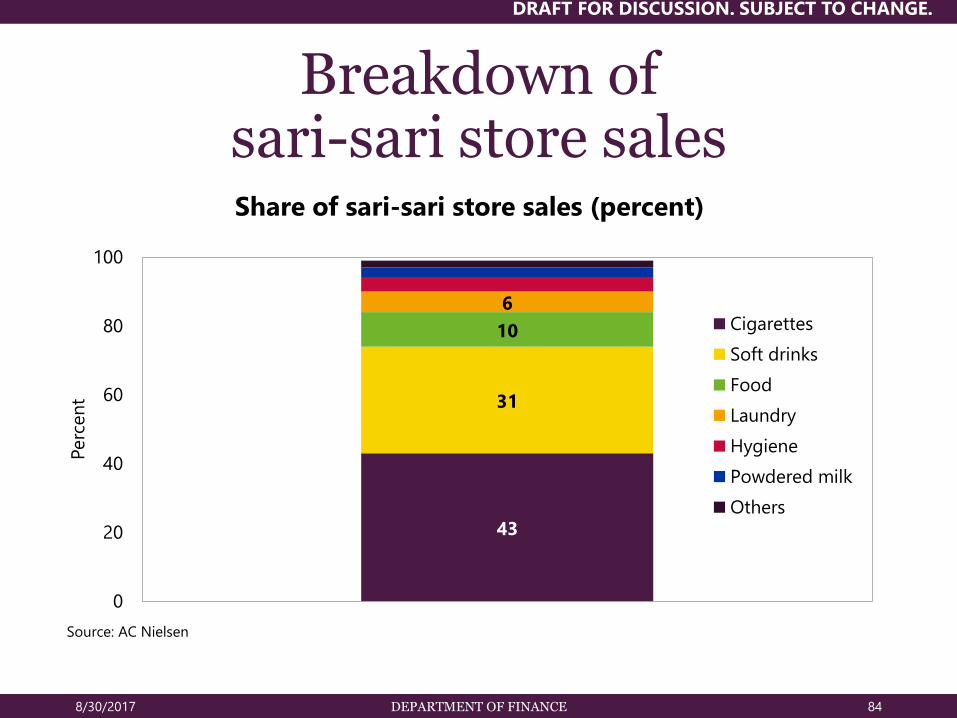
• Even sari-sari stores will grow due to the above reasons.
8/30/2017 DEPARTMENT OF FINANCE 83
DRAFT FOR DISCUSSION. SUBJECT TO CHANGE.
Breakdown of sari-sari store sales
8/30/2017 DEPARTMENT OF FINANCE 84
43
31
10
6
0
20
40
60
80
100
Perc
en
t
Share of sari-sari store sales (percent)
Cigarettes
Soft drinks
Food
Laundry
Hygiene
Powdered milk
Others
Source: AC Nielsen

DRAFT FOR DISCUSSION. SUBJECT TO CHANGE.
Breakdown of sari-sari store sales
8/30/2017 DEPARTMENT OF FINANCE 85
91
9
80
100
Perc
en
t
Retail mix (percent)Sari-sari stores Other retail stores
Source: AC Nielsen

DRAFT FOR DISCUSSION. SUBJECT TO CHANGE.
Lessons from the Sin Tax Law
• The imposition of heavy excise taxes on alcohol did not “kill” the industry, contrary to claims of some sectors and groups.o A robust economy and a growing middle class
incentivized alcohol manufacturers to “premiumise” or to create new products that suit the new demand, resulting in growth in the industry (Euromonitor, Alcoholic Drinks in the Philippines, June 2017)
o The SSB excise tax, coupled with increased investments brought about by revenues from tax reform, and middle class expansion due to lower PIT, will incentivize companies to create new, healthier product lines

DRAFT FOR DISCUSSION. SUBJECT TO CHANGE.
Lessons from the Sin Tax Law
• Contrary to industry claims that tobacco farmers would face an immediate decline in revenues due to lower cigarette demand, tobacco farming remained strong. Production increased by 4.5% in 2013, and exports expanded by 35% (AER, 2014).
8/30/2017 DEPARTMENT OF FINANCE 87

DRAFT FOR DISCUSSION. SUBJECT TO CHANGE.
Sari-Sari Store Training and Access to Resources (STAR) program
8/30/2017 88
• The Coca-Cola STAR Program is implemented in partnership with TESDA, where women around the country can enroll and undergo the Basic Entrepreneurship and Gender Sensitivity Training at the TESDA Women’s Center in Taguig City and other STAR Program trainings conducted in the regions.
• The TESDA-COKE STAR Program aims to empower 200,000 women and sari-sari store owners by the year 2020 by giving them skills training in managing their business and since 2016, has already helped around 83,000 owners of sari-sari stores.
• Began in 2014 during then TESDA Director General Joel Villanueva
DRAFT FOR DISCUSSION. SUBJECT TO CHANGE.
Financial position of top SSB firms
8/30/2017 DEPARTMENT OF FINANCE 89

DRAFT FOR DISCUSSION. SUBJECT TO CHANGE.
8/30/2017 DEPARTMENT OF FINANCE 90
121.6
76.8
55.3
19.09.1 9.1 8.2 6.1 5.0
0
25
50
75
100
125
150P
HP
bil
lio
ns
Gross revenues of top beverage companies, 2015
Source: SEC

DRAFT FOR DISCUSSION. SUBJECT TO CHANGE.
8/30/2017 DEPARTMENT OF FINANCE 91
15.6
7.5
0.8
6.2
0.4 0.4 0.9 1.00.1
0
4
8
12
16
20P
HP
bil
lio
n
Net profit of top beverage companies, 2015
Source: SEC

DRAFT FOR DISCUSSION. SUBJECT TO CHANGE.
Overall impact on the people
8/30/2017 DEPARTMENT OF FINANCE 92
DRAFT FOR DISCUSSION. SUBJECT TO CHANGE.
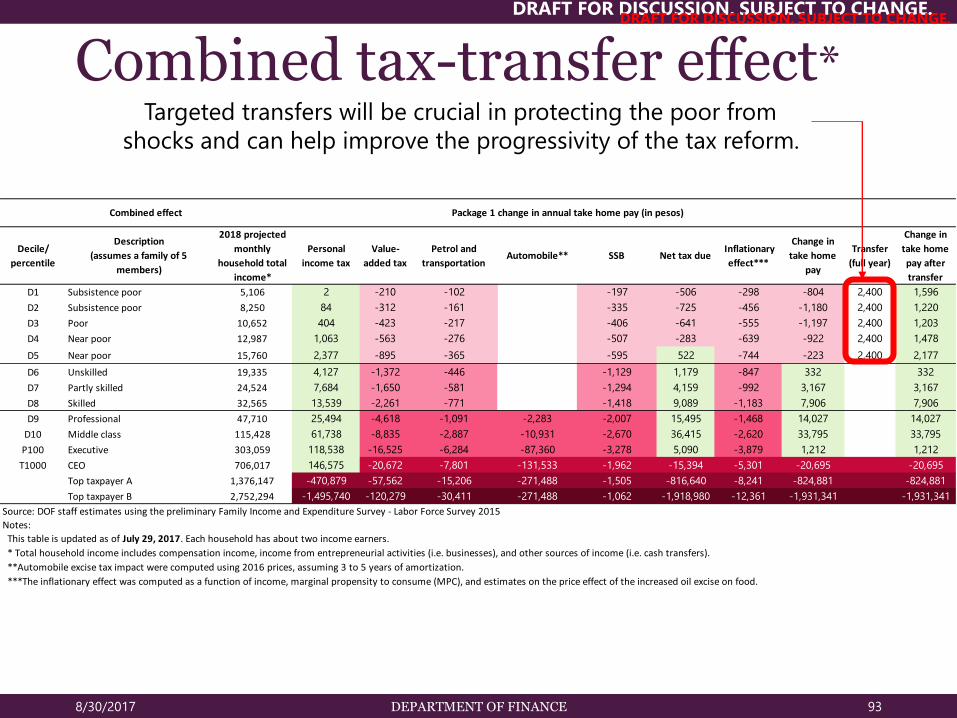
Decile/
percentile
Description
(assumes a family of 5
members)
2018 projected
monthly
household total
income*
Personal
income tax
Value-
added tax
Petrol and
transportationAutomobile** SSB Net tax due
Inflationary
effect***
Change in
take home
pay
Transfer
(full year)
Change in
take home
pay after
transfer
D1 Subsistence poor 5,106 2 -210 -102 -197 -506 -298 -804 2,400 1,596
D2 Subsistence poor 8,250 84 -312 -161 -335 -725 -456 -1,180 2,400 1,220
D3 Poor 10,652 404 -423 -217 -406 -641 -555 -1,197 2,400 1,203
D4 Near poor 12,987 1,063 -563 -276 -507 -283 -639 -922 2,400 1,478
D5 Near poor 15,760 2,377 -895 -365 -595 522 -744 -223 2,400 2,177
D6 Unskilled 19,335 4,127 -1,372 -446 -1,129 1,179 -847 332 332
D7 Partly skilled 24,524 7,684 -1,650 -581 -1,294 4,159 -992 3,167 3,167
D8 Skilled 32,565 13,539 -2,261 -771 -1,418 9,089 -1,183 7,906 7,906
D9 Professional 47,710 25,494 -4,618 -1,091 -2,283 -2,007 15,495 -1,468 14,027 14,027
D10 Middle class 115,428 61,738 -8,835 -2,887 -10,931 -2,670 36,415 -2,620 33,795 33,795
P100 Executive 303,059 118,538 -16,525 -6,284 -87,360 -3,278 5,090 -3,879 1,212 1,212
T1000 CEO 706,017 146,575 -20,672 -7,801 -131,533 -1,962 -15,394 -5,301 -20,695 -20,695
Top taxpayer A 1,376,147 -470,879 -57,562 -15,206 -271,488 -1,505 -816,640 -8,241 -824,881 -824,881
Top taxpayer B 2,752,294 -1,495,740 -120,279 -30,411 -271,488 -1,062 -1,918,980 -12,361 -1,931,341 -1,931,341
***The inflationary effect was computed as a function of income, marginal propensity to consume (MPC), and estimates on the price effect of the increased oil excise on food.
* Total household income includes compensation income, income from entrepreneurial activities (i.e. businesses), and other sources of income (i.e. cash transfers).
**Automobile excise tax impact were computed using 2016 prices, assuming 3 to 5 years of amortization.
Combined effect Package 1 change in annual take home pay (in pesos)
Source: DOF staff estimates using the preliminary Family Income and Expenditure Survey - Labor Force Survey 2015
Notes:
This table is updated as of July 29, 2017. Each household has about two income earners.
Combined tax-transfer effect*
8/30/2017 DEPARTMENT OF FINANCE 93
DRAFT FOR DISCUSSION. SUBJECT TO CHANGE.
Targeted transfers will be crucial in protecting the poor from
shocks and can help improve the progressivity of the tax reform.

DRAFT FOR DISCUSSION. SUBJECT TO CHANGE.
After the tax-transfer reform, the poor benefits the most.
8/30/2017 DEPARTMENT OF FINANCE 94
DRAFT FOR DISCUSSION. SUBJECT TO CHANGE.
Note: D1 refers to the first deciles or the poorest 10% of households based on the preliminary 2015 Family Income and Expenditure Survey (FIES). Each succeeding decile consists of the next 10% of households based on total household income. The figures above are averages for each decile.
2.61.2 0.9 0.9 1.2
0.11.1
2.0 2.5 2.4
0.0
-0.2
-5.0-5.8
-10
-8
-6
-4
-2
0
2
4
Per
cen
t
Average household
Percent increase in household income
Sources: PSA and DOF staff estimates

DRAFT FOR DISCUSSION. SUBJECT TO CHANGE.
Cross-country experience
8/30/2017 DEPARTMENT OF FINANCE 95
DRAFT FOR DISCUSSION. SUBJECT TO CHANGE.

DRAFT FOR DISCUSSION. SUBJECT TO CHANGE.
8/30/2017 96
Cross-country summary of specific and ad valorem SSB taxes
Source: Grattan Institute and World Health Organization
Country Base Type RatePeso
equivalent
SSB using locally - produced sugar PHP10/ L
Other SSB PHP20/ L
Barbados All SSB Ad valorem 10% PHP 17.09/L
Belgium Soft drinks Specific€0.03 per litre
(1 cent per can)PHP 1.77/ L
Cambodia Soft drinks Ad valorem 10% PHP 4.05/L
Flavored drinks and other non-alcoholic
drinks3%
Soft drinks 5%
Natural and carbonated mineral waters 10%
Dominica All SSB Ad valorem 10% PHP 7.05/L
Philippines Specific
Congo Ad valorem

DRAFT FOR DISCUSSION. SUBJECT TO CHANGE.
8/30/2017 97
Cross-country summary of specific and ad valorem SSB taxes
Source: Grattan Institute and World Health Organization
Country Base Type RatePeso
equivalent
Egypt Carbonated soft drinks Ad valorem 25% PHP 4.46/L
Soft drinks, soda, mineral water, fruit
juices, and other similar drinks5% PHP 4.22/L
Energy drinks 10% PHP 8.44/L
Malaysia Non-alcoholic drinks Ad valorem 10% PHP 2.74/L
Soda25% + 0.77
baht/440 cc
PHP12.00+
PHP2.64/L
Juices20% + 0.37
baht/440 cc
PHP19.47 +
PHP1.27/L
Other drinks20% + 0.37
baht/440 cc
PHP 19.76 +
PHP1.27/L
Fiji All SSB Specific 0.20 cents/L PHP 1.52/L
Laos Ad valorem
Thailand Mixed
DRAFT FOR DISCUSSION. SUBJECT TO CHANGE.
8/30/2017 98
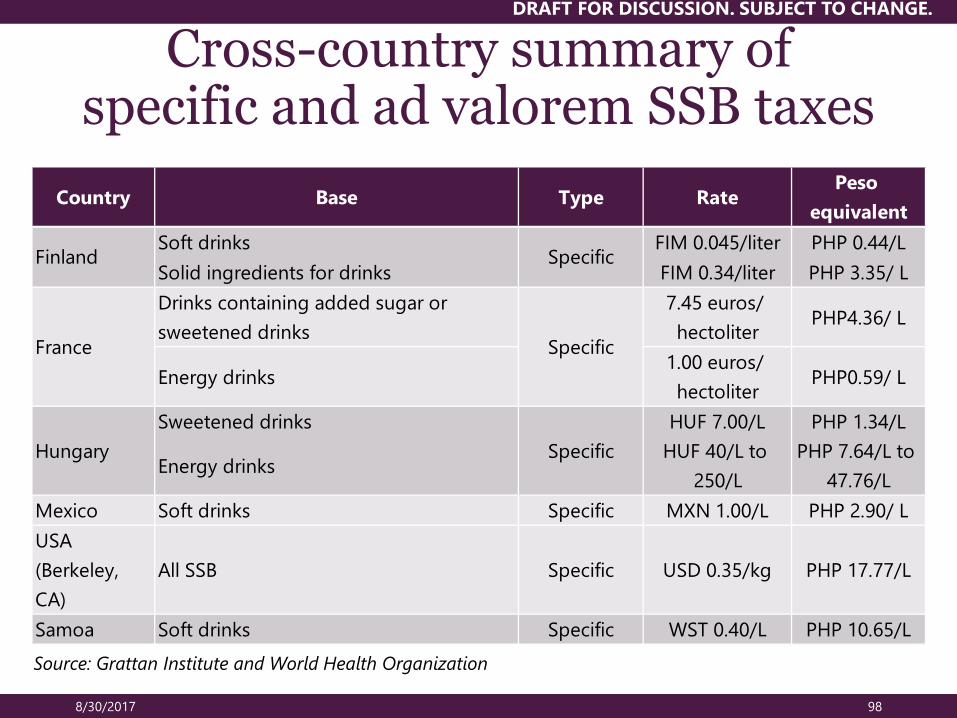
Cross-country summary of specific and ad valorem SSB taxes
Source: Grattan Institute and World Health Organization
Country Base Type RatePeso
equivalent
Soft drinks FIM 0.045/liter PHP 0.44/L
Solid ingredients for drinks FIM 0.34/liter PHP 3.35/ L
Drinks containing added sugar or
sweetened drinks
7.45 euros/
hectoliter PHP4.36/ L
Energy drinks1.00 euros/
hectoliter PHP0.59/ L
Sweetened drinks HUF 7.00/L PHP 1.34/L
Energy drinksHUF 40/L to
250/L
PHP 7.64/L to
47.76/L
Mexico Soft drinks Specific MXN 1.00/L PHP 2.90/ L
USA
(Berkeley,
CA)
All SSB Specific USD 0.35/kg PHP 17.77/L
Samoa Soft drinks Specific WST 0.40/L PHP 10.65/L
Finland Specific
SpecificHungary
France Specific

DRAFT FOR DISCUSSION. SUBJECT TO CHANGE.
Practices in other countries
• There are currently no tiered sugary beverage taxes in effect. The closest one is Chile’s, which imposes a higher VAT (18%) on SSBs above 6.25g/100ml.
• There are proposed or upcoming tiered volumetric SSB taxes in the United Kingdom, Ireland, and Portugal. All share the 8g/100ml content as a benchmark for “low-sugar beverages.”
8/30/2017 DEPARTMENT OF FINANCE 99

DRAFT FOR DISCUSSION. SUBJECT TO CHANGE.
Practices in other countries
• UK proposal is 3-tier volumetric tax, to be implemented this 2018.
Tier 1: 0 < 5g caloric sweetener/100ml = Exempted
Tier 2: 5g to 10g caloric sweetener/100ml = PHP 11.6/liter
Tier 3: > 8g caloric sweetener/100ml = PHP 15.5/liter
• In 2011, Hungary implemented a 2-tiered volumetric SSB tax.
<25% fruit content and > 8g added sugar/100ml = PHP 1.27/liter
Otherwise = exempted
8/30/2017 DEPARTMENT OF FINANCE 100

DRAFT FOR DISCUSSION. SUBJECT TO CHANGE.
Why the 8g/100ml of added sugar threshold?
• Sugar content varies greatly both across beverage categories and within them. A typical sugar sweetened soda, for example, contains almost 30 grams of sugar (about 7 teaspoons) per eight-ounce serving.
8/30/2017 DEPARTMENT OF FINANCE 101
Sugar content of
sugar-sweetened
beverages, 2014
Minimum(grams per
8oz serving)
Maximum(grams per
8oz serving)
Mean(grams per
8oz serving)
Regular soda 8 48 29
Fruit drinks 1 57 22
Sports drinks 5 14 12
Ready-to-drink tea 5 28 15
Energy drinks 1 33 19
Flavored water 4 13 10
Ready-to-drink coffee 2 28 16
Source: Rudd Center for Food Policy and Obesity, 2014, Sugary Drink FACTS 2014;
author’s calculations
DRAFT FOR DISCUSSION. SUBJECT TO CHANGE.
Practices in other countries
• A “grace period” or a period from the announcement of proposals to implementation comes with the tiered volumetric system. This allows industry to adjust the sugar content of its products.
• There is no tiered SSB tax in Singapore, contrary to what the BIAP position asserts. Instead of introducing an excise tax, a healthy choice campaign was initiated to classify carbonated soft drinks using 0-7 grams per 100 ml threshold.
8/30/2017 DEPARTMENT OF FINANCE 102

DRAFT FOR DISCUSSION. SUBJECT TO CHANGE.
Practices in other countries
8/30/2017 DEPARTMENT OF FINANCE 103
Country Treatment of milk products
Mexico Milk and dairy products are exempted
United Kingdom Exempts “milk-based” beverages and natural fruit juices
Philadelphia, USA Products with at least 50% milk content are exempt
France Flavored milk are taxed
Nauru Flavored milk are taxed

DRAFT FOR DISCUSSION. SUBJECT TO CHANGE.
Sugar and HFCS
8/30/2017 DEPARTMENT OF FINANCE 104

DRAFT FOR DISCUSSION. SUBJECT TO CHANGE.
Source: Sugar Regulatory Administration
Value chain of Philippine sugar industry

DRAFT FOR DISCUSSION. SUBJECT TO CHANGE.
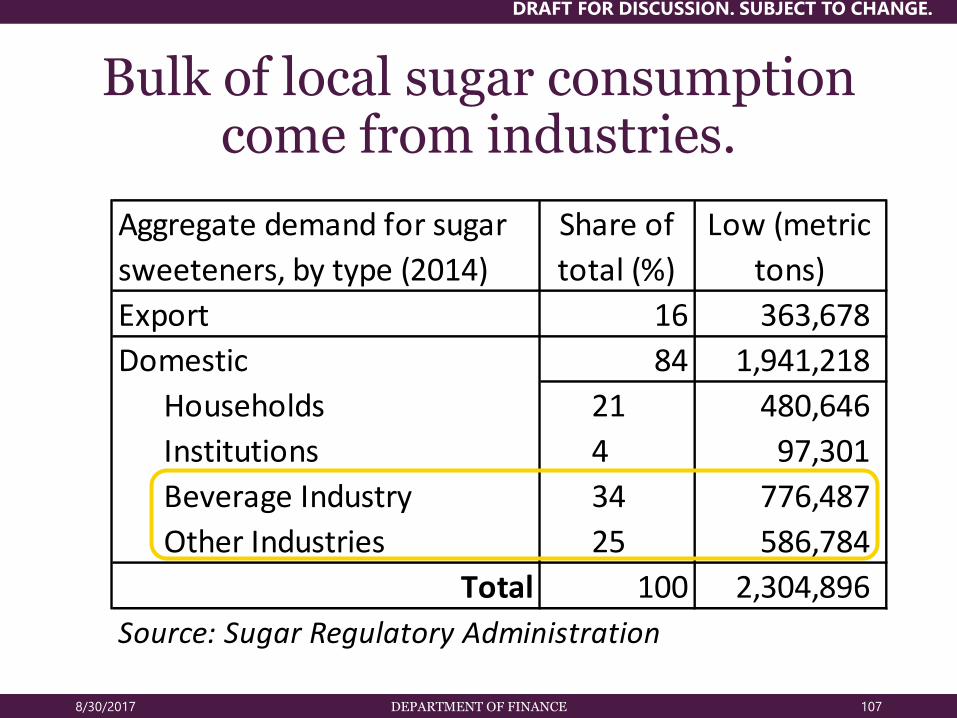
Bulk of local sugar consumption come from industries.
8/30/2017 DEPARTMENT OF FINANCE 106
DRAFT FOR DISCUSSION. SUBJECT TO CHANGE.
Aggregate demand for sugar
sweeteners, by type (2014)
Share of
total (%)
Low (metric
tons)
Export 16 363,678
Domestic 84 1,941,218
Households 21 480,646
Institutions 4 97,301
Beverage Industry 34 776,487
Other Industries 25 586,784
Total 100 2,304,896
Source: Sugar Regulatory Administration
Bulk of local sugar consumption come from industries.
8/30/2017 DEPARTMENT OF FINANCE 107
DRAFT FOR DISCUSSION. SUBJECT TO CHANGE.
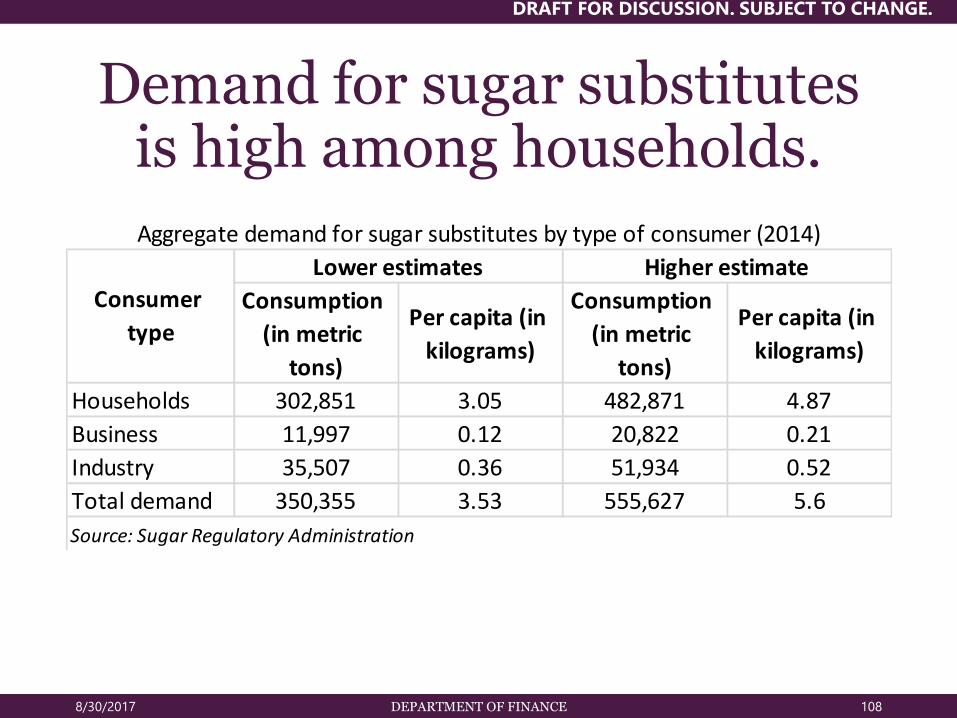
Demand for sugar substitutes is high among households.
8/30/2017 DEPARTMENT OF FINANCE 108
Consumption
(in metric
tons)
Per capita (in
kilograms)
Consumption
(in metric
tons)
Per capita (in
kilograms)
Households 302,851 3.05 482,871 4.87
Business 11,997 0.12 20,822 0.21
Industry 35,507 0.36 51,934 0.52
Total demand 350,355 3.53 555,627 5.6
Source: Sugar Regulatory Administration
Lower estimates Higher estimate
Consumer
type
Aggregate demand for sugar substitutes by type of consumer (2014)

DRAFT FOR DISCUSSION. SUBJECT TO CHANGE.
Domestic sugar production
8/30/2017 DEPARTMENT OF FINANCE 109
Raw sugar production 2011-2012 2012-2013 2013-2014 2014-2015 2015-2016
Total production
(Metric Tons)
2,244,131 2,465,116 2,461,808 2,323,817 2,238,872
Increase/Decrease 10% 0% -6% -4%
Total Area (Hectares) 422,384 424,132 423,333 416,893 413,435
Yield per Hectare (LKg/Ha) 106.26 116.24 116.31 111.48 108.31
Raw sugar domestic withdrawals
(consumption)
2011-2012 2012-2013 2013-2014 2014-2015 2015-2016
Total (Metric Tons) 2,029,866 2,184,512 2,202,443 2,240,682 2,159,976
Increase/Decrease 8% 1% 2% -4%
Refined sugar production 2011-2012 2012-2013 2013-2014 2014-2015 2015-2016
Total (in 50 kg-Bag) 18,723,731 21,097,909 20,687,713 21,527,634 19,146,629
Increase/Decrease 13% -2% 4% -11%
Refined sugar withdrawals
(consumption)
2011-2012 2012-2013 2013-2014 2014-2015 2015-2016
Total (in 50 kg-Bag) 18,897,432 20,495,655 22,318,709 20,166,002 17,578,307
Increase/Decrease 8% 9% -10% -13%

DRAFT FOR DISCUSSION. SUBJECT TO CHANGE.
There is an increasing trend in HFCS importation.
8/30/2017 DEPARTMENT OF FINANCE 110

DRAFT FOR DISCUSSION. SUBJECT TO CHANGE.
In 2016, 1.3 billion kg of sugar and confectionaries was imported
valued at 24.3 billion pesos.
8/30/2017 DEPARTMENT OF FINANCE 111
HS4Net mass (in
billion kilograms)
Value (in
billion PHP)Description
1701 0.24 4.98 Cane or beet sugar and chemically pure sucrose, in solid form
1702 0.58 13.1
Sugars, including lactose, maltose, glucose or fructose in solid
form; sugar syrups without added flavouring or colouring
matter; artificial honey, whether or not mixed with natural
honey; caramel
1703 0.50 3.2 Molasses; resulting from the extraction or refining of sugar
1704 0.04 3.1sugar confectionery (including white chocolate), not
containing cocoa
Total 1.36 24.4
Source: Bureau of Customs

DRAFT FOR DISCUSSION. SUBJECT TO CHANGE.
Revenue estimates and methodology
8/30/2017 DEPARTMENT OF FINANCE 112

DRAFT FOR DISCUSSION. SUBJECT TO CHANGE.
Comparison of estimated revenue collection
8/30/2017 DEPARTMENT OF FINANCE 113
Comparison of 2018 revenue from SSB excise tax
in billion
PHP
HB 292
PHP10/liter
Lower rate
PHP5/liter
Sugar content
PHP0.05/gram
of sugar
Sugar content
PHP0.10/gram
of sugar
Excise 41.93 22.84 24.84 43.97
VAT 5.03 2.74 2.98 5.28
TOTAL 46.96 25.58 27.82 49.24
Source: DOF staff estimates (as of August 11, 2017)
Note: Estimates also exclude artificial sweetened SSBs.

DRAFT FOR DISCUSSION. SUBJECT TO CHANGE.
8/30/2017 114
Estimated revenue impactbased on PHP10/liter
2018 2019 2020 2021 2022
Excise 33.7 35.4 37.1 39.0 40.9
VAT 4.0 4.2 4.5 4.7 4.9
Total 37.7 39.6 41.6 43.7 45.8
Excise 3.4 3.6 3.8 3.9 4.1
VAT 0.4 0.4 0.5 0.5 0.5
Total 3.8 4.0 4.2 4.4 4.6
Excise 1.8 1.9 2.0 2.1 2.2
VAT 0.2 0.2 0.2 0.3 0.3
Total 2.1 2.2 2.3 2.4 2.5
Excise 3.0 3.2 3.3 3.5 3.6
VAT 0.4 0.4 0.4 0.4 0.4
Total 3.4 3.5 3.7 3.9 4.1
Excise 41.9 44.0 46.2 48.5 51.0
VAT 5.0 5.3 5.5 5.8 6.1
TOTAL 47.0 49.3 51.8 54.4 57.1 Source: DOF staff estimates (as of May 5, 2017)
SSB typeEstimated incremental revenues (in billion PHP)
Softdrinks
Energy drinks
Sweetened tea
Fruit drinks
Grand total

DRAFT FOR DISCUSSION. SUBJECT TO CHANGE.
Estimated revenue impactbased on PHP5/liter
8/30/2017 DEPARTMENT OF FINANCE 115
2018 2019 2020 2021 2022
Excise 18.2 19.1 20.1 21.1 22.2
VAT 2.2 2.3 2.4 2.5 2.7
Total 20.4 21.4 22.5 23.6 24.8
Excise 1.9 2.0 2.1 2.2 2.3
VAT 0.2 0.2 0.2 0.3 0.3
Total 2.1 2.2 2.3 2.4 2.6
Excise 1.0 1.1 1.1 1.2 1.2
VAT 0.1 0.1 0.1 0.1 0.1
Total 1.1 1.2 1.2 1.3 1.4
Excise 1.7 1.8 1.9 2.0 2.1
VAT 0.2 0.2 0.2 0.2 0.3
Total 1.9 2.0 2.1 2.2 2.4
Excise 22.8 24.0 25.2 26.4 27.8
VAT 2.7 2.9 3.0 3.2 3.3
TOTAL 25.6 26.9 28.2 29.6 31.1
Source: DOF staff estimates (as of May 5, 2017)
Note: Computations does not include artificially sweetened SSBs.
Energy Drinks
Sweetened Tea
Fruit Drinks
Grand Total
SSB typeEstimated incremental revenues (in billion PHP)
Softdrinks

DRAFT FOR DISCUSSION. SUBJECT TO CHANGE.
Estimated revenue impactbased on sugar content: PHP 0.10/gram
8/30/2017 DEPARTMENT OF FINANCE 116
2018 2019 2020 2021 2022
Excise 36.2 38.0 39.9 41.9 44.0
VAT 4.3 4.6 4.8 5.0 5.3
Total 40.5 42.6 44.7 46.9 49.3
Excise 3.5 3.7 3.9 4.1 4.3
VAT 0.4 0.4 0.5 0.5 0.5
Total 3.9 4.1 4.3 4.5 4.8
Excise 1.3 1.4 1.5 1.5 1.6
VAT 0.2 0.2 0.2 0.2 0.2
Total 1.5 1.6 1.6 1.7 1.8
Excise 3.0 3.1 3.3 3.4 3.6
VAT 0.4 0.4 0.4 0.4 0.4
Total 3.3 3.5 3.7 3.8 4.0
Excise 44.0 46.2 48.5 50.9 53.4
VAT 5.3 5.5 5.8 6.1 6.4
TOTAL 49.2 51.7 54.3 57.0 59.9
Source: DOF staff estimates (as of May 5, 2017)
Note: Computations does not include artificially sweetened SSBs.
Summary by SSB type - PHP 0.10 per gram of sugar
SSB typeEstimated incremental revenues (in billion PHP)
Softdrinks
Energy Drinks
Sweetened Tea
Fruit Drinks
Grand Total

DRAFT FOR DISCUSSION. SUBJECT TO CHANGE.
Estimated revenue impactbased on sugar content: PHP 0.05/gram
2018 2019 2020 2021 2022
Excise 19.8 20.8 21.8 22.9 24.0
VAT 2.4 2.5 2.6 2.7 2.9
Total 22.2 23.3 24.4 25.6 26.9
Excise 2.0 2.1 2.2 2.3 2.4
VAT 0.2 0.3 0.3 0.3 0.3
Total 2.2 2.3 2.5 2.6 2.7
Excise 0.7 0.7 0.8 0.8 0.8
VAT 0.1 0.1 0.1 0.1 0.1
Total 0.8 0.8 0.9 0.9 1.0
Excise 1.7 1.8 1.9 2.0 2.1
VAT 0.2 0.2 0.2 0.2 0.2
Total 1.9 2.0 2.1 2.2 2.3
Excise 24.2 25.4 26.7 28.0 29.4
VAT 2.9 3.0 3.2 3.4 3.5
TOTAL 27.1 28.4 29.9 31.3 32.9
Source: DOF staff estimates (as of May 5, 2017)
Note: Computations does not include artificially sweetened SSBs.
Sweetened Tea
Fruit Drinks
Grand Total
Summary by SSB type - PHP 0.05 per gram of sugar
SSB typeEstimated incremental revenues (in billion PHP)
Softdrinks
Energy Drinks
8/30/2017 DEPARTMENT OF FINANCE 117

DRAFT FOR DISCUSSION. SUBJECT TO CHANGE.
Estimated revenue impactPHP5/liter (2018, 2019); PHP 0.05/g of sugar (2020 onwards)
PHP2.5/liter for artificially sweetened SSBs
8/30/2017 DEPARTMENT OF FINANCE 118
2018 2019 2020 2021 2022
Concentrates
Powder Concentrates
Excise 12.90 12.83 3.28 3.33 3.40
VAT 1.55 1.54 0.39 0.40 0.41
Total 14.45 14.37 3.67 3.73 3.80
Liquid Concentrates
Excise 0.93 0.93 0.74 0.74 0.73
VAT 0.11 0.11 0.09 0.09 0.09
Total 1.04 1.04 0.83 0.83 0.82
Excise 13.84 13.76 4.02 4.07 4.13
VAT 1.66 1.65 0.48 0.49 0.50
Total 15.50 15.41 4.50 4.56 4.63
Total for Concentrates
Type of SSBEstimated incremental revenues (in billion PHP)
2018 2019 2020 2021 2022
Excise 17.69 18.47 21.32 22.26 23.24
VAT 2.12 2.22 2.56 2.67 2.79
Total 19.81 20.68 23.88 24.93 26.03
Excise 1.92 2.00 2.26 2.36 2.46
VAT 0.23 0.24 0.27 0.28 0.30
Total 2.15 2.24 2.53 2.64 2.75
Excise 1.00 1.05 0.78 0.81 0.85
VAT 0.12 0.13 0.09 0.10 0.10
Total 1.12 1.17 0.87 0.91 0.95
Excise 1.80 1.88 1.97 2.06 2.15
VAT 0.22 0.23 0.24 0.25 0.26
Total 2.02 2.10 2.21 2.31 2.41
Excise 0.40 0.22 0.23 0.24 0.25
VAT 0.05 0.03 0.03 0.03 0.03
Total 0.45 0.25 0.26 0.27 0.28
Total for RTD SSBs
Excise 22.81 23.61 26.56 27.72 28.94
VAT 2.74 2.83 3.19 3.33 3.47
Total 25.55 26.45 29.75 31.05 32.41
RTD SSBs
Artificial
Softdrinks
Energy drinks
Sweetened tea
Fruit drinks
Type of
SSB
Estimated incremental revenues (in billion PHP)
Source: DOF staff estimates
Note: Milk and powdered 3-in-1 coffee not included in this estimation.

DRAFT FOR DISCUSSION. SUBJECT TO CHANGE.
Estimated incremental revenues, by company
PHP 10/liter
8/30/2017 DEPARTMENT OF FINANCE 119
2018 2019 2020 2021 2022
Coca-Cola Export Corp, The
Excise 19.97 20.96 22.01 23.11 24.27
VAT 2.40 2.52 2.64 2.77 2.91
Total 22.36 23.48 24.65 25.89 27.18
Pepsi-Cola Products Philippines Inc
Excise 11.91 12.51 13.14 13.79 14.48
VAT 1.43 1.50 1.58 1.66 1.74
Total 13.34 14.01 14.71 15.45 16.22
Zest-O Corp
Excise 1.23 1.29 1.35 1.42 1.49
VAT 0.15 0.15 0.16 0.17 0.18
Total 1.38 1.44 1.52 1.59 1.67
Asiawide Refreshments Corp
Excise 3.35 3.52 3.70 3.88 4.08
VAT 0.40 0.42 0.44 0.47 0.49
Total 3.76 3.94 4.14 4.35 4.57
Asia Brewery Inc
Excise 1.82 1.91 2.00 2.10 2.21
VAT 0.22 0.23 0.24 0.25 0.27
Total 2.04 2.14 2.24 2.36 2.47
Company name Estimated incremental revenues (PHP)
Source: DOF staff estimates Note: Based on PHP10/liter tax

DRAFT FOR DISCUSSION. SUBJECT TO CHANGE.
Estimated incremental revenues, by company
PHP 10/liter
2018 2019 2020 2021 2022
Universal Robina Corp
Excise 1.54 1.61 1.69 1.78 1.87
VAT 0.18 0.19 0.20 0.21 0.22
Total 1.72 1.81 1.90 1.99 2.09
Del Monte Philippines Inc
Excise 1.10 1.16 1.21 1.27 1.34
VAT 0.13 0.14 0.15 0.15 0.16
Total 1.23 1.29 1.36 1.43 1.50
Cosmos Bottling Corp
Excise 0.73 0.77 0.81 0.85 0.89
VAT 0.09 0.09 0.10 0.10 0.11
Total 0.82 0.86 0.91 0.95 1.00
Cenmaco Inc
Excise 0.15 0.16 0.17 0.18 0.19
VAT 0.02 0.02 0.02 0.02 0.02
Total 0.17 0.18 0.19 0.20 0.21
RFM Corp
Excise 0.13 0.13 0.14 0.15 0.15
VAT 0.02 0.02 0.02 0.02 0.02
Total 0.14 0.15 0.16 0.16 0.17
Grand Total
Excise 41.93 44.03 46.23 48.54 50.97
VAT 5.03 5.28 5.55 5.82 6.12
Total 46.96 49.31 51.77 54.36 57.08
Source: DOF staff estimates (as of May 5, 2017)
Company name Estimated incremental revenues (PHP)
8/30/2017 DEPARTMENT OF FINANCE 120
Note: Based on PHP10/liter tax

DRAFT FOR DISCUSSION. SUBJECT TO CHANGE.
Estimated revenue impactPHP 10/liter and PHP 5/liter
Proposal: HB 292
Tax rate: PHP10 per liter
in billion PHP 2018 2019 2020 2021 2022
Excise 41.93 44.03 46.23 48.54 50.97
VAT 5.03 5.28 5.55 5.82 6.12
TOTAL 46.96 49.31 51.77 54.36 57.08
Source: DOF staff estimates (as of August 11, 2017)
Note: Estimates also exclude artificial sweetened SSBs.
*Estimates for the proposed two-tier SSB excise structure was not included since
information on the breakdown (ratio) of local and imported sugar used for SSB
products is not available.
8/30/2017 DEPARTMENT OF FINANCE 121
Proposal: Lower volumetric rate
Tax rate: PHP5 per liter
in billion PHP 2018 2019 2020 2021 2022
Excise 22.84 23.98 25.18 26.44 27.76
VAT 2.74 2.88 3.02 3.17 3.33
Total 25.58 26.86 28.20 29.61 31.09
Proposal: Based on sugar content
Tax rate: Php 0.05 per gram of sugar
in billion PHP 2018 2019 2020 2021 2022
Excise 24.84 26.08 27.39 28.76 30.19
VAT 2.98 3.13 3.29 3.45 3.62
Total 27.82 29.21 30.67 32.21 33.82
Source: DOF staff estimates (as of August 11, 2017)
Note: PHP 0.05/gram of sugar is the average tax rate equivalent to the PHP 5/liter excise tax.
DRAFT FOR DISCUSSION. SUBJECT TO CHANGE.
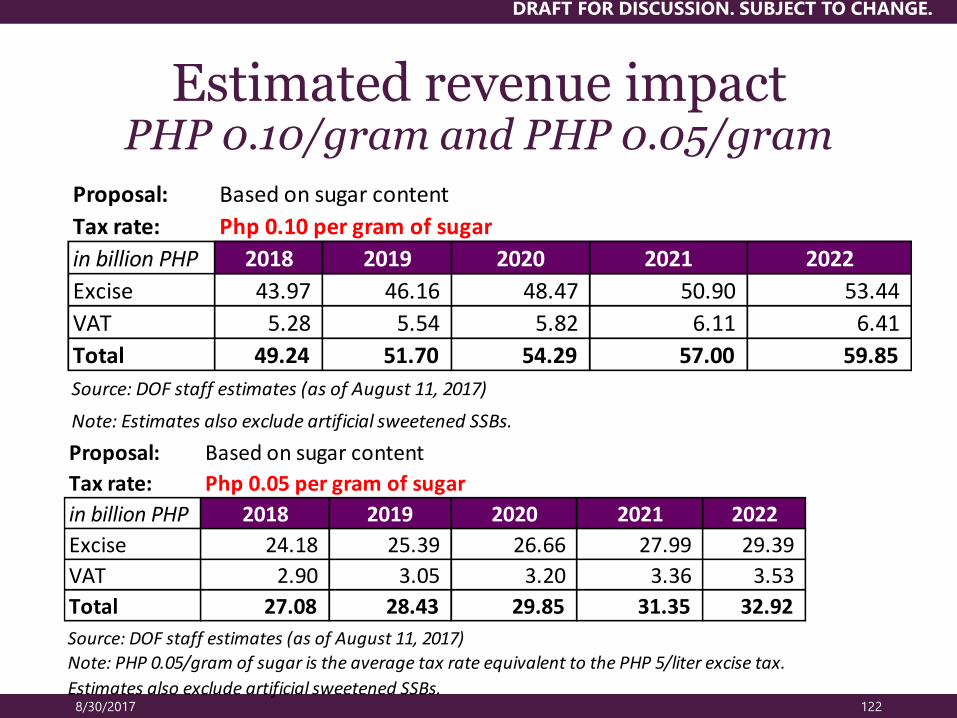
8/30/2017 122
Estimated revenue impactPHP 0.10/gram and PHP 0.05/gram
Proposal: Based on sugar content
Tax rate: Php 0.05 per gram of sugar
in billion PHP 2018 2019 2020 2021 2022
Excise 24.18 25.39 26.66 27.99 29.39
VAT 2.90 3.05 3.20 3.36 3.53
Total 27.08 28.43 29.85 31.35 32.92
Source: DOF staff estimates (as of August 11, 2017)
Note: PHP 0.05/gram of sugar is the average tax rate equivalent to the PHP 5/liter excise tax.
Estimates also exclude artificial sweetened SSBs.
Proposal: Based on sugar content
Tax rate: Php 0.10 per gram of sugar
in billion PHP 2018 2019 2020 2021 2022
Excise 43.97 46.16 48.47 50.90 53.44
VAT 5.28 5.54 5.82 6.11 6.41
Total 49.24 51.70 54.29 57.00 59.85
Source: DOF staff estimates (as of August 11, 2017)
Note: Estimates also exclude artificial sweetened SSBs.

DRAFT FOR DISCUSSION. SUBJECT TO CHANGE.
Estimated revenue impactPHP5/liter (2018, 2019); PHP 0.05/g of sugar (2020 onwards)
PHP2.5/liter for artificially sweetened SSBs
8/30/2017 DEPARTMENT OF FINANCE 123
Type of SSB 2018 2019 2020 2021 2022
RTDs
Excise on RTD SSBs 22.8 23.6 26.6 27.7 28.9
VAT on RTD SSBs 2.7 2.8 3.2 3.3 3.5
Total 25.5 26.4 29.7 31.1 32.4
Excise on Concentrates 13.8 13.8 4.0 4.1 4.1
VAT on Concentrates 1.7 1.7 0.5 0.5 0.5
Total 15.5 15.4 4.5 4.6 4.6
Excise tax revenue 36.65 37.37 30.58 31.80 33.07
VAT revenue 4.40 4.48 3.67 3.82 3.97
TOTAL 41.04 41.85 34.25 35.61 37.04
Estimated incremental revenues (in billion PHP)
GRAND TOTAL
Concentrates

DRAFT FOR DISCUSSION. SUBJECT TO CHANGE.
8/30/2017 124
1. Compute for the new selling price per liter of SSB products, by computing for the base price per liter (or price per liter before the 12 percent value added tax (VAT) of each SSB).
2. Apply the proposed excise tax rate of PHP10 to the computed base price per liter, and multiply by the 12 percent VAT. With the new selling price per liter, compute the increase or change of price per liter from the old selling price.
3. Determine the estimated 2018 volume of demand by multiplying 2017 volume to the percent increase in price and corresponding elasticities.
4. Compute for the incremental revenue on excise and VAT, by applying the proposed excise rate to the estimated 2018 volume demand for each SSB product.
5. Compute for the incremental VAT collection by multiplying the 12 percent VAT to the estimated revenue from the proposed excise tax.
Methodology

DRAFT FOR DISCUSSION. SUBJECT TO CHANGE.
8/30/2017 125
Assumptions used in estimating the revenue impact
• Datao 2015 Euromonitor data on the volume of sales in liters of SSBs
o Suggested retail price of SSBs based on supermarket survey conducted by DOF staff
• Assumptionso Elasticities
o Income elasticity: 1.58 (across the board) based from DOF computation
o Growth rate: 5 percent (based on average growth rate of SSB sales (2010 to 2015)
Source: 1/ DOF staff estimates ; 2/ Andreyeva, et.al (2010)
Type of SSB Elasticity
Soft drinks (Caffeine) 1/ - 0.77
Non-Soft drinks (Non-caffeine) 2/ -1.0

DRAFT FOR DISCUSSION. SUBJECT TO CHANGE.
Related literature on SSB elasticity estimates
8/30/2017 DEPARTMENT OF FINANCE 126
Source: Cabrera Escobar, et. al. 2013. Evidence that a tax on sugar sweetened beverages reduces the obesity rate: a meta-
analysis. BioMed Central Public Health.

DRAFT FOR DISCUSSION. SUBJECT TO CHANGE.
Responding to critiques
8/30/2017 DEPARTMENT OF FINANCE 127

DRAFT FOR DISCUSSION. SUBJECT TO CHANGE.
Position of various stakeholders on SSB excise tax
Argument DOF response
1. Is there really a negative
externality? De Dios
Poor and youth have assymetric info. They
do not know the effects of increased SSB
consumption in the long-run.
The negative externatility is that when they
are older they allocate more money for
maintenance, when undergo analysis –
productive time is wasted
2. UAP study Thu study must address the following
methodological issues:
1. Mis-specification
2. Did not account for the income effect
8/30/2017 DEPARTMENT OF FINANCE 128

DRAFT FOR DISCUSSION. SUBJECT TO CHANGE.
DOF response to BIAP positionBIAP position DOF response
Hurt lower income families
The proposed SSB tax on products
commonly purchased by majority of
Filipinos, particularly those in the lower
socio-economic classes, will make items
like coffee, juice, and soft drinks more
expensive.
These products are non-essential and
have health risks, and thus their
consumption is not encouraged. We
do not tell our children to consume
these products every day because they
are unhealthy.
To illustrate, the price increase of the
products, ordinarily purchased by the
most vulnerable segment of our society
like 3-in-1 coffee and powdered juices,
will be as high as 40% and 200%
respectively.
We are open to reviewing the tax
coverage and the rates for some
products. For 3-in-1 coffee, it is far
cheaper to simply buy the ingredients
and mix personally (7 pesos vs 3.3
pesos). 3-in-1 coffee has 12.5 grams
or 3 teaspoons of sugar, way too much.
Those who take brewed coffee do not
put 3 teaspoons of sugar in their
coffee. 9/27/2016 DEPARTMENT OF FINANCE 129
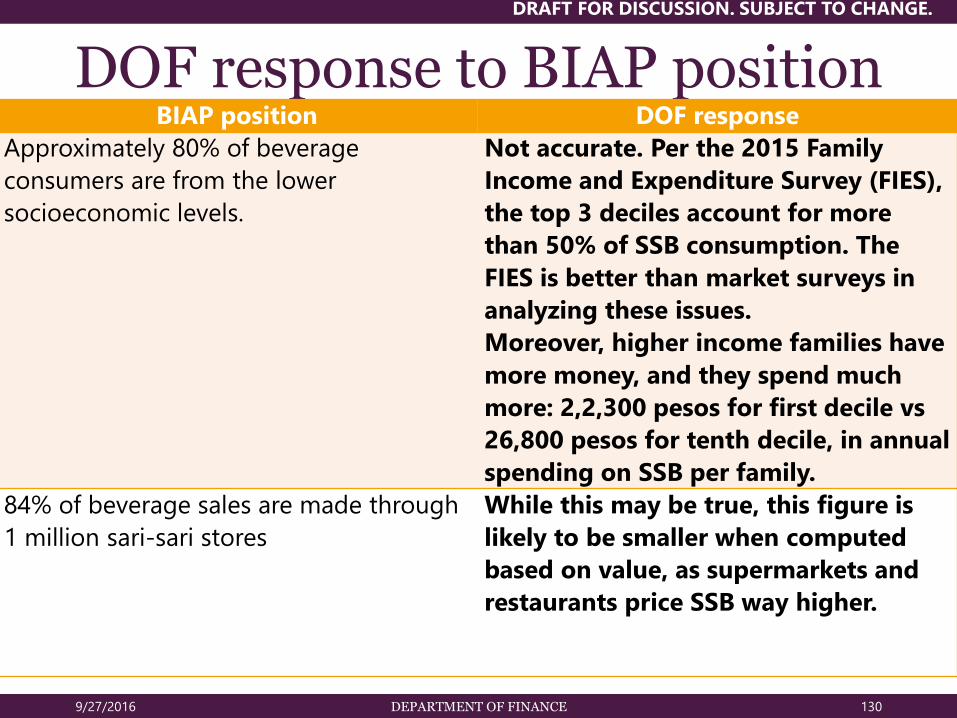
DRAFT FOR DISCUSSION. SUBJECT TO CHANGE.
DOF response to BIAP positionBIAP position DOF response
Approximately 80% of beverage
consumers are from the lower
socioeconomic levels.
Not accurate. Per the 2015 Family
Income and Expenditure Survey (FIES),
the top 3 deciles account for more
than 50% of SSB consumption. The
FIES is better than market surveys in
analyzing these issues.
Moreover, higher income families have
more money, and they spend much
more: 2,2,300 pesos for first decile vs
26,800 pesos for tenth decile, in annual
spending on SSB per family.
84% of beverage sales are made through
1 million sari-sari stores
While this may be true, this figure is
likely to be smaller when computed
based on value, as supermarkets and
restaurants price SSB way higher.
9/27/2016 DEPARTMENT OF FINANCE 130

DRAFT FOR DISCUSSION. SUBJECT TO CHANGE.
DOF response to BIAP positionBIAP position DOF response
Approximately 40% of sari-sari store
income comes from beverage
Per data from FEMSA, almost 70% of
sari-sari stores’ sales are not SSB, and
with higher take home pay from the
personal income tax reduction,
consumers can purchase more SSB and
non-SSB. It is high time sari-sari store
also diversify their products towards
healthier options.
Significantly harm the economy
PHP 10 to 20 per liter excise tax will
translate into a VAT equivalent from 12%
to 55-95%. Additionally, in the proposed
SSB tax, the PHP 10 per liter is equivalent
to PHP 100 per kilogram of sugar, which
is 20 times bigger than the Department
of Finance’s initial proposal.
DOF does not support the 20-peso tax.
The VAT equivalent is not accurate.
Since the VAT is 12% flat, how can that
lead to 95% (an exaggeration). The
current proposal on SSB cannot be
compared with the original proposal
on sugar. Please look at the rationale
for each type of tax.
9/27/2016 DEPARTMENT OF FINANCE 131

DRAFT FOR DISCUSSION. SUBJECT TO CHANGE.
DOF response to BIAP positionBIAP position DOF response
The proposed SSB tax rate would be 5
times that of Mexico, 16 times that of
Thailand, and 9 times that of France –
countries that have more developed
economies than ours.
These countries are richer and have the
ability to pay for their healthcare and
other national priorities. For the
Philippines, we cannot afford so we
have to take serious preventive
measures.
The beverage industry has a combined
annual revenue of approximately PHP 170
billion. According to the Department of
Finance, the government estimates that
they will raise PHP 47 billion from the
sweetened beverage tax, which is nearly
30% of the industry’s combined annual
revenue.
While this may be true, the sin tax also
raised the excise tax far higher than
revenues, so this is not unique, but
more importantly, lower income taxes
a fast-growing economy, and product
diversification should ensure growing
demand for these products.
9/27/2016 DEPARTMENT OF FINANCE 132

DRAFT FOR DISCUSSION. SUBJECT TO CHANGE.
DOF response to BIAP positionBIAP position DOF response
For the industry, the price increase would
cause SSB volumes to decline between
33% and 75% shifting volume to informal
beverages that are unregulated.
This is very unlikely as income effect is
not factored in, as in the BIAP
commissioned UAP study. Please also
consider that the following will
increase demand:
1. Fast growing economy
2. Fast growing population
3. Falling poverty
4. Rising income and employment
5. Lower income taxes
6. Product diversification
As the economy grows, more informal
establishments will be taxed.
9/27/2016 DEPARTMENT OF FINANCE 133

DRAFT FOR DISCUSSION. SUBJECT TO CHANGE.
DOF response to BIAP positionBIAP position DOF response
This will substantially reduce sugar
purchases adversely affecting sugar
farmers
60% of sugar is used commercially to
produce products and only 34% is used
for SSB, and imported high fructose
corn syrup (HFCS) is actually the main
ingredient is most SSB so the industry
cannot use farmers as shield.
Withdrawals of refined sugar decline
as HFCS imports increase, even if
refined sugar consumption trends are
still rising. In fact, the sugar bloc in the
lower house voted for the SSB tax.
Moreover, funds are being earmarked
for the sector to promote their interest
(around 7 billion pesos annually).
9/27/2016 DEPARTMENT OF FINANCE 134

DRAFT FOR DISCUSSION. SUBJECT TO CHANGE.
DOF response to BIAP positionBIAP position DOF response
The proposed SSB could imperil over
130,000 direct and indirect jobs across all
business activities of the beverage
industry.
This is unlikely as even before SSB tax
was proposed, there are plans to shift
from labor to capital production. In
Mexico, the SSB tax was conveniently
used as excuse to cut jobs. Moreover,
the following will increase demand:
1. Fast growing economy
2. Fast growing population
3. Falling poverty
4. Rising income and employment
5. Lower income taxes
6. Product diversification
9/27/2016 DEPARTMENT OF FINANCE 135

DRAFT FOR DISCUSSION. SUBJECT TO CHANGE.
DOF response to BIAP positionBIAP position DOF response
The resulting drop in business volume
and job losses will lead to the reduction
of tax collection from corporate income,
personal income, and value added tax.
This will offset any expected revenue
from the SSB tax.
Based on above explanation, this
drastic fall in taxes is an exaggeration.
Please also consider the macro and
income effect when projecting
demand. These are conveniently not
included in the BIAP-commissioned
UAP study.
This proposed tax will inevitably dissuade
local and international investors.
Investors who come to the country do
not base their decision on SSB tax. In
fact, more investors will come in after
tax reform is passed the ‘Build Build
Build’ is implemented.
9/27/2016 DEPARTMENT OF FINANCE 136

DRAFT FOR DISCUSSION. SUBJECT TO CHANGE.
DOF response to BIAP positionBIAP position DOF response
Not addressed the issue of obesity and
diabetes in the Philippines
There is no local study that directly
correlates sweetened drinks as direct
causative factors to diabetes or obesity.
Humans are humans everywhere in the
planet. All are homo sapiens. There is
no compelling need to have a local
study. But we will endeavor to have
one.
In fact, 28 million Filipinos are under-
nourished, and this public health problem
has negative implications to health like
insulin resistance, dyslipidemia and
others.
On the other side, there are 31 million
over-nourished Filipinos, 1 million
dialysis patients, and up to 5 million
diabetics, spending over 300 billion
pesos per year in health. But more
importantly, we do not tell these
under-nourished Filipinos to take more
SSB so they can be healthier.
9/27/2016 DEPARTMENT OF FINANCE 137

DRAFT FOR DISCUSSION. SUBJECT TO CHANGE.
DOF response to BIAP positionBIAP position DOF response
The proposed tax is discriminatory. It
applies to a single category, manufactured
and pre-packaged beverages, when in fact,
there are other categories that contribute to
obesity and diabetes.
60% of sugar is used commercially to
produce products and only 34% is used
for SSB, and imported high fructose
corn syrup (HFCS) is actually the main
ingredient is most SSB so the industry
cannot use farmers as shield.
Withdrawals of refined sugar decline
as HFCS imports increase, even if
refined sugar consumption trends are
still rising. In fact, the sugar bloc in the
lower house voted for the SSB tax.
Moreover, funds are being earmarked
for the sector to promote their interest
(around 7 billion pesos annually).
9/27/2016 DEPARTMENT OF FINANCE 138
BIAP position DOF response
The proposed tax is discriminatory. It
applies to a single category, manufactured
and pre-packaged beverages, when in fact,
there are other categories that contribute to
obesity and diabetes.
For a non-essential with adverse health
effect, this is the right public policy. This
is also done in other products like
alcohol, tobacco, oil, mining, coal, etc.
SSBs account for just 2.1% of daily food
intake in the Philippines.
This is not accurate. The NNS show the
following:
Sugar and syrup: 1.4%
Miscellaneous which mostly cover SSB:
4%
Milk and milk products: 5.3%
Total: 10.7%, way above the 5%
recommended by WHO for healthy
living. Note also that given our “instant”
lifestyle, falling ‘sugar and syrup’ and
being offset by rising purchase of SSB.
The incidence of obesity and overweight is
prevalent in the higher income classes,
whereas the proposed tax will mostly affect
those in the lower socioeconomic segment.
Not accurate. The incidence of SSB
purchase is much higher among the
upper deciles. In fact, the top 3 deciles
account for over 50% of SSB.

DRAFT FOR DISCUSSION. SUBJECT TO CHANGE.
DOF response to BIAP positionBIAP position DOF response
This will substantially reduce sugar
purchases adversely affecting sugar
farmers
60% of sugar is used commercially to
produce products and only 34% is used
for SSB, and imported high fructose
corn syrup (HFCS) is actually the main
ingredient is most SSB so the industry
cannot use farmers as shield.
Withdrawals of refined sugar decline
as HFCS imports increase, even if
refined sugar consumption trends are
still rising. In fact, the sugar bloc in the
lower house voted for the SSB tax.
Moreover, funds are being earmarked
for the sector to promote their interest
(around 7 billion pesos annually).
9/27/2016 DEPARTMENT OF FINANCE 139
BIAP position DOF response
80% of beverages is consumed by the lower
income classes – those who are the least affected
by obesity and diabetes.
Not accurate. Per the 2015 Family Income and
Expenditure Survey (FIES), the top 3 deciles
account for more than 50% of SSB
consumption. The FIES is better than market
surveys in analyzing these issues.
Moreover, higher income families have more
money, and they spend much more: 2,2,300
pesos for first decile vs 26,800 pesos for tenth
decile, in annual spending on SSB per family.
Sugar is indispensable in meal planning and food
production. According to the FNRI, the Philippine
mean daily per capita of sugar and syrup
consumption in 2013 was 12 grams, which is
compliant with the new World Health
Organization’s guideline recommending a
consumption level of free sugars of less than 50
grams.
This is not accurate. The NNS show the
following:
Sugar and syrup: 1.4%
Miscellaneous which mostly cover SSB: 4%
Milk and milk products: 5.3%
Total: 10.7%, way above the 5% recommended
by WHO for healthy living. Note also that
given our “instant” lifestyle, falling sugar and
syrup and being offset by rising purchase of
SSB.
The promotion of an active lifestyle is more
effective measure in curbing obesity and diabetes
than taxing a particular food or beverage
Studies show that this is necessary but not
sufficient. Both tax and non-tax measures are
needed.

DRAFT FOR DISCUSSION. SUBJECT TO CHANGE.
Why did Denmark and Finland repeal their SSB tax?
DENMARK
• The weak tax administration was the primary reason why Denmark’s excise
tax on soft drinks failed.
• This resulted in leakages in the system. There were rampant illegal soft
drink sales and people tend to cross the border to buy cheaper soft drinks
from other countries such as Germany, which does not impose excise tax
on SSB.
FINLAND
• The excise tax imposed on soft drinks remains in force in Finland, while,
the excise tax imposed on sweets, i.e. candy and chocolates, was
abolished by the Finnish government following the pressure from the
European Commission.
8/30/2017 DEPARTMENT OF FINANCE 140

DRAFT FOR DISCUSSION. SUBJECT TO CHANGE.
Claim: Taxing sugary beverages will not solve the obesity and diabetes problem.
• Sugary beverages are a major contributor to obesity and diabetes, and their consumption must be reduced using a variety of initiatives, including taxes (WHO 2015, World Cancer Research Fund International 2015).
• Taxation is one of the most effective ways to reduce sugary beverage consumption because they reach the entire population and are easily implemented, requiring way fewer resources than they produce (Escobar 2013, Long, Gortmaker, et. al.)
8/30/2017 DEPARTMENT OF FINANCE 141

DRAFT FOR DISCUSSION. SUBJECT TO CHANGE.
Claim: The body needs sugar for energy.
• While this is true, the body does not need the added sugar from SSBs. SSBs are a major source of discretionary calories (a.k.a unnecessary calories) in a person’s daily diet.
• As healthier source of sugar can come from core foods such as rice, pasta, etc.
• Justifying that SSBs are a viable substitute to provide energy is a poor excuse to meet the dietary requirements of an individual; and as such, effectively denying a person’s right to nutritious and safe food in order to be healthy and productive adults (DOH position paper on SSB).
8/30/2017 DEPARTMENT OF FINANCE 142

DRAFT FOR DISCUSSION. SUBJECT TO CHANGE.
Claim: Lifestyle must be regulated, not taxed.
• There is a growing evidence that when taxation policies are implemented alongside other policies (e.g., subsidy and regulatory policies), there is considerable potential for promoting healthier diets, and is an effective mechanism to reduce potential substitution for unhealthier options.
• Steps are being initiated to develop complementary non-tax measures to protect the health gains of SSB tax.
8/30/2017 DEPARTMENT OF FINANCE 143

DRAFT FOR DISCUSSION. SUBJECT TO CHANGE.
Sugar content and potential price changes of common SSBs
8/30/2017 DEPARTMENT OF FINANCE 144

DRAFT FOR DISCUSSION. SUBJECT TO CHANGE.

Manufacturer:The Coca-Cola Company
Product: Coke regular
(330mL)
8/30/2017 DEPARTMENT OF FINANCE 146
Sugar content: 34.5g or 21.7ml
Sugar content per ml volume:
6.6 percent
Current
price (PHP)
Estimated new
price (PHP)
Percent
increase
22.0 25.6 16.9
Serving size 330mL
Servings per
container
1
Calories 138 kcal
Total fat 0g
Protein 0g
Total carbohydrates 34.5g
Sugar 34.5g
Sodium 16mg
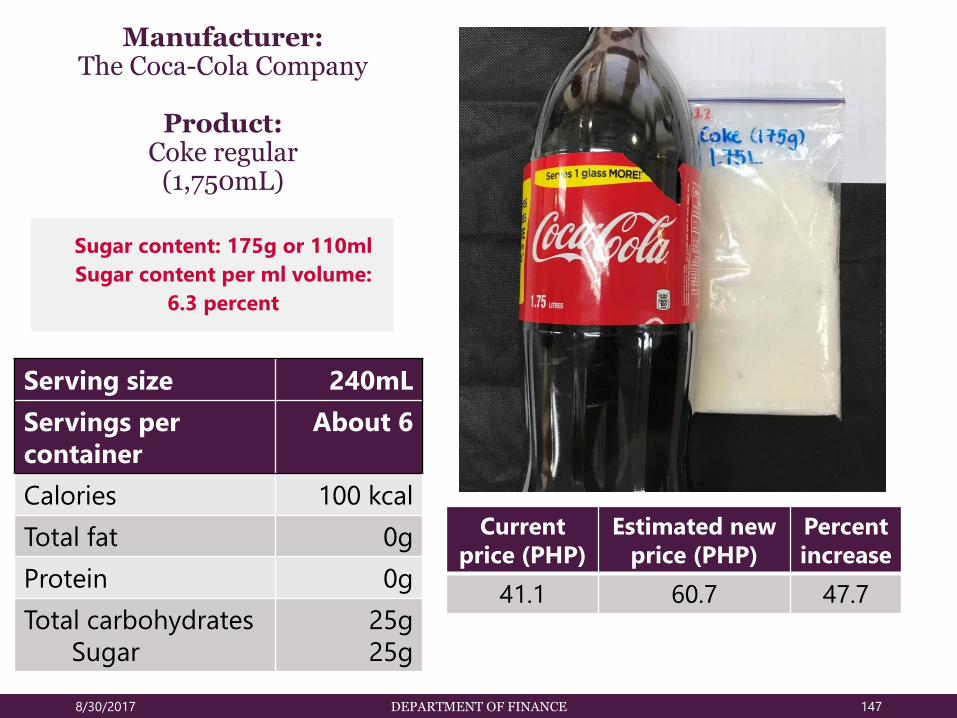
8/30/2017 DEPARTMENT OF FINANCE 147
Manufacturer:The Coca-Cola Company
Product: Coke regular
(1,750mL)
Current
price (PHP)
Estimated new
price (PHP)
Percent
increase
41.1 60.7 47.7
Serving size 240mL
Servings per
container
About 6
Calories 100 kcal
Total fat 0g
Protein 0g
Total carbohydrates
Sugar
25g
25g
Sugar content: 175g or 110ml
Sugar content per ml volume:
6.3 percent

DRAFT FOR DISCUSSION. SUBJECT TO CHANGE.
What will happen if you boil soft drinks?
8/30/2017 DEPARTMENT OF FINANCE 148
Source: Youtube
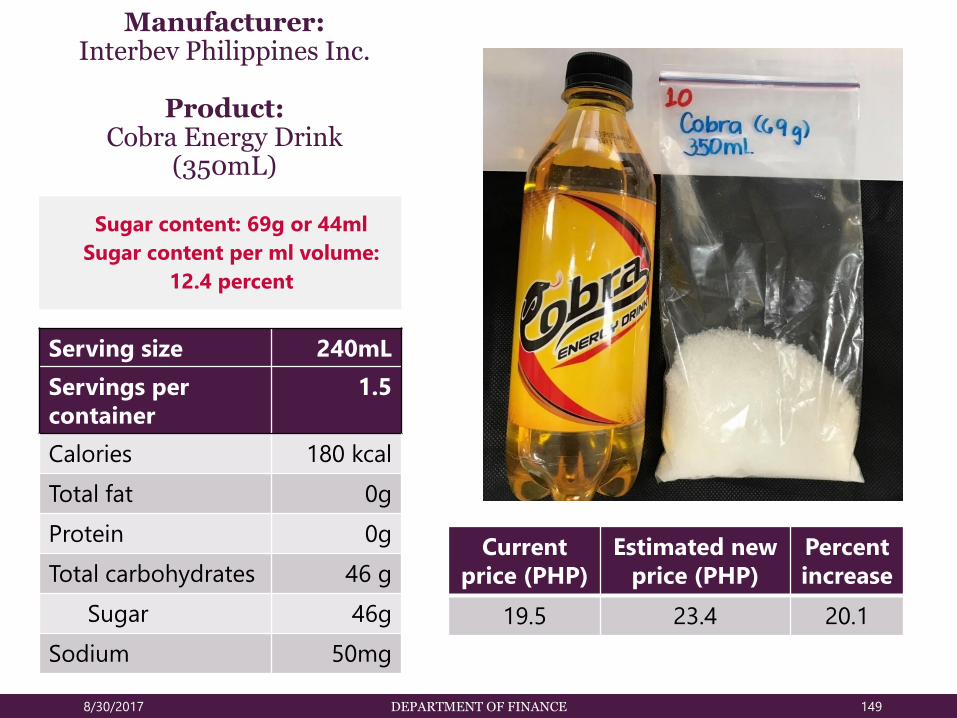
Manufacturer:Interbev Philippines Inc.
Product: Cobra Energy Drink
(350mL)
8/30/2017 DEPARTMENT OF FINANCE 149
Current
price (PHP)
Estimated new
price (PHP)
Percent
increase
19.5 23.4 20.1
Serving size 240mL
Servings per
container
1.5
Calories 180 kcal
Total fat 0g
Protein 0g
Total carbohydrates 46 g
Sugar 46g
Sodium 50mg
Sugar content: 69g or 44ml
Sugar content per ml volume:
12.4 percent
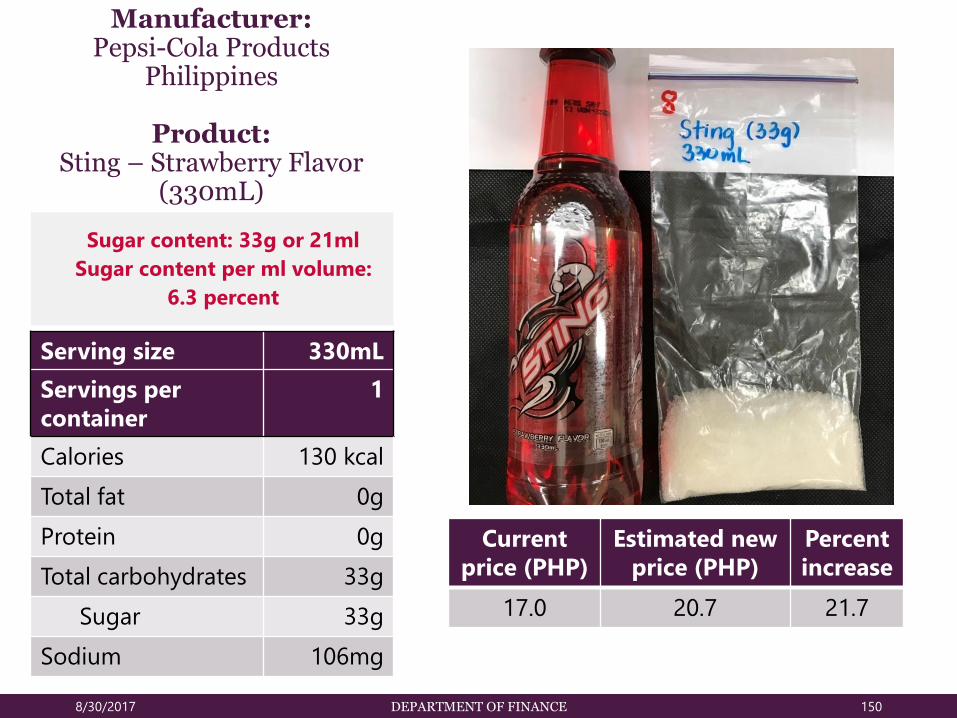
Manufacturer:Pepsi-Cola Products
Philippines
Product: Sting – Strawberry Flavor
(330mL)
8/30/2017 DEPARTMENT OF FINANCE 150
Current
price (PHP)
Estimated new
price (PHP)
Percent
increase
17.0 20.7 21.7
Serving size 330mL
Servings per
container
1
Calories 130 kcal
Total fat 0g
Protein 0g
Total carbohydrates 33g
Sugar 33g
Sodium 106mg
Sugar content: 33g or 21ml
Sugar content per ml volume:
6.3 percent

Manufacturer:Zesto Corporation
Product: BIG 250 Orange Juice
(250mL)
8/30/2017 DEPARTMENT OF FINANCE 151
Current
price (PHP)
Estimated new
price (PHP)
Percent
increase
6.0 8.8 46.7
Serving size 250mL
Servings per
container
1
Calories 100 kcal
Total fat 0g
Protein 0g
Total carbohydrates 25g
Sugar 25g
Sodium 25mg
Sugar content: 25g or 16ml
Sugar content per ml volume:
6.3 percent

Manufacturer:Universal Robina Corp.
Product: C2 – Green Tea Apple
Flavor (355mL)
8/30/2017 DEPARTMENT OF FINANCE 152
Current
price (PHP)
Estimated new
price (PHP)
Percent
increase
15.8 19.7 25.2
Serving size 200mL
Servings per
container
About 2
Calories 100 kcal
Total fat 0g
Protein 0g
Total carbohydrates 25g
Sugar 25g
Sodium 35mg
Sugar content: 46g or 29ml
Sugar content per ml volume:
8.2 percent

Manufacturer:Coca-Cola FEMSA,
Philippines, Inc.
Product: Minute Maid Fresh Orange
Juice Drink (250mL)
8/30/2017 DEPARTMENT OF FINANCE 153
Current
price (PHP)
Estimated new
price (PHP)
Percent
increase
12.1 14.9 23.1
Serving size 250mL
Servings per container 1
Calories 76 kcal
Total fat 0g
Protein 0g
Total carbohydrates 19g
Sugar 19g
Sodium 77mg
Sugar content: 19g or 12ml
Sugar content per ml volume:
4.8 percent

Manufacturer:Pepsi-Cola Products
Philippines
Product: Gatorade Sports Drink
Blue Bolt (500mL)
8/30/2017 DEPARTMENT OF FINANCE 154
Current
price (PHP)
Estimated new
price (PHP)
Percent
increase
24.7 28.7 16.1
Serving size 200mL
Servings per container 2.5
Calories 50 kcal
Total fat 0g
Protein 0g
Total carbohydrates 12g
Sugar 12g
Sodium 90mg
Sugar content: 30g or 19ml
Sugar content per ml volume:
3.8 percent
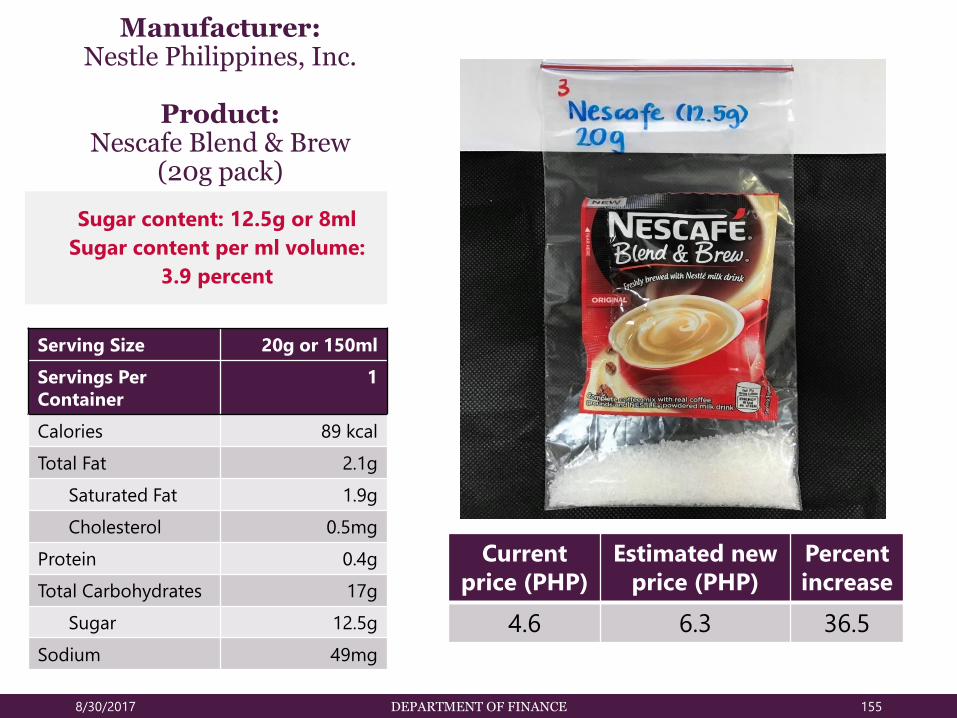
Manufacturer:Nestle Philippines, Inc.
Product: Nescafe Blend & Brew
(20g pack)
8/30/2017 DEPARTMENT OF FINANCE 155
Current
price (PHP)
Estimated new
price (PHP)
Percent
increase
4.6 6.3 36.5
Serving Size 20g or 150ml
Servings Per
Container
1
Calories 89 kcal
Total Fat 2.1g
Saturated Fat 1.9g
Cholesterol 0.5mg
Protein 0.4g
Total Carbohydrates 17g
Sugar 12.5g
Sodium 49mg
Sugar content: 12.5g or 8ml
Sugar content per ml volume:
3.9 percent

Manufacturer:Mondelez International
Product: Tang Orange (25g pack)
8/30/2017 DEPARTMENT OF FINANCE 156
Current
price
(PHP)
Estimated
new price
(PHP)
Percent
increase
9.0 19.2 113.7
Serving size 5g or 200ml
Servings per container 5
Calories 20 kcal
Total fat 0g
Protein 0g
Total carbohydrates 5g
Total sugar 3g
Dietary fiber <1 g
Sodium 40mg
Sugar content: 15g or 10ml
Sugar content per ml volume:
0.9 percent

Manufacturer:Nestle Philippines, Inc.
Product: Nestea Lemon Blend Iced Tea (25g pack)
8/30/2017 DEPARTMENT OF FINANCE 157
Current
price (PHP)
Estimated new
price (PHP)
Percent
increase
9.5 19.7 107.2
Serving size 5g
Servings per container 5
Calories 19 kcal
Total fat 0g
Protein 0.08g
Total carbohydrates 4.7g
Sugar 3.9g
Sodium 2mg
Sugar content: 20g or 12ml
Sugar content per ml volume:
1.2 percent

8/30/2017 DEPARTMENT OF FINANCE 158
Nestea litro pack Two 500ml Nestea bottles
Current price (PHP) 8.0 38 = 19 x 2
Estimated new price
(PHP)19.2 49.2 = 24.6 x 2
Percent increase 140 29.5
• Litro packs are primarily consumed at home, where water costs almost zero.
• When compared to pre-packaged bottles, litro packs still represent significant
savings, despite the substantially larger price increase as a percent of SRP.

Manufacturer:Magnolia
Product: Fresh milk (250 ml)
8/30/2017 DEPARTMENT OF FINANCE 159
Current
price
(PHP)
Estimated
new price
(PHP)
Percent
increase
36.25 43.4 19.72
Serving size 250ml
Servings per container 1
Calories 170 cal
Total fat 9g
Protein 9g
Total carbohydrates
Sugar
12g
12g
Sodium 125mg
Cholesterol 31 mg
Potassium 400 mg
Sugar content: 12g or 8ml
Sugar content per ml volume:
3.2 percent
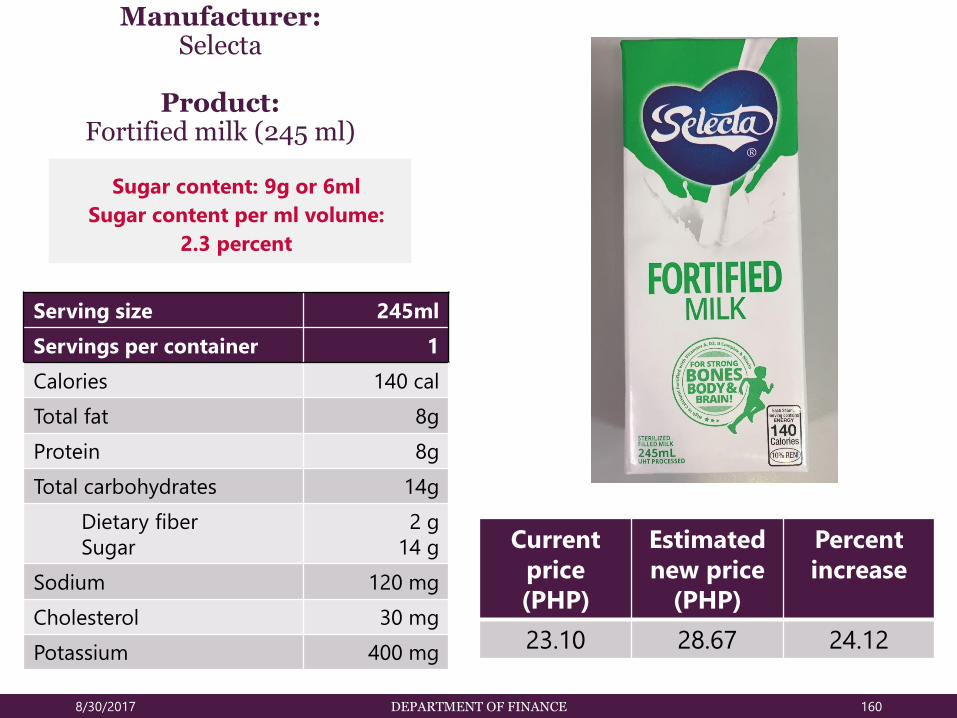
Manufacturer:Selecta
Product: Fortified milk (245 ml)
8/30/2017 DEPARTMENT OF FINANCE 160
Current
price
(PHP)
Estimated
new price
(PHP)
Percent
increase
23.10 28.67 24.12
Serving size 245ml
Servings per container 1
Calories 140 cal
Total fat 8g
Protein 8g
Total carbohydrates 14g
Dietary fiber
Sugar
2 g
14 g
Sodium 120 mg
Cholesterol 30 mg
Potassium 400 mg
Sugar content: 9g or 6ml
Sugar content per ml volume:
2.3 percent

Manufacturer:Nestle
Product: Milo (180 ml)
8/30/2017 DEPARTMENT OF FINANCE 161
Current
price
(PHP)
Estimated
new price
(PHP)
Percent
increase
21.50 26.88 25
Serving size 180ml
Servings per container 1
Calories 132 cal
Total fat 4.4 g
Protein 4 g
Total carbohydrates
Sugars
19 g
14.4 g
Sodium 118 mg
Cholesterol 3 mg
Potassium 400 mg
Sugar content: 14.4 g or 9ml
Sugar content per ml volume:
5 percent

DRAFT FOR DISCUSSION. SUBJECT TO CHANGE.
Summary price impact
8/30/2017 DEPARTMENT OF FINANCE 162
DRAFT FOR DISCUSSION. SUBJECT TO CHANGE.
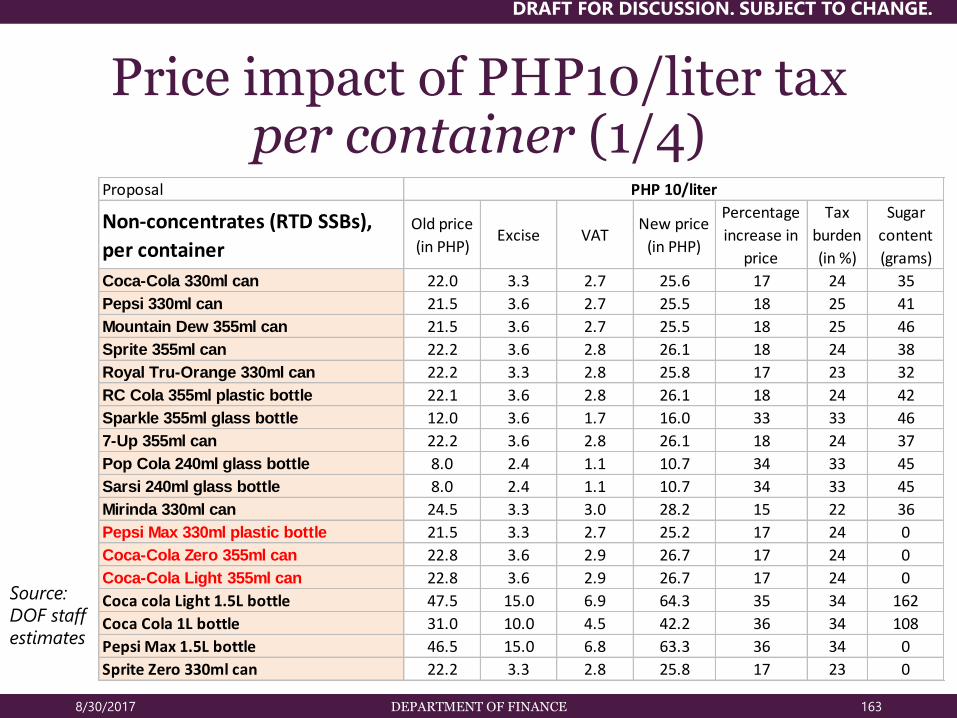
DRAFT FOR DISCUSSION. SUBJECT TO CHANGE.
Price impact of PHP10/liter taxper container (1/4)
8/30/2017 DEPARTMENT OF FINANCE 163
Source:
DOF staff
estimates
Proposal
Non-concentrates (RTD SSBs),
per container
Old price
(in PHP)Excise VAT
New price
(in PHP)
Percentage
increase in
price
Tax
burden
(in %)
Sugar
content
(grams)
Coca-Cola 330ml can 22.0 3.3 2.7 25.6 17 24 35
Pepsi 330ml can 21.5 3.6 2.7 25.5 18 25 41
Mountain Dew 355ml can 21.5 3.6 2.7 25.5 18 25 46
Sprite 355ml can 22.2 3.6 2.8 26.1 18 24 38
Royal Tru-Orange 330ml can 22.2 3.3 2.8 25.8 17 23 32
RC Cola 355ml plastic bottle 22.1 3.6 2.8 26.1 18 24 42
Sparkle 355ml glass bottle 12.0 3.6 1.7 16.0 33 33 46
7-Up 355ml can 22.2 3.6 2.8 26.1 18 24 37
Pop Cola 240ml glass bottle 8.0 2.4 1.1 10.7 34 33 45
Sarsi 240ml glass bottle 8.0 2.4 1.1 10.7 34 33 45
Mirinda 330ml can 24.5 3.3 3.0 28.2 15 22 36
Pepsi Max 330ml plastic bottle 21.5 3.3 2.7 25.2 17 24 0
Coca-Cola Zero 355ml can 22.8 3.6 2.9 26.7 17 24 0
Coca-Cola Light 355ml can 22.8 3.6 2.9 26.7 17 24 0
Coca cola Light 1.5L bottle 47.5 15.0 6.9 64.3 35 34 162
Coca Cola 1L bottle 31.0 10.0 4.5 42.2 36 34 108
Pepsi Max 1.5L bottle 46.5 15.0 6.8 63.3 36 34 0
Sprite Zero 330ml can 22.2 3.3 2.8 25.8 17 23 0
PHP 10/liter

DRAFT FOR DISCUSSION. SUBJECT TO CHANGE.
Price impact of PHP10/liter taxper container (2/4)
8/30/2017 DEPARTMENT OF FINANCE 164
Proposal
Non-concentrates (RTD SSBs),
per container
Old price
(in PHP)Excise VAT
New price
(in PHP)
Percentage
increase in
price
Tax
burden
(in %)
Sugar
content
(grams)
Cobra 350ml plastic bottle 19.5 3.5 2.5 23.4 20 26 69
Gatorade 355ml plastic bottle 24.7 3.6 3.1 28.7 16 23 30
Sting 330ml plastic bottle 17.0 3.3 2.2 20.7 22 27 33
Del Monte 240ml can 25.0 2.4 3.0 27.7 11 19 24
Zest-O 200ml pouch 5.6 2.0 0.8 7.8 40 36 20
Tropicana Twister 355ml plastic bottle 23.5 3.6 2.9 27.5 17 24 36
Sun Glo 200ml pouch 5.6 2.0 0.8 7.8 40 36 25
Big 250 250ml pouch 6.0 2.5 0.9 8.8 47 39 25
Plus! 250ml pouch 6.0 2.5 0.9 8.8 47 39 25
Minute Maid 250ml plastic bottle 12.1 2.5 1.6 14.9 23 27 19
Gina 250ml can 27.7 2.5 3.3 30.5 10 19 30
Sunkist 235ml pouch 16.1 2.4 2.0 18.7 16 23 19
PHP 10/liter

DRAFT FOR DISCUSSION. SUBJECT TO CHANGE.
Price impact of PHP10/liter taxper container (3/4)
8/30/2017 DEPARTMENT OF FINANCE 165
Proposal
Non-concentrates (RTD SSBs),
per container
Old price
(in PHP)Excise VAT
New price
(in PHP)
Percentage
increase in
price
Tax
burden
(in %)
Sugar
content
(grams)
C2 355ml plastic bottle 15.8 3.6 2.1 19.7 25 29 46
Lipton 200ml plastic bottle 18.8 2.0 2.2 21.0 12 20 15
Real Leaf 250ml plastic bottle 19.0 2.5 2.3 21.8 15 22 26
ONE 355ml plastic bottle 18.5 3.6 2.4 22.5 21 27 27
PHP 10/liter

DRAFT FOR DISCUSSION. SUBJECT TO CHANGE.
Price impact of PHP10/liter taxper container (4/4)
8/30/2017 DEPARTMENT OF FINANCE 166
Proposal
Concentrates, per containerOld price
(in PHP)Excise VAT
New
price (in
PHP)
Percentage
increase in
price
Tax
burden
(in %)
Sugar
content
(grams)
Magnolia Fruit Drink Lemonade 400gram big sachet 46.0 41.4 9.9 87.4 90 53 322
Swiss Miss 31gram sachet 14.0 1.8 1.7 14.5 4 14 16
Tang 25gram sachet 9.0 10.0 2.2 19.2 114 58 20
Eight O'Clock 25gram sachet 8.5 12.0 2.4 21.0 147 64 24
Nestea 25gram sachet 9.5 10.0 2.2 19.7 107 57 20
Sunquick 850ml bottle 243.0 82.8 36.0 309.7 27 30 644
SM Bonus - Dalandan 350ml bottle 86.0 28.8 12.7 109.0 27 30 240
SM Bonus Honey Calamansi 350ml bottle 80.0 28.8 12.0 103.7 30 31 228
Nesfruta 25gram sachet 9.3 10.0 2.2 19.5 110 58 21
Eight O'Clock Iced Tea 25gram sachet 9.5 10.0 2.2 19.7 107 57 20
Extra Joss 4.6gram sachet 4.9 3.0 0.9 7.7 58 44 0
Lipton Iced Tea 25gram sachet 9.0 10.0 2.2 19.2 114 58 20
Sun Glo Mixers 25gram sachet 9.0 12.0 2.4 21.5 139 63 19
Eight O'Clock Ponkana 25gram sachet 10.3 10.0 2.3 20.4 98 55 21
Nescafe Blend and Brew 20gram sachet 4.6 1.5 0.7 5.8 26 29 13
PHP 10/liter

DRAFT FOR DISCUSSION. SUBJECT TO CHANGE.
Price impact of PHP5/liter taxper container (1/4)
8/30/2017 DEPARTMENT OF FINANCE 167
Source:
DOF staff
estimates
Proposal
Non-concentrates (RTD SSBs),
per container
Old price
(in PHP)Excise VAT
New
price (in
PHP)
Percentage
increase in
price
Tax
burden
(in %)
Sugar
content
(grams)
Coca-Cola 330ml can 22.0 1.7 2.5 23.8 8 18 35
Pepsi 330ml can 21.5 1.8 2.5 23.5 9 18 41
Mountain Dew 355ml can 21.5 1.8 2.5 23.5 9 18 46
Sprite 355ml can 22.2 1.8 2.6 24.1 9 18 38
Royal Tru-Orange 330ml can 22.2 1.7 2.6 24.0 8 18 32
RC Cola 355ml plastic bottle 22.1 1.8 2.6 24.1 9 18 42
Sparkle 355ml glass bottle 12.0 1.8 1.5 14.0 17 23 46
7-Up 355ml can 22.2 1.8 2.6 24.1 9 18 37
Pop Cola 240ml glass bottle 8.0 1.2 1.0 9.3 17 24 45
Sarsi 240ml glass bottle 8.0 1.2 1.0 9.3 17 24 45
Mirinda 330ml can 24.5 1.7 2.8 26.3 8 17 36
Pepsi Max 330ml plastic bottle 21.5 1.7 2.5 23.3 9 18 0
Coca-Cola Zero 355ml can 22.8 1.8 2.7 24.7 9 18 0
Coca-Cola Light 355ml can 22.8 1.8 2.7 24.7 9 18 0
Coca cola Light 1.5L bottle 47.5 7.5 6.0 55.9 18 24 162
Coca Cola 1L bottle 31.0 5.0 3.9 36.6 18 24 108
Pepsi Max 1.5L bottle 46.5 7.5 5.9 54.9 18 24 0
Sprite Zero 330ml can 22.2 1.7 2.5 24.0 8 18 0
PHP 5/liter

DRAFT FOR DISCUSSION. SUBJECT TO CHANGE.
Price impact of PHP5/liter taxper container (2/4)
8/30/2017 DEPARTMENT OF FINANCE 168
Proposal
Non-concentrates (RTD SSBs),
per container
Old price
(in PHP)Excise VAT
New
price (in
PHP)
Percentage
increase in
price
Tax
burden
(in %)
Sugar
content
(grams)
Cobra 350ml plastic bottle 19.5 2.3 2.3 21.5 10 28 69
Gatorade 355ml plastic bottle 24.7 2.9 2.9 26.7 8 28 30
Sting 330ml plastic bottle 17.0 2.0 2.0 18.8 11 28 33
Del Monte 240ml can 25.0 2.8 2.8 26.3 5 15 24
Zest-O 200ml pouch 5.6 0.7 0.7 6.7 20 26 20
Tropicana Twister 355ml plastic bottle 23.5 2.7 2.7 25.5 8 18 36
Sun Glo 200ml pouch 5.6 0.7 0.7 6.7 20 26 25
Big 250 250ml pouch 6.0 0.8 0.8 7.4 24 28 25
Plus! 250ml pouch 6.0 0.8 0.8 7.4 23 28 25
Minute Maid 250ml plastic bottle 12.1 1.4 1.4 13.5 12 20 19
Gina 250ml can 27.7 3.1 3.1 29.1 5 15 30
Sunkist 235ml pouch 16.1 1.9 1.9 17.4 8 17 19
PHP 5/liter

DRAFT FOR DISCUSSION. SUBJECT TO CHANGE.
Price impact of PHP5/liter taxper container (3/4)
8/30/2017 DEPARTMENT OF FINANCE 169
Proposal
Non-concentrates (RTD SSBs),
per container
Old price
(in PHP)Excise VAT
New
price (in
PHP)
Percentage
increase in
price
Tax
burden
(in %)
Sugar
content
(grams)
C2 355ml plastic bottle 15.8 1.8 1.9 17.7 13 21 46
Lipton 200ml plastic bottle 18.8 1.0 2.1 19.9 6 16 15
Real Leaf 250ml plastic bottle 19.0 1.3 2.2 20.4 7 17 26
ONE 355ml plastic bottle 18.5 1.8 2.2 20.5 11 19 27
PHP 5/liter

DRAFT FOR DISCUSSION. SUBJECT TO CHANGE.
Price impact of PHP5/liter taxper container (4/4)
8/30/2017 DEPARTMENT OF FINANCE 170
Proposal
Concentrates, per containerOld price (in
PHP)Excise VAT
New price
(in PHP)
Percentage
increase in
price
Tax
burden (in
%)
Sugar
content
(grams)
Magnolia Fruit Drink Lemonade 400gram big sachet 46 20.7 7.4 69.18 20 26 322
Swiss Miss 31gram sachet 14 0.9 1.6 15.01 3 13 16
Tang 25gram sachet 9 5 1.6 14.60 25 29 20
Eight O'Clock 25gram sachet 8.5 6 1.6 15.22 32 32 24
Nestea 25gram sachet 9.5 5 1.6 15.10 24 28 20
Sunquick 850ml bottle 243 41.4 31.0 289.37 19 25 644
SM Bonus - Dalandan 350ml bottle 86 14.4 10.9 102.13 19 25 240
SM Bonus Honey Calamansi 350ml bottle 80 14.4 10.3 96.13 20 26 228
Nesfruta 25gram sachet 9.25 5 1.6 14.85 24 28 21
Eight O'Clock Iced Tea 25gram sachet 9.5 5 1.6 15.10 24 28 20
Extra Joss 4.6gram sachet 4.875 1.5 0.7 6.56 14 22 0
Lipton Iced Tea 25gram sachet 9 5 1.6 14.60 25 29 20
Sun Glo Mixers 25gram sachet 9 6 1.7 15.72 30 31 19
Eight O'Clock Ponkana 25gram sachet 10.3 5 1.7 15.90 22 27 21
Nescafe Blend and Brew 20gram sachet 4.6 0.75 0.6 5.44 7 17 13
PHP 5/liter
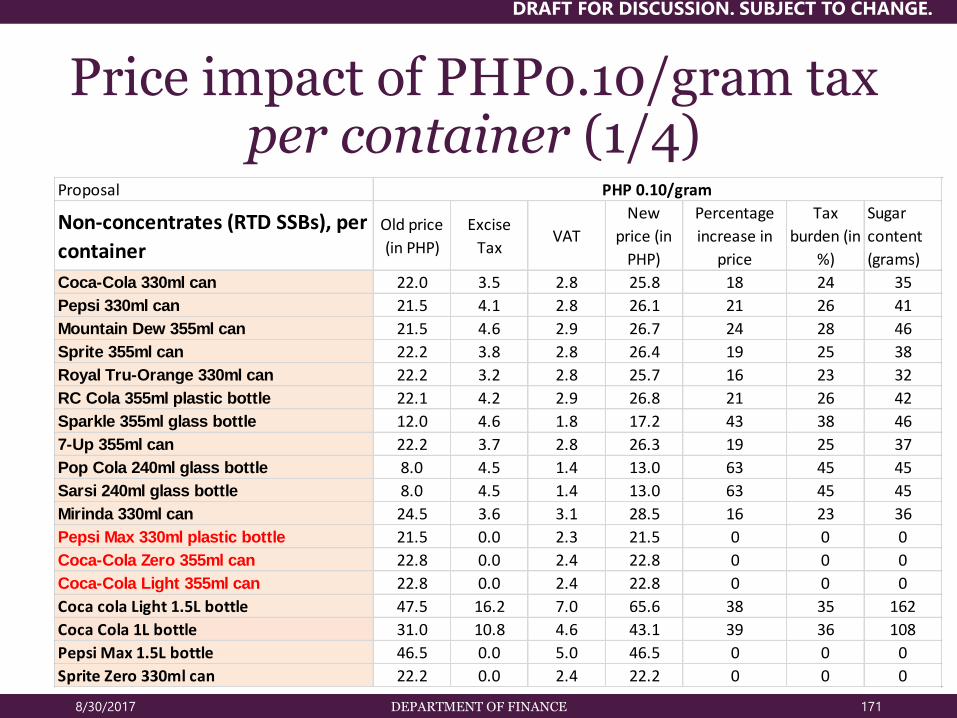
DRAFT FOR DISCUSSION. SUBJECT TO CHANGE.
Price impact of PHP0.10/gram taxper container (1/4)
8/30/2017 DEPARTMENT OF FINANCE 171
Proposal
Non-concentrates (RTD SSBs), per
container
Old price
(in PHP)
Excise
TaxVAT
New
price (in
PHP)
Percentage
increase in
price
Tax
burden (in
%)
Sugar
content
(grams)
Coca-Cola 330ml can 22.0 3.5 2.8 25.8 18 24 35
Pepsi 330ml can 21.5 4.1 2.8 26.1 21 26 41
Mountain Dew 355ml can 21.5 4.6 2.9 26.7 24 28 46
Sprite 355ml can 22.2 3.8 2.8 26.4 19 25 38
Royal Tru-Orange 330ml can 22.2 3.2 2.8 25.7 16 23 32
RC Cola 355ml plastic bottle 22.1 4.2 2.9 26.8 21 26 42
Sparkle 355ml glass bottle 12.0 4.6 1.8 17.2 43 38 46
7-Up 355ml can 22.2 3.7 2.8 26.3 19 25 37
Pop Cola 240ml glass bottle 8.0 4.5 1.4 13.0 63 45 45
Sarsi 240ml glass bottle 8.0 4.5 1.4 13.0 63 45 45
Mirinda 330ml can 24.5 3.6 3.1 28.5 16 23 36
Pepsi Max 330ml plastic bottle 21.5 0.0 2.3 21.5 0 0 0
Coca-Cola Zero 355ml can 22.8 0.0 2.4 22.8 0 0 0
Coca-Cola Light 355ml can 22.8 0.0 2.4 22.8 0 0 0
Coca cola Light 1.5L bottle 47.5 16.2 7.0 65.6 38 35 162
Coca Cola 1L bottle 31.0 10.8 4.6 43.1 39 36 108
Pepsi Max 1.5L bottle 46.5 0.0 5.0 46.5 0 0 0
Sprite Zero 330ml can 22.2 0.0 2.4 22.2 0 0 0
PHP 0.10/gram

DRAFT FOR DISCUSSION. SUBJECT TO CHANGE.
Price impact of PHP0.10/gram taxper container (2/4)
8/30/2017 DEPARTMENT OF FINANCE 172
Proposal
Non-concentrates (RTD SSBs), per
container
Old price
(in PHP)Excise tax VAT
New
price (in
PHP)
Percentage
increase in
price
Tax
burden (in
%)
Sugar
content
(grams)
Cobra 350ml plastic bottle 19.5 6.9 2.9 27.2 40 36 69
Gatorade 355ml plastic bottle 24.7 3.0 3.0 28.1 14 21 30
Sting 330ml plastic bottle 17.0 3.3 2.2 20.7 22 27 33
Del Monte 240ml can 25.0 2.4 3.0 27.7 11 19 24
Zest-O 200ml pouch 5.6 2 0.8 7.8 40 36 20
Tropicana Twister 355ml plastic bottle 23.5 3.6 2.9 27.5 17 24 36
Sun Glo 200ml pouch 5.6 2.5 0.9 8.4 50 40 25
Big 250 250ml pouch 6.0 2.5 0.9 8.8 47 39 25
Plus! 250ml pouch 6.0 2.5 0.9 8.8 47 39 25
Minute Maid 250ml plastic bottle 12.1 1.9 1.5 14.2 18 24 19
Gina 250ml can 27.7 3 3.3 31.1 12 20 30
Sunkist 235ml pouch 16.1 1.9 2.0 18.2 13 21 19
PHP 0.10/gram

DRAFT FOR DISCUSSION. SUBJECT TO CHANGE.
Price impact of PHP0.10/gram taxper container (3/4)
8/30/2017 DEPARTMENT OF FINANCE 173
Proposal
Non-concentrates (RTD SSBs), per
container
Old price
(in PHP)
Excise
TaxVAT
New
price (in
PHP)
Percentage
increase in
price
Tax
burden (in
%)
Sugar
content
(grams)
C2 355ml plastic bottle 15.8 4.6 2.2 20.9 33 33 46
Lipton 200ml plastic bottle 18.8 1.5 2.2 20.4 9 18 15
Real Leaf 250ml plastic bottle 19.0 2.6 2.3 21.9 16 23 26
ONE 355ml plastic bottle 18.5 2.7 2.3 21.5 16 23 27
PHP 0.10/gram
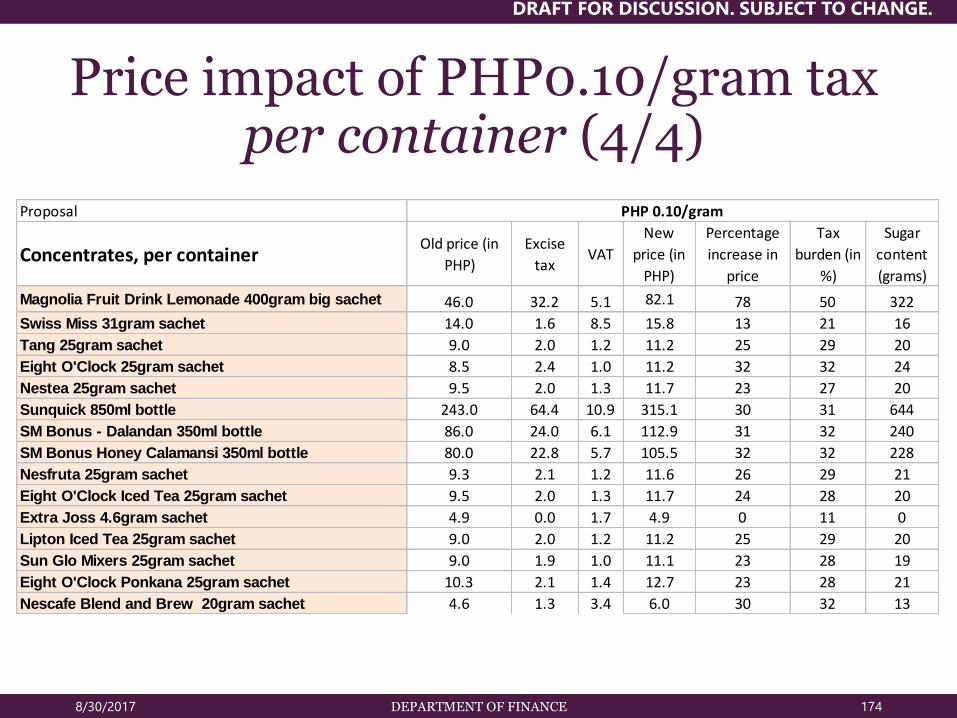
DRAFT FOR DISCUSSION. SUBJECT TO CHANGE.
Price impact of PHP0.10/gram taxper container (4/4)
8/30/2017 DEPARTMENT OF FINANCE 174
Proposal
Concentrates, per containerOld price (in
PHP)
Excise
taxVAT
New
price (in
PHP)
Percentage
increase in
price
Tax
burden (in
%)
Sugar
content
(grams)
Magnolia Fruit Drink Lemonade 400gram big sachet 46.0 32.2 5.1 82.1 78 50 322
Swiss Miss 31gram sachet 14.0 1.6 8.5 15.8 13 21 16
Tang 25gram sachet 9.0 2.0 1.2 11.2 25 29 20
Eight O'Clock 25gram sachet 8.5 2.4 1.0 11.2 32 32 24
Nestea 25gram sachet 9.5 2.0 1.3 11.7 23 27 20
Sunquick 850ml bottle 243.0 64.4 10.9 315.1 30 31 644
SM Bonus - Dalandan 350ml bottle 86.0 24.0 6.1 112.9 31 32 240
SM Bonus Honey Calamansi 350ml bottle 80.0 22.8 5.7 105.5 32 32 228
Nesfruta 25gram sachet 9.3 2.1 1.2 11.6 26 29 21
Eight O'Clock Iced Tea 25gram sachet 9.5 2.0 1.3 11.7 24 28 20
Extra Joss 4.6gram sachet 4.9 0.0 1.7 4.9 0 11 0
Lipton Iced Tea 25gram sachet 9.0 2.0 1.2 11.2 25 29 20
Sun Glo Mixers 25gram sachet 9.0 1.9 1.0 11.1 23 28 19
Eight O'Clock Ponkana 25gram sachet 10.3 2.1 1.4 12.7 23 28 21
Nescafe Blend and Brew 20gram sachet 4.6 1.3 3.4 6.0 30 32 13
PHP 0.10/gram

DRAFT FOR DISCUSSION. SUBJECT TO CHANGE.
Price impact of PHP0.05/gram taxper container (1/4)
8/30/2017 DEPARTMENT OF FINANCE 175
Source:
DOF staff
estimates
Proposal
Non-concentrates (RTD SSBs),
per container
Old price
(in PHP)
Excise
TaxVAT
New
price (in
PHP)
Percentage
increase in
price
Tax
burden (in
%)
Sugar
content
(grams)
Coca-Cola 330ml can 22.0 1.7 2.6 23.9 9 18 35
Pepsi 330ml can 21.5 2.1 2.5 23.8 11 19 41
Mountain Dew 355ml can 21.5 2.3 2.6 24.1 12 20 46
Sprite 355ml can 22.2 1.9 2.6 24.3 10 19 38
Royal Tru-Orange 330ml can 22.2 1.6 2.6 23.9 8 17 32
RC Cola 355ml plastic bottle 22.1 2.1 2.6 24.5 11 19 42
Sparkle 355ml glass bottle 12.0 2.3 1.6 14.6 21 26 46
7-Up 355ml can 22.2 1.9 2.6 24.2 9 18 37
Pop Cola 240ml glass bottle 8.0 2.3 1.1 10.5 32 32 45
Sarsi 240ml glass bottle 8.0 2.3 1.1 10.5 32 32 45
Mirinda 330ml can 24.5 1.8 2.8 26.5 8 18 36
Pepsi Max 330ml plastic bottle 21.5 0.0 2.3 21.5 0 0 0
Coca-Cola Zero 355ml can 22.8 0.0 2.4 22.8 0 0 0
Coca-Cola Light 355ml can 22.8 0.0 2.4 22.8 0 0 0
Coca cola Light 1.5L bottle 47.5 8.1 6.1 56.6 19 25 162
Coca Cola 1L bottle 31.0 5.4 4.0 37.0 20 25 108
Pepsi Max 1.5L bottle 46.5 0.0 5.0 46.5 0 0 0
Sprite Zero 330ml can 22.2 0.0 2.4 22.2 0 0 0
PHP 0.05/gram
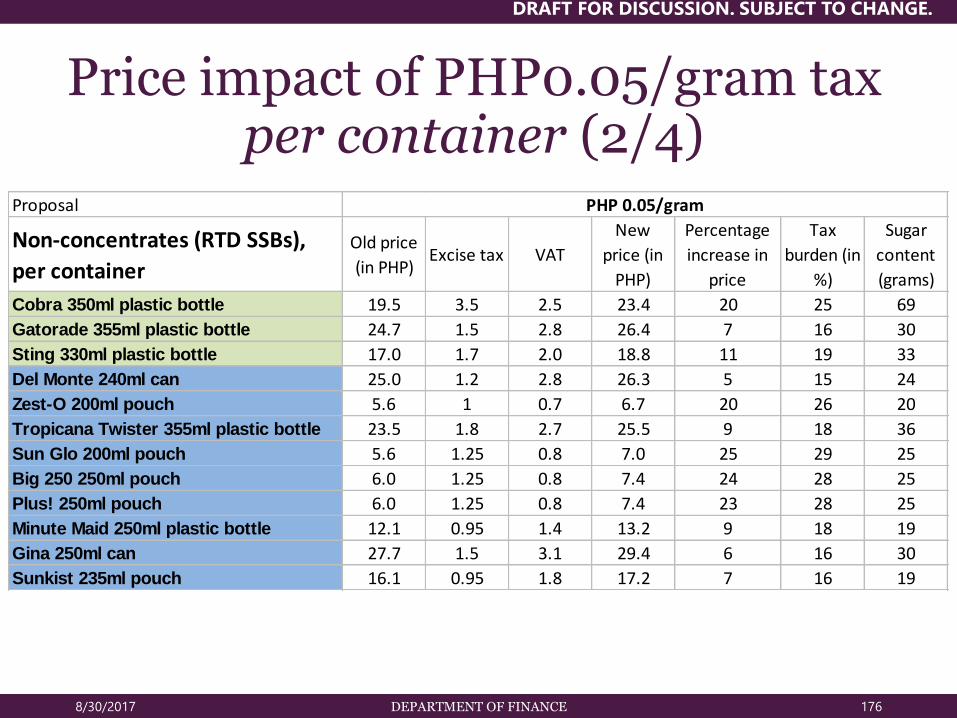
DRAFT FOR DISCUSSION. SUBJECT TO CHANGE.
Price impact of PHP0.05/gram taxper container (2/4)
8/30/2017 DEPARTMENT OF FINANCE 176
Proposal
Non-concentrates (RTD SSBs),
per container
Old price
(in PHP)Excise tax VAT
New
price (in
PHP)
Percentage
increase in
price
Tax
burden (in
%)
Sugar
content
(grams)
Cobra 350ml plastic bottle 19.5 3.5 2.5 23.4 20 25 69
Gatorade 355ml plastic bottle 24.7 1.5 2.8 26.4 7 16 30
Sting 330ml plastic bottle 17.0 1.7 2.0 18.8 11 19 33
Del Monte 240ml can 25.0 1.2 2.8 26.3 5 15 24
Zest-O 200ml pouch 5.6 1 0.7 6.7 20 26 20
Tropicana Twister 355ml plastic bottle 23.5 1.8 2.7 25.5 9 18 36
Sun Glo 200ml pouch 5.6 1.25 0.8 7.0 25 29 25
Big 250 250ml pouch 6.0 1.25 0.8 7.4 24 28 25
Plus! 250ml pouch 6.0 1.25 0.8 7.4 23 28 25
Minute Maid 250ml plastic bottle 12.1 0.95 1.4 13.2 9 18 19
Gina 250ml can 27.7 1.5 3.1 29.4 6 16 30
Sunkist 235ml pouch 16.1 0.95 1.8 17.2 7 16 19
PHP 0.05/gram

DRAFT FOR DISCUSSION. SUBJECT TO CHANGE.
Price impact of PHP0.05/gram taxper container (3/4)
8/30/2017 DEPARTMENT OF FINANCE 177
Proposal
Non-concentrates (RTD SSBs),
per container
Old price
(in PHP)
Excise
TaxVAT
New
price (in
PHP)
Percentage
increase in
price
Tax
burden (in
%)
Sugar
content
(grams)
C2 355ml plastic bottle 15.8 2.3 2.0 18.3 16 23 46
Lipton 200ml plastic bottle 18.8 0.8 2.1 19.6 4 15 15
Real Leaf 250ml plastic bottle 19.0 1.3 2.2 20.4 8 17 26
ONE 355ml plastic bottle 18.5 1.4 2.1 20.0 8 17 27
PHP 0.05/gram

DRAFT FOR DISCUSSION. SUBJECT TO CHANGE.
Price impact of PHP0.05/gram taxper container (4/4)
8/30/2017 DEPARTMENT OF FINANCE 178
Proposal
Concentrates, per containerOld price (in
PHP)Excise tax VAT
New
price (in
PHP)
Percentage
increase in
price
Tax
burden
(in %)
Sugar
content
(grams)
Magnolia Fruit Drink Lemonade 400gram big sachet 46.0 16.1 3.1 64.0 28 36 322
Swiss Miss 31gram sachet 14.0 0.8 8.4 14.9 6 16 16
Tang 25gram sachet 9.0 1.0 1.1 10.1 11 21 20
Eight O'Clock 25gram sachet 8.5 1.2 0.9 9.8 14 23 24
Nestea 25gram sachet 9.5 1.0 1.1 10.6 10 20 20
Sunquick 850ml bottle 243.0 32.2 7.0 279.1 13 22 644
SM Bonus - Dalandan 350ml bottle 86.0 12.0 4.6 99.4 14 23 240
SM Bonus Honey Calamansi 350ml bottle 80.0 11.4 4.3 92.8 14 23 228
Nesfruta 25gram sachet 9.3 1.1 1.1 10.4 11 21 21
Eight O'Clock Iced Tea 25gram sachet 9.5 1.0 1.1 10.6 11 20 20
Extra Joss 4.6gram sachet 4.9 0.0 1.7 4.9 0 11 0
Lipton Iced Tea 25gram sachet 9.0 1.0 1.1 10.1 11 21 20
Sun Glo Mixers 25gram sachet 9.0 0.9 0.9 10.1 10 20 19
Eight O'Clock Ponkana 25gram sachet 10.3 1.1 1.2 11.5 10 20 21
Nescafe Blend and Brew 20gram sachet 4.6 0.6 3.4 5.3 13 23 13
PHP 0.05/gram
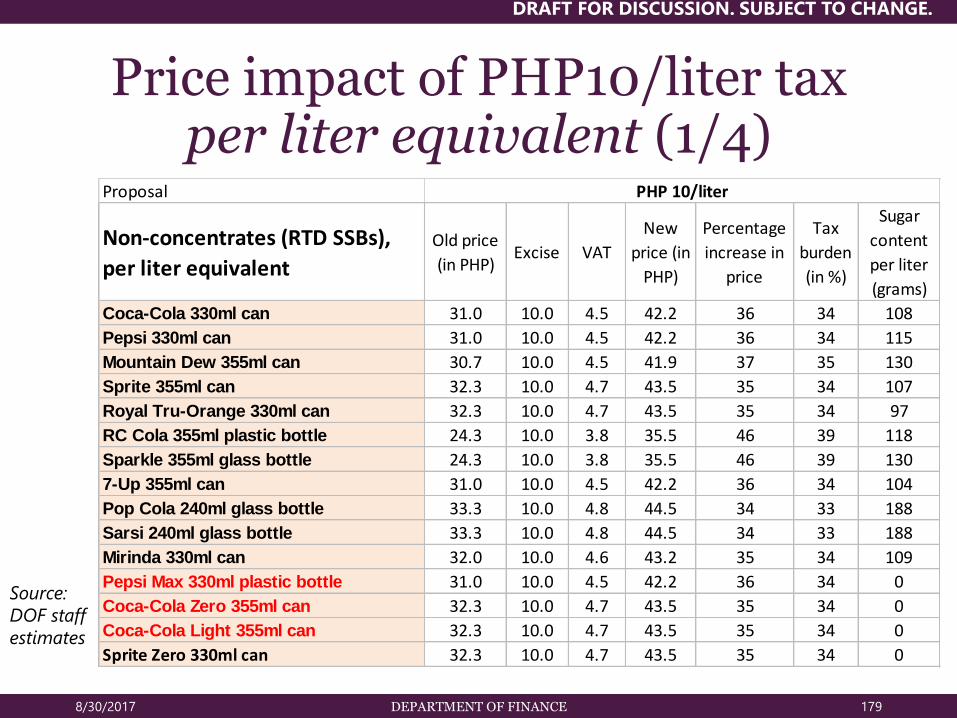
DRAFT FOR DISCUSSION. SUBJECT TO CHANGE.
Price impact of PHP10/liter taxper liter equivalent (1/4)
8/30/2017 DEPARTMENT OF FINANCE 179
Source:
DOF staff
estimates
Proposal
Non-concentrates (RTD SSBs),
per liter equivalent
Old price
(in PHP)Excise VAT
New
price (in
PHP)
Percentage
increase in
price
Tax
burden
(in %)
Sugar
content
per liter
(grams)
Coca-Cola 330ml can 31.0 10.0 4.5 42.2 36 34 108
Pepsi 330ml can 31.0 10.0 4.5 42.2 36 34 115
Mountain Dew 355ml can 30.7 10.0 4.5 41.9 37 35 130
Sprite 355ml can 32.3 10.0 4.7 43.5 35 34 107
Royal Tru-Orange 330ml can 32.3 10.0 4.7 43.5 35 34 97
RC Cola 355ml plastic bottle 24.3 10.0 3.8 35.5 46 39 118
Sparkle 355ml glass bottle 24.3 10.0 3.8 35.5 46 39 130
7-Up 355ml can 31.0 10.0 4.5 42.2 36 34 104
Pop Cola 240ml glass bottle 33.3 10.0 4.8 44.5 34 33 188
Sarsi 240ml glass bottle 33.3 10.0 4.8 44.5 34 33 188
Mirinda 330ml can 32.0 10.0 4.6 43.2 35 34 109
Pepsi Max 330ml plastic bottle 31.0 10.0 4.5 42.2 36 34 0
Coca-Cola Zero 355ml can 32.3 10.0 4.7 43.5 35 34 0
Coca-Cola Light 355ml can 32.3 10.0 4.7 43.5 35 34 0
Sprite Zero 330ml can 32.3 10.0 4.7 43.5 35 34 0
PHP 10/liter

DRAFT FOR DISCUSSION. SUBJECT TO CHANGE.
Price impact of PHP10/liter taxper liter equivalent (2/4)
8/30/2017 DEPARTMENT OF FINANCE 180
Proposal
Non-concentrates (RTD SSBs),
per liter equivalent
Old price
(in PHP)Excise VAT
New
price (in
PHP)
Percentage
increase in
price
Tax
burden
(in %)
Sugar
content
per liter
(grams)
Cobra 350ml plastic bottle 42.0 10.0 5.7 53.2 27 30 197
Gatorade 355ml plastic bottle 50.0 10.0 6.6 61.2 22 27 85
Sting 330ml plastic bottle 51.5 10.0 6.7 62.7 22 27 100
Del Monte 240ml can 70.5 10.0 8.8 81.7 16 23 100
Zest-O 200ml pouch 28.0 10.0 4.2 39.2 40 36 100
Tropicana Twister 355ml plastic bottle 54.0 10.0 7.0 65.2 21 26 101
Sun Glo 200ml pouch 28.0 10.0 4.2 39.2 40 36 125
Big 250 250ml pouch 23.8 10.0 3.8 35.0 47 39 100
Plus! 250ml pouch 24.0 10.0 3.8 35.2 47 39 100
Minute Maid 250ml plastic bottle 55.0 10.0 7.1 66.2 20 26 76
Gina 250ml can 110.8 10.0 13.1 122.0 10 19 120
Sunkist 235ml pouch 68.5 10.0 8.5 79.7 16 23 81
PHP 10/liter

DRAFT FOR DISCUSSION. SUBJECT TO CHANGE.
Price impact of PHP10/liter taxper liter equivalent (3/4)
8/30/2017 DEPARTMENT OF FINANCE 181
Proposal
Non-concentrates (RTD SSBs),
per liter equivalent
Old price
(in PHP)Excise VAT
New
price (in
PHP)
Percentage
increase in
price
Tax
burden
(in %)
Sugar
content
per liter
(grams)
C2 355ml plastic bottle 29.0 10.0 4.3 40.2 39 36 130
Lipton 200ml plastic bottle 54.0 10.0 7.0 65.2 21 26 75
Real Leaf 250ml plastic bottle 40.6 10.0 5.6 51.8 28 30 105
ONE 355ml plastic bottle 52.1 10.0 6.8 63.3 21 27 76
PHP 10/liter

DRAFT FOR DISCUSSION. SUBJECT TO CHANGE.
Price impact of PHP10/liter taxper liter equivalent (4/4)
8/30/2017 DEPARTMENT OF FINANCE 182
Proposal
Concentrates (in liter equivalent)Old price
(in PHP)Excise VAT
New
price (in
PHP)
Percentage
increase in
price
Tax
burden (in
%)
Sugar content
per liter (in
grams)
Magnolia Fruit Drink Lemonade 400gram big sachet 11.1 10.0 2.4 19.9 101 56 78
Swiss Miss 31gram sachet 77.8 10.0 9.5 79.4 14 22 89
Tang 25gram sachet 9.0 10.0 2.2 18.0 124 60 20
Eight O'Clock 25gram sachet 7.1 10.0 2.0 16.3 158 65 20
Nestea 25gram sachet 9.5 10.0 2.2 18.5 118 59 20
Sunquick 850ml bottle 29.4 10.0 4.3 36.2 38 35 78
SM Bonus - Dalandan 350ml bottle 29.9 10.0 4.4 36.7 38 35 83
SM Bonus Honey Calamansi 350ml bottle 27.8 10.0 4.2 34.8 40 36 79
Nesfruta 25gram sachet 9.3 10.0 2.2 18.3 121 60 21
Eight O'Clock Iced Tea 25gram sachet 9.5 10.0 2.2 18.5 118 59 20
Extra Joss 4.6gram sachet 16.3 10.0 2.9 24.5 69 47 0
Lipton Iced Tea 25gram sachet 9.0 10.0 2.2 18.0 124 60 20
Sun Glo Mixers 25gram sachet 7.5 10.0 2.0 16.7 149 64 16
Eight O'Clock Ponkana 25gram sachet 10.3 10.0 2.3 19.2 109 57 21
Nescafe Blend and Brew 20gram sachet 30.7 10.0 4.5 37.4 37 35 83
PHP 10/liter
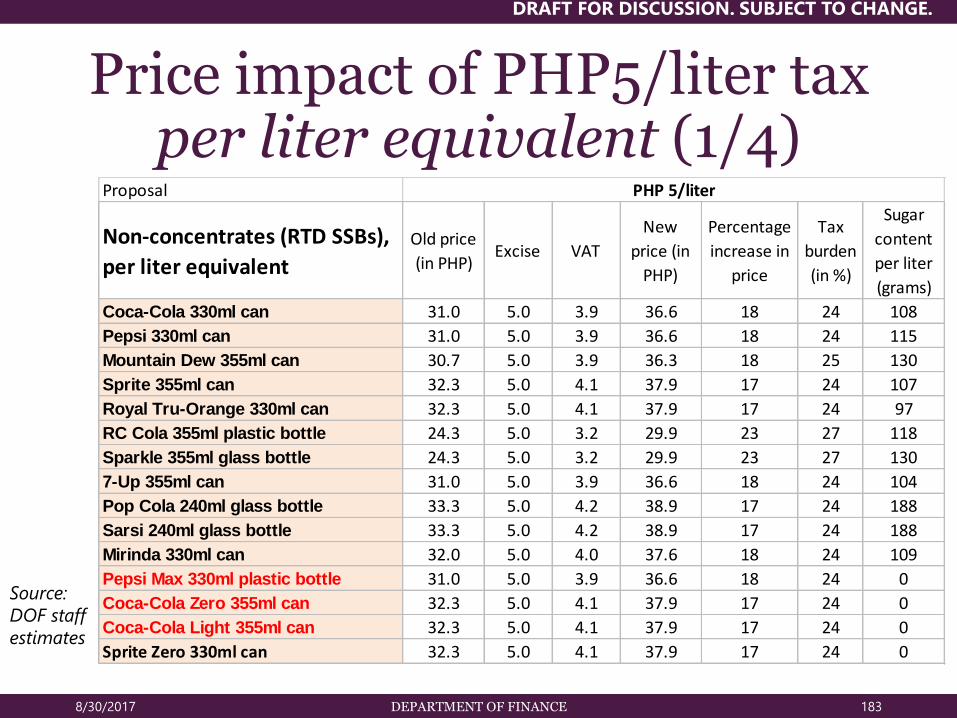
DRAFT FOR DISCUSSION. SUBJECT TO CHANGE.
Price impact of PHP5/liter taxper liter equivalent (1/4)
8/30/2017 DEPARTMENT OF FINANCE 183
Source:
DOF staff
estimates
Proposal
Non-concentrates (RTD SSBs),
per liter equivalent
Old price
(in PHP)Excise VAT
New
price (in
PHP)
Percentage
increase in
price
Tax
burden
(in %)
Sugar
content
per liter
(grams)
Coca-Cola 330ml can 31.0 5.0 3.9 36.6 18 24 108
Pepsi 330ml can 31.0 5.0 3.9 36.6 18 24 115
Mountain Dew 355ml can 30.7 5.0 3.9 36.3 18 25 130
Sprite 355ml can 32.3 5.0 4.1 37.9 17 24 107
Royal Tru-Orange 330ml can 32.3 5.0 4.1 37.9 17 24 97
RC Cola 355ml plastic bottle 24.3 5.0 3.2 29.9 23 27 118
Sparkle 355ml glass bottle 24.3 5.0 3.2 29.9 23 27 130
7-Up 355ml can 31.0 5.0 3.9 36.6 18 24 104
Pop Cola 240ml glass bottle 33.3 5.0 4.2 38.9 17 24 188
Sarsi 240ml glass bottle 33.3 5.0 4.2 38.9 17 24 188
Mirinda 330ml can 32.0 5.0 4.0 37.6 18 24 109
Pepsi Max 330ml plastic bottle 31.0 5.0 3.9 36.6 18 24 0
Coca-Cola Zero 355ml can 32.3 5.0 4.1 37.9 17 24 0
Coca-Cola Light 355ml can 32.3 5.0 4.1 37.9 17 24 0
Sprite Zero 330ml can 32.3 5.0 4.1 37.9 17 24 0
PHP 5/liter
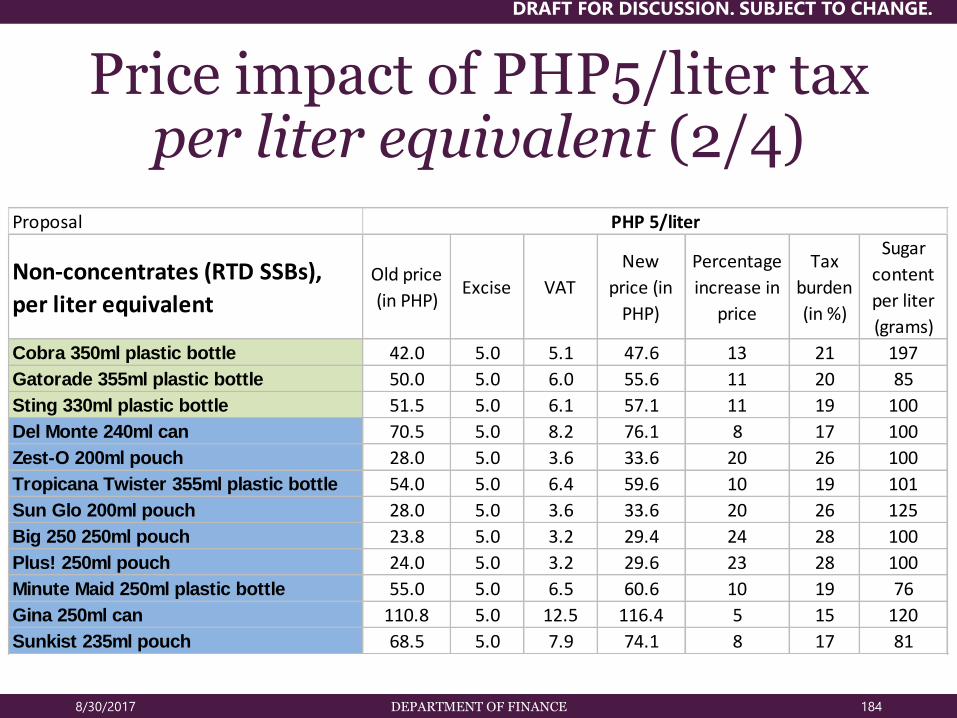
DRAFT FOR DISCUSSION. SUBJECT TO CHANGE.
Price impact of PHP5/liter taxper liter equivalent (2/4)
8/30/2017 DEPARTMENT OF FINANCE 184
Proposal
Non-concentrates (RTD SSBs),
per liter equivalent
Old price
(in PHP)Excise VAT
New
price (in
PHP)
Percentage
increase in
price
Tax
burden
(in %)
Sugar
content
per liter
(grams)
Cobra 350ml plastic bottle 42.0 5.0 5.1 47.6 13 21 197
Gatorade 355ml plastic bottle 50.0 5.0 6.0 55.6 11 20 85
Sting 330ml plastic bottle 51.5 5.0 6.1 57.1 11 19 100
Del Monte 240ml can 70.5 5.0 8.2 76.1 8 17 100
Zest-O 200ml pouch 28.0 5.0 3.6 33.6 20 26 100
Tropicana Twister 355ml plastic bottle 54.0 5.0 6.4 59.6 10 19 101
Sun Glo 200ml pouch 28.0 5.0 3.6 33.6 20 26 125
Big 250 250ml pouch 23.8 5.0 3.2 29.4 24 28 100
Plus! 250ml pouch 24.0 5.0 3.2 29.6 23 28 100
Minute Maid 250ml plastic bottle 55.0 5.0 6.5 60.6 10 19 76
Gina 250ml can 110.8 5.0 12.5 116.4 5 15 120
Sunkist 235ml pouch 68.5 5.0 7.9 74.1 8 17 81
PHP 5/liter

DRAFT FOR DISCUSSION. SUBJECT TO CHANGE.
Price impact of PHP5/liter taxper liter equivalent (3/4)
8/30/2017 DEPARTMENT OF FINANCE 185
Proposal
Non-concentrates (RTD SSBs),
per liter equivalent
Old price
(in PHP)Excise VAT
New
price (in
PHP)
Percentage
increase in
price
Tax
burden
(in %)
Sugar
content
per liter
(grams)
C2 355ml plastic bottle 29.0 5.0 3.7 34.6 19 25 130
Lipton 200ml plastic bottle 54.0 5.0 6.4 59.6 10 19 75
Real Leaf 250ml plastic bottle 40.6 5.0 5.0 46.2 14 22 105
ONE 355ml plastic bottle 52.1 5.0 6.2 57.7 11 19 76
PHP 5/liter

DRAFT FOR DISCUSSION. SUBJECT TO CHANGE.
Price impact of PHP5/liter taxper liter equivalent (4/4)
8/30/2017 DEPARTMENT OF FINANCE 186
Proposal
Concentrates, per liter equivalentOld price
(in PHP)Excise VAT
New
price (in
PHP)
Percentage
increase in
price
Tax
burden
(in %)
Sugar content
per liter (in
grams)
Magnolia Fruit Drink Lemonade 400gram big sachet 11.1 5.0 1.8 16.7 50 41 78
Swiss Miss 31gram sachet 77.8 5.0 8.9 83.4 7 17 89
Tang 25gram sachet 9.0 5.0 1.6 14.6 62 45 20
Eight O'Clock 25gram sachet 7.1 5.0 1.4 12.7 79 50 20
Nestea 25gram sachet 9.5 5.0 1.6 15.1 59 44 20
Sunquick 850ml bottle 29.4 5.0 3.7 35.0 19 25 78
SM Bonus - Dalandan 350ml bottle 29.9 5.0 3.8 35.5 19 25 83
SM Bonus Honey Calamansi 350ml bottle 27.8 5.0 3.6 33.4 20 26 79
Nesfruta 25gram sachet 9.3 5.0 1.6 14.9 61 44 21
Eight O'Clock Iced Tea 25gram sachet 9.5 5.0 1.6 15.1 59 44 20
Extra Joss 4.6gram sachet 16.3 5.0 2.3 21.9 34 34 0
Lipton Iced Tea 25gram sachet 9.0 5.0 1.6 14.6 62 45 20
Sun Glo Mixers 25gram sachet 7.5 5.0 1.4 13.1 75 49 16
Eight O'Clock Ponkana 25gram sachet 10.3 5.0 1.7 15.9 54 42 21
Nescafe Blend and Brew 20gram sachet 30.7 5.0 3.9 36.3 18 25 83
PHP 5/liter

DRAFT FOR DISCUSSION. SUBJECT TO CHANGE.
Price impact of PHP0.10/gram taxper liter equivalent (1/4)
8/30/2017 DEPARTMENT OF FINANCE 187
Proposal
Non-concentrates (RTD SSBs),
per liter equivalent
Old price
(in PHP)Excise VAT
New
price (in
PHP)
Percentage
increase in
price
Tax
burden
(in %)
Sugar
content
per liter
(grams)
Coca-Cola 330ml can 31.0 10.8 4.6 43.1 39 36 108
Pepsi 330ml can 31.0 11.5 4.7 43.9 42 37 115
Mountain Dew 355ml can 30.7 13.0 4.8 45.2 47 39 130
Sprite 355ml can 32.3 10.7 4.7 44.3 37 35 107
Royal Tru-Orange 330ml can 32.3 9.7 4.6 43.2 34 33 97
RC Cola 355ml plastic bottle 24.3 11.8 4.0 37.6 54 42 118
Sparkle 355ml glass bottle 24.3 13.0 4.2 38.8 60 44 130
7-Up 355ml can 31.0 10.4 4.6 42.7 38 35 104
Pop Cola 240ml glass bottle 33.3 18.8 5.8 54.3 63 45 188
Sarsi 240ml glass bottle 33.3 18.8 5.8 54.3 63 45 188
Mirinda 330ml can 32.0 10.9 4.7 44.2 38 35 109
Pepsi Max 330ml plastic bottle 31.0 0.0 3.3 31.0 0 11 0
Coca-Cola Zero 355ml can 32.3 0.0 3.5 32.3 0 11 0
Coca-Cola Light 355ml can 32.3 0.0 3.5 32.3 0 11 0
Sprite Zero 330ml can 32.3 0.0 3.5 32.3 0 11 0
PHP 0.10/gram

DRAFT FOR DISCUSSION. SUBJECT TO CHANGE.
Price impact of PHP0.10/gram taxper liter equivalent (2/4)
8/30/2017 DEPARTMENT OF FINANCE 188
Proposal
Non-concentrates (RTD SSBs),
per liter equivalent
Old price
(in PHP)Excise VAT
New
price (in
PHP)
Percentage
increase in
price
Tax
burden
(in %)
Sugar
content
per liter
(grams)
Cobra 350ml plastic bottle 42.0 19.7 6.9 64.1 53 41 197
Gatorade 355ml plastic bottle 50.0 8.5 6.4 59.5 19 25 85
Sting 330ml plastic bottle 51.5 10.0 6.7 62.7 22 27 100
Del Monte 240ml can 70.5 10.0 8.8 81.7 16 23 100
Zest-O 200ml pouch 28.0 10.0 4.2 39.2 40 36 100
Tropicana Twister 355ml plastic bottle 54.0 10.1 7.0 65.4 21 26 101
Sun Glo 200ml pouch 28.0 12.5 4.5 42.0 50 40 125
Big 250 250ml pouch 23.8 10.0 3.8 35.0 47 39 100
Plus! 250ml pouch 24.0 10.0 3.8 35.2 47 39 100
Minute Maid 250ml plastic bottle 55.0 7.6 6.8 63.5 15 23 76
Gina 250ml can 110.8 12.0 13.3 124.2 12 20 120
Sunkist 235ml pouch 68.5 8.1 8.3 77.6 13 21 81
PHP 0.10/gram

DRAFT FOR DISCUSSION. SUBJECT TO CHANGE.
Price impact of PHP0.10/gram taxper liter equivalent (3/4)
8/30/2017 DEPARTMENT OF FINANCE 189
Proposal
Non-concentrates (RTD SSBs),
per liter equivalent
Old price
(in PHP)Excise VAT
New
price (in
PHP)
Percentage
increase in
price
Tax
burden
(in %)
Sugar
content
per liter
(grams)
C2 355ml plastic bottle 29.0 13.0 4.7 43.5 50 40 130
Lipton 200ml plastic bottle 54.0 7.5 6.7 62.4 16 23 75
Real Leaf 250ml plastic bottle 40.6 10.5 5.6 52.4 29 31 105
ONE 355ml plastic bottle 52.1 7.6 6.5 60.6 16 23 76
PHP 0.10/gram

DRAFT FOR DISCUSSION. SUBJECT TO CHANGE.
Price impact of PHP0.10/gram taxper liter equivalent (4/4)
8/30/2017 DEPARTMENT OF FINANCE 190
Proposal
Concentrates (in liter equivalent)Old price
(in PHP)Excise VAT
New
price (in
PHP)
Percentage
increase in
price
Tax
burden (in
%)
Sugar content
per liter (in
grams)
Magnolia Fruit Drink Lemonade 400gram big sachet 11.1 8.7 2.2 47.2 325 79 78
Swiss Miss 31gram sachet 77.8 61.1 15.7 79.6 2 13 89
Tang 25gram sachet 9.0 7.1 1.8 11.2 25 29 20
Eight O'Clock 25gram sachet 7.1 5.6 1.4 9.8 38 35 20
Nestea 25gram sachet 9.5 7.5 1.9 11.7 23 27 20
Sunquick 850ml bottle 29.3 23.1 5.9 101.5 246 74 78
SM Bonus - Dalandan 350ml bottle 29.9 23.5 6.0 56.7 90 53 83
SM Bonus Honey Calamansi 350ml bottle 27.8 21.8 5.6 53.3 92 53 79
Nesfruta 25gram sachet 9.3 7.3 1.9 11.6 26 29 21
Eight O'Clock Iced Tea 25gram sachet 9.5 7.5 1.9 11.7 24 28 20
Extra Joss 4.6gram sachet 16.3 12.8 3.3 16.3 0 11 0
Lipton Iced Tea 25gram sachet 9.0 7.1 1.8 11.2 25 29 20
Sun Glo Mixers 25gram sachet 7.5 5.9 1.5 9.6 28 30 16
Eight O'Clock Ponkana 25gram sachet 10.3 8.1 2.1 12.7 23 28 21
Nescafe Blend and Brew 20gram sachet 30.7 24.1 6.2 32.1 5 15 83
PHP 0.10/gram

DRAFT FOR DISCUSSION. SUBJECT TO CHANGE.
Price impact of PHP0.05/gram taxper liter equivalent (1/4)
8/30/2017 DEPARTMENT OF FINANCE 191
Source:
DOF staff
estimates
Proposal
Non-concentrates (RTD SSBs), per
liter equivalent
Old price
(in PHP)Excise VAT
New
price (in
PHP)
Percentage
increase in
price
Tax
burden
(in %)
Sugar
content
per liter
(grams)
Coca-Cola 330ml can 31.0 5.4 4.0 37.0 20 25 108
Pepsi 330ml can 31.0 5.8 4.0 37.5 21 26 115
Mountain Dew 355ml can 30.7 6.5 4.1 37.9 24 28 130
Sprite 355ml can 32.3 5.4 4.1 38.3 19 25 107
Royal Tru-Orange 330ml can 32.3 4.8 4.0 37.8 17 24 97
RC Cola 355ml plastic bottle 24.3 5.9 3.3 31.0 27 30 118
Sparkle 355ml glass bottle 24.3 6.5 3.4 31.6 30 31 130
7-Up 355ml can 31.0 5.2 3.9 36.8 19 25 104
Pop Cola 240ml glass bottle 33.3 9.4 4.7 43.8 32 32 188
Sarsi 240ml glass bottle 33.3 9.4 4.7 43.8 32 32 188
Mirinda 330ml can 32.0 5.5 4.1 38.1 19 25 109
Pepsi Max 330ml plastic bottle 31.0 0.0 3.3 31.0 0 11 0
Coca-Cola Zero 355ml can 32.3 0.0 3.5 32.3 0 11 0
Coca-Cola Light 355ml can 32.3 0.0 3.5 32.3 0 11 0
Sprite Zero 330ml can 32.3 0.0 3.5 32.3 0 11 0
PHP 0.05/gram
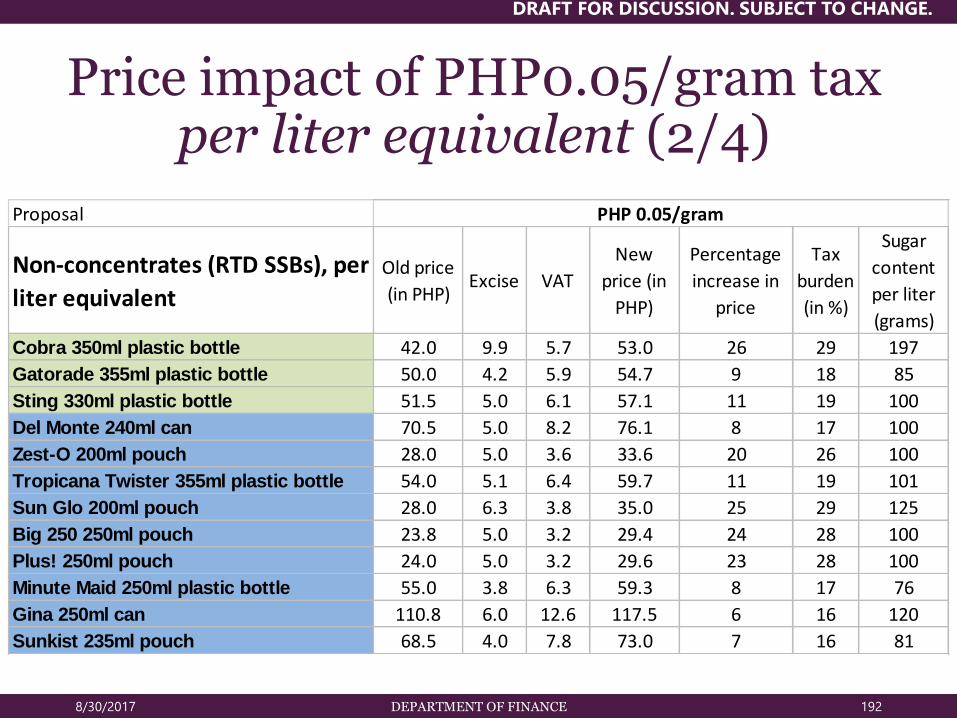
DRAFT FOR DISCUSSION. SUBJECT TO CHANGE.
Price impact of PHP0.05/gram taxper liter equivalent (2/4)
8/30/2017 DEPARTMENT OF FINANCE 192
Proposal
Non-concentrates (RTD SSBs), per
liter equivalent
Old price
(in PHP)Excise VAT
New
price (in
PHP)
Percentage
increase in
price
Tax
burden
(in %)
Sugar
content
per liter
(grams)
Cobra 350ml plastic bottle 42.0 9.9 5.7 53.0 26 29 197
Gatorade 355ml plastic bottle 50.0 4.2 5.9 54.7 9 18 85
Sting 330ml plastic bottle 51.5 5.0 6.1 57.1 11 19 100
Del Monte 240ml can 70.5 5.0 8.2 76.1 8 17 100
Zest-O 200ml pouch 28.0 5.0 3.6 33.6 20 26 100
Tropicana Twister 355ml plastic bottle 54.0 5.1 6.4 59.7 11 19 101
Sun Glo 200ml pouch 28.0 6.3 3.8 35.0 25 29 125
Big 250 250ml pouch 23.8 5.0 3.2 29.4 24 28 100
Plus! 250ml pouch 24.0 5.0 3.2 29.6 23 28 100
Minute Maid 250ml plastic bottle 55.0 3.8 6.3 59.3 8 17 76
Gina 250ml can 110.8 6.0 12.6 117.5 6 16 120
Sunkist 235ml pouch 68.5 4.0 7.8 73.0 7 16 81
PHP 0.05/gram

DRAFT FOR DISCUSSION. SUBJECT TO CHANGE.
Price impact of PHP0.05/gram taxper liter equivalent (3/4)
8/30/2017 DEPARTMENT OF FINANCE 193
Proposal
Non-concentrates (RTD SSBs), per
liter equivalent
Old price
(in PHP)Excise VAT
New
price (in
PHP)
Percentage
increase in
price
Tax
burden
(in %)
Sugar
content
per liter
(grams)
C2 355ml plastic bottle 29.0 6.5 3.9 36.3 25 29 130
Lipton 200ml plastic bottle 54.0 3.8 6.2 58.2 8 17 75
Real Leaf 250ml plastic bottle 40.6 5.3 5.0 46.5 14 22 105
ONE 355ml plastic bottle 52.1 3.8 6.0 56.4 8 17 76
PHP 0.05/gram

DRAFT FOR DISCUSSION. SUBJECT TO CHANGE.
Price impact of PHP0.05/gram taxper liter equivalent (4/4)
8/30/2017 DEPARTMENT OF FINANCE 194
Proposal
Concentrates, per liter equivalentOld price (in
PHP)Excise VAT
New price
(in PHP)
Percentage
increase in
price
Tax
burden
(in %)
Sugar content
per liter (in
grams)
Magnolia Fruit Drink Lemonade 400gram big sachet 11.1 3.9 1.7 15.5 39 66 78
Swiss Miss 31gram sachet 77.8 0.8 8.4 78.7 1 12 89
Tang 25gram sachet 9.0 1.0 1.1 10.1 12 21 20
Eight O'Clock 25gram sachet 7.1 1.0 0.9 8.2 16 25 20
Nestea 25gram sachet 9.5 1.0 1.1 10.6 11 20 20
Sunquick 850ml bottle 29.3 3.9 3.6 33.7 15 60 78
SM Bonus - Dalandan 350ml bottle 29.9 4.2 3.7 34.5 16 38 83
SM Bonus Honey Calamansi 350ml bottle 27.8 4.0 3.5 32.2 16 39 79
Nesfruta 25gram sachet 9.3 1.1 1.1 10.4 13 21 21
Eight O'Clock Iced Tea 25gram sachet 9.5 1.0 1.1 10.6 12 20 20
Extra Joss 4.6gram sachet 16.3 0.0 1.7 16.3 0 11 0
Lipton Iced Tea 25gram sachet 9.0 1.0 1.1 10.1 12 21 20
Sun Glo Mixers 25gram sachet 7.5 0.8 0.9 8.4 12 22 16
Eight O'Clock Ponkana 25gram sachet 10.3 1.1 1.2 11.5 12 20 21
Nescafe Blend and Brew 20gram sachet 30.7 0.6 3.4 31.4 2 13 83
PHP 0.05/gram

DRAFT FOR DISCUSSION. SUBJECT TO CHANGE.
8/30/2017 195
Summary of calories and sugar content
Product Calories (kcal) Sugar content (g)
Candy (1 pc) 10 2
Bubble gum (1 pc) 20 5.3
Cookie (1 pc) 48.8 6.9
Corn (1 cub) 96 3.6
Banana (1 pc) 105 14
Ice cream (1 scoop) 137 14
Cake (1 slice) 200 18.9
Rice (1 cup) 206 0.1
Fruit shake (12 oz) 210 32
Chocolate (1 bar) 235 22.7
Starbucks frappe (tall) 290 42

DRAFT FOR DISCUSSION. SUBJECT TO CHANGE.
Non-tax measures
8/30/2017 DEPARTMENT OF FINANCE 196

DRAFT FOR DISCUSSION. SUBJECT TO CHANGE.
DOH initiatives on non-tax measures to complement the SSB excise tax.
• Complementary non-tax measures are being organized around the Health in All Policies Approach. This strategy is being envisioned to include:
1) Regulatory measures on marketing, mandatory labeling, and sales of unhealthy food and beverage products;
2) Direct provision and incentive-based measures to create enabling environments for the people to sustain a healthy lifestyle, and to provide them options and incentives to downshift towards healthier options.; and
3) Information and advocacy measures for health promotion and behavioral change communication, among other strategies.
8/30/2017 DEPARTMENT OF FINANCE 197
Source: DOH position paper on SSB

DRAFT FOR DISCUSSION. SUBJECT TO CHANGE.
Other non-tax measures that can complement the SSB taxation
• Make available healthier, cheaper alternatives such as plain water and milk.
• Regulate the “self-regulation” or voluntary labeling practices of beverage and allied industries.
• Improve nutrition literacy among Filipinos.
• Work with other government agencies to create healthy living and working environments that are non-obesogenic.
8/30/2017 DEPARTMENT OF FINANCE 198