suffer the little children - the perryman group · suffer the little children ... at current levels...
TRANSCRIPT

SuffertheLittleChildren
AnAssessmentoftheEconomicCostofChildMaltreatment
ProvidedasaPublicServiceby
THE PERRYMAN GROUP
510N.ValleyMillsDr.,Suite300
Waco,TX76710
ph.254.751.9595,fax254.751.7855
www.perrymangroup.com
November2014
Suffer the Little Children: An Assessment of the Economic Cost of Child Maltreatment
i | P a g e w w w . p e r r y m a n g r o u p . c o m C o p y r i g h t 2 0 1 4
ContentsIntroduction ............................................................................................................. 1
Every year, millions of children in the United States suffer from some type of abuse or neglect .................................................................................................................................................................. 2
Child maltreatment involves a substantial economic cost ............................................................... 2
The Perryman Group has implemented a more comprehensive measure of the economic cost of child maltreatment than has been presented previously ............................................................. 3
Economic Aspects of Child Maltreatment ................................................................ 5
The economic cost of child maltreatment stems from two primary areas: social costs and lost earnings ................................................................................................................................................... 5
The costs of child maltreatment include increased social welfare costs as well as earnings losses due to poor health and reduced educational attainment ..................................................... 6
Prior studies have only partially measured these economic costs ................................................. 6
The economic cost of first-time child maltreatment in the US in 2014 includes almost $5.9 trillion in lifetime spending, $2.7 trillion in lost gross domestic product, and 27.9 million person-years of employment ................................................................................................................ 9
Costs of Child Maltreatment by State .................................................................... 11
Economic costs of child maltreatment are naturally highest in the most populous states ........ 11
Conclusion .............................................................................................................. 13
Child maltreatment is nothing short of tragic .................................................................................... 13
There is not an easy solution to the problem of child maltreatment, but the economic losses clearly support additional investment aimed at dealing with the underlying causes .................. 13
APPENDICES ........................................................................................................... 14
AboutThePerrymanGroup ............................................................................. 15
MethodsUsed ...................................................................................................... 16

Suffer the Little Children: An Assessment of the Economic Cost of Child Maltreatment
ii | P a g e w w w . p e r r y m a n g r o u p . c o m C o p y r i g h t 2 0 1 4
DetailedSectoralResults .................................................................................. 25
Components of the Economic Cost of Non-Fatal Child Abuse ..................................................... 26
Components of the Economic Cost of Fatal Child Maltreatment .................................................. 36
The Total Economic Cost of Fatal and Non-Fatal Child Maltreatment ........................................ 40
The Economic Cost of Child Maltreatment: Results by State ....................................................... 42

Suffer the Little Children: An Assessment of the Economic Cost of Child Maltreatment
1 | P a g e w w w . p e r r y m a n g r o u p . c o m C o p y r i g h t 2 0 1 4
While many incidents no doubt
go unreported, reliable survey
evidence suggests that more
than 13% of children are
subject to abuse or neglect by
a caregiver each year.
Introduction
The true character of a society is revealed in how it treats its children.
– Nelson Mandela
As horrific and unimaginable as it sounds, child maltreatment is pervasive in the
United States and ranks as one of the nation’s most pressing public health and
social concerns. While many incidents no doubt go unreported, reliable survey
evidence suggests that more than 13% of US children are subject to abuse or
neglect by a caregiver each year. It impacts
children irrespective of age, gender, ethnicity,
or socioeconomic status. The physical and
emotional consequences to the victims often
persist throughout their lives and represent a
truly incalculable and often irreparable harm.
This fact alone should be sufficient
justification for a massive national effort to both address the underlying causes
and minimize the impacts on the victims. In reality, however, budget constraints
and changing priorities have led to reduced funding to the agencies confronting
the issue and fewer public resources for prevention, investigation, and
amelioration.
In addition to the very real effects on the individuals involved, child maltreatment
also imposes substantial economic costs which can be quantified in a
comprehensive manner. When properly measured, every year that the situation
is allowed to persist at current levels drains literally trillions of dollars in long‐term
business activity. Viewed from this perspective, there is a compelling case for the
investment of public, private, and philanthropic resources into a multi‐faceted
attack on child maltreatment for pecuniary reasons that go beyond the obvious
affront to human dignity and opportunity.

Suffer the Little Children: An Assessment of the Economic Cost of Child Maltreatment
2 | P a g e w w w . p e r r y m a n g r o u p . c o m C o p y r i g h t 2 0 1 4
More than 3.3 million children in
the United States suffered from
first‐time abuse or neglect in 2014,
with lifelong social and economic
consequences.
Every year, millions of children in the United States suffer from some type of abuse or neglect
The Perryman Group estimates that more than 3.3 million children age 17 or younger were maltreated for the first time in 2014. This estimate updates and refines available 2012 data regarding the numbers of cases reported to various child protective services agencies to 2014 based on recent trends and child population estimates.
It reflects only the percentage that were first‐time victims (the proper measure in an incidence study) based on information compiled with regard to substantiated cases in the most recent Child Maltreatment report,1 which is the only information of this type that is available. These findings were confirmed through a second method which made use of the estimated percentage of children (ages 0‐17) reporting some form of maltreatment in the national survey conducted at the University of New Hampshire.2 The two approaches produced virtually identical results.
The major types of child maltreatment include physical abuse, sexual abuse, psychological abuse, and neglect, all of which contribute to significant social service costs, morbidity, and mortality. Moreover, the effects of child maltreatment often endure over an entire lifetime.
Child maltreatment involves a substantial economic cost Even beyond the horrific physical and mental costs of child maltreatment,
there is also a tremendous economic cost.
Following the general pattern in other major studies of the topic, the direct social costs identified for the non‐fatal victims included incremental expenses for health care (childhood and adult), social welfare services, criminal justice (juvenile and adult), and education.3
In addition, productivity and lifetime earnings are affected.
These costs total hundreds of thousands of dollars per victim.
1 US Department of Health & Human Services, Administration for Children and Families, (2013), Child Maltreatment 2012. 2 Finkelhor, David, et al., Violence, Abuse, and Crime Exposure in a National Sample of Children and Youth, Pediatrics 124 (5) (2009); Finkelhor, David, et al., Violence, Crime, and Abuse Exposure in a National Sample of Children and Youth: An Update, JAMA Pediatrics, 167 (7) (2013). 3 See also Corso, P. S. and A. R. Fertig, The Economic Impact of Child Maltreatment in the United States: Are the Estimates Credible? Child Abuse & Neglect 34 (5) (2010).

Suffer the Little Children: An Assessment of the Economic Cost of Child Maltreatment
3 | P a g e w w w . p e r r y m a n g r o u p . c o m C o p y r i g h t 2 0 1 4
The Perryman Group has implemented a more comprehensive measure of the economic cost of child maltreatment than has been presented previously
The general approach used is known as an “incidence study” which evaluates the effects of the initial occurrences in a given period (2014 in this case) over the lifetime of the affected individuals. The report makes extensive use of excellent recent research conducted through the National Center for Injury Prevention and Control, a part of the Centers for Disease Control and Prevention (CDC) and uses the same general categorization of quantifiable harms.4
While many of the prior efforts to quantify economic aspects of child maltreatment reflect excellent and careful scholarship that is highly useful, they only measure certain aspects of the total cost. Incremental outlays for excessive and avoidable health care and education is largely a net withdrawal of resources from the economy that could otherwise be used in more productive ways. Moreover, when the earnings of individuals are diminished, society is deprived of productive capacity and spending potential which results in both losses in output throughout the supply chain and reductions in the demand for consumer goods. The effects of these withdrawals, which have not previously been quantified in a comprehensive manner, cascade through all aspects of business activity.
The Perryman Group’s more comprehensive measurement of the cost of child maltreatment can inform the policy process and offer an economic rationale for investments in education, monitoring, treatment, and other activities aimed at both reducing the prevalence and severity of child abuse and minimizing its long‐term consequences.
4 Fang, Xiangming, et al., The Economic Burden of Child Maltreatment in the United States and Implications for Prevention, Child Abuse & Neglect 36 (2012).

Suffer the Little Children: An Assessment of the Economic Cost of Child Maltreatment
4 | P a g e w w w . p e r r y m a n g r o u p . c o m C o p y r i g h t 2 0 1 4
KEY RESULTS: LIFETIME SOCIAL COSTS AND LOST EARNINGS DUE TO CHILD MALTREATMENT IN 2014
SocialCostsofNon‐FatalChildMaltreatment
Total Expenditures* $1,051,754,556,308
Gross Product* $506,935,982,252
Personal Income* $335,180,266,736
Retail Sales* $129,345,107,948
Person‐Years of Employment 5,712,406
LostEarningsStemmingfromNon‐FatalChildMaltreatment
Total Expenditures* $4,790,521,167,140
Gross Product* $2,165,310,794,660
Personal Income* $1,322,482,760,975
Retail Sales* $594,309,864,183
Person‐Years of Employment 22,050,950
TotalEconomicCostofNon‐FatalChildMaltreatment
Total Expenditures* $5,842,275,723,447
Gross Product* $2,672,246,776,912
Personal Income* $1,657,663,027,711
Retail Sales* $723,654,972,131
Person‐Years of Employment 27,763,357
TotalEconomicCostofFatalChildMaltreatment
Total Expenditures* $25,475,161,062
Gross Product* $11,521,315,782
Personal Income* $7,042,421,367
Retail Sales* $3,160,181,043
Person‐Years of Employment 117,452
*Monetary values are given in constant (2014) dollars and discounted at a real (inflation‐adjusted) rate of 3%. For definitions of these measures of business activity and terms, as well as an overview of methods used, see page 14 and the Appendices to this report.
Source: The Perryman Group
SUMMARY OF FINDINGS FROM THE PERRYMAN GROUP’S ANALYSIS:
The Economic Costs of Child Maltreatment are Massive
The physical and emotional consequences to the victims of child maltreatment represent a truly
incalculable and often irreparable harm which should be sufficient justification for a massive
national effort to both address the underlying causes and minimize the impacts on the victims.
In reality, however, budget constraints and changing priorities have led to reduced funding to the
agencies confronting the issue and fewer public resources for prevention, investigation, and
amelioration. In addition to the very real effects on the individuals involved, child maltreatment
imposes substantial economic costs which can be quantified in a comprehensive manner. When
properly measured, every year that the situation is allowed to persist at current levels drains
literally trillions of dollars in long‐term business activity.

Suffer the Little Children: An Assessment of the Economic Cost of Child Maltreatment
5 | P a g e w w w . p e r r y m a n g r o u p . c o m C o p y r i g h t 2 0 1 4
EconomicAspectsofChildMaltreatment
The economic cost of child maltreatment stems from two primary sources: social costs and lost earnings
Extensive prior research has quantified the direct social costs (health care, social welfare, juvenile and adult crime, and education costs) stemming from child maltreatment. The Perryman Group compiled and analyzed these reports, updating and refining the estimates and expanding them to reflect the full costs as the various direct effects work their way through the economy. (See the Appendices to this report for a discussion.)
These effects also lead to a reduction in earnings as work ability, productivity, and education levels are negatively affected. This loss, in turn, has ripple effects throughout the economy.
Note that the present analysis uses the “incidence” approach to measure the economic consequences of child maltreatment in a given year (2014) as they are manifested over the life cycle of the affected individuals. This approach is commonly used in health‐related studies and is appropriate for policy evaluation.
Social Costs
•Additional health care expense
•Increased social welfare needs
•Increased crime rates
•Additional educational expense
Lost Earnings •Lost productivity and earnings.
The Direct
Economic Cost
of Child
Maltreatment

Suffer the Little Children: An Assessment of the Economic Cost of Child Maltreatment
6 | P a g e w w w . p e r r y m a n g r o u p . c o m C o p y r i g h t 2 0 1 4
The costs of child maltreatment include increased social welfare costs as well as earnings losses due to poor health and reduced educational attainment
Higher social costs are only part of the economic cost associated with health care. There are significant multiplier effects associated with this use of resources, because in most cases these social costs represent avoidable and unproductive diversions from the economy. For example, health care costs are typically funded by government programs (such as Medicaid), not paid at all and thus manifested in higher insurance premiums, or provided by public hospitals (which rely on funds from local taxpayers). They thus represent net withdrawals from the system.5 Similarly, the increased outlays for unemployment, criminal detention, social programs and other costs associated with child maltreatment are generally funded through public sources.6 If these resources could instead be deployed productively into the economy, they would generate multiplier effects which would further enhance overall business activity.
Lifetime earnings and productivity losses also involve a substantial social cost. As the potential output from workers not available due to health issues and social dysfunction is lost, society also foregoes the total output the worker would have produced including its effects through the supply chain and reduced consumer spending stemming from lower payrolls.
Prior studies have only partially measured these economic costs Prior studies have measured some components of the economic cost of
child maltreatment and provide valuable insights. These studies (referenced in the Appendices to this report) served as a partial basis for this analysis.
The Perryman Group’s analysis updates and extends prior analyses. Effects are updated to estimated levels for 2014 based on changes in relevant populations and trends in incidence. In addition, alternative price indices are used in some instances because they more closely align with the constructs being measured. In addition, a larger baseline level of incidence was
5 Because virtually all of the incremental health care in this population is funded through uncompensated care, federal programs, and local tax revenues, its provision represents an avoidable diversion of economic resources that has ripple effects throughout the economy. This direct cost is estimated and allocated using the incidence of health outlays across industrial sectors as measured by the relevant coefficients of the US Multi‐Regional Impact Assessment System (net of the direct health expenditures). 6 In the case of other (non‐health care) social costs, the direct allocation is achieved based on the distribution of economic output through the economy, which represents a reasonable representation of the overall tax burden

Suffer the Little Children: An Assessment of the Economic Cost of Child Maltreatment
7 | P a g e w w w . p e r r y m a n g r o u p . c o m C o p y r i g h t 2 0 1 4
determined which is more consistent with the likely magnitude of child maltreatment incidence.
The Perryman Group also integrates findings from the public health study with the dynamic impact modeling process in order to more fully capture the overall social costs as they ripple through the economy.

Suffer the Little Children: An Assessment of the Economic Cost of Child Maltreatment
8 | P a g e w w w . p e r r y m a n g r o u p . c o m C o p y r i g h t 2 0 1 4
MeasuringEconomicImpacts
Any economic stimulus, whether positive or negative, generates multiplier effects throughout the economy. In
this instance, the overall costs of child maltreatment stem from social costs (health care, social welfare, crime, and
education) as well as lost earnings. (These outcomes have been the subject of prior empirical study, as noted
above, though prior studies did not fully capture the associated ripple effects through the economy.)
Once the direct stimulus was quantified, the associated multiplier effects were measured using The Perryman
Group’s input‐output assessment model (the US Multi‐Regional Impact Assessment System, which is described in
further detail in the Appendices to this report) developed by the firm some 30 years ago and consistently
maintained and updated since that time. The model has been used in hundreds of analyses for clients ranging
from major corporations to government agencies. It uses a variety of data (from surveys, industry information,
and other sources) to describe the various goods and services (known as resources or inputs) required to produce
another good/service. This process allows for estimation of the total economic impact (including multiplier
effects) of the social costs and lost earnings stemming from child maltreatment. The model used in the current
analysis reflects the specific industrial composition and characteristics of the US economy and each of the
individual states.
These total economic effects are quantified for key measures of business activity:
Total expenditures (or total spending) measure the dollars changing hands as a result of the economic
stimulus.
Gross product (or output) is production of goods and services that will come about in each area as a result of
the activity. This measure is parallel to the gross domestic product numbers commonly reported by various
media outlets and is a subset of total expenditures.
Personal income is dollars that end up in the hands of people in the area; the vast majority of this aggregate
derives from the earnings of employees, but payments such as interest and rents are also included.
Job gains are expressed as person‐years of employment because the study is evaluating cumulative lifetime
effects.
Monetary values were quantified on a constant (2014) basis on a net present value basis. See the Appendices to
this report for additional information regarding the methods and assumptions used in this analysis.

Suffer the Little Children: An Assessment of the Economic Cost of Child Maltreatment
9 | P a g e w w w . p e r r y m a n g r o u p . c o m C o p y r i g h t 2 0 1 4
The economic cost of first-time child maltreatment in the US in 2014 includes almost $5.9 trillion in lifetime spending, $2.7 trillion in lost gross domestic product, and 27.9 million person-years of employment
The Perryman Group estimates that each occurrence of first‐time child maltreatment costs the US economy about $1.8 million in total expenditures, $800,000 in gross product and $500,000 in personal income.7
The overall losses associated with non‐fatal child maltreatment stem from the following major sources (with additional detail provided in the accompanying table):
o Incremental spending for health care during childhood leads to economic
losses including $270.998 billion in gross product and 3,158,946 person‐years
of employment.
o Spending for incremental health care during adulthood involves economic
losses of $109.742 billion in gross product and 1,279,227 person‐years of
employment.
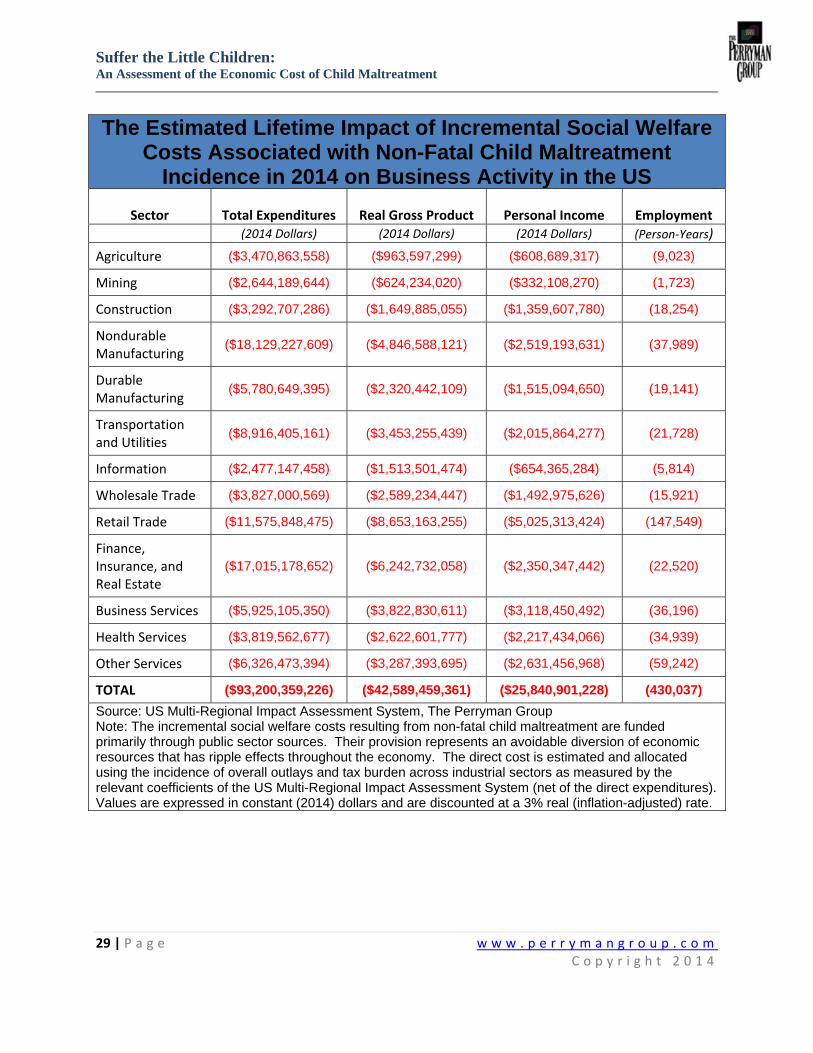
o The additional social welfare costs stemming from child maltreatment lead
to losses of an estimated $42.589 billion in gross product and 430,037
person‐years of employment.
o Juvenile crime linked to child maltreatment causes losses of an estimated
$11.192 billion in gross product and 113,010 person‐years of employment.
Incremental adult crime adds losses of another $27.062 billion in gross
product and 273,250 jobs.
o Increased costs of education lead to losses of an estimated $45.352 billion in
gross product each year and 457,936 person‐years of employment.
o The lifetime reduction in earnings associated with child maltreatment
includes losses of an estimated $2.2 trillion in gross product and 22,050,950
person‐years of employment.
For fatal child maltreatment incidences, total losses include $11.5 billion in gross
product (with $11.4 billion from lost earnings) and 117,452 person‐years of
employment (116,486 from lost earnings).
These amounts represent a significant and ongoing drain on business activity over time.
7 Values are given in constant (2014) dollars and are discounted at a 3% real (inflation‐adjusted) rate. They are fully adjusted for (1) the likelihood of substitution among workers (which reduces the amount reflected in individual losses), (2) the production losses associated with a reduced supply of labor, and (3) the spinoff effects on suppliers and consumer spending of the reduced productive capacity. They reflect the lifetime amounts stemming from incidences of child maltreatment occurring in 2014.

Suffer the Little Children: An Assessment of the Economic Cost of Child Maltreatment
10 | P a g e w w w . p e r r y m a n g r o u p . c o m C o p y r i g h t 2 0 1 4
The Total Estimated Lifetime Economic Costs of Child Maltreatment Incidence in 2014
(Dollar amounts in billions)
Total Expenditures
Gross Product
Personal Income
Employment (person‐years)
Non‐Fatal
Incidence
Social Costs
Childhood Health
$552.043 $270.998 $184.071 3,158,946
Adult Health
$223.552 $109.742 $74.540 1,279,227
Social Welfare
$93.200 $42.589 $25.841 430,037
Juvenile Crime
$24.492 $11.192 $6.791 113,010
Adult Crime
$59.220 $27.062 $16.420 273,250
Education $99.247 $45.352 $27.517 457,936
TOTAL $1,051.755 $506.936 $335.180 5,712,406
Lost Earnings
$4,790.521 $2,165.311 $1,322.483 22,050,950
TOTAL $5,842.276 $2,672.247 $1,657.663 27,763,357
Fatal Incidence
Social Costs (Health)
$0.169 $0.083 $0.056 966
Lost Earnings
$25.306 $11.438 $6.986 116,486
TOTAL $25.475 $11.521 $7.042 117,452
TOTAL LOSSES: Fatal and Non‐Fatal Incidence of Child Maltreatment
$5,867.751 $2,683.768 $1,664.705 27,880,809
SOURCE: The Perryman Group Note: Totals may not add due to rounding. Effects on US business activity stemming from incidents occurring in 2014.

Suffer the Little Children: An Assessment of the Economic Cost of Child Maltreatment
11 | P a g e w w w . p e r r y m a n g r o u p . c o m C o p y r i g h t 2 0 1 4
CostsofChildMaltreatmentbyState
Economic costs of child maltreatment are naturally highest in the most populous states
Job losses (person‐years over the lifetime of the first‐time victims in 2014) stemming from child maltreatment range from 26,700 in Hawaii to almost 3.5 million in California.
Additional results are provided in the following graphs and the Appendices to this report.

Suffer the Little Children: An Assessment of the Economic Cost of Child Maltreatment
12 | P a g e w w w . p e r r y m a n g r o u p . c o m C o p y r i g h t 2 0 1 4

Suffer the Little Children: An Assessment of the Economic Cost of Child Maltreatment
13 | P a g e w w w . p e r r y m a n g r o u p . c o m C o p y r i g h t 2 0 1 4
Conclusion
Child maltreatment is nothing short of tragic Millions of children are suffering from abuse or neglect. Consequences are
lifelong, affecting mental and physical health and wellbeing.
Scarce resources and dwindling budgets are exacerbating the problem, with insufficient monitoring, intervention, and treatment in all too many cases. The problem will likely intensify over time without concerted efforts to improve the situation.
There is not an easy solution to the problem of child maltreatment, but the economic losses clearly support additional investment aimed at dealing with the underlying causes
Child maltreatment costs the US economy millions of jobs and trillions in spending each year that it is allowed to persist at current levels.
Investment in education and other programs aimed at reducing root causes of child maltreatment and expanded services for its victims can be helpful and are well worth the expenditures involved.
This report clearly illustrates an economic case for the investment of substantial public and private resources to aggressively address this pressing social issue.
More importantly, reducing the incidence and severity of child abuse can help to prevent an enormous human tragedy.

Suffer the Little Children: An Assessment of the Economic Cost of Child Maltreatment
14 | P a g e w w w . p e r r y m a n g r o u p . c o m C o p y r i g h t 2 0 1 4
APPENDICES

Suffer the Little Children: An Assessment of the Economic Cost of Child Maltreatment
15 | P a g e w w w . p e r r y m a n g r o u p . c o m C o p y r i g h t 2 0 1 4
AboutThePerrymanGroup
• The Perryman Group (TPG) is an economic research and analysis firm based in Waco, Texas. The
firm has more than 30 years of experience in assessing the economic impact of corporate
expansions, regulatory changes, real estate developments, public policy initiatives, and myriad
other factors affecting business activity. TPG has conducted hundreds of impact analyses for
local areas, regions, and states throughout the US. Impact studies have been performed for
hundreds of clients including many of the largest corporations in the world, governmental
entities at all levels, educational institutions, major health care systems, utilities, and economic
development organizations.
• Dr. M. Ray Perryman, founder and President of the firm, developed the US Multi‐Regional
Impact Assessment System (used in this study) in the early 1980s and has consistently
maintained, expanded, and updated it since that time. The model has been used in hundreds of
diverse applications and has an excellent reputation for reliability. A major study developed
using the relevant model was recently published in The Journal of Medical Economics. Dr.
Perryman has been asked to testify before the State legislature, Congress, and other major
legislative and regulatory bodies on more than one hundred occasions, including invited
testimony related to numerous social issues.
• The firm has conducted numerous investigations in the areas of public policy, the economics of
health and wellness, and the economics of education. Health care and related studies include
measuring the comprehensive cost of cancer (including treatment as well as lost productivity
and premature mortality) on multiple occasions. In addition, the firm measured economic
aspects of obesity including associated morbidity, mortality, and productivity. The Perryman
Group has performed assessments of scores of major medical facilities, teaching institutions,
and research programs. Representative efforts public policy studies related to health care issues
include analyses of Medicaid and Children’s Health Insurance Program (CHIP) funding, wellness
initiatives, more extensive use of Advanced Practice Registered Nurses, mental health programs,
and economics of Medicaid expansion. In the area of education, the firm has studied the
economic impact of education and enhancing outcomes and educational attainment on dozens
of occasions for major universities, the Bill and Melinda Gates Foundation, the Texas Higher
Education Coordinating Board, and numerous others.

Suffer the Little Children: An Assessment of the Economic Cost of Child Maltreatment
16 | P a g e w w w . p e r r y m a n g r o u p . c o m C o p y r i g h t 2 0 1 4
MethodsUsed
• The basic modeling technique employed in this study is known as dynamic input‐output analysis.
This methodology essentially uses extensive survey data, industry information, and a variety of
corroborative source materials to create a matrix describing the various goods and services
(known as resources or inputs) required to produce one unit (a dollar’s worth) of output for a
given sector. Once the base information is compiled, it can be mathematically simulated to
generate evaluations of the magnitude of successive rounds of activity involved in the overall
production process.
• There are two essential steps in conducting an input‐output analysis once the system is
operational. The first major endeavor is to accurately define the levels of direct activity to be
evaluated.
• A relatively detailed and comprehensive methodology was employed to quantify the various
direct components of the cost of child maltreatment that are amenable to dynamic input‐output
analysis. The general approach is known as an “incidence study,” which evaluates the effects of
the initial occurrences in a given period (2014 in this case) over the lifetime of the affected
individuals. The report makes extensive use of excellent recent research conducted through the
National Center for Injury Prevention and Control, a part of the Centers for Disease Control and
Prevention (CDC) and uses the same general categorization of quantifiable harms.8 It goes
beyond the prior work, however, in that it (1) updates the effects to the estimated levels for
2014, (2) uses alternative price indices in some instances which are more closely aligned with
the constructs being measured, (3) determines a larger baseline level of incidence which is more
consistent with the likely magnitude of child maltreatment occurrences, and (4) integrates and
extends the findings from public health studies with the dynamic impact modeling process in
order to more fully capture the overall social costs as they ripple through the economy. The use
of this approach also permits the characterization of economic losses in terms of multiple
indicators of economic activity (expenditures, output, income, sales, and employment) and
avoids the issue in the original study (and many similar efforts in different contexts) of
combining costs/expenditure and income concepts in a single measure. The study also makes
use of excellent survey research conducted by through the Crimes Against Children Research
Center at the University of New Hampshire,9 as well as information from the US Department of
8 Fang, Xiangming, et al., The Economic Burden of Child Maltreatment in the United States and Implications for Prevention, Child Abuse & Neglect 36 (2012). 9 Finkelhor, David, et al., The Victimization of Children and Youth: A Comprehensive, National Survey, Child Maltreatment 10 (1) (2005); Finkelhor, David, et al., Violence, Abuse, and Crime Exposure in a National Sample of

Suffer the Little Children: An Assessment of the Economic Cost of Child Maltreatment
17 | P a g e w w w . p e r r y m a n g r o u p . c o m C o p y r i g h t 2 0 1 4
Health and Human Services, including the annual Child Maltreatment report10 and the periodic
National Incidence Study11 of Child Abuse and Neglect. Other relevant research will be noted as
appropriate below.
• For modeling purposes, separate calculations regarding social costs and lost income were
implemented for non‐fatal and fatal child maltreatment occurrences. The initial task is to define
the relevant number of cases in each category. For non‐fatal cases, two different measures
were determined. First, the total number of cases reported to various child protective services
agencies was compiled. The most recent data (2012) was updated based to a 2014 estimate
based on recent trends and child population estimates. The results were fully adjusted for the
estimated undercount of children in the 2010 Census of Population.12 They were further
adjusted to reflect predicted outcomes in states for which information was not reported (based
on share of population in the relevant age group). The values were then reduced to reflect the
percentage that were first‐time victims (the proper measure in an incidence study) based on
information compiled with regard to substantiated cases in the most recent Child Maltreatment
report,13 which is the only information of this type that is available. It was determined that
investigated cases were a better measure that substantiated cases to capture the extent of the
problem in that (1) there is substantial evidence of undercounting in these reports,14 (2)
research indicates similar outcomes in substantiated and unsubstantiated cases, 15(3) criteria for
substantiation are likely different across reporting states, and (4) budget constraints in many
states in recent years have likely limited the capability to substantiate cases.
Children and Youth, Pediatrics 124 (5) (2009); Finkelhor, David, et al., Violence, Crime, and Abuse Exposure in a National Sample of Children and Youth: An Update, JAMA Pediatrics, 167 (7) (2013). 10 US Department of Health & Human Services, Administration for Children and Families, (2013), Child Maltreatment 2012. 11 Sedlak, A. J., et al., (2010) Fourth National Incidence Study of Child Abuse and Neglect (NIS‐4): Report to Congress, US Department of Health and Human Services, Administration for Children and Families. 12 US Department of Commerce, US Census Bureau, (2014), The Undercount of Young Children, 13 US Department of Health & Human Services, Administration for Children and Families, (2013), Child Maltreatment 2012. 14 Haugaard, J. J., and R. E. Emery, Methodological Issues in Child Sexual Abuse Research, Child Abuse & Neglect, 13(1) (1989); Swahn, J. E., et al., Concordance Between Self‐reported Maltreatment and Court Records of Abuse or Neglect Among High‐risk Youths, American Journal of Public Health 96 (10) (2006); Hussey, J. M., J. J. Change, and J. B. Kotch, Child Maltreatment in the United States: Prevalence, Risk Factors, and Adolescent Health Consequences, Pediatrics 118 (3) (2006); Waldfogel, J., (1998), The Future of Child Protection: How to Break the Cycle of Abuse and Neglect, Cambridge, MA: Harvard University Press. 15 Kohl, P. L., M. Jonson‐Reid, and B. Drake, Time to Leave Substantiation Behind: Findings from a National Probability Study, Child Maltreatment 14(1) (2009); Drake, B., Unraveling Unsubstantiated, Child Maltreatment 1 (3) (1996); Hussey, J. M., et al., Defining Maltreatment According to Substantiation: Distinction Without a Difference? Child Abuse & Neglect 29 (5) (2005); Leiter, J., K. A. Myers, and M. T. Zingraff, Substantiated and Unsubstantiated Cases of Child Maltreatment: Do Their Consequences Differ? Social Work Research 18 (2) (1994).

Suffer the Little Children: An Assessment of the Economic Cost of Child Maltreatment
18 | P a g e w w w . p e r r y m a n g r o u p . c o m C o p y r i g h t 2 0 1 4
• The second method made use of the estimated percentage of children (ages 0‐17) reporting
some form of maltreatment in the national survey conducted at the University of New
Hampshire.16 Although it was not statistically significant, the past two surveys showed a modest
drop in the rate of incidence. This pattern was assumed to continue through 2014 as a measure
of conservatism in the analysis. The resulting estimated number of cases was then reduced by
the percentage that met the “Harm Standard” in the latest National Incidence Study17 and the
proportion of first‐time cases described above. The resulting estimate was virtually identical to
that obtained by the method described above (differing by only about 0.4%). Thus, the mean of
the two values was employed. It should be noted that there is always a risk of understating the
true extent of child maltreatment due to the natural reluctance to report such episodes. There
is evidence to suggest, however, that a confidential telephone survey of the type used in these
studies is more likely to elicit valid responses than in‐person methods.18
• With regard to the fatal situations, estimates for 2012 were obtained from the Child
Maltreatment report.19 In the instances where states did not report (representing less than 3%
of the child population in the United States), the total was estimated based on patterns in the
other states. Projections to 2014 were generated based on growth in the relevant demographic
cohorts which was consistent with observed fatalities in recent years.
• The next task was defining the direct costs per victim in both categories, which is then multiplied
by the overall estimated number of victims to determine the total direct effects. Following the
general pattern in the CDC analysis, the social costs identified for the non‐fatal victims included
incremental expenses for health care (childhood and adult), social welfare services, criminal
justice (juvenile and adult), and education.20 Lost earnings are also quantified. In all cases (both
for costs and lost earnings), lifetime effects are computed from age six, the approximate median
age of victims.21 All values are expressed in constant (2014) dollars and are discounted at a 3%
16 Finkelhor, David, et al., Violence, Abuse, and Crime Exposure in a National Sample of Children and Youth, Pediatrics 124 (5) (2009); Finkelhor, David, et al., Violence, Crime, and Abuse Exposure in a National Sample of Children and Youth: An Update, JAMA Pediatrics, 167 (7) (2013). 17 Sedlak, A. J., et al., (2010) Fourth National Incidence Study of Child Abuse and Neglect (NIS‐4): Report to Congress, US Department of Health and Human Services, Administration for Children and Families. 18 Acierno, R., et al., Assessing Elder Victimization: Demonstration of a Methodology, Social Psychiatry and Psychiatric Epidemiology 38 (11) (2003); Taylor, A., I’ll Call You Back on My Mobile: A Critique of the Telephone Interview with Adolescent Boys, Westminister Studies in Education 25 (1) (2002). 19 US Department of Health & Human Services, Administration for Children and Families, (2013), Child Maltreatment 2012. 20 See also Corso, P. S. and A. R. Fertig, The Economic Impact of Child Maltreatment in the United States: Are the Estimates Credible? Child Abuse & Neglect 34 (5) (2010). 21 US Department of Health & Human Services, Administration for Children and Families, (2013), Child Maltreatment 2012.

Suffer the Little Children: An Assessment of the Economic Cost of Child Maltreatment
19 | P a g e w w w . p e r r y m a n g r o u p . c o m C o p y r i g h t 2 0 1 4
real (inflation‐adjusted) rate (which is standard in health and related policy studies)22 to convert
the findings to a net present value basis.
• The direct health costs for both children and adults were derived from separate studies which
examined these issues in detail and focused on incremental costs.23 Values were updated to
2014 dollars using the Consumer Price Index for Medical Costs, which is maintained by the
Bureau of Labor Statistics of the US Department of Labor. With respect to adult costs, although
the original analysis did not consider costs beyond age 64, they were extended to average life
expectancy in the current report based on the same annual level of expenses. This approach
reflects the facts that (1) there is no reason to expect the health effects to diminish at that
point, (2) health costs typically increase among older adults, thus making it probable that this
amount is understated, and (3) amounts occurring decades into the future have relatively small
effects when, as in the present case, expressed on a net present value basis. Separate impact
findings are given for childhood and adult costs.
• The direct social welfare costs estimates again used the basic approach in the CDC study
although a different base year (2014) and a different inflation index (the Consumer Price Index
maintained by the Bureau of Labor Statistics) was employed. Although no lifetime estimates
have been compiled, evidence suggests that such spending exhibits steady‐state properties over
time, thus permitting the use of annual outlays as an appropriate proxy for the lifetime effects in
a given year.24 The most recent data available was thus updated to 2014 dollars and used in the
analysis.25
• The criminal justice expenses are based on the incremental probability of criminal activity
among juveniles and adults and the associated typical costs. Net present values for are
calculated from age six based on a mean first arrest age of 14 for juveniles and 23 for adults.26
Initial values for incremental costs and information that permits computation of the relevant
probabilities are obtained from a prior study,27 then converted to 2014 dollars using the
22 Gold, M. R., et al., (1996), Cost‐effectiveness in Health and Medicine, New York, NY: Oxford University Press. 23 See, respectively, Florence, C. S., et al., (2012), The Health Care Costs Associated with Child Maltreatment: Implications for Medicaid. Manuscript submitted for publication; Bonomi, A. E., et al., Health Care Utilization and Costs Associated with Childhood Abuse , Journal of General Internal Medicine 23 (3) (2008). 24 See Barnett, A., et al., The Costs of Cancer to a Major Employer in the United States: A Case‐Control Analysis, American Journal of Managed Care 6 (11) (2000); Birnbaum, H., S. Leong, and A. Kabra, Lifetime Medical Costs for Women: Cardiovascular Disease, Diabetes, and Stress Urinary Incontinence, Women’s Health Issues 13 (6) (2003). 25 DeVooght, K., T. Allen, and R. Green, Federal, State, and Local Spending to Address Child Abuse and Neglect in SFY 2006, Casey Family Programs, December 2008 with technical revisions made in 2012 and 2014, available at, http://www.childtrends.org/wp‐content/uploads/2014/05/2008‐43AbuseNeglectFinancePaper20062.pdf. 26 See Reynolds, A. J., et al., Age 21 Cost‐benefit Analysis of the Title I Chicago Child‐Parent Centers, Educational Evaluation and Policy Analysis 24 (4) (2002). 27 Widom, C. S. and M. G. Maxfield, An Update on the ‘Cycle of Violence,’ Research in Brief, Washington, D.C., National Institute of Justice, (2001), NCJ 184894, available at http://www.ncjrs.gov/pdffiles1/nij/184894.pdf.

Suffer the Little Children: An Assessment of the Economic Cost of Child Maltreatment
20 | P a g e w w w . p e r r y m a n g r o u p . c o m C o p y r i g h t 2 0 1 4
Consumer Price Index, converted to net present value, and expressed on a per victim basis.
Separate impact results are provided for juvenile and adult criminal activity.
• The additional educational expenses reflect the incremental probability that additional
resources will be required and the supplemental costs associated with the special requirements.
Probability estimates are provided in a prior study,28 as are the added costs on an annual basis
starting at a mean age of eight.29 These values are converted to 2014 dollars using the Consumer
Price Index and computed as a cost per maltreatment victim in terms of net present value.
• It should be noted that all of these social costs represent avoidable and unproductive diversions
from the economy. For example, health care spending resulting from child maltreatment is an
avoidable social cost that is typically funded by public health facilities (such as hospitals and
clinics), governmental insurance programs (such as Medicaid), local taxes, and uncompensated
care which is recouped from public resources and higher private insurance premiums. As a
result, if these resources could be deployed into economy, they would generate multiplier
effects which would further enhance overall business activity. This direct cost is allocated for
modeling purposes based upon the final incidence of health care outlays (net of direct spending)
as measured by the relevant coefficients of the US Multi‐Regional Impact Assessment System.30
This model, which is described in some detail below, is then used to estimate these overall
effects.
• Similarly, much like the incremental health expenditures described above, the additional outlays
associated with social welfare programs, criminal justice, and education represent avoidable
expenses that are essentially borne by taxpayers, thus diverting resources that would otherwise
flow into other areas of economic activity. Thus, the net effect is again properly subject to
impact analysis. In these categories, the allocation across sectors is based on overall
contribution to economic activity (a proxy for tax liability) adjusted for the direct effects of the
initial expenditures.
• With regard to the lost earnings (productivity) associated with child maltreatment, a recent
study used longitudinal data and controlled for various demographic factors to quantify the
typical annual effect on income.31 These values are converted to 2014 dollars using the Implicit
Price (Gross Domestic Product) Deflator maintained by the Bureau of Economic Analysis of the
28 See Jonson‐Reid, M., et al., A Prospective Analysis of the Relationship Between Reported Child Maltreatment and Special Education Eligibility Among Poor Children, Child Maltreatment, 9 (4) (2004). 29 See Reynolds, A. J., et al., Age 21 Cost‐benefit Analysis of the Title I Chicago Child‐Parent Centers, Educational Evaluation and Policy Analysis 24 (4) (2002). 30 For a discussion of this system in a different context, see Perryman, M. Ray and Virginia Gleghorn, Obesity‐Related Costs and the Economic Impact of Laparoscopic Adjustable Gastric Banding Procedures: Benefits in the Texas Employees Retirement System, Journal of Medical Economics (2010). 31 Currie, J. and C. S. Widom, Long‐term Consequences of Child Abuse and Neglect on Adult Economic Well‐being, Child Maltreatment, 15 (2) (2010).

Suffer the Little Children: An Assessment of the Economic Cost of Child Maltreatment
21 | P a g e w w w . p e r r y m a n g r o u p . c o m C o p y r i g h t 2 0 1 4
US Department of Commerce. This index is a broad measure of prices in the overall economy
and is thus appropriate given that these losses would span the entire spectrum of business
production. The income is then expressed on a net present value basis assuming 1% growth in
annual productivity (as reflected in real wages), a 3% real discount rate, the relevant incident at
age six, and retirement at age 65. The assumption regarding productivity gains is commonly
used in health‐related analysis,32 but is likely conservative in that current econometric
projections generally anticipate long‐term gains of about 1.7% per annum.33
• The income estimates noted above represent the estimated lifetime losses for the individual
victims involved. To translate these private losses into social costs, it is first necessary to
recognize that some of the lost earnings will be recouped by others as employers substitute
among workers. The capacity for such substitution is constrained by capacity, which may be
represented by the unemployment rate in the relevant population (including those who have
recently withdrawn from the labor force for economic reasons). This assumption treats the
capacity for substitution as being equivalent to that of the average or typical employer. This
level of offset modestly overstates the likely ability to reallocate (and, thus, understates the
overall harm) in that a certain level of frictional unemployment is always present.
• Once this direct social cost in terms of lost lifetime earnings has been quantified, it must be
further noted that the overall impacts on the economy include not only the funds flowing to
individuals, but also the associated lost production from reduced resource availability. These
values may be quantified using coefficients from the US Multi‐Regional Impact Assessment
System to translate income into the associated losses in output, spending and jobs. The losses
are allocated across industrial sectors based on relative income patterns. Note that, in addition
to providing a more complete set of economic indicators, this translation also eliminates the
aggregating of non‐comparable measures based on income and expenditures which occurs in
the prior studies. Moreover, because these production losses also bring declines in activity to
both suppliers and those providing consumer goods to be purchased with the unrealized
earnings, it is necessary to perform an impact analysis in order to properly characterize the total
effects in this segment of the analysis. Once these calculations are completed, the sum of those
associated with incremental social costs and those emanating from corresponding losses in
lifetime earnings constitute the total consequences of new instances of non‐fatal child
maltreatment in a given year (2014 in this instance).
• The situations resulting in fatalities obviously do not result in social welfare, criminal justice, or
educational costs. The direct health care costs and lost earnings are obtained from a previous
32 See Grosse, S. D., Appendix I. Productivity Loss Tables, in Haddix, A. C., S. M. Teutsch, and P. S. Corso (eds.), (2003), Prevention Effectiveness: A Guide to Decision Analysis and Economic Evaluation, 2nd ed., New York, NY: Oxford University. 33 See, for example, The Perryman Economic Forecast: Long‐Term Outlook for the United States, Texas, and Major Texas Metropolitan Statistical Areas, Texas Economic Publishers, Inc., Summer 2014.

Suffer the Little Children: An Assessment of the Economic Cost of Child Maltreatment
22 | P a g e w w w . p e r r y m a n g r o u p . c o m C o p y r i g h t 2 0 1 4
report34 and converted to lifetime discounted levels and analyzed in a manner directly
comparable to that described above. The median age for fatal incidents is somewhat younger,
which is reflected in the estimates.
• The final major phase of the analysis is the simulation of the input‐output system to measure
overall economic effects of the direct economic effects. The present study was conducted
within the context of the US Multi‐Regional Impact Assessment System (USMRIAS) which was
developed and is maintained by The Perryman Group. This model has been used in hundreds of
diverse applications across the country and has an excellent reputation for accuracy and
credibility. The system used in the current simulations reflects the unique industrial structure
and characteristics of the US economy and the various states.
• The proportion of activity that occurs across state lines was based on patterns in business
activity by industry as well as “gravity” modeling of the likely location of indirect and induced
spending. This technique, which estimates the flow of resources based on capacity and
geographic proximity, is a widely used and accepted method to allocate activity within and
across geographic boundaries.
• The USMRIAS is somewhat similar in format to the Input‐Output Model of the United States and
the Regional Input‐Output Modeling System, both of which are maintained by the US
Department of Commerce. The model developed by TPG, however, incorporates several
important enhancements and refinements. Specifically, the expanded system includes (1)
comprehensive 500‐sector coverage for any county, multi‐county, or urban region; (2)
calculation of both total expenditures and value‐added by industry and region; (3) direct
estimation of expenditures for multiple basic input choices (expenditures, output, income, or
employment); (4) extensive parameter localization; (5) price adjustments for real and nominal
assessments by sectors and areas; (6) measurement of the induced impacts associated with
payrolls and consumer spending; (7) embedded modules to estimate multi‐sectoral direct
spending effects; (8) estimation of retail spending activity by consumers; and (9) comprehensive
linkage and integration capabilities with a wide variety of econometric, real estate,
occupational, and fiscal impact models. The model has been thoroughly tested for
reasonableness and historical reliability.
• The impact assessment (input‐output) process essentially estimates the amounts of all types of
goods and services required to produce one unit (a dollar’s worth) of a specific type of output.
For purposes of illustrating the nature of the system, it is useful to think of inputs and outputs in
dollar (rather than physical) terms. As an example, the construction of a new building will
require specific dollar amounts of lumber, glass, concrete, hand tools, architectural services,
34 Corso, P. S., et al., Medical Costs and Productivity Losses Due to Interpersonal and Self‐directed Violence in the United States, American Journal of Preventive Medicine, 32 (6) (2007).

Suffer the Little Children: An Assessment of the Economic Cost of Child Maltreatment
23 | P a g e w w w . p e r r y m a n g r o u p . c o m C o p y r i g h t 2 0 1 4
interior design services, paint, plumbing, and numerous other elements. Each of these suppliers
must, in turn, purchase additional dollar amounts of inputs. This process continues through
multiple rounds of production, thus generating subsequent increments to business activity. The
initial process of building the facility is known as the direct effect. The ensuing transactions in
the output chain constitute the indirect effect.
• Another pattern that arises in response to any direct economic activity comes from the payroll
dollars received by employees at each stage of the production cycle. As workers are
compensated, they use some of their income for taxes, savings, and purchases from external
markets. A substantial portion, however, is spent locally on food, clothing, health care services,
utilities, housing, recreation, and other items. Typical purchasing patterns in the relevant areas
are obtained from the ACCRA Cost of Living Index, a privately compiled inter‐regional measure
which has been widely used for several decades, and the Consumer Expenditure Survey of the US
Department of Labor. These initial outlays by area residents generate further secondary activity
as local providers acquire inputs to meet this consumer demand. These consumer spending
impacts are known as the induced effect. The USMRIAS is designed to provide realistic, yet
conservative, estimates of these phenomena.
• Sources for information used in this process include the Bureau of the Census, the Bureau of
Labor Statistics, the Regional Economic Information System of the US Department of Commerce,
and other public and private sources. The pricing data are compiled from the US Department of
Labor and the US Department of Commerce. The verification and testing procedures make use
of extensive public and private sources.
• Impacts were measured in 2014 dollars.
• The USMRIAS generates estimates of the effect on several measures of business activity. The
most comprehensive measure of economic activity used in this study is Total Expenditures. This
measure incorporates every dollar that changes hands in any transaction. For example, suppose
a farmer sells wheat to a miller for $0.50; the miller then sells flour to a baker for $0.75; the
baker, in turn, sells bread to a customer for $1.25. The Total Expenditures recorded in this
instance would be $2.50, that is, $0.50 + $0.75 + $1.25. This measure is quite broad, but is
useful in that (1) it reflects the overall interplay of all industries in the economy, and (2) some
key fiscal variables such as sales taxes are linked to aggregate spending.
• A second measure of business activity frequently employed in this analysis is that of Gross
Product, the most commonly reported statistic regarding national economic performance. It is
defined as the value of all final goods produced in a given region for a specific period of time.
Stated differently, it captures the amount of value‐added (gross area product) over intermediate
goods and services at each stage of the production process, that is, it eliminates the double
counting in the Total Expenditures concept. Using the example above, the Gross Product is

Suffer the Little Children: An Assessment of the Economic Cost of Child Maltreatment
24 | P a g e w w w . p e r r y m a n g r o u p . c o m C o p y r i g h t 2 0 1 4
$1.25 (the value of the bread) rather than $2.50. Alternatively, it may be viewed as the sum of
the value‐added by the farmer, $0.50; the miller, $0.25 ($0.75 ‐ $0.50); and the baker, $0.50
($1.25 ‐ $0.75). The total value‐added is, therefore, $1.25, which is equivalent to the final value
of the bread. In many industries, the primary component of value‐added is the wage and salary
payments to employees.
• The third gauge of economic activity used in this evaluation is Personal Income. As the name
implies, Personal Income is simply the income received by individuals, whether in the form of
wages, salaries, interest, dividends, proprietors’ profits, or other sources. It may thus be viewed
as the segment of overall impacts which flows directly to the citizenry.
• The fourth measure, Retail Sales, represents the component of Total Expenditures which occurs
in retail outlets (general merchandise stores, automobile dealers and service stations, building
materials stores, food stores, drugstores, restaurants, and so forth). Retail Sales is a commonly
used measure of consumer activity.
• The final aggregate used is Permanent Jobs and Person‐Years of Employment. The Person‐
Years of Employment measure reveals the full‐time equivalent jobs generated by an activity. It
should be noted that, unlike the dollar values described above, Permanent Jobs is a “stock”
rather than a “flow.” In other words, if an area produces $1 million in output in 2010 and $1
million in 2011, it is appropriate to say that $2 million was achieved in the 2010‐2011 period. If
the same area has 100 people working in 2010 and 100 in 2011, it only has 100 Permanent Jobs.
When a flow of jobs is measured, such as in a construction project or a cumulative assessment
over multiple years, it is appropriate to measure employment in Person‐Years (a person working
for a year). This concept is distinct from Permanent Jobs, which anticipates that the relevant
positions will be maintained on a continuing basis.

Suffer the Little Children: An Assessment of the Economic Cost of Child Maltreatment
25 | P a g e w w w . p e r r y m a n g r o u p . c o m C o p y r i g h t 2 0 1 4
DetailedSectoralResults

Suffer the Little Children: An Assessment of the Economic Cost of Child Maltreatment
26 | P a g e w w w . p e r r y m a n g r o u p . c o m C o p y r i g h t 2 0 1 4
Components of the Economic Cost of Non-Fatal Child Abuse

Suffer the Little Children: An Assessment of the Economic Cost of Child Maltreatment
27 | P a g e w w w . p e r r y m a n g r o u p . c o m C o p y r i g h t 2 0 1 4
The Estimated Lifetime Impact of Incremental Childhood Health Expenditures Associated with Non-Fatal Child
Maltreatment Incidence in 2014 on Business Activity in the US
Sector
Total Expenditures
Real Gross Product
Personal Income
Employment
(2014 Dollars) (2014 Dollars) (2014 Dollars) (Person‐Years)
Agriculture ($9,928,817,913) ($2,759,960,565) ($1,800,922,350) (27,047)
Mining ($7,101,652,714) ($1,666,470,981) ($942,989,169) (5,287)
Construction ($10,391,948,347) ($5,531,559,921) ($4,558,348,843) (61,223)
Nondurable Manufacturing
($101,284,141,017) ($28,067,649,243) ($14,414,112,524) (218,695)
Durable Manufacturing
($16,252,098,546) ($6,219,323,362) ($4,077,096,544) (53,311)
Transportation and Utilities
($42,616,790,939) ($16,457,974,161) ($9,473,504,498) (99,621)
Information ($10,934,973,250) ($6,720,308,409) ($2,900,666,720) (25,691)
Wholesale Trade ($16,638,261,952) ($11,250,174,354) ($6,486,950,239) (69,032)
Retail Trade ($67,649,903,805) ($50,733,073,255) ($29,491,972,570) (861,228)
Finance, Insurance, and Real Estate
($70,883,289,323) ($18,551,643,102) ($6,920,396,084) (68,209)
Business Services ($20,390,081,386) ($12,291,214,730) ($10,026,481,052) (116,261)
Health Services ($148,146,979,159) ($95,345,604,960) ($80,615,593,658) (1,270,923)
Other Services ($29,823,990,972) ($15,403,405,849) ($12,362,296,180) (282,418)
TOTAL ($552,042,929,321) ($270,998,362,891) ($184,071,330,431) (3,158,946)
Source: US Multi-Regional Impact Assessment System, The Perryman Group Note: The incremental health care outlays resulting from non-fatal child maltreatment are funded through uncompensated care, federal programs, higher private insurance premiums and state and local tax revenues. Its provision represents an avoidable diversion of economic resources that has ripple effects throughout the economy. This direct cost is estimated and allocated using the incidence of health outlays across industrial sectors as reflected in the relevant coefficients of the US Multi-Regional Impact Assessment System (net of the direct health expenditures). Values are expressed in constant (2014) dollars and are discounted at a 3% real (inflation-adjusted) rate.

Suffer the Little Children: An Assessment of the Economic Cost of Child Maltreatment
28 | P a g e w w w . p e r r y m a n g r o u p . c o m C o p y r i g h t 2 0 1 4
The Estimated Lifetime Impact of Incremental Adult Health Expenditures Associated with Non-Fatal Child Maltreatment
Incidence in 2014 on Business Activity in the US
Sector
Total Expenditures
Real Gross Product
Personal Income
Employment
(2014 Dollars) (2014 Dollars) (2014 Dollars) (Person‐Years)
Agriculture ($4,020,711,920) ($1,117,656,345) ($729,290,236) (10,953)
Mining ($2,875,840,807) ($674,843,652) ($381,866,988) (2,141)
Construction ($4,208,258,320) ($2,240,025,863) ($1,845,920,400) (24,792)
Nondurable Manufacturing
($41,015,391,428) ($11,366,099,456) ($5,837,048,735) (88,561)
Durable Manufacturing
($6,581,348,044) ($2,518,538,239) ($1,651,035,483) (21,589)
Transportation and Utilities
($17,257,828,760) ($6,664,718,144) ($3,836,331,051) (40,342)
Information ($4,428,158,284) ($2,721,414,005) ($1,174,635,829) (10,404)
Wholesale Trade ($6,737,726,359) ($4,555,800,149) ($2,626,914,743) (27,955)
Retail Trade ($27,395,081,370) ($20,544,547,616) ($11,942,884,511) (348,757)
Finance, Insurance, and Real Estate
($28,704,452,919) ($7,512,557,206) ($2,802,440,257) (27,621)
Business Services ($8,257,039,660) ($4,977,373,340) ($4,060,260,974) (47,081)
Health Services ($59,992,672,871) ($38,610,559,058) ($32,645,585,931) (514,665)
Other Services ($12,077,336,603) ($6,237,666,765) ($5,006,158,039) (114,366)
TOTAL ($223,551,847,345) ($109,741,799,838) ($74,540,373,177) (1,279,227)
Source: US Multi-Regional Impact Assessment System, The Perryman Group Note: The incremental health care outlays resulting from non-fatal child maltreatment are funded through uncompensated care, federal programs, higher private insurance premiums and state and local tax revenues. Its provision represents an avoidable diversion of economic resources that has ripple effects throughout the economy. This direct cost is estimated and allocated using the incidence of health outlays across industrial sectors as reflected in the relevant coefficients of the US Multi-Regional Impact Assessment System (net of the direct health expenditures). Values are expressed in constant (2014) dollars and are discounted at a 3% real (inflation-adjusted) rate.
Suffer the Little Children: An Assessment of the Economic Cost of Child Maltreatment
29 | P a g e w w w . p e r r y m a n g r o u p . c o m C o p y r i g h t 2 0 1 4
The Estimated Lifetime Impact of Incremental Social Welfare Costs Associated with Non-Fatal Child Maltreatment
Incidence in 2014 on Business Activity in the US
Sector
Total Expenditures
Real Gross Product
Personal Income
Employment
(2014 Dollars) (2014 Dollars) (2014 Dollars) (Person‐Years)
Agriculture ($3,470,863,558) ($963,597,299) ($608,689,317) (9,023)
Mining ($2,644,189,644) ($624,234,020) ($332,108,270) (1,723)
Construction ($3,292,707,286) ($1,649,885,055) ($1,359,607,780) (18,254)
Nondurable Manufacturing
($18,129,227,609) ($4,846,588,121) ($2,519,193,631) (37,989)
Durable Manufacturing
($5,780,649,395) ($2,320,442,109) ($1,515,094,650) (19,141)
Transportation and Utilities
($8,916,405,161) ($3,453,255,439) ($2,015,864,277) (21,728)
Information ($2,477,147,458) ($1,513,501,474) ($654,365,284) (5,814)
Wholesale Trade ($3,827,000,569) ($2,589,234,447) ($1,492,975,626) (15,921)
Retail Trade ($11,575,848,475) ($8,653,163,255) ($5,025,313,424) (147,549)
Finance, Insurance, and Real Estate
($17,015,178,652) ($6,242,732,058) ($2,350,347,442) (22,520)
Business Services ($5,925,105,350) ($3,822,830,611) ($3,118,450,492) (36,196)
Health Services ($3,819,562,677) ($2,622,601,777) ($2,217,434,066) (34,939)
Other Services ($6,326,473,394) ($3,287,393,695) ($2,631,456,968) (59,242)
TOTAL ($93,200,359,226) ($42,589,459,361) ($25,840,901,228) (430,037)
Source: US Multi-Regional Impact Assessment System, The Perryman Group Note: The incremental social welfare costs resulting from non-fatal child maltreatment are funded primarily through public sector sources. Their provision represents an avoidable diversion of economic resources that has ripple effects throughout the economy. The direct cost is estimated and allocated using the incidence of overall outlays and tax burden across industrial sectors as measured by the relevant coefficients of the US Multi-Regional Impact Assessment System (net of the direct expenditures). Values are expressed in constant (2014) dollars and are discounted at a 3% real (inflation-adjusted) rate.

Suffer the Little Children: An Assessment of the Economic Cost of Child Maltreatment
30 | P a g e w w w . p e r r y m a n g r o u p . c o m C o p y r i g h t 2 0 1 4
The Estimated Lifetime Impact of Juvenile Crime Costs Associated with Non-Fatal Child Maltreatment Incidence in
2014 on Business Activity in the US
Sector
Total Expenditures
Real Gross Product
Personal Income
Employment
(2014 Dollars) (2014 Dollars) (2014 Dollars) (Person‐Years)
Agriculture ($912,110,909) ($253,224,477) ($159,957,935) (2,371)
Mining ($694,868,634) ($164,042,939) ($87,274,988) (453)
Construction ($865,293,085) ($433,574,565) ($357,292,376) (4,797)
Nondurable Manufacturing
($4,764,193,693) ($1,273,638,627) ($662,020,836) (9,983)
Durable Manufacturing
($1,519,101,309) ($609,790,770) ($398,152,891) (5,030)
Transportation and Utilities
($2,343,148,983) ($907,483,658) ($529,750,527) (5,710)
Information ($650,971,489) ($397,734,219) ($171,961,157) (1,528)
Wholesale Trade ($1,005,700,428) ($680,426,915) ($392,340,215) (4,184)
Retail Trade ($3,042,026,140) ($2,273,971,439) ($1,320,605,987) (38,775)
Finance, Insurance, and Real Estate
($4,471,431,909) ($1,640,532,368) ($617,649,615) (5,918)
Business Services ($1,557,063,000) ($1,004,604,602) ($819,500,008) (9,512)
Health Services ($1,003,745,819) ($689,195,542) ($582,721,207) (9,182)
Other Services ($1,662,538,818) ($863,896,722) ($691,522,604) (15,568)
TOTAL ($24,492,194,215) ($11,192,116,842) ($6,790,750,345) (113,010)
Source: US Multi-Regional Impact Assessment System, The Perryman Group Note: The incremental social welfare costs resulting from non-fatal child maltreatment are funded primarily through public sector sources. Their provision represents an avoidable diversion of economic resources that has ripple effects throughout the economy. The direct cost is estimated and allocated using the incidence of overall outlays and tax burden across industrial sectors as measured by the relevant coefficients of the US Multi-Regional Impact Assessment System (net of the direct expenditures). Values are expressed in constant (2014) dollars and are discounted at a 3% real (inflation-adjusted) rate.

Suffer the Little Children: An Assessment of the Economic Cost of Child Maltreatment
31 | P a g e w w w . p e r r y m a n g r o u p . c o m C o p y r i g h t 2 0 1 4
The Estimated Lifetime Impact of Incremental Adult Crime Costs Associated with Non-Fatal Child Maltreatment
Incidence in 2014 on Business Activity in the US
Sector
Total Expenditures
Real Gross Product
Personal Income
Employment
(2014 Dollars) (2014 Dollars) (2014 Dollars) (Person‐Years)
Agriculture ($2,205,423,185) ($612,279,852) ($386,767,589) (5,733)
Mining ($1,680,145,891) ($396,644,858) ($211,025,086) (1,095)
Construction ($2,092,220,818) ($1,048,354,305) ($863,909,074) (11,598)
Nondurable Manufacturing
($11,519,501,770) ($3,079,573,032) ($1,600,722,111) (24,139)
Durable Manufacturing
($3,673,085,383) ($1,474,433,305) ($962,707,065) (12,162)
Transportation and Utilities
($5,665,577,556) ($2,194,234,801) ($1,280,901,349) (13,806)
Information ($1,574,005,531) ($961,694,745) ($415,790,579) (3,694)
Wholesale Trade ($2,431,716,385) ($1,645,226,782) ($948,652,405) (10,116)
Retail Trade ($7,355,415,789) ($5,498,310,882) ($3,193,136,968) (93,754)
Finance, Insurance, and Real Estate
($10,811,623,354) ($3,966,697,564) ($1,493,435,468) (14,309)
Business Services ($3,764,874,215) ($2,429,066,750) ($1,981,496,219) (22,999)
Health Services ($2,426,990,271) ($1,666,428,734) ($1,408,980,912) (22,201)
Other Services ($4,019,907,689) ($2,088,844,506) ($1,672,055,415) (37,643)
TOTAL ($59,220,487,837) ($27,061,790,116) ($16,419,580,242) (273,250)
Source: US Multi-Regional Impact Assessment System, The Perryman Group Note: The incremental social welfare costs resulting from non-fatal child maltreatment are funded primarily through public sector sources. Their provision represents an avoidable diversion of economic resources that has ripple effects throughout the economy. The direct cost is estimated and allocated using the incidence of overall outlays and tax burden across industrial sectors as measured by the relevant coefficients of the US Multi-Regional Impact Assessment System (net of the direct expenditures). Values are expressed in constant (2014) dollars and are discounted at a 3% real (inflation-adjusted) rate.

Suffer the Little Children: An Assessment of the Economic Cost of Child Maltreatment
32 | P a g e w w w . p e r r y m a n g r o u p . c o m C o p y r i g h t 2 0 1 4
The Estimated Lifetime Impact of Incremental Educational Costs Associated with Non-Fatal Child Maltreatment
Incidence in 2014 on Business Activity in the US
Sector
Total Expenditures
Real Gross Product
Personal Income
Employment
(2014 Dollars) (2014 Dollars) (2014 Dollars) (Person‐Years)
Agriculture ($3,696,036,048) ($1,026,110,734) ($648,178,074) (9,608)
Mining ($2,815,731,612) ($664,731,241) ($353,653,815) (1,834)
Construction ($3,506,321,877) ($1,756,921,451) ($1,447,812,420) (19,438)
Nondurable Manufacturing
($19,305,362,385) ($5,161,010,829) ($2,682,626,476) (40,454)
Durable Manufacturing
($6,155,669,386) ($2,470,980,936) ($1,613,386,510) (20,383)
Transportation and Utilities
($9,494,857,504) ($3,677,285,601) ($2,146,643,598) (23,137)
Information ($2,637,852,554) ($1,611,689,977) ($696,817,273) (6,191)
Wholesale Trade ($4,075,277,470) ($2,757,211,194) ($1,589,832,513) (16,954)
Retail Trade ($12,326,832,369) ($9,214,537,763) ($5,351,330,947) (157,121)
Finance, Insurance, and Real Estate
($18,119,039,432) ($6,647,729,691) ($2,502,826,380) (23,981)
Business Services ($6,309,496,930) ($4,070,836,986) ($3,320,760,163) (38,544)
Health Services ($4,067,357,045) ($2,792,743,231) ($2,361,290,240) (37,206)
Other Services ($6,736,903,751) ($3,500,663,567) ($2,802,172,903) (63,085)
TOTAL ($99,246,738,364) ($45,352,453,203) ($27,517,331,313) (457,936)
Source: US Multi-Regional Impact Assessment System, The Perryman Group Note: The incremental social welfare costs resulting from non-fatal child maltreatment are funded primarily through public sector sources. Their provision represents an avoidable diversion of economic resources that has ripple effects throughout the economy. The direct cost is estimated and allocated using the incidence of overall outlays and tax burden across industrial sectors as measured by the relevant coefficients of the US Multi-Regional Impact Assessment System (net of the direct expenditures). Values are expressed in constant (2014) dollars and are discounted at a 3% real (inflation-adjusted) rate.

Suffer the Little Children: An Assessment of the Economic Cost of Child Maltreatment
33 | P a g e w w w . p e r r y m a n g r o u p . c o m C o p y r i g h t 2 0 1 4
The Estimated Total Lifetime Impact of Incremental Social Costs Associated with Non-Fatal Child Maltreatment
Incidence in 2014 on Business Activity in the US
Sector
Total Expenditures
Real Gross Product
Personal Income
Employment
(2014 Dollars) (2014 Dollars) (2014 Dollars) (Person‐Years)
Agriculture ($24,233,963,533) ($6,732,829,271) ($4,333,805,500) (64,735)
Mining ($17,812,429,302) ($4,190,967,692) ($2,308,918,316) (12,533)
Construction ($24,356,749,732) ($12,660,321,158) ($10,432,890,894) (140,102)
Nondurable Manufacturing
($196,017,817,901) ($53,794,559,308) ($27,715,724,314) (419,821)
Durable Manufacturing
($39,961,952,063) ($15,613,508,722) ($10,217,473,142) (131,616)
Transportation and Utilities
($86,294,608,902) ($33,354,951,804) ($19,282,995,300) (204,343)
Information ($22,703,108,566) ($13,926,342,829) ($6,014,236,842) (53,322)
Wholesale Trade ($34,715,683,162) ($23,478,073,842) ($13,537,665,741) (144,162)
Retail Trade ($129,345,107,948) ($96,917,604,211) ($56,325,244,407) (1,647,184)
Finance, Insurance, and Real Estate
($150,005,015,590) ($44,561,891,989) ($16,687,095,247) (162,557)
Business Services ($46,203,660,540) ($28,595,927,020) ($23,326,948,908) (270,594)
Health Services ($219,457,307,842) ($141,727,133,301) ($119,831,606,015) (1,889,116)
Other Services ($60,647,151,226) ($31,381,871,105) ($25,165,662,110) (572,323)
TOTAL ($1,051,754,556,308) ($506,935,982,252) ($335,180,266,736) (5,712,406)
Source: US Multi-Regional Impact Assessment System, The Perryman Group Note: Includes incremental health care, social welfare, crime, and educational costs associated with non-fatal child maltreatment. Values are expressed in constant (2014) dollars and are discounted at a 3% real (inflation-adjusted) rate of 3%. See notes to component tables.

Suffer the Little Children: An Assessment of the Economic Cost of Child Maltreatment
34 | P a g e w w w . p e r r y m a n g r o u p . c o m C o p y r i g h t 2 0 1 4
The Estimated Lifetime Impact of Lost Earnings Associated with Non-Fatal Child Maltreatment Incidence in 2014
on Business Activity in the US
Sector
Total Expenditures
Real Gross Product
Personal Income
Employment
(2014 Dollars) (2014 Dollars) (2014 Dollars) (Person‐Years)
Agriculture ($149,268,563,552) ($41,360,905,407) ($27,025,199,278) (406,689)
Mining ($156,515,522,825) ($36,780,649,096) ($19,221,672,875) (105,602)
Construction ($165,610,014,814) ($82,880,168,459) ($68,298,419,075) (919,253)
Nondurable Manufacturing
($937,651,534,370) ($251,160,407,189) ($130,304,620,366) (1,962,274)
Durable Manufacturing
($296,601,518,566) ($117,293,931,281) ($76,532,915,642) (989,988)
Transportation and Utilities
($445,082,437,781) ($176,570,680,097) ($103,368,947,802) (1,124,298)
Information ($134,205,371,054) ($81,968,988,327) ($35,409,665,212) (315,962)
Wholesale Trade ($201,595,934,013) ($136,396,268,939) ($78,647,310,854) (839,274)
Retail Trade ($594,309,864,183) ($443,541,342,082) ($257,456,185,450) (7,579,159)
Finance, Insurance, and Real Estate
($865,579,315,999) ($286,497,062,460) ($108,065,916,583) (1,032,522)
Business Services ($321,877,755,141) ($207,227,860,734) ($169,044,835,039) (1,963,361)
Health Services ($205,026,204,763) ($140,166,933,734) ($118,512,443,934) (1,868,521)
Other Services ($317,197,130,079) ($163,465,596,854) ($130,594,628,865) (2,944,046)
TOTAL ($4,790,521,167,140) ($2,165,310,794,660) ($1,322,482,760,975) (22,050,950)
Source: US Multi-Regional Impact Assessment System, The Perryman Group Note: This measure captures the social costs of the losses in lifetime earnings associated with the occurrence of non-fatal child maltreatment in a given year (2014). Values are expressed in constant (2014) dollars and are discounted at a 3% real (inflation-adjusted) rate. They are fully adjusted for (1) the potential for substitution of other workers in the labor market (2) production losses associated with a reduced supply of labor and (3) the spin-off effects on both suppliers and consumer spending as a result of the reduced productive capacity.
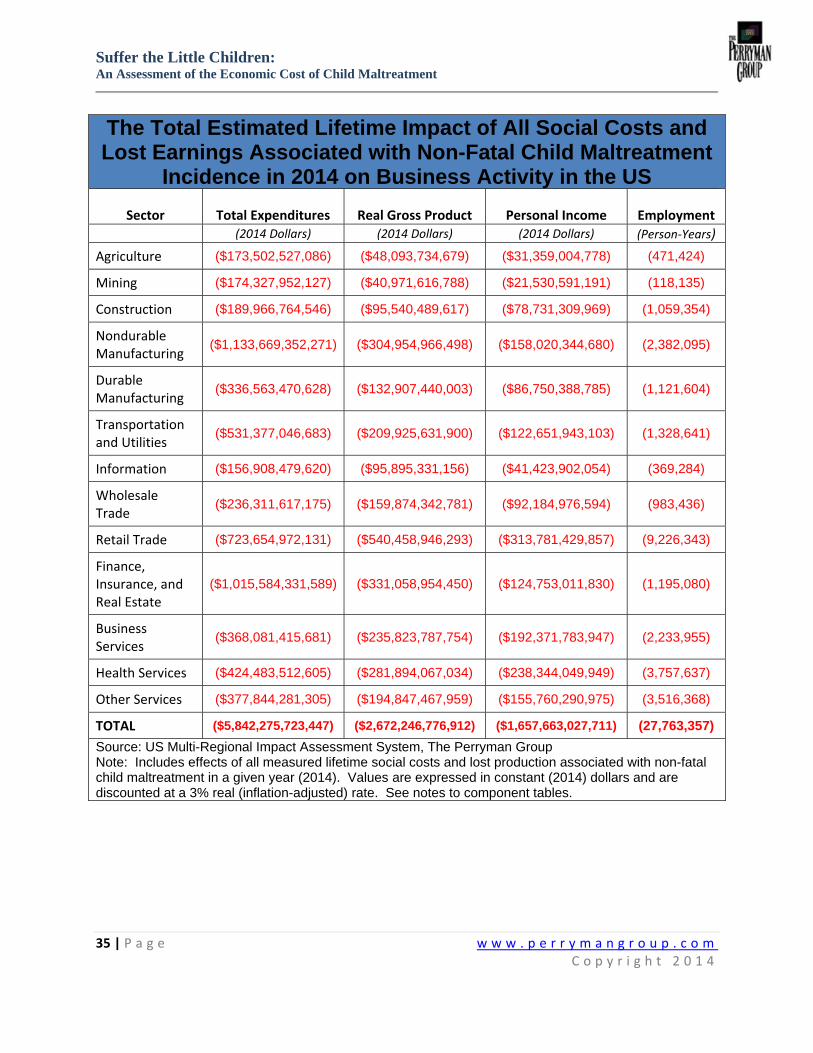
Suffer the Little Children: An Assessment of the Economic Cost of Child Maltreatment
35 | P a g e w w w . p e r r y m a n g r o u p . c o m C o p y r i g h t 2 0 1 4
The Total Estimated Lifetime Impact of All Social Costs and Lost Earnings Associated with Non-Fatal Child Maltreatment
Incidence in 2014 on Business Activity in the US
Sector
Total Expenditures
Real Gross Product
Personal Income
Employment
(2014 Dollars) (2014 Dollars) (2014 Dollars) (Person‐Years)
Agriculture ($173,502,527,086) ($48,093,734,679) ($31,359,004,778) (471,424)
Mining ($174,327,952,127) ($40,971,616,788) ($21,530,591,191) (118,135)
Construction ($189,966,764,546) ($95,540,489,617) ($78,731,309,969) (1,059,354)
Nondurable Manufacturing
($1,133,669,352,271) ($304,954,966,498) ($158,020,344,680) (2,382,095)
Durable Manufacturing
($336,563,470,628) ($132,907,440,003) ($86,750,388,785) (1,121,604)
Transportation and Utilities
($531,377,046,683) ($209,925,631,900) ($122,651,943,103) (1,328,641)
Information ($156,908,479,620) ($95,895,331,156) ($41,423,902,054) (369,284)
Wholesale Trade
($236,311,617,175) ($159,874,342,781) ($92,184,976,594) (983,436)
Retail Trade ($723,654,972,131) ($540,458,946,293) ($313,781,429,857) (9,226,343)
Finance, Insurance, and Real Estate
($1,015,584,331,589) ($331,058,954,450) ($124,753,011,830) (1,195,080)
Business Services
($368,081,415,681) ($235,823,787,754) ($192,371,783,947) (2,233,955)
Health Services ($424,483,512,605) ($281,894,067,034) ($238,344,049,949) (3,757,637)
Other Services ($377,844,281,305) ($194,847,467,959) ($155,760,290,975) (3,516,368)
TOTAL ($5,842,275,723,447) ($2,672,246,776,912) ($1,657,663,027,711) (27,763,357)
Source: US Multi-Regional Impact Assessment System, The Perryman Group Note: Includes effects of all measured lifetime social costs and lost production associated with non-fatal child maltreatment in a given year (2014). Values are expressed in constant (2014) dollars and are discounted at a 3% real (inflation-adjusted) rate. See notes to component tables.

Suffer the Little Children: An Assessment of the Economic Cost of Child Maltreatment
36 | P a g e w w w . p e r r y m a n g r o u p . c o m C o p y r i g h t 2 0 1 4
Components of the Economic Cost of Fatal Child Maltreatment

Suffer the Little Children: An Assessment of the Economic Cost of Child Maltreatment
37 | P a g e w w w . p e r r y m a n g r o u p . c o m C o p y r i g h t 2 0 1 4
The Estimated Lifetime Impact of Incremental Health Expenditures Associated with Fatal Child Maltreatment
Incidence in 2014 on Business Activity in the US
Sector
Total Expenditures
Real Gross Product
Personal Income
Employment
(2014 Dollars) (2014 Dollars) (2014 Dollars) (Person‐Years)
Agriculture ($3,036,766) ($844,144) ($550,819) (8)
Mining ($2,172,067) ($509,696) ($288,417) (2)
Construction ($3,178,416) ($1,691,848) ($1,394,188) (19)
Nondurable Manufacturing
($30,978,130) ($8,584,595) ($4,408,610) (67)
Durable Manufacturing
($4,970,765) ($1,902,203) ($1,246,995) (16)
Transportation and Utilities
($13,034,504) ($5,033,732) ($2,897,506) (30)
Information ($3,344,502) ($2,055,431) ($887,180) (8)
Wholesale Trade
($5,088,874) ($3,440,908) ($1,984,058) (21)
Retail Trade ($20,690,974) ($15,516,899) ($9,020,229) (263)
Finance, Insurance, and Real Estate
($21,679,917) ($5,674,089) ($2,116,629) (21)
Business Services
($6,236,382) ($3,759,314) ($3,066,636) (36)
Health Services ($45,311,303) ($29,161,807) ($24,656,578) (389)
Other Services ($9,121,778) ($4,711,189) ($3,781,054) (86)
TOTAL ($168,844,377) ($82,885,854) ($56,298,899) (966)
Source: US Multi-Regional Impact Assessment System, The Perryman Group Note: The incremental health care outlays resulting from fatal child maltreatment are funded through uncompensated care, federal programs, higher private insurance premiums and state and local tax revenues. Its provision represents an avoidable diversion of economic resources that has ripple effects throughout the economy. This direct cost is estimated and allocated using the incidence of health outlays across industrial sectors as reflected in the relevant coefficients of the US Multi-Regional Impact Assessment System (net of the direct health expenditures). Values are expressed in constant (2014) dollars and are discounted at a 3% real (inflation-adjusted) rate.

Suffer the Little Children: An Assessment of the Economic Cost of Child Maltreatment
38 | P a g e w w w . p e r r y m a n g r o u p . c o m C o p y r i g h t 2 0 1 4
The Estimated Lifetime Impact of Lost Earnings Associated with Fatal Child Maltreatment Incidence in 2014
on Business Activity in the US
Sector
Total Expenditures
Real Gross Product
Personal Income
Employment
(2014 Dollars) (2014 Dollars) (2014 Dollars) (Person‐Years)
Agriculture ($788,523,296) ($218,492,338) ($142,762,808) (2,148)
Mining ($826,805,946) ($194,296,763) ($101,540,046) (558)
Construction ($874,848,338) ($437,821,213) ($360,791,939) (4,856)
Nondurable Manufacturing
($4,953,220,295) ($1,326,775,226) ($688,344,728) (10,366)
Durable Manufacturing
($1,566,821,583) ($619,614,707) ($404,291,335) (5,230)
Transportation and Utilities
($2,351,184,084) ($932,748,941) ($546,054,852) (5,939)
Information ($708,950,760) ($433,007,830) ($187,054,429) (1,669)
Wholesale Trade
($1,064,946,875) ($720,524,355) ($415,460,800) (4,434)
Retail Trade ($3,139,490,070) ($2,343,043,121) ($1,360,033,185) (40,038)
Finance, Insurance, and Real Estate
($4,572,492,955) ($1,513,443,974) ($570,866,971) (5,454)
Business Services
($1,700,345,353) ($1,094,697,985) ($892,993,054) (10,372)
Health Services ($1,083,067,559) ($740,443,198) ($626,051,599) (9,871)
Other Services ($1,675,619,571) ($863,520,276) ($689,876,721) (15,552)
TOTAL ($25,306,316,685) ($11,438,429,928) ($6,986,122,468) (116,486)
Source: US Multi-Regional Impact Assessment System, The Perryman Group Note: This measure captures the social costs of the losses in lifetime earnings associated with the occurrence of fatal child maltreatment in a given year (2014). Values are expressed in constant (2014) dollars and are discounted at a 3% real (inflation-adjusted) rate. They are fully adjusted for (1) the potential for substitution of other workers in the labor market (2) production losses associated with a reduced supply of labor and (3) the spin-off effects on both suppliers and consumer spending as a result of the reduced productive capacity.

Suffer the Little Children: An Assessment of the Economic Cost of Child Maltreatment
39 | P a g e w w w . p e r r y m a n g r o u p . c o m C o p y r i g h t 2 0 1 4
The Total Estimated Lifetime Impact of All Health Costs and Lost Earnings Associated with Fatal Child Maltreatment
Incidence in 2014 on Business Activity in the US
Sector
Total Expenditures
Real Gross Product
Personal Income
Employment
(2014 Dollars) (2014 Dollars) (2014 Dollars) (Person‐Years)
Agriculture ($791,560,062) ($219,336,482) ($143,313,626) (2,157)
Mining ($828,978,013) ($194,806,459) ($101,828,463) (559)
Construction ($878,026,754) ($439,513,061) ($362,186,127) (4,875)
Nondurable Manufacturing
($4,984,198,425) ($1,335,359,820) ($692,753,337) (10,433)
Durable Manufacturing
($1,571,792,348) ($621,516,910) ($405,538,331) (5,246)
Transportation and Utilities
($2,364,218,587) ($937,782,674) ($548,952,359) (5,970)
Information ($712,295,262) ($435,063,262) ($187,941,609) (1,677)
Wholesale Trade
($1,070,035,750) ($723,965,263) ($417,444,857) (4,455)
Retail Trade ($3,160,181,043) ($2,358,560,019) ($1,369,053,414) (40,301)
Finance, Insurance, and Real Estate
($4,594,172,872) ($1,519,118,063) ($572,983,600) (5,475)
Business Services
($1,706,581,735) ($1,098,457,299) ($896,059,691) (10,407)
Health Services ($1,128,378,862) ($769,605,005) ($650,708,177) (10,259)
Other Services ($1,684,741,350) ($868,231,465) ($693,657,775) (15,639)
TOTAL ($25,475,161,062) ($11,521,315,782) ($7,042,421,367) (117,452)
Source: US Multi-Regional Impact Assessment System, The Perryman Group Note: Includes effects of all measured lifetime health costs and lost production associated with fatal child maltreatment in a given year (2014). Values are expressed in constant (2014) dollars and are discounted at a 3% real (inflation-adjusted) rate. See notes to component tables.

Suffer the Little Children: An Assessment of the Economic Cost of Child Maltreatment
40 | P a g e w w w . p e r r y m a n g r o u p . c o m C o p y r i g h t 2 0 1 4
The Total Economic Cost of Fatal and Non-Fatal Child Maltreatment

Suffer the Little Children: An Assessment of the Economic Cost of Child Maltreatment
41 | P a g e w w w . p e r r y m a n g r o u p . c o m C o p y r i g h t 2 0 1 4
The Total Estimated Lifetime Impact of All Social Costs and Lost Earnings Associated with Non-Fatal and Fatal Child
Maltreatment Incidence in 2014 on Business Activity in the US
Sector
Total Expenditures
Real Gross Product
Personal Income
Employment
(2014 Dollars) (2014 Dollars) (2014 Dollars) (Person‐Years)
Agriculture ($174,294,087,147) ($48,313,071,161) ($31,502,318,404) (473,581)
Mining ($175,156,930,140) ($41,166,423,247) ($21,632,419,654) (118,695)
Construction ($190,844,791,300) ($95,980,002,679) ($79,093,496,096) (1,064,229)
Nondurable Manufacturing
($1,138,653,550,696) ($306,290,326,318) ($158,713,098,017) (2,392,528)
Durable Manufacturing
($338,135,262,976) ($133,528,956,914) ($87,155,927,115) (1,126,850)
Transportation and Utilities
($533,741,265,271) ($210,863,414,574) ($123,200,895,461) (1,334,611)
Information ($157,620,774,881) ($96,330,394,418) ($41,611,843,663) (370,961)
Wholesale Trade
($237,381,652,925) ($160,598,308,044) ($92,602,421,452) (987,890)
Retail Trade ($726,815,153,175) ($542,817,506,312) ($315,150,483,271) (9,266,644)
Finance, Insurance, and Real Estate
($1,020,178,504,460) ($332,578,072,512) ($125,325,995,430) (1,200,555)
Business Services
($369,787,997,416) ($236,922,245,053) ($193,267,843,638) (2,244,362)
Health Services ($425,611,891,467) ($282,663,672,039) ($238,994,758,126) (3,767,896)
Other Services ($379,529,022,655) ($195,715,699,424) ($156,453,948,751) (3,532,007)
TOTAL ($5,867,750,884,509) ($2,683,768,092,694) ($1,664,705,449,078) (27,880,809)
Source: US Multi-Regional Impact Assessment System, The Perryman Group Note: Includes effects of all measured lifetime social costs and lost production associated with non-fatal and fatal child maltreatment in a given year (2014). Values are expressed in constant (2014) dollars and are discounted at a 3% real (inflation-adjusted) rate. See notes to component tables.

Suffer the Little Children: An Assessment of the Economic Cost of Child Maltreatment
42 | P a g e w w w . p e r r y m a n g r o u p . c o m C o p y r i g h t 2 0 1 4
The Economic Cost of Child Maltreatment: Results by State

Suffer the Little Children: An Assessment of the Economic Cost of Child Maltreatment
43 | P a g e w w w . p e r r y m a n g r o u p . c o m C o p y r i g h t 2 0 1 4

Suffer the Little Children: An Assessment of the Economic Cost of Child Maltreatment
44 | P a g e w w w . p e r r y m a n g r o u p . c o m C o p y r i g h t 2 0 1 4
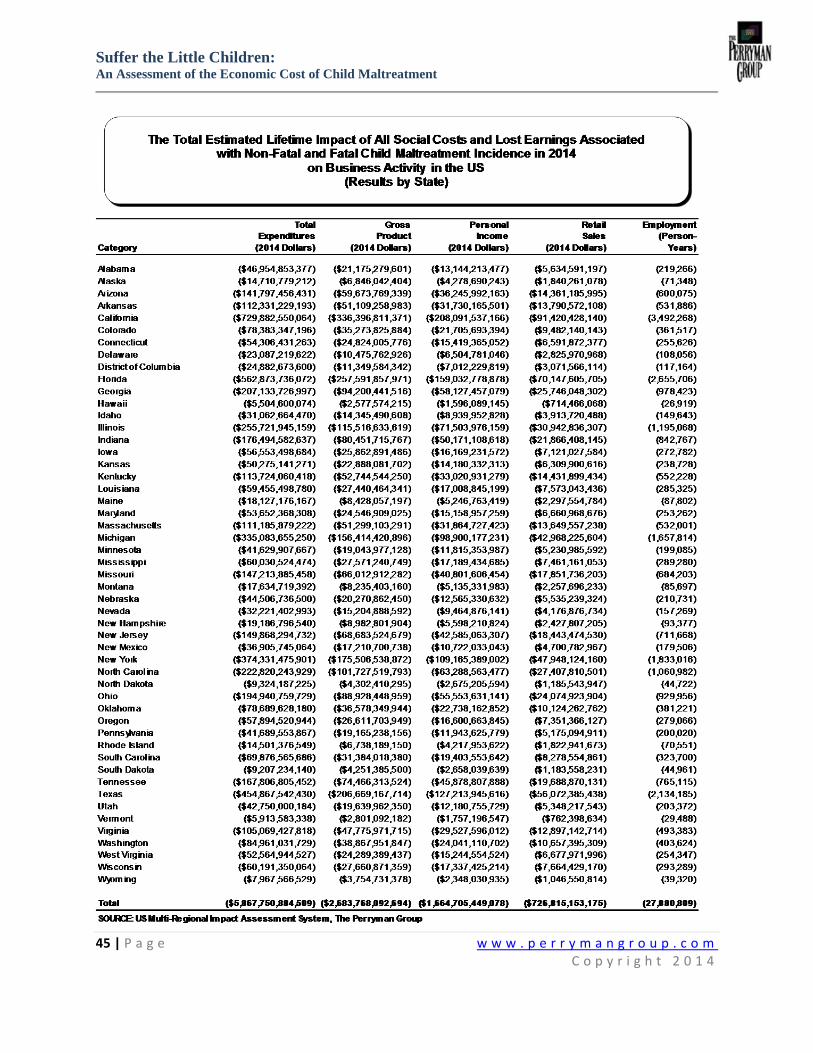
Suffer the Little Children: An Assessment of the Economic Cost of Child Maltreatment
45 | P a g e w w w . p e r r y m a n g r o u p . c o m C o p y r i g h t 2 0 1 4