successmaker. where are they? math: intranet on a server at vanhoose reading web-based
TRANSCRIPT
SuccessMaker

Where are they?
Math: IntranetOn a server at Vanhoose
ReadingWeb-based
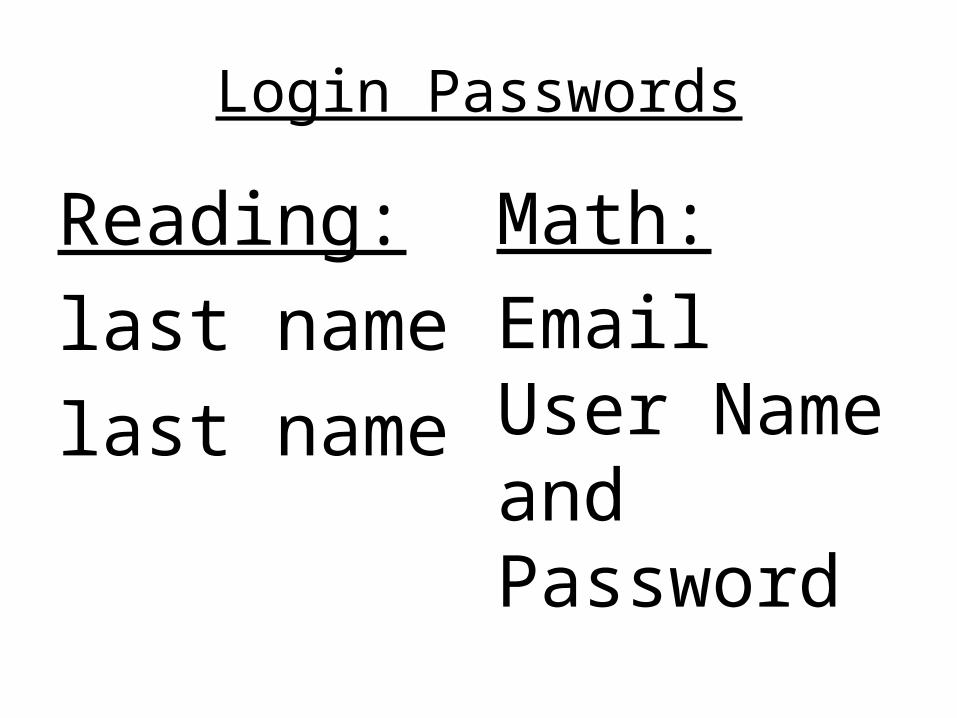
Login Passwords
Reading:last namelast name
Math:Email User Name and Password
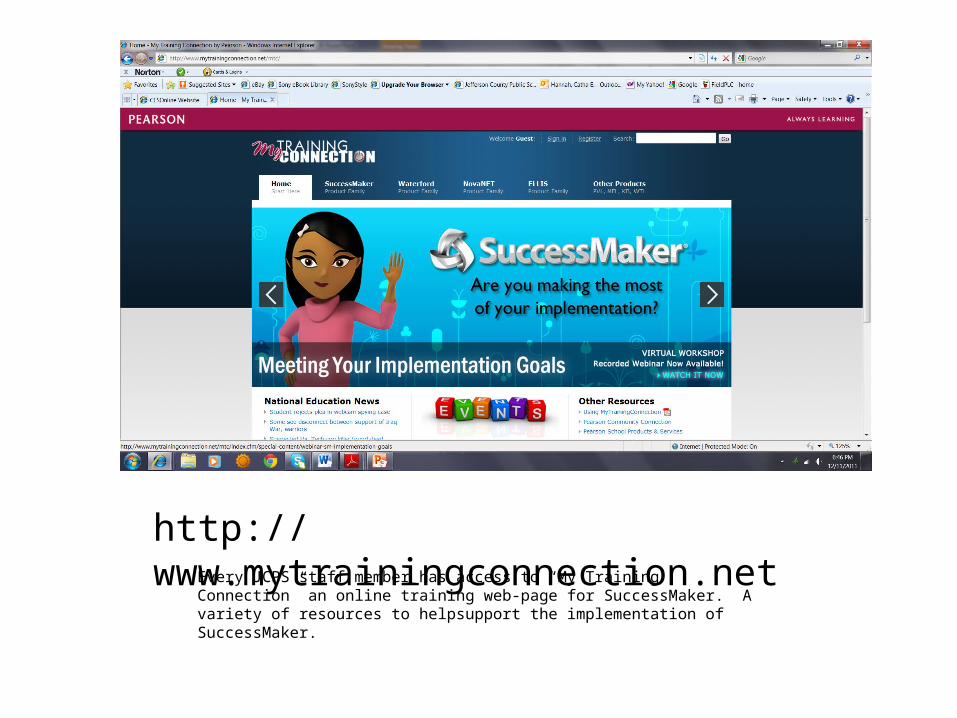
Every JCPS staff member has access to “My Training Connection” an online training web-page for SuccessMaker. A variety of resources to helpsupport the implementation of SuccessMaker.
http://www.mytrainingconnection.net

Choose Register and Enter the Number:1017003
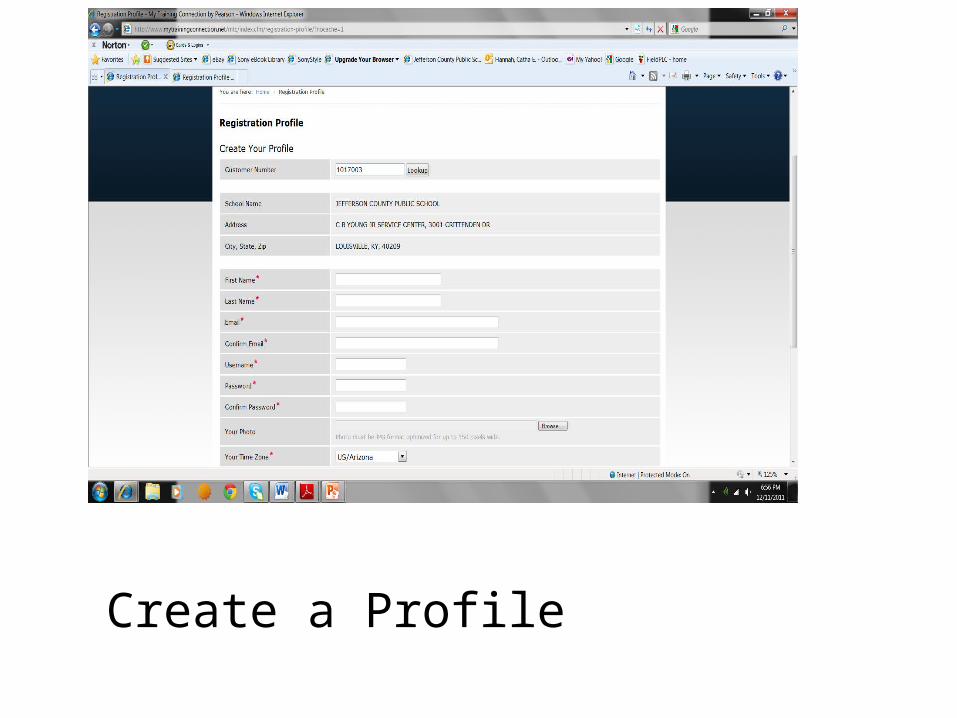
Create a Profile

Blue Logo Reading


Login Screen
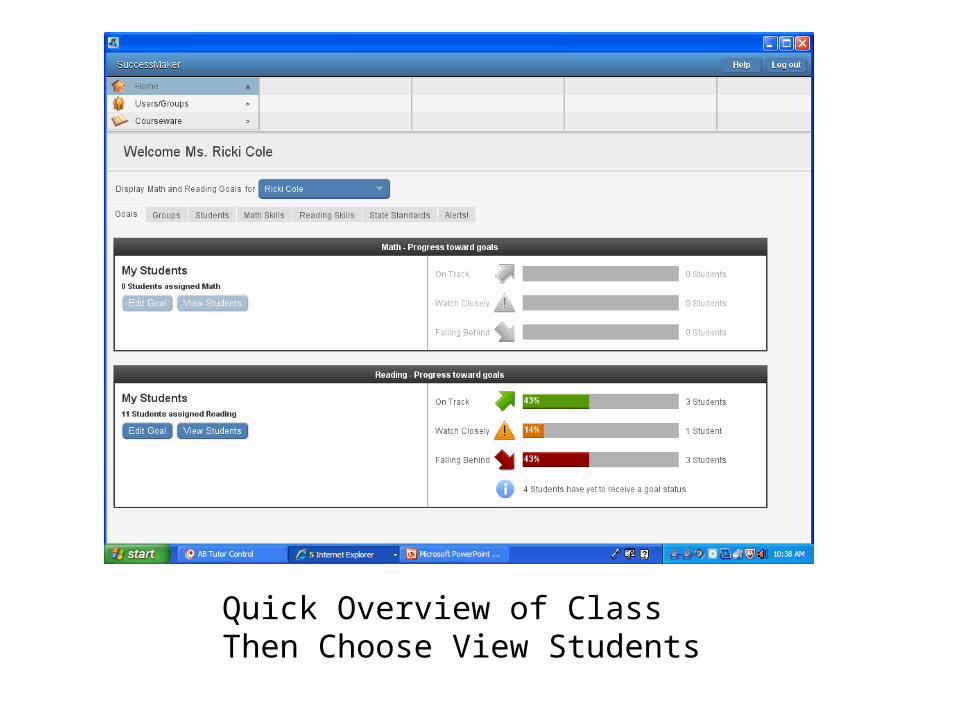
Quick Overview of ClassThen Choose View Students
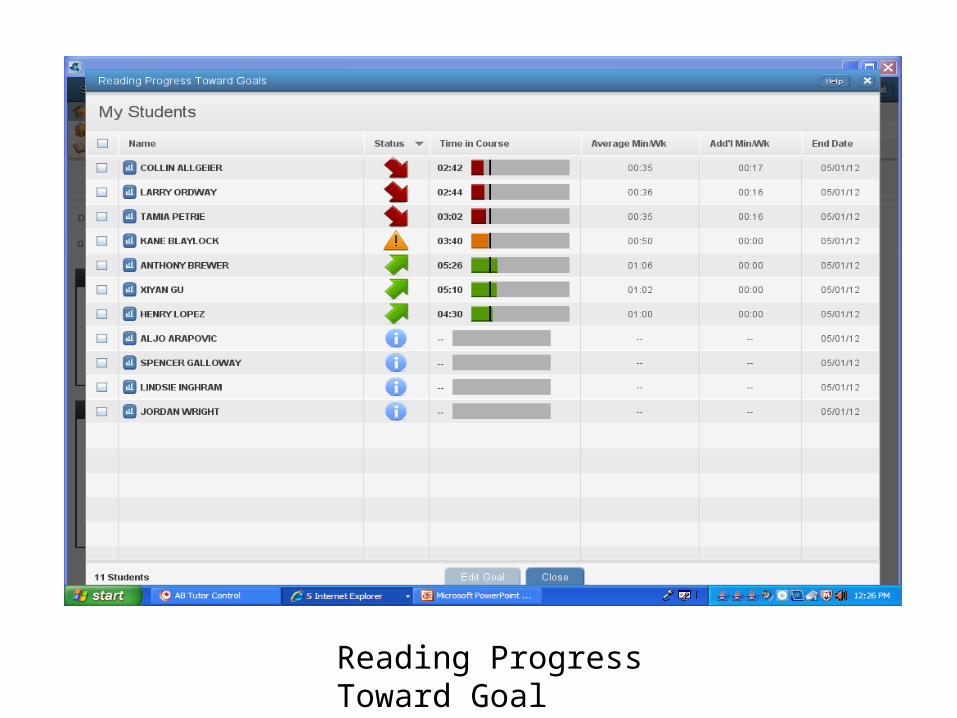
Reading Progress Toward Goal

UsersGroups-Students-ViewBrowse


Choose A Student Last Session


Choose Save


Skills

After you save and open you will get a two page detailed report on skills.

Choose a Standard

Standards Based Reports

Choose a Grade-Save


15 Page Report

To save a student performance graph as a PDF document:1. Log in to SuccessMaker as a teacher user.2. From the teacher dashboard, click the Students tab.3. Under the Current Average column, click the progress bar for the student and assignment thatyou want to see. The Student Performance Details page will appear. The first tab contains thestudent’s individual performance graphs for the assignment you chose.4. To save the student performance graphs as a PDF document, select Save As PDF from thedrop-down menu and click the Save button. You can now select the document location and namethe document accordingly. A recommended naming convention is to include the student’s name,the date, and the type of graph in the file name. For example: JohnDoe_
To view the student performance graphs:1. Log in to SuccessMaker as a teacher user. From the teacher dashboard, click the Students tab.2. Under the Current Average column, click the progress bar for the student and assignment thatyou want to see. The Student Performance Details page will appear. The first tab contains thestudent’s individual performance graphs for the assignment you chose.3. You will see three graphs: a Progress Monitoring Graph, a Percent Correct vs. Gain graph, and aPercent Correct vs. Last Session graph. You may have to scroll down to see all three graphs.4. You can save the graphs in PDF or Excel format using the buttons at the bottom of the screen.Once you save the graphs to your computer, you can print the document.
Creating a Course by Concept1. In the teacher dashboard, click Courseware, and then click Reading. The standardcourse will be listed with a lock to the left.2. Click the Save As button under the options for the standard reading course.3. Click the Customize by Concept button in the Customize Course window.4. In the Edit Course by Concept window, select the grade.5. Choose a strand, and then navigate and select any level within the hierarchy toassign specific concept objectives.6. Select or clear the check boxes to include entire strands or specific content such asconcepts, topics, or learning objects.7. Once you have selected the content for the course, you can edit the settings of thecourse. To do this, click Edit Settings.8. Change the settings as appropriate for your course, and then click Done.9. Click Save As and rename the course. Click OK. Once saved, the custom course isdisplayed in the list of courses.

Running a Report from the Teacher Dashboard1. From the teacher dashboard, click the Groups tab.2. Under Group/Assignment, select the check box for a group.3. From the Display drop]down menu, select the assignments you want to display in thereport. You can run a report for any assignment option, except All Assignments.4. From the Reports drop]down menu in the bottom left of the screen, select a report.Then click GO.5. Define your report preferences in the Report Options screen, and then click Run Report.6. Once generated, you can print or save the report. The PDF format is the default formatoption when you save a report. You can save the report in other formats listed on

To access the Goals tab:1. Log in to SuccessMaker as a teacher user.2. From the teacher dashboard, click the Goals tab. The page will appear on the screen.3. From this page you can view the percentage of students who are on track to reach the classgoals in Math and Reading and the percentage of students who are falling behind. You can alsoedit goals and view students’ individual progress.