successful nontraditional developmental education programs: too costly, or really profitable? rob...
TRANSCRIPT

Successful Nontraditional Successful Nontraditional Developmental Education Programs:Developmental Education Programs:
Too Costly, or Really Profitable?Too Costly, or Really Profitable?
Rob JohnstoneRob Johnstone
March 2, 2008March 2, 2008
League Innovations 2008 - Cost Revenue ModelLeague Innovations 2008 - Cost Revenue Model
League Innovations 2008 - Cost Revenue ModelLeague Innovations 2008 - Cost Revenue Model
Basic Skills as a Foundation for Student Success in California Community Colleges
http://www.cccbsi.org
PART 1: PART 1: THE BACKDROPTHE BACKDROP
League Innovations 2008 - Cost Revenue ModelLeague Innovations 2008 - Cost Revenue Model
League Innovations 2008 - Cost Revenue ModelLeague Innovations 2008 - Cost Revenue Model
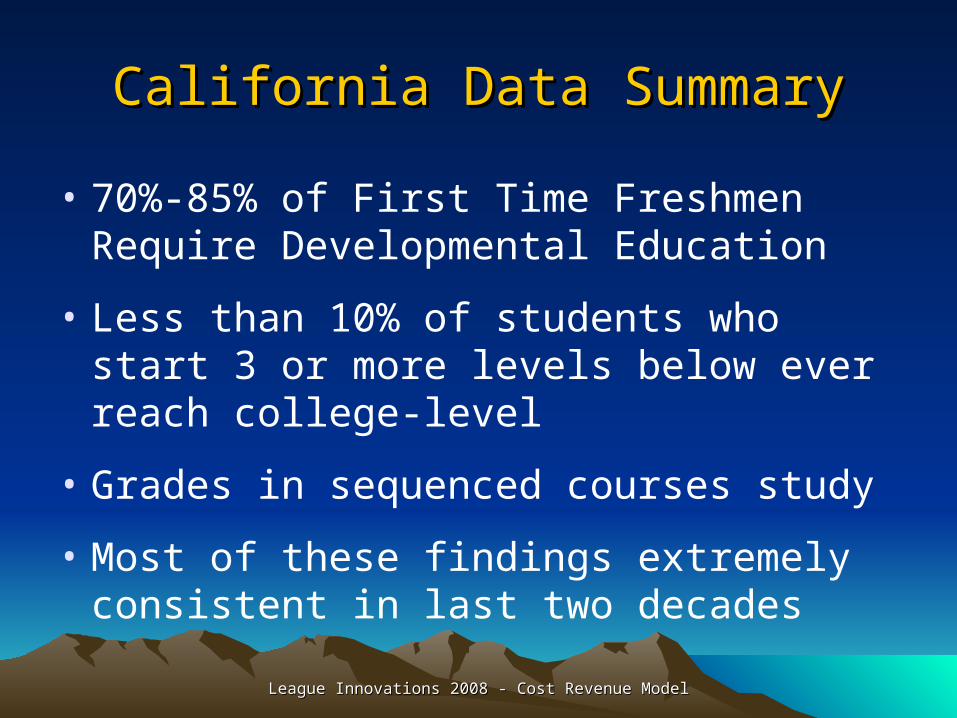
California Data SummaryCalifornia Data Summary
• 70%-85% of First Time Freshmen Require Developmental Education
• Less than 10% of students who start 3 or more levels below ever reach college-level
• Grades in sequenced courses study
• Most of these findings extremely consistent in last two decades

League Innovations 2008 - Cost Revenue ModelLeague Innovations 2008 - Cost Revenue Model
Project HistoryProject History• Statewide Graduation Requirements
– Math: Beginning Intermediate Algebra– Language Arts: One Level Below Freshman English
Freshman English
• Controversy on additional barriers, vocational education
• Statewide Academic Senate, CIO, CSSO organizations formulate approach– System Office redirects $33M to colleges, funds
research grant, two Prof Dev grants

League Innovations 2008 - Cost Revenue ModelLeague Innovations 2008 - Cost Revenue Model
October 2006 - Phase 1 Begins October 2006 - Phase 1 Begins Research & Lit. ReviewResearch & Lit. Review
• Research phase initiated
• $50,000 in research funds allocated through Mt. San Antonio College
• Research conducted by the Center for Student Success (RP Group)
League Innovations 2008 - Cost Revenue ModelLeague Innovations 2008 - Cost Revenue Model
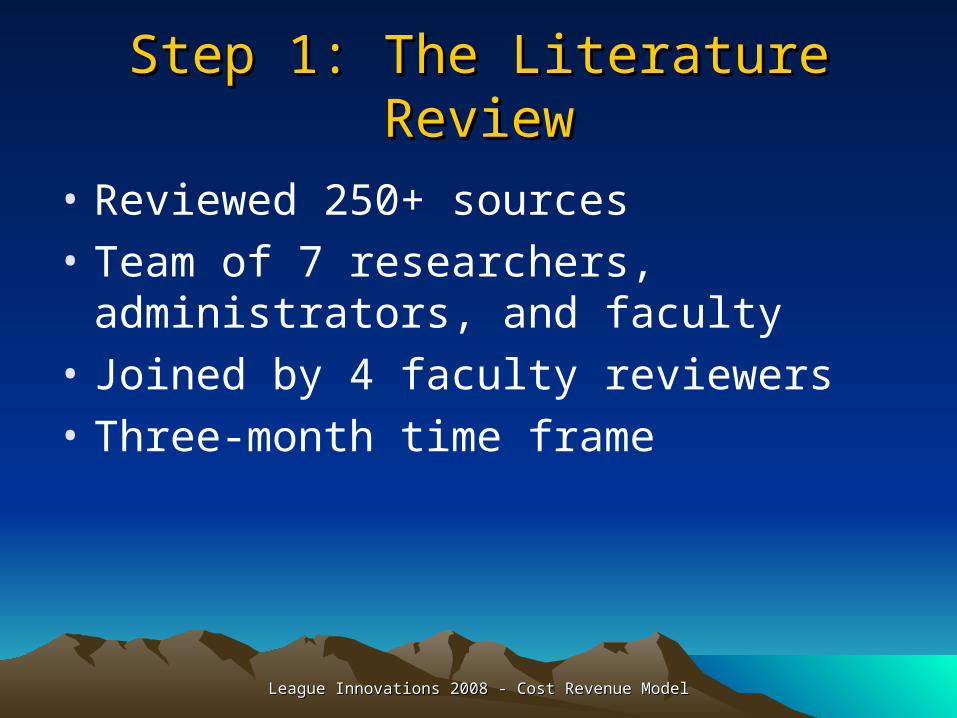
Step 1: The Literature ReviewStep 1: The Literature Review
• Reviewed 250+ sources
• Team of 7 researchers, administrators, and faculty
• Joined by 4 faculty reviewers
• Three-month time frame
League Innovations 2008 - Cost Revenue ModelLeague Innovations 2008 - Cost Revenue Model
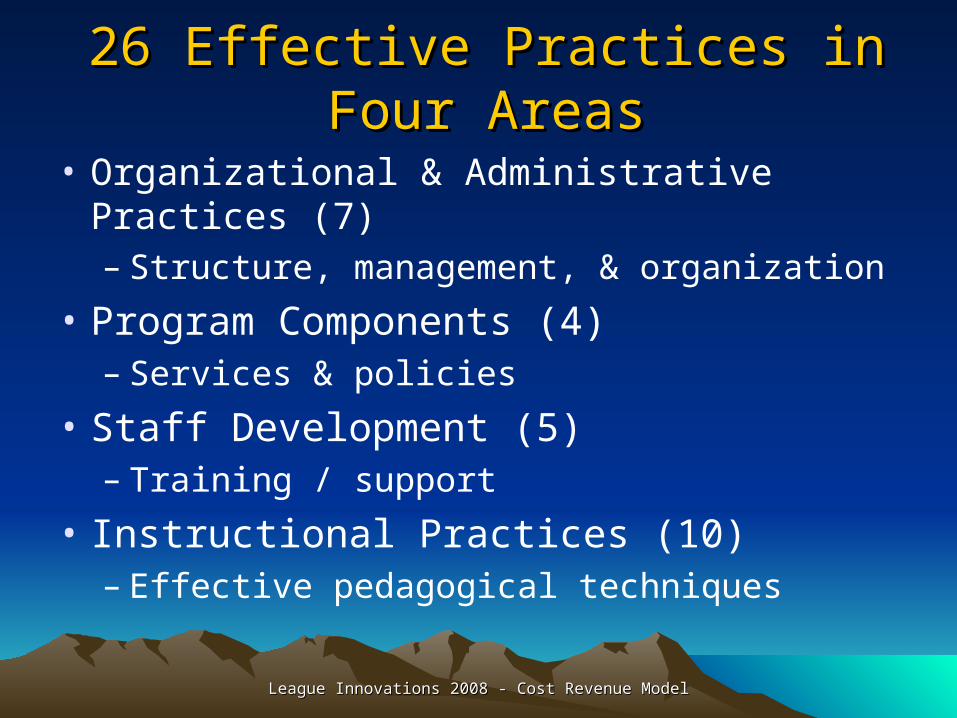
26 Effective Practices in Four Areas26 Effective Practices in Four Areas
• Organizational & Administrative Practices (7)– Structure, management, & organization
• Program Components (4)– Services & policies
• Staff Development (5)– Training / support
• Instructional Practices (10)– Effective pedagogical techniques
PART 2: PART 2: DOING THINGS DIFFERENTLYDOING THINGS DIFFERENTLY
League Innovations 2008 - Cost Revenue ModelLeague Innovations 2008 - Cost Revenue Model
League Innovations 2008 - Cost Revenue ModelLeague Innovations 2008 - Cost Revenue Model
““The State of Developmental The State of Developmental Education in California”Education in California”
• What is the most common educational paradigm we deliver to our developmental education students?– One instructor – One classroom – Limited suite of support services

League Innovations 2008 - Cost Revenue ModelLeague Innovations 2008 - Cost Revenue Model
Hmm…Hmm…
• What has the research suggested to be the least effective paradigm for producing student success in developmental education?– See previous slide

League Innovations 2008 - Cost Revenue ModelLeague Innovations 2008 - Cost Revenue Model
Non-Traditional ApproachesNon-Traditional Approaches
• Programs exist on every campus• Most include a number of the “Effective
Practices” identified in the Literature Review
• IR data has demonstrated many as effective
• Tend to be small in scope, serving relatively small numbers of students
• Why?
League Innovations 2008 - Cost Revenue ModelLeague Innovations 2008 - Cost Revenue Model
Why are Non-Traditional Why are Non-Traditional Programs Isolated and Small?Programs Isolated and Small?
• Limited awareness about the literature & its findings
• Need for paradigm shifts in thinking of campus administrators, faculty & staff
• Organizational change issues• Lack of IR to provide hard data on
program effectiveness• “Pilot” mentality – often w/o institutional
commitment
League Innovations 2008 - Cost Revenue ModelLeague Innovations 2008 - Cost Revenue Model
Single Biggest Reason?Single Biggest Reason?
• Perceived Cost of scaling these programs to many / most / all students
League Innovations 2008 - Cost Revenue ModelLeague Innovations 2008 - Cost Revenue Model
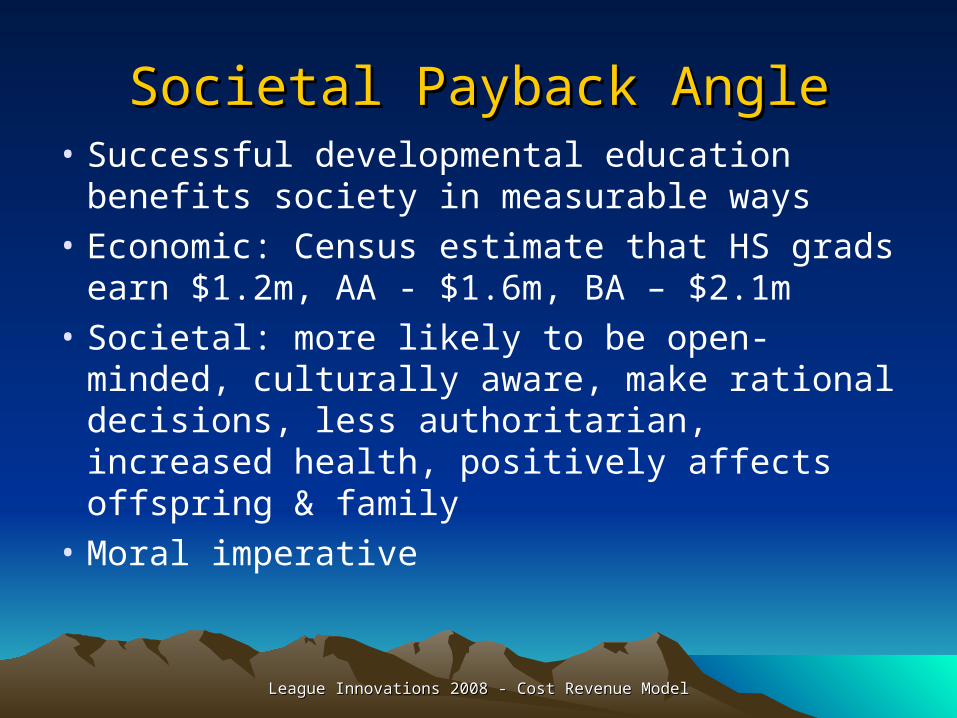
Societal Payback AngleSocietal Payback Angle• Successful developmental education
benefits society in measurable ways• Economic: Census estimate that HS grads
earn $1.2m, AA - $1.6m, BA – $2.1m• Societal: more likely to be open-minded,
culturally aware, make rational decisions, less authoritarian, increased health, positively affects offspring & family
• Moral imperative

League Innovations 2008 - Cost Revenue ModelLeague Innovations 2008 - Cost Revenue Model
Workplace NeedsWorkplace Needs
• “Primary currency for employment became advanced education” (McCabe, 2000)
• Evolving workplace: 80% of jobs in 21st century will need advanced skills
• Manufacturing Association survey: 60% of employees lacked basic math skills & 55% basic written language / comprehension skills
League Innovations 2008 - Cost Revenue ModelLeague Innovations 2008 - Cost Revenue Model
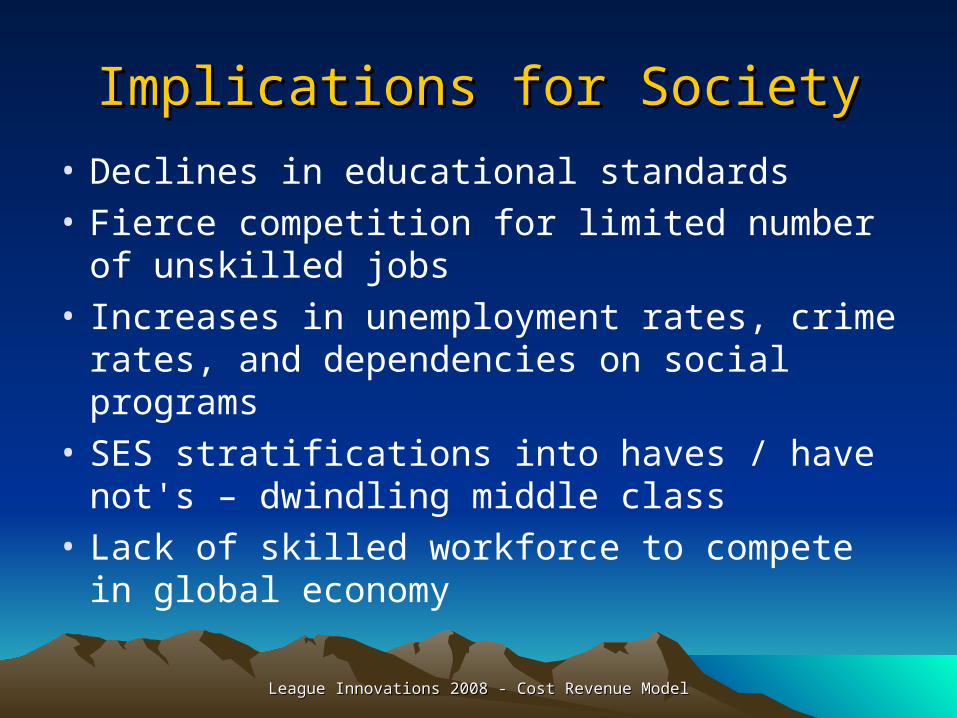
Implications for SocietyImplications for Society
• Declines in educational standards
• Fierce competition for limited number of unskilled jobs
• Increases in unemployment rates, crime rates, and dependencies on social programs
• SES stratifications into haves / have not's – dwindling middle class
• Lack of skilled workforce to compete in global economy
League Innovations 2008 - Cost Revenue ModelLeague Innovations 2008 - Cost Revenue Model
But…But…
• Community Colleges have to pay their own bills. Thus, we are left with a situation where:– society demands that we succeed in our
mission of developmental education, – but our funding system seems to suggest that
we at the CCs can’t afford to do so

PART 3: PART 3: THE LOGIC BEHIND THE THE LOGIC BEHIND THE
APPROACHAPPROACH
League Innovations 2008 - Cost Revenue ModelLeague Innovations 2008 - Cost Revenue Model
League Innovations 2008 - Cost Revenue ModelLeague Innovations 2008 - Cost Revenue Model
Traditional CC Economic RealityTraditional CC Economic Reality
• Community Colleges are set up to think in terms of fiscal periods (usually fiscal years)
• Simplistically, this year’s salaries, fixed costs, & variable costs seemingly need to be offset by this year’s revenues from FTES apportionment

League Innovations 2008 - Cost Revenue ModelLeague Innovations 2008 - Cost Revenue Model
A Different (?) Way of ThinkingA Different (?) Way of Thinking
• As has become common in industry, we could think about deviating from our “traditional” model toward a return-on-investment (ROI) approach
• Under this approach, we use our “traditional” model as the baseline for costs and revenue

League Innovations 2008 - Cost Revenue ModelLeague Innovations 2008 - Cost Revenue Model
Incremental CostsIncremental Costs
• We first account for the additional costs associated with the aforementioned more successful alternative programs. Examples:– Incremental salaried faculty/staff
(% FTE w / benefits)– Hourly personnel costs (tutors, etc)– Stipends– Equip / Supplies / Facilities
• Note: We are quite good at assigning incremental costs to non-traditional programs!
League Innovations 2008 - Cost Revenue ModelLeague Innovations 2008 - Cost Revenue Model
The Flip Side – Incremental RevenueThe Flip Side – Incremental Revenue
• Successful alternate programs have the following outcomes:– Increased course retention – Increased course success rates– Increased persistence– Increased progression to college-level work– Increase in overall units attempted / earned

League Innovations 2008 - Cost Revenue ModelLeague Innovations 2008 - Cost Revenue Model
What is the coin of the realm?What is the coin of the realm?
• FTES
• In California, colleges generate $4,361 per FTES in apportionment– Note: Model applies in states where state
apportionment is combined with tuition, etc.
• The incremental FTES generated in successful alternative programs can, in many cases, offset the incremental costs
League Innovations 2008 - Cost Revenue ModelLeague Innovations 2008 - Cost Revenue Model
Caveat before we move on…Caveat before we move on…
• This approach runs into an issue if a system caps college enrollments and the college is at or near its enrollment cap
• Bumping up against the cap number as a result of newly successful basic skills students would be a good problem to have
• Bigger problem a couple of years ago – now maybe a solution to systemic sluggishness

League Innovations 2008 - Cost Revenue ModelLeague Innovations 2008 - Cost Revenue Model
More on the Cap IssueMore on the Cap Issue
• Further, not sure why we would identify these successful developmental programs as the “reason” a college exceeded a cap number– Myriad of segments that make up a college’s
enrollment
• Ironically, the Caps are based on historical failures in developmental education– If legislatures want improvement, they should
fund over-cap FTES from successes
League Innovations 2008 - Cost Revenue ModelLeague Innovations 2008 - Cost Revenue Model
Incremental FTES $$$ Not Without Incremental FTES $$$ Not Without CostsCosts
• Instructional costs for students who are retained and progress – may require adding additional sections– May fill non-full classrooms especially in
productive GE courses
• Overhead / infrastructure costs– Estimating is very complex
• Taken together, we estimate a range of 40%-75% “profit” from FTES

League Innovations 2008 - Cost Revenue ModelLeague Innovations 2008 - Cost Revenue Model
What the Model Doesn’t DoWhat the Model Doesn’t Do
• This is not a sophisticated economic model
• It doesn’t take into account economics concepts such as net present value (NPV), economic rates of return (IRR), discounting, etc.
• Ultimately, it is designed to be an order of magnitude demonstration

League Innovations 2008 - Cost Revenue ModelLeague Innovations 2008 - Cost Revenue Model
A Final Note Before Getting into It...A Final Note Before Getting into It...
• In no way are we claiming that the current level of funding (CA: $4,361/FTES) for the “standard” suite of services is adequate– $11,000 for CSU, $25,000 for UC
• Spevak & Simpson et al (2003) – Real Cost Project – estimated “real cost” of providing instruction and services is over $9,000 per FTES

PART 4: PART 4: A LIVE DEMONSTRATION OFA LIVE DEMONSTRATION OF
THE EXCEL MODELTHE EXCEL MODEL
(SEE APPENDIX A FOR STATIC EXPLANATION OF (SEE APPENDIX A FOR STATIC EXPLANATION OF THE EXCEL MODEL)THE EXCEL MODEL)
League Innovations 2008 - Cost Revenue ModelLeague Innovations 2008 - Cost Revenue Model
PART 5: PART 5: THE AFTERMATHTHE AFTERMATH
League Innovations 2008 - Cost Revenue ModelLeague Innovations 2008 - Cost Revenue Model
League Innovations 2008 - Cost Revenue ModelLeague Innovations 2008 - Cost Revenue Model
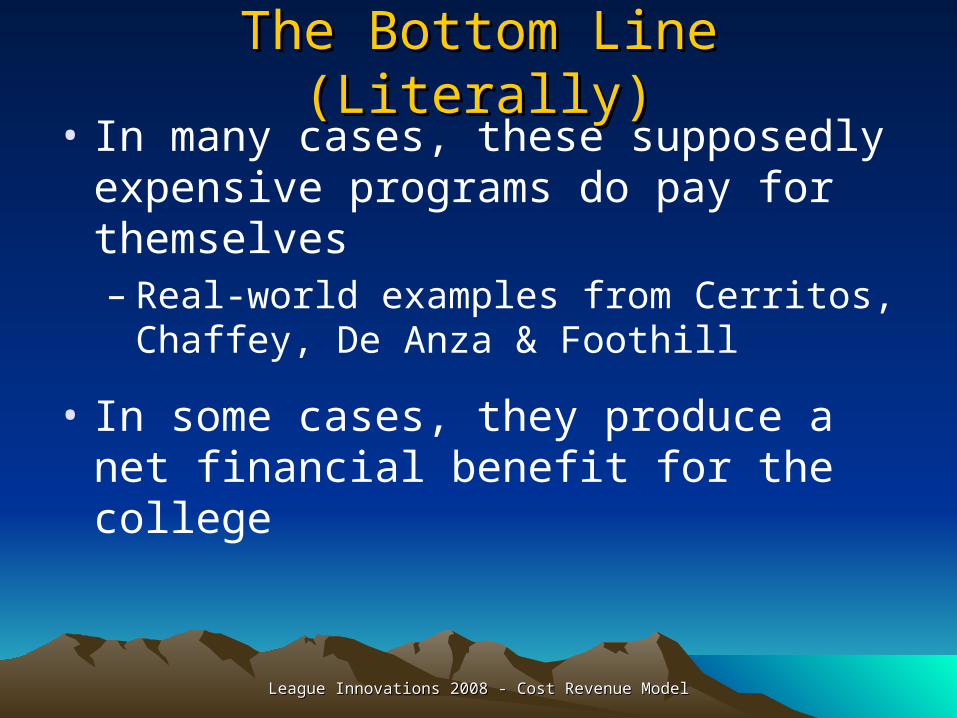
The Bottom Line (Literally)The Bottom Line (Literally)• In many cases, these supposedly
expensive programs do pay for themselves– Real-world examples from Cerritos, Chaffey,
De Anza & Foothill
• In some cases, they produce a net financial benefit for the college
League Innovations 2008 - Cost Revenue ModelLeague Innovations 2008 - Cost Revenue Model
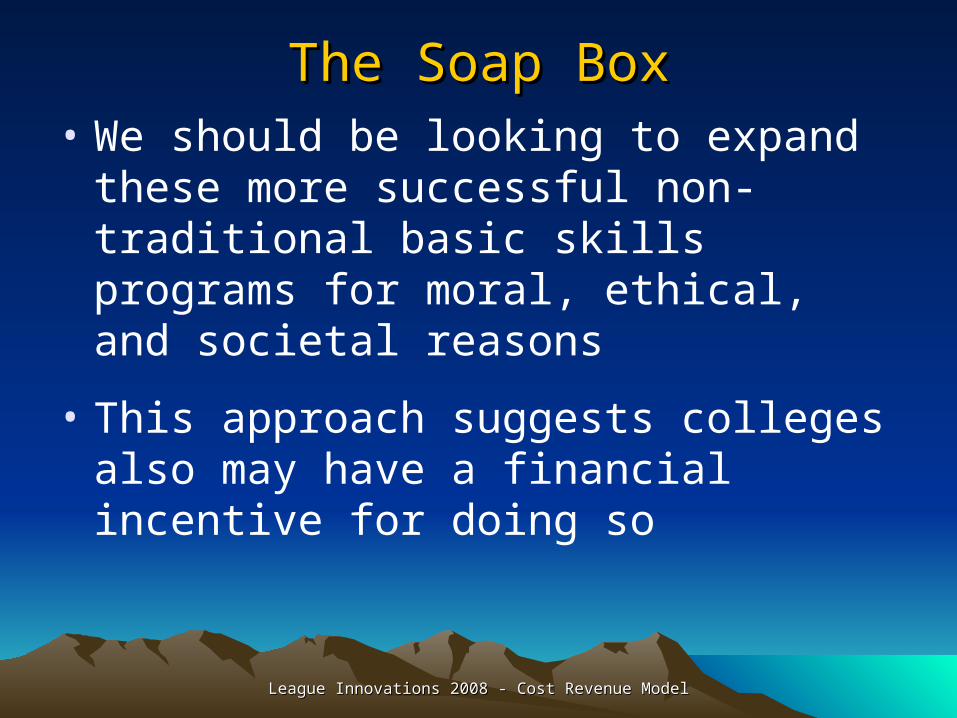
The Soap BoxThe Soap Box• We should be looking to expand these
more successful non-traditional basic skills programs for moral, ethical, and societal reasons
• This approach suggests colleges also may have a financial incentive for doing so

League Innovations 2008 - Cost Revenue ModelLeague Innovations 2008 - Cost Revenue Model
Growing PainsGrowing Pains
• As programs are expanded past their current small reach, they will likely experience some decrease in incremental success
• Flip side is that costs do not scale up proportionally – and this usually is a good thing as economies of scale emerge
• May balance each other out?
League Innovations 2008 - Cost Revenue ModelLeague Innovations 2008 - Cost Revenue Model
More ThoughtsMore Thoughts
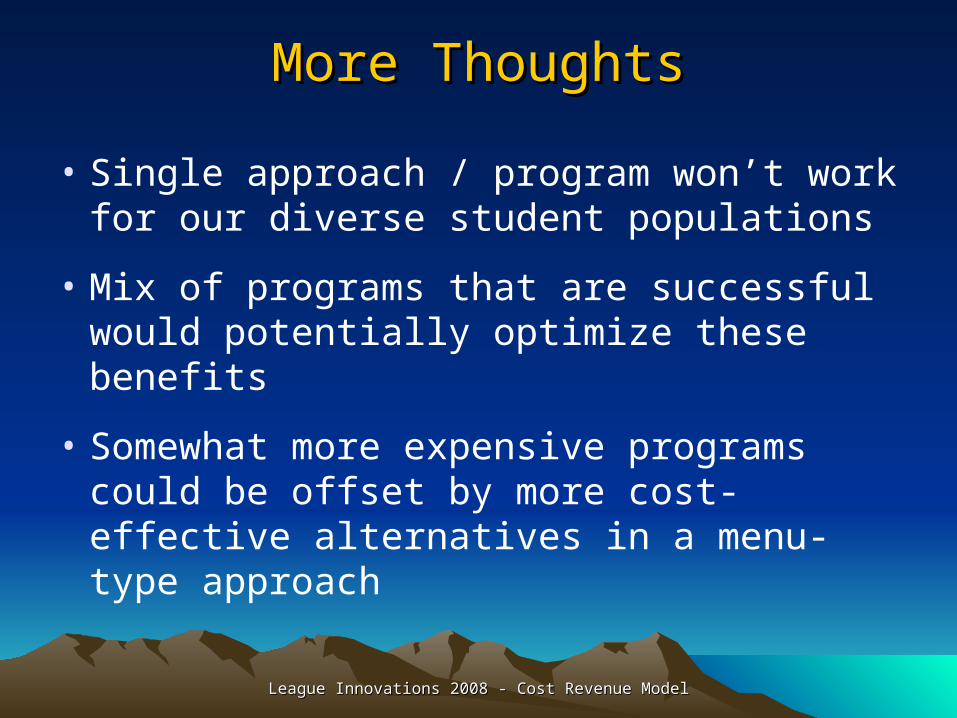
• Single approach / program won’t work for our diverse student populations
• Mix of programs that are successful would potentially optimize these benefits
• Somewhat more expensive programs could be offset by more cost-effective alternatives in a menu-type approach

League Innovations 2008 - Cost Revenue ModelLeague Innovations 2008 - Cost Revenue Model
Questions? Comments?Questions? Comments?
• Excel model is available on the two websites:– http://css.rpgroup.org – http://www.cccbsi.org/
• Feel free to contact me at 650-949-7209 or [email protected] for further discussion
APPENDIX A: APPENDIX A: THE EXCEL MODELTHE EXCEL MODEL
STATIC VERSIONSTATIC VERSION
League Innovations 2008 - Cost Revenue ModelLeague Innovations 2008 - Cost Revenue Model

League Innovations 2008 - Cost Revenue ModelLeague Innovations 2008 - Cost Revenue Model
Overview of ModelOverview of Model
• Six Sections to Model– Sec. 1: Students Served in Program– Sec. 2: Incremental Salaried Personnel Costs– Sec. 3: Incremental Hourly Personnel Costs– Sec. 4: Incremental Fixed Costs– Sec. 5: Summary of Incremental Costs– Sec. 6: Incremental FTES from Program
• Each section allows entry of real data and calculates key figures automatically

League Innovations 2008 - Cost Revenue ModelLeague Innovations 2008 - Cost Revenue Model
Section 1: Students ServedSection 1: Students Served
• Starting off easy
• Enter how many students are served in the program annually
• This is critical because it helps us determine the total contact hours generated per student, which we’ll need later

Section 1: Screen ShotSection 1: Screen Shot
League Innovations 2008 - Cost Revenue ModelLeague Innovations 2008 - Cost Revenue Model
75
Model 3: Counseling and Time on Task at De Anza College's MPS Program
Section 1: Students Served in Program
League Innovations 2008 - Cost Revenue ModelLeague Innovations 2008 - Cost Revenue Model
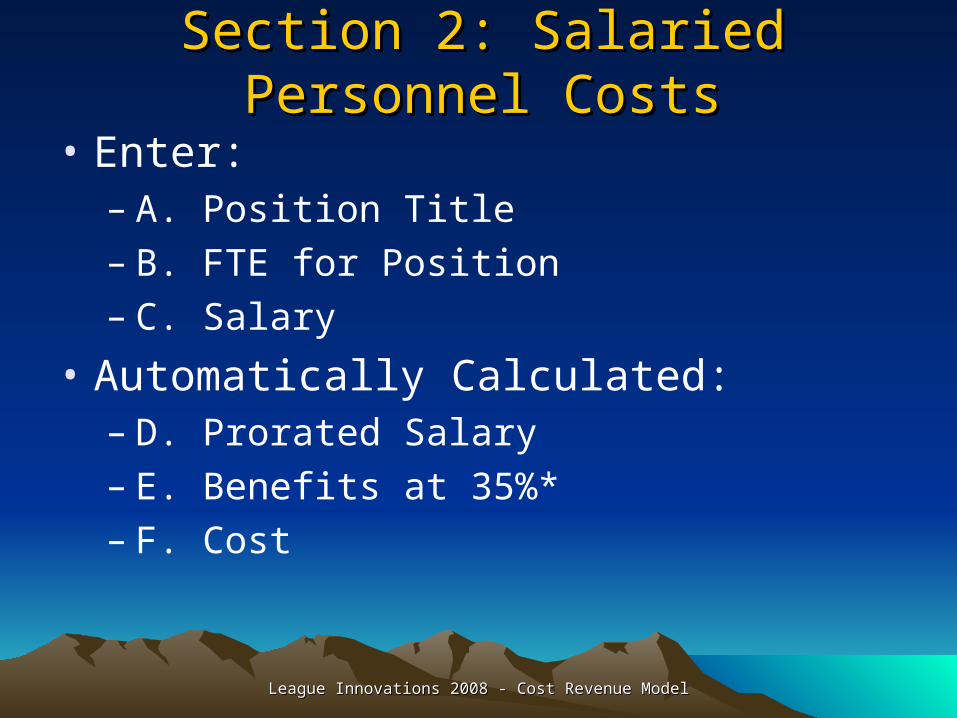
Section 2: Salaried Personnel CostsSection 2: Salaried Personnel Costs
• Enter:– A. Position Title– B. FTE for Position– C. Salary
• Automatically Calculated:– D. Prorated Salary– E. Benefits at 35%*– F. Cost
Section 2: Screen ShotSection 2: Screen Shot
League Innovations 2008 - Cost Revenue ModelLeague Innovations 2008 - Cost Revenue Model
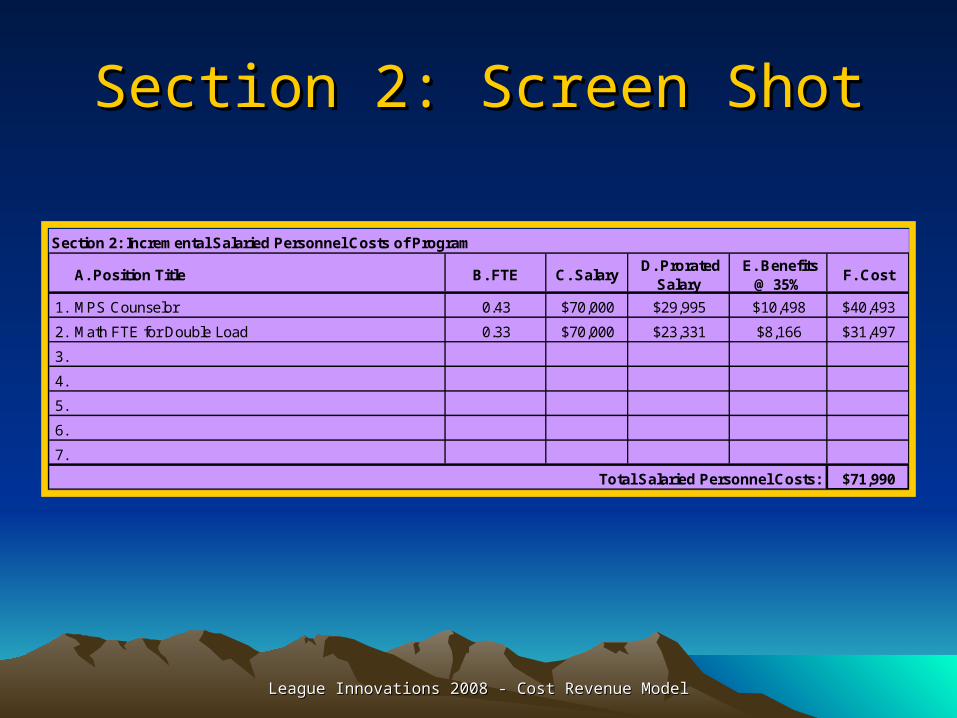
Section 2: Incremental Salaried Personnel Costs of Program
A. Position Title B. FTE C. Salary D. Prorated
Salary E. Benefits
@ 35%F. Cost
1. MPS Counselor 0.43 $70,000 $29,995 $10,498 $40,493
2. Math FTE for Double Load 0.33 $70,000 $23,331 $8,166 $31,497
3.
4.
5.
6.
7.
Total Salaried Personnel Costs: $71,990
League Innovations 2008 - Cost Revenue ModelLeague Innovations 2008 - Cost Revenue Model
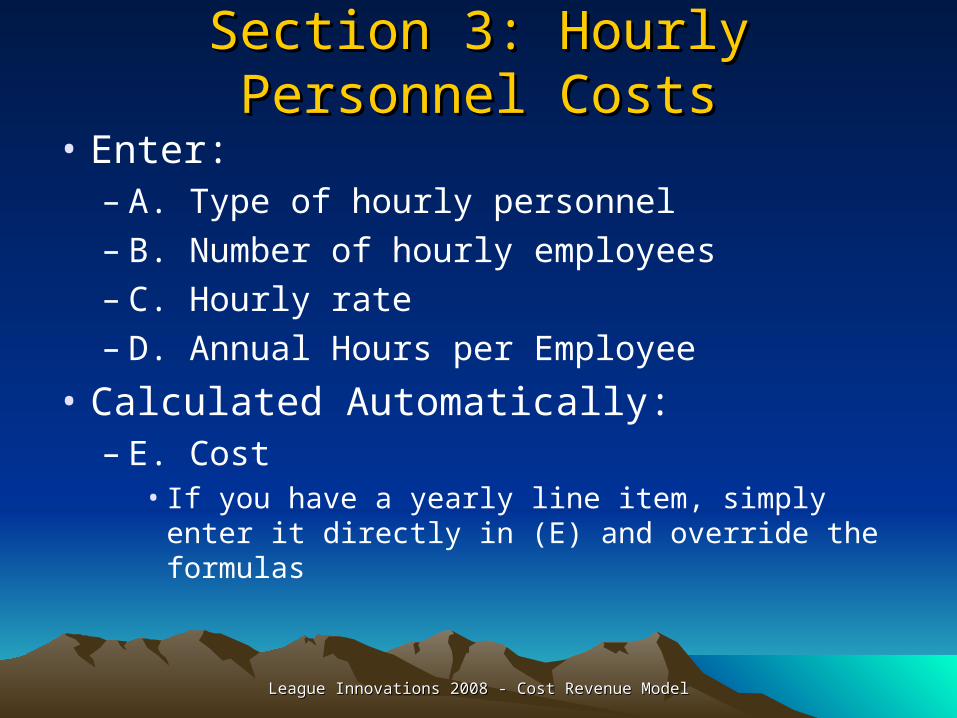
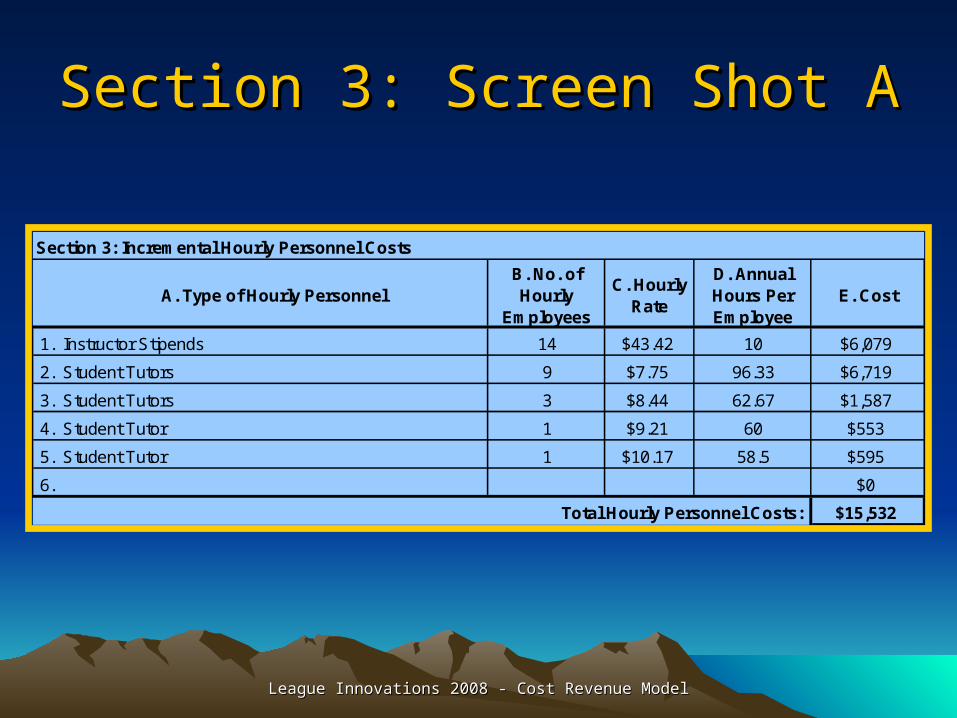
Section 3: Hourly Personnel CostsSection 3: Hourly Personnel Costs
• Enter:– A. Type of hourly personnel– B. Number of hourly employees– C. Hourly rate– D. Annual Hours per Employee
• Calculated Automatically:– E. Cost
• If you have a yearly line item, simply enter it directly in (E) and override the formulas
Section 3: Screen Shot ASection 3: Screen Shot A
League Innovations 2008 - Cost Revenue ModelLeague Innovations 2008 - Cost Revenue Model
Section 3: Incremental Hourly Personnel Costs
A. Type of Hourly PersonnelB. No. of Hourly
Employees
C. Hourly Rate
D. Annual Hours Per Employee
E. Cost
1. Instructor Stipends 14 $43.42 10 $6,079
2. Student Tutors 9 $7.75 96.33 $6,719
3. Student Tutors 3 $8.44 62.67 $1,587
4. Student Tutor 1 $9.21 60 $553
5. Student Tutor 1 $10.17 58.5 $595
6. $0
Total Hourly Personnel Costs: $15,532
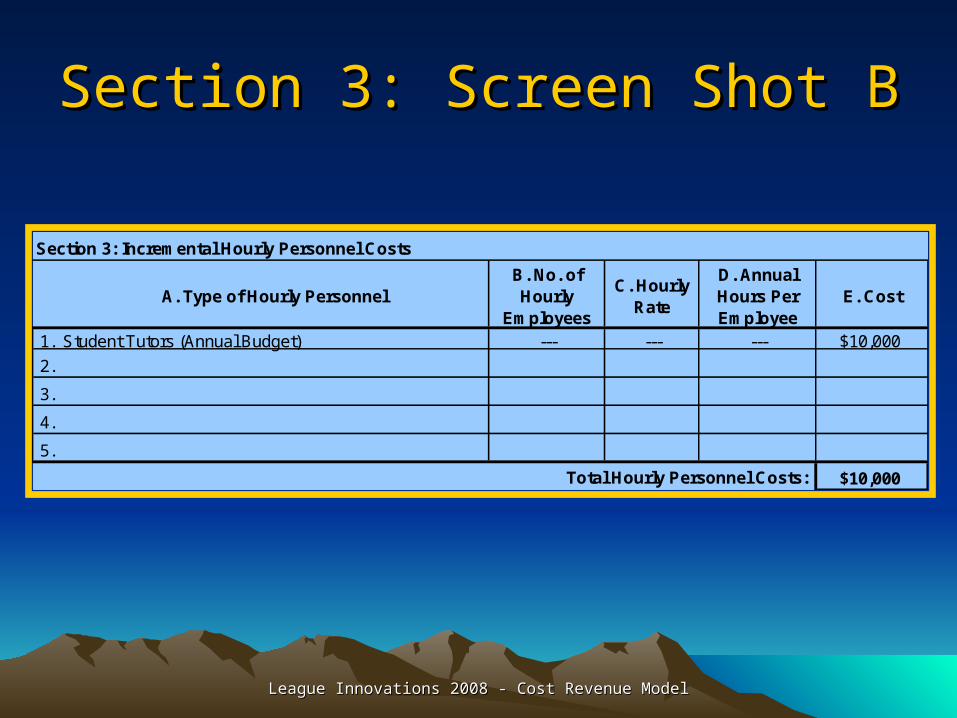
Section 3: Screen Shot BSection 3: Screen Shot B
League Innovations 2008 - Cost Revenue ModelLeague Innovations 2008 - Cost Revenue Model
Section 3: Incremental Hourly Personnel Costs
A. Type of Hourly PersonnelB. No. of Hourly
Employees
C. Hourly Rate
D. Annual Hours Per Employee
E. Cost
1. Student Tutors (Annual Budget) --- --- --- $10,000
2.
3.
4.
5.
$10,000Total Hourly Personnel Costs:
League Innovations 2008 - Cost Revenue ModelLeague Innovations 2008 - Cost Revenue Model
Section 4: Fixed CostsSection 4: Fixed Costs
• Enter:– A. Description of Item– B. Annual Cost
• Equipment costs may be amortized• Facilities costs are very tricky
– Possibly no cost - how you use available space– Possibly large cost - adding a new building– Still tricky to assign to a non-traditional
program, especially as they are systemized

Section 4: Screen ShotSection 4: Screen Shot
League Innovations 2008 - Cost Revenue ModelLeague Innovations 2008 - Cost Revenue Model
Section 4: Incremental Fixed Costs
A. ItemB. Annual
Cost/Budget
1. Equipment $12,141
2. Supplies $20,290
3. Facilities $0
4.
Total Fixed Costs: $32,431

League Innovations 2008 - Cost Revenue ModelLeague Innovations 2008 - Cost Revenue Model
Section 5: Cost SummarySection 5: Cost Summary
• Summary of sections 2, 3, & 4 – provides total annual cost of program

Section 5: Screen ShotSection 5: Screen Shot
League Innovations 2008 - Cost Revenue ModelLeague Innovations 2008 - Cost Revenue Model
Section 5: Incremental Cost Summary
A. ItemB. Annual
Cost/Budget1. Salaried Personnel Costs $71,990
2. Hourly Personnel Costs $10,000
3. Fixed Costs $0
Total Program Costs: $81,990

League Innovations 2008 - Cost Revenue ModelLeague Innovations 2008 - Cost Revenue Model
A Note on CostsA Note on Costs
• Most programs we refer to here have durations of an academic year or less– Examples include a learning community, a
program to pass a specific class, or a program that supports a two-semester course sequence
• If program duration is longer than a year, then include multi-year costs instead of annual cost estimates

League Innovations 2008 - Cost Revenue ModelLeague Innovations 2008 - Cost Revenue Model
Section 6: Incremental FTES Section 6: Incremental FTES
• This is where the action is (OK, stop laughing)
• Calculates incremental FTES from the non-traditional program compared to a control group
• Need Institutional Research to use real-world data
• Can use as an exploratory “what-if” tool
League Innovations 2008 - Cost Revenue ModelLeague Innovations 2008 - Cost Revenue Model
Section 6.1Section 6.1
• Enter #1 - Students in Program Annually
League Innovations 2008 - Cost Revenue ModelLeague Innovations 2008 - Cost Revenue Model
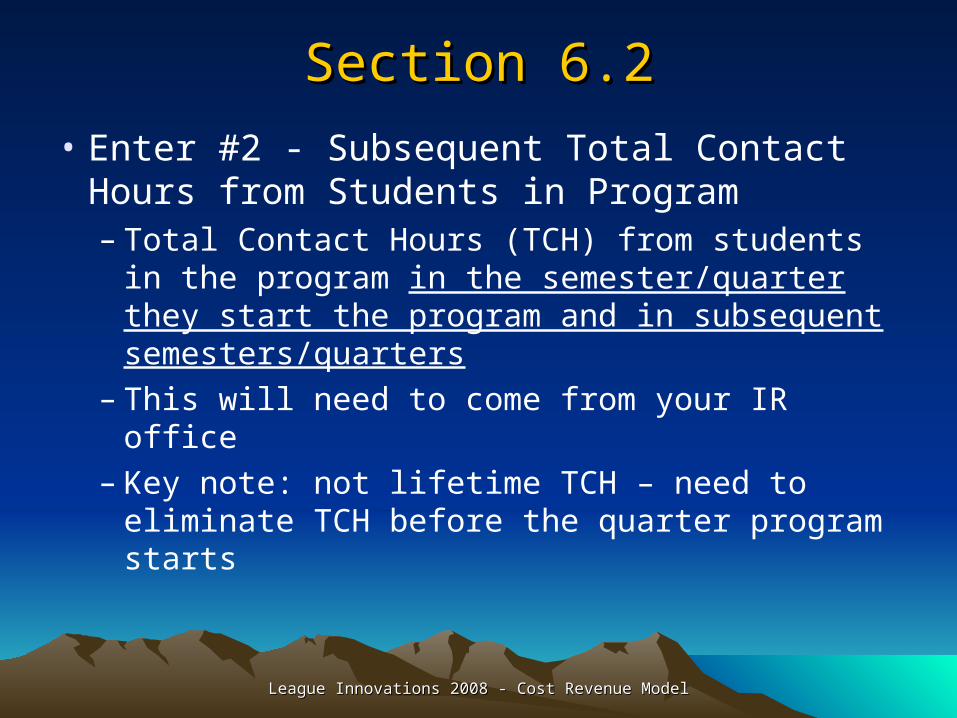
Section 6.2Section 6.2
• Enter #2 - Subsequent Total Contact Hours from Students in Program– Total Contact Hours (TCH) from students in
the program in the semester/quarter they start the program and in subsequent semesters/quarters
– This will need to come from your IR office– Key note: not lifetime TCH – need to eliminate
TCH before the quarter program starts
League Innovations 2008 - Cost Revenue ModelLeague Innovations 2008 - Cost Revenue Model
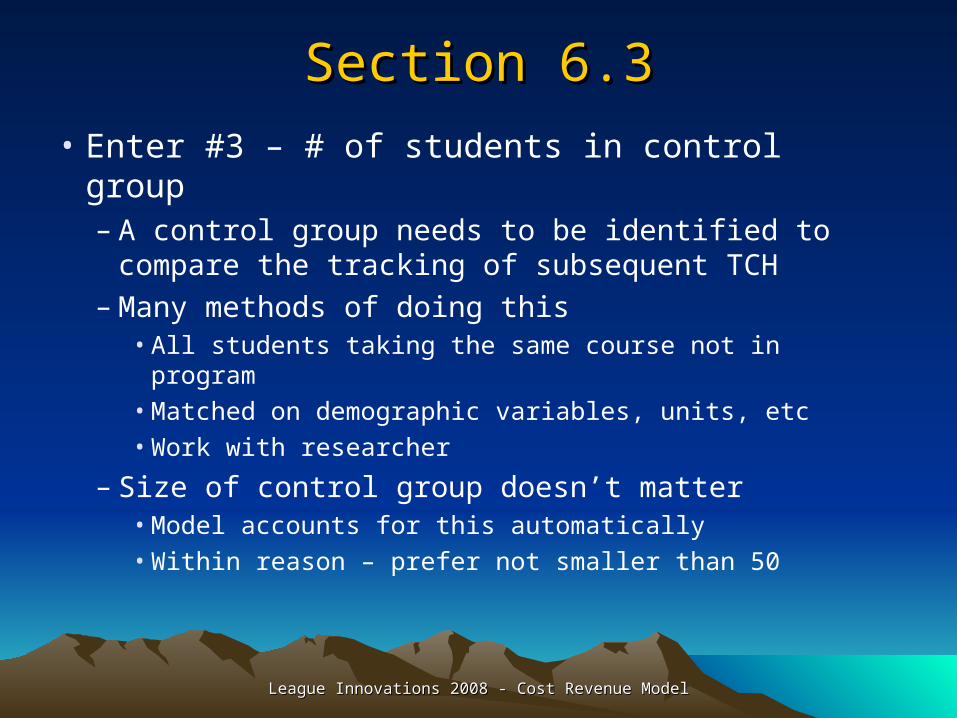
Section 6.3Section 6.3
• Enter #3 – # of students in control group– A control group needs to be identified to
compare the tracking of subsequent TCH– Many methods of doing this
• All students taking the same course not in program
• Matched on demographic variables, units, etc
• Work with researcher
– Size of control group doesn’t matter• Model accounts for this automatically
• Within reason – prefer not smaller than 50

League Innovations 2008 - Cost Revenue ModelLeague Innovations 2008 - Cost Revenue Model
Section 6.4Section 6.4
• Enter #4 – Subsequent Total Contact Hours from Students in Control Group– Similar to #2

League Innovations 2008 - Cost Revenue ModelLeague Innovations 2008 - Cost Revenue Model
Section 6.5Section 6.5
• #5 is calculated automatically, and is darn nifty, if I do say so myself
• Adjusts automatically for different sized Control and Program groups
• A bit tricky, but the figure in this cell is what the difference in Total Contact Hours would be if the control group was the same size as the program group
• That is, program group is the reference pt.

League Innovations 2008 - Cost Revenue ModelLeague Innovations 2008 - Cost Revenue Model
Section 6.6 - 6.8Section 6.6 - 6.8
• #6-#8 are calculated automatically
• #6 - Percentage Increase in TCH from Program Group
• #7 - Conversion of TCH to FTES– FTES = TCH / 525
• #8 - Calculates apportionment from additional FTES @ $4361 / FTES
League Innovations 2008 - Cost Revenue ModelLeague Innovations 2008 - Cost Revenue Model
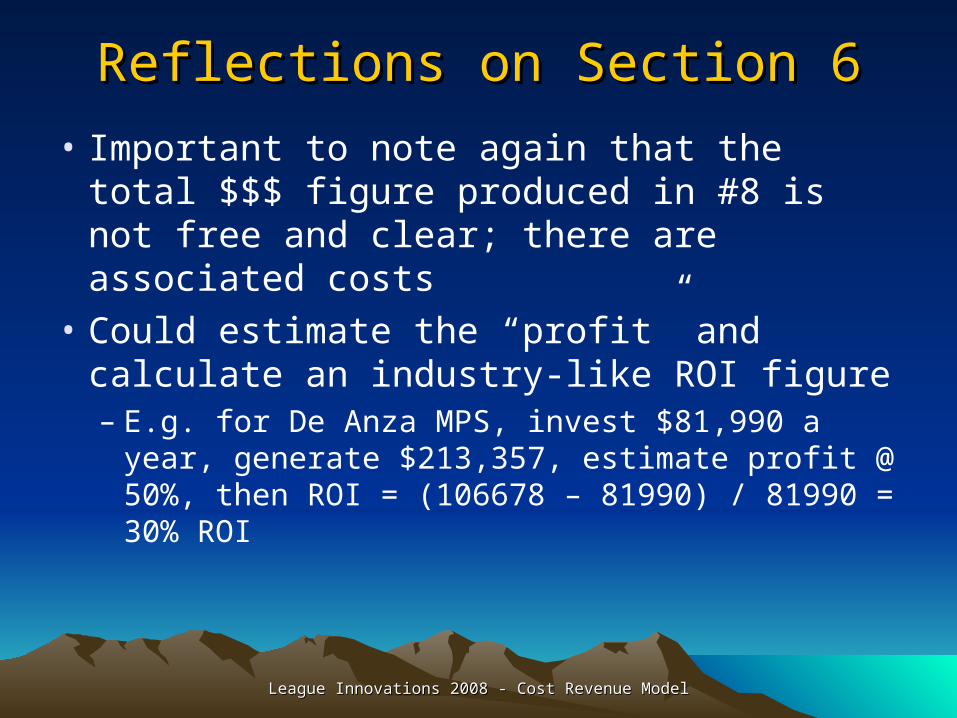
Reflections on Section 6Reflections on Section 6
• Important to note again that the total $$$ figure produced in #8 is not free and clear; there are associated costs
• Could estimate the “profit” and calculate an industry-like ROI figure– E.g. for De Anza MPS, invest $81,990 a year,
generate $213,357, estimate profit @ 50%, then ROI = (106678 – 81990) / 81990 = 30% ROI
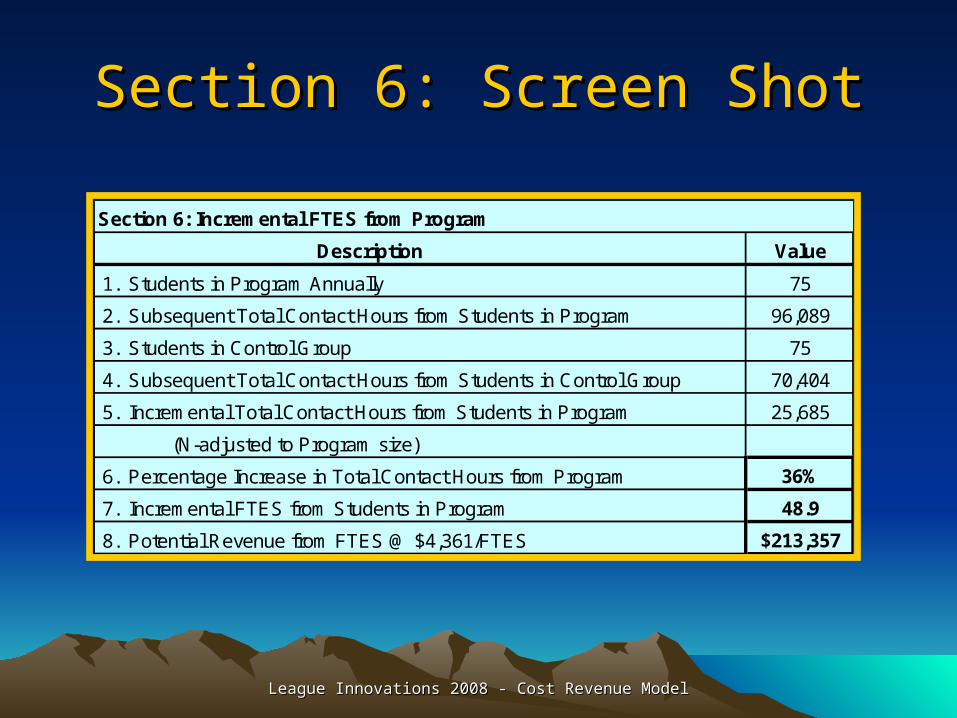
Section 6: Screen ShotSection 6: Screen Shot
League Innovations 2008 - Cost Revenue ModelLeague Innovations 2008 - Cost Revenue Model
Section 6: Incremental FTES from Program
Description Value
1. Students in Program Annually 75
2. Subsequent Total Contact Hours from Students in Program 96,089
3. Students in Control Group 75
4. Subsequent Total Contact Hours from Students in Control Group 70,404
5. Incremental Total Contact Hours from Students in Program 25,685
(N-adjusted to Program size)
6. Percentage Increase in Total Contact Hours from Program 36%
7. Incremental FTES from Students in Program 48.9
8. Potential Revenue from FTES @ $4,361/FTES $213,357