successful innovation - vtt.fi · are also important from an innovation management viewpoint, as...
TRANSCRIPT

VTT PU
BLICATIO
NS 486
Successful innovation. The determinants of com
mercialisation and break-even tim
es of innovations
Tätä julkaisua myy Denna publikation säljs av This publication is available from
VTT TIETOPALVELU VTT INFORMATIONSTJÄNST VTT INFORMATION SERVICEPL 2000 PB 2000 P.O.Box 200002044 VTT 02044 VTT FIN�02044 VTT, Finland
Puh. (09) 456 4404 Tel. (09) 456 4404 Phone internat. +358 9 456 4404Faksi (09) 456 4374 Fax (09) 456 4374 Fax +358 9 456 4374
ISBN 951–38–6025–6 (soft back ed.) ISBN 951–38–6026–4 (URL: http://www.inf.vtt.fi/pdf/)ISSN 1235–0621 (soft back ed.) ISSN 1455–0849 (URL: http://www.inf.vtt.fi/pdf/)
ESPOO 2002ESPOO 2002ESPOO 2002ESPOO 2002ESPOO 2002 VTT PUBLICATIONS 486
Christopher Palmberg
Successful innovation
The determinants of commercialisation and break-eventimes of innovations
This publication defines the success of innovations through the time takenfor innovations to reach commercialisation and the point of break-even, toinvestigate the relationships between the sources and success of innovations.The publication uses a database of Finnish innovations, and contributes toprevious research by covering a range of different types of innovations fromvarious industries, and by applying econometric duration analysis.
The results indicate that commercialisation and break-even times aresurprisingly short. Complex innovations are associated with longercommercialisation times, while exported innovations are associated withshorter break-even times. Different sources of innovation appear to havegreater effects on the durations than firm size and the origin of innovationsin specific sectors. Innovations related to customer demand and marketniche shorten both commercialisation and break-even times, while science-based innovations prolong them. An interesting result is also thatcompetitive markets shorten the break-even times of innovations.
The results carry implications for the management of innovation and thedesign of policy from the viewpoint of trade-offs between the timeliness,objectives and outcomes of innovation.

VTT PUBLICATIONS 486
Successful innovationThe determinants of commercialisation and
break-even times of innovations
Christopher PalmbergVTT Technology Studies
ISBN 951–38–6025–6 (soft back ed.)ISSN 1235–0621 (soft back ed.)
ISBN 951–38–6026–4 (URL: http://www.inf.vtt.fi/pdf/)ISSN 1455–0849 (URL: http://www.inf.vtt.fi/pdf/)
Copyright © VTT Technical Research Centre of Finland 2002
JULKAISIJA – UTGIVARE – PUBLISHER
VTT, Vuorimiehentie 5, PL 2000, 02044 VTTpuh. vaihde (09) 4561, faksi (09) 456 4374
VTT, Bergsmansvägen 5, PB 2000, 02044 VTTtel. växel (09) 4561, fax (09) 456 4374
VTT Technical Research Centre of Finland, Vuorimiehentie 5, P.O.Box 2000, FIN–02044 VTT, Finlandphone internat. + 358 9 4561, fax + 358 9 456 4374
VTT Teknologian tutkimus, Tekniikantie 12, PL 1002, 02044 VTTpuh. vaihde (09) 4561, faksi (09) 456 7007
VTT Teknologistudier, Teknikvägen 12, PB 1002, 02044 VTTtel. växel (09) 4561, fax (09) 456 7007
VTT Technology Studies, Tekniikantie 12, P.O.Box 1002, FIN–02044 VTT, Finlandphone internat. + 358 9 4561, fax + 358 9 456 7007
Cover picture: Lehtikuva Compad
Technical editing Maini Manninen
Otamedia Oy, Espoo 2002

3
Palmberg, Christopher. Successful innovation. The determinants of commercialisation and break-even times of innovations. Espoo 2002. VTT Publications 486. 74 p. + app. 8 p.
Keywords innovation sources, successful innovation, duration analysis
AbstractSuccessful innovation is typically defined at the firm level where market shares,productivity, or profitability is taken as an indicator of success. Nonetheless,firms are simultaneously involved in many innovation development projectswith varying success. This paper defines the success of innovations through thetime taken for the innovations to reach commercialisation and the point of break-even, to investigate the relationships between the sources and success ofinnovations. The paper uses a database of Finnish innovations commercialisedduring the 1980s and 1990s, and contributes to previous research by covering arange of different types of innovations from various industries, and by applyingeconometric duration analysis. The results carry implications for themanagement of innovation and the design of policy from the viewpoint of trade-offs between the timeliness, objective and outcomes of innovation.

4
PrefaceThis report relates to a larger research project on Finnish innovations (Sfinno)undertaken at the VTT Technology Studies since 1998, although the roots of theproject extend back to the founding of the VTT Technology Studies (then Groupfor Technology Studies) in 1992. The broader aim of the Sfinno project has beento analyse recent industrial renewal processes in the Finnish industries from theviewpoint of innovations. The Sfinno-project has been financed by the NationalTechnology Agency of Finland (Tekes).
The ambitious aim of the Sfinno project to relate innovations and theirdevelopment processes to the renewal of Finnish industries raised variousquestions about how one might measure the success of innovations. Obviouslythe contribution of innovations to industrial renewal depends on their success,since successful innovations are a prerequisite for the performance of firms. In aprevious report related to the Sfinno-project the focus was on the relationshipsbetween innovation processes and the performance of firms. In this report I shiftthe focus from the firm to the level of innovations, by defining success in termsof the time taken for firms to commercialise their innovations and reach thepoint of break-even.
The contribution of this report is foremost an empirical one. The idea to useduration analysis for modelling the success of innovations arose during myparticipation in a course on micro-data econometrics at the Stockholm School ofEconomics during my year as a visiting researcher at the Royal Institute ofTechnology in Stockholm. Subsequently, one of the lecturers, Professor AlmasHeshmati, provided excellent guidance to the empirical part of this report, forwhich I am most grateful. I am indebted to my fellow researchers for valuablecomments received during the presentation of earlier versions of this report atthe Chalmers University of Technology, Department of Industrial Dynamics, aswell as at internal seminars of the VTT Technology Studies. Naturally, allremaining misconceptions remain mine alone. I also wish to thank Tekes fortheir financial support.
Christopher Palmberg, Helsinki 12.11. 2002

5
Contents
Abstract................................................................................................................. 3
Preface .................................................................................................................. 4
1. Introduction..................................................................................................... 71.1 Background............................................................................................ 71.2 Purpose and structure ............................................................................ 8
2. A theoretical and conceptual framework ...................................................... 112.1 The chain-linked model of innovation................................................. 112.2 A review of previous research............................................................. 142.3 Definition of successful innovation and sources of heterogeneity ...... 18
3. Applying duration analysis - modelling hazard functions ............................ 213.1 Duration models and the hazard function............................................ 213.2 Specification and estimation of the empirical models......................... 233.3 The explanatory variables.................................................................... 26
3.3.1 The substantial variables ......................................................... 273.3.2 Controlling for sources of heterogeneity................................. 30
4. Descriptive and estimation results ................................................................ 364.1 The dependent variables and sources of heterogeneity ....................... 36
4.1.1 Commercialisation durations - descriptives ............................ 374.1.2 Break-even durations - descriptives ........................................ 40
4.2 The determinants of commercialisation and break-even durations ..... 424.2.1 Commercialisation durations - estimation results ................... 434.2.2 Break-even durations - estimation results ............................... 48
5. A synthesising discussion ............................................................................. 555.1 The nature of commercialisation and break-even durations................ 555.2 Sources of heterogeneity and strategic trade-offs................................ 565.3 Sources of innovations, commercialisation and break-even durations 595.4 Limitations related to the definition of successful innovations ........... 625.5 Policy implications .............................................................................. 64
6
6. Conclusions................................................................................................... 67
References........................................................................................................... 69
AppendicesAppendix 1: The principal component analysisAppendix 2: Descriptive statistics of explanatory variablesAppendix 3: Stepwise models on commercialisation and break-even
durations
7
1. Introduction
1.1 Background
Successful innovation is a topical issue for firms and policy makers alike.Successful innovation is the cornerstone of competitive advantage, not only inthe high-tech industries, but also in the more traditional and maturing industries.Successful innovation is also a prerequisite for technological change, growth andindustrial renewal. The determinants of successful innovation are thus ofparticular relevance, since they should be taken into account in the design ofspecific policy measures, as well as for the selection of innovation developmentprojects with a higher success rate. The characteristics of successful innovationare also important from an innovation management viewpoint, as firms areconfronted with different trade-offs between the different modes andorganisation of their innovative activities, the different nature of innovations,and their success.
Empirical research on successful innovation is nonetheless made more difficultby the multidimensionality of the definition of successful innovation. Success isusually defined by commercial criteria at the firm level, where rising marketshares, productivity growth, or profitability are taken as indicators of success.Nonetheless, firms are typically multi-product and simultaneously involved inmany innovation development projects with varying success rates, wherebyfirm-level studies miss out the true diversity of innovation within firms (comparewith Pavitt 1998). An alternative approach, common especially in the innovationmanagement literature, has thus been to focus on the success of individualdevelopment projects, or innovations. In this vast and ever-growing literaturesuccessful innovation is defined in different dimensions, ranging from thetechnical novelty, commercial success, or commercialisation and break-eventimes of innovations (for extensive overviews of this literature see Montoya-Weiss & Calantone 1994; Cobbenhagen 2000).
Of the former definition of successful innovations, an especially topical issuerelates to the speed with which firms manage to commercialise their innovationsin the markets, and return positive cash flows through shorter break-even times.The need for speed is often discussed as a competitive advantage in relation to

8
rising R&D costs in combination with shorter product life cycles, increasingcompetition, market segmentation and globalisation. (Cooper 2001). Byshortening commercialisation times, firms may beat competitors and therebyachieve a first mower advantage in terms of market position and proliferation.The rapid return of positive cash flows on development expenditures, throughshorter break-even times, likewise enable firms to continuously and persistentlyinnovate in line with rapid developments in the market (Ali et al. 1995; Karlsson& Åhlström 1999). Indeed, several studies suggest that there is a relationshipbetween shorter commercialisation and break-even times, as well as longer-termprofitability and growth at the firm level, even though the nature and strength ofthese relationships are under debate (Niininen & Saarinen 2000, Cooper 2001and the references therein; for a critical discussion compare to Kerin et al. 1992;Griffin 1993; Cooper & Kleinschmidt 1995; Lambert & Slater 1999).
The definition of successful innovation relates the discussion to various modelsof innovation which dissect the innovation process into various stages, andpropose that the interactions between science & technology -pull versus market-related forces provide the crucial 'windows of opportunity' and relatedknowledge for successful innovation within firms. (Kline & Rosenberg 1986;Freeman 1994). Moreover, these interactions are shaped by the broader sectoralcontext in which firms innovate due to sectoral differences in the nature oftechnologies, markets and competition. (Malerba & Orsenigo 1997; Marsili2001). Hence, one key question is how different sources of innovations enablefirms' to gain first mower advantages and achieve commercial success with theirinnovations.
1.2 Purpose and structure
In light of the above, the purpose of this paper is to investigate the relationshipsbetween the sources and success of innovations across different sectors, and thusexplicitly acknowledge for the sectoral diversity in the sources of innovations.Furthermore, the focus of this paper is on two specific dimensions of successfulinnovation, namely the time taken for innovations to reach the market and break-even. I thereby contribute to the discussion on successful innovation in threenovel ways. First, I suggest a relatively narrow but more objective definition ofsuccess, using a unique survey data of some 600 innovations developed in

9
Finnish manufacturing during the 1980s and 1990s (Palmberg et al. 1999).Secondly, I extend previous studies by covering a large number of sectors, aswell as by defining different types of sources of innovations that cut across thosesectors (compare to Pavitt 1984; Cesaratto & Mangano 1993; Palmberg 2002).Thirdly, I apply econometric duration analysis for the modelling of thecommercialisation and break-even durations, and thus enter relatively unchartedwaters from a methodological point of view (see van den Berg 2000 for adiscussion of different applications of duration analysis).
The uniqueness of the data that I use in this paper stems from the application ofthe so-called object-approach to innovation measurement (see Kleinknecht et al.2002 for a comparison of different approaches to innovation measurement). Thedefinition of an innovation was "a technologically new or significantly enhancedproduct from the viewpoint of the firm" that has been commercialised in themarket, of which close to 80 percent are new to the global markets (Palmberg etal. 1999, p. 10 & 22). The innovations and innovators have been identified usingliterature reviews, the annual reports of large firms and expert opinion inpreparation for the survey (compare to Townsend et al. 1981; Kleinknecht &Bains 1993; Santarelli & Piergiovanni 1996; for a thorough discussion of themethodology used in identifying the innovations see Palmberg et al. 1999).1
The paper is structured as follows. In section 2 I discuss the chain-linked modelof innovation as a relevant theoretical and conceptual framework for theempirical part of the paper. Moreover, I selectively review previous relevantstudies with the purpose of relating the discussion of successful innovation in theinnovation management literature to the chain-linked model. I also identifysources of heterogeneity across different types of innovations that need to beincorporated in the analysis. In section 3, I present the hazard function as a keyconcept in duration analysis, derive a set of general duration models withdifferent assumptions about the nature of the hazard function, and discuss the 1 The identification of innovations has not been based on statistical sampling, since the theoreticalpopulation of ‘all’ innovations is unknown - a common problem of the object approach. Instead,the data collection could be described as a designed census with the aim of identifying all possibleinnovations adhering to the specific definition used. The coverage of the database in terms ofindustries and firm size groups is nonetheless representative of innovative activity in Finnishindustry (Leppälahti 2000; Palmberg et al. 2000; Pentikäinen et al. 2002).

10
specification and estimation of their empirical counterparts. Section 4 presentsdescriptive analysis of commercialisation and break-even durations, as well asestimation results. Section 5 synthesises the findings, while section 6 concludesthe paper.

11
2. A theoretical and conceptual framework
2.1 The chain-linked model of innovation
The focus on the commercialisation and break-even times, or durations, ofinnovation processes requires a conceptualisation of the different stages ofinnovation that aids operationalisation in the empirical analysis. While severalmodels of innovation have been proposed over the years, the so-called chain-linked model of innovation by Kline & Rosenberg (1986) is sufficiently generaland analytical as a point of departure for my purposes (see Rothwell 1994 for areview of different models of innovation). Moreover, this model is wellestablished and frequently referred to in the literature.
The chain-linked model divides the innovation process into five relativelyseparable stages. During the first stage of innovation, a need in a potentialmarket is identified. The second stage starts with an invention and/or analyticaldesign for a new process or product that is thought to fill that market need. Thethird stage marks the start of detailed design and testing, or the actualdevelopment of the innovation. During the fourth stage, the emerging design isredesigned and eventually enters full-scale production. The final and fifth stageintroduces the innovations to the market, initiating marketing and distributionefforts. Another central feature of the model is the identification of fiveinterrelated paths of innovation, describing different sources of innovations andrelated knowledge inputs throughout the innovation process (Kline & Rosenberg1986). The model is illustrated in Figure 1 below.

12
Figure 1. The chain-linked model (slightly adapted from Kline & Rosenberg1986, p. 290).
Of the five paths of innovation, the first central chain of innovation, is markedwith arrows labelled C in the figure. The central chain of innovation generalisesinnovation processes that emerge from some perception of market needs, whereafter the invention and/or analytical design is taken through development andproduction to marketing and distribution, as described above.
The second path of innovation highlights feedback throughout the central chainof innovation. Of these, the most important is the feedback from customers orfuture users of the innovation, labelled F in the figure. This path highlights usersas sources of innovations, or more generally the user-orientation of manyinnovation processes especially in the instruments, and complex machineryindustries (compare to von Hippel 1988; Eliasson 1995). However, the feedbackloops arising within the firm, between R&D departments and production, arealso covered by this second path and labelled f in the figure. They illustratecontinuous in-house problem-solving activity throughout the innovation process,or sources of innovations related to learning by doing and using as discussed ingreater depth by Rosenberg (1982).
The third path of innovation links the central chain of innovation to scientificknowledge, defined as "the creation, discovery, verification, reorganisation, and
f f f f
f
I SD
CC
Potentialmarket
Invent/
analytical
Design/test
Redesign/ Distribute/market
Knowledge
Research
kk
r r r
1 21 21 2
3 3 3444
analyticaldesign

13
dissemination of knowledge of physical, biological and social nature" (Kline &Rosenberg 1986, p. 287). This interrelationship between the innovation processand the developments in the sciences is indicated by the arrow labelled D in thefigure as the third path of innovation in the model. The point made is that someinnovations relate directly to basic and novel research, typically accessedthrough collaboration with universities or research institutes. This is often thecase in the science-based industries, the prime example being the pharmaceuticalindustry (compare to the science-based sectors in Pavitt 1984).
However, developments in the sciences and basic research is not typicallyconsidered the primary source of innovations in other types of industries thatrely relatively more on existing knowledge and the modification of availabletechnologies for incremental innovation, especially as mediated throughcollaboration with suppliers of machinery and equipment from a range ofdifferent industries (compare to the specialist-dominated and scale-intensiveindustries in Pavitt 1984). Thus, the fourth path of innovation, labelled with thearrows K, captures innovation processes feeding, in the first instance, on thepool of existing knowledge (indicated by 1 and 2 in the figure), and only in thesecond instance on basic novel research if existing knowledge fails to solveproblems along the central chain of innovation (indicated by 1 and 3 in thefigure). The remaining fifth path of innovation, labelled I in the figure, is lessrelevant in this context. It is taken to illustrate the opportunities opened up byinnovations for the advances in scientific knowledge, as exemplified by thedevelopment of faster microprocessors or medical instruments needed to pursuea particular field of basic research.
The merits of the chain-linked model should be viewed in light of previousscience & technology -push, versus demand -pull models of innovation that haveoften been referred to as linear models. The linear models view innovations asarising either purely from developments in the sciences and technologies, ordemand from customers and users in the markets (Rothwell 1994). In contrast,the five different paths of innovation identified above cater to the true diversityin the sources of innovations. This also implies that the relative role played bydifferent sources will vary across different types of industries and sectors, assuggested above (compare to Pavitt 1984; Klevorick et al. 1995; Harabi 1995).Nonetheless, as Hall (1994) notes, the chain-linked model can also be criticisedfor being overly mechanical and ignoring the broader institutional setting
14
wherein innovation processes takes place, leaving no room for regulatorychange, standards etc. as the sources of innovations. Neither is the modelpredictive in the sense that it would suggest how different sources and relatedknowledge inputs determine the success of innovations. Instead one has to turnto the relevant empirical literature in the field.
2.2 A review of previous research
A first landmark study on successful innovations was by Myers & Marquis inthe late 1960s, covering 567 innovations developed in the railroad, computer,and housing industries. The study compared pairs of more and lesstechnologically advanced innovations as a measure of their technologicalsuccess (referenced in Maidique & Zirger 1984). The next major study was theso-called SAPPHO project undertaken at the Science Policy Research Unit in theUK during the mid 1970s (Rothwell et al. 1974). Again, the methodology was tocompare pairs of successful and less successful innovations, this time in thechemicals and instruments industries. A successful innovation was defined asone that attained a significant market penetration and/or made a profit, while anunsuccessful one was associated with the bankruptcy of the commercialisingfirm, withdrawal of the innovation from the market, or failure of the innovationto reach commercialisation.
Taken together, these two studies defined the subsequent commonly usedmethodology of identifying discriminating factors differentiating between pairsof successful and less successful innovations. Moreover, they pointed towardsfive general sources discriminating in favour of successful innovations, namelythe involvement of users during innovation, the attention given to marketing andpublicity, the efficiency of development in terms of commercialisation times, theeffective internalisation of external scientific and technological developments,and managerial competencies. (Maidique & Zirger 1984; Freeman & Soete1997). Nonetheless, the studies did not incorporate variables capturing the natureof the environment in which the innovations were developed, as these wereassumed to be similar across all project due to the focus on particular industries.
Of the pairing studies that followed SAPPHO, the NewProd research projectheaded by Robert Copper, as well as the Stanford Innovation Project, have been
15
the most ambitious and extensive, covering a range of different industries andcountries. In the earlier NewProd studies, successful innovation was againdefined in terms of the commercial success of innovations, measured throughmarket sales (Cooper 1979, 1980). In the Stanford Innovation Project the focuswas on the US electronics industry, adhering to a similar commercial definitionby measuring the degree of deviance of the innovations from financial break-even along an interval scale (Maidique & Zirger 1984). Consequently, thesestudies identified important success factors mostly related to market-relatedaspects of innovation, thus essentially confirming the earlier studies. The newvariables discriminating between successful and less successful innovationswere those capturing the different nature of the innovations, especially thesuperiority of the innovations from the users viewpoint, the growth of the marketand degree of competition, as well as synergies between marketing and R&Dactivities of the firm commercialising the innovation.
The Stanford Innovation Project is a relevant point of departure here, eventhough the study is contextually tied to the high-tech electronics industry. Oneimportant result of the study was that shorter commercialisation durationsclearly distinguished the commercially more successful innovations from others.Maidique & Zirger (1984) also came to the conclusion that previous familiaritywith the underlying technologies and markets of the innovation was associatedwith successful innovations. However, common agreement prevailed that nosingle factor can be singled out as the key determinant of successful innovation.This was further underlined by follow-up NewProd studies, which establishedempirically based typologies of successful innovation (Cooper & Kleinschmidt1987, 1995). These typologies included timeliness (commercialisation times ofinnovations), commercial (break-even times and sales of innovations),opportunity (opening up of new markets), and market share (acquired marketshare) dimensions of success. Moreover, Cooper & Kleinschmidt concluded thatone dimension of success in fact might conflict with another, depending on thestrategies that firms pursue in different markets.
The issue of timeliness, in terms of commercialisation times, and the commercialsuccess in terms of the break-even times of innovations received increasingattention, especially in the 1990s, when time-based management strategiesbecame popular (the primary reference is Clark & Fujimoto 1991). In the meagrebut growing empirical literature, the focus has been on the impact of the nature
16
of innovations and entry strategy on commercialisation and break-evendurations. Moreover, these studies have highlighted problems related tomeasuring the timeliness of durations in terms of the closeness of a project inmeeting its time goal, which relies on the strong assumption that the goals forproject durations were adequately set in the first place (compare to the studies byMaidique & Zirger 1984; Cooper & Kleinschmidt 1995). Instead, they measurecommercialisation and break-even durations directly as the length of time inmonths or years taken for the innovations to reach commercialisation or break-even.
One first identifiable study of relevance to discuss here is Schoonhoven et al.(1990). They touched on the issue of the determinants of commercialisationtimes by investigating the relationships between different variables on the natureof innovation, and the founding characteristics of new firms in the USsemiconductor industry, on the time take to the shipment of their first product.Schoonhoven et al. (1990) also used duration analysis to model theserelationships, based on a survey data from 102 firms. They distinguishedbetween innovations achieved through the creation of new knowledge, and thosecreated through the synthesis of existing knowledge familiar to the firm. Thefounding characteristics of the firms included data on the experience of the stafffrom the industry in question, the organization and financial resources of thefirm, as well as the nature of competition in their respective market niche. Theprimary results were that innovations synthesising existing knowledge, alongwith a close relationship between production and marketing within the firm,lower spending on R&D. Moreover, fewer competitors in the market nicheshortened the time taken to first shipment.
Firm’s familiarity with the underlying technology was an issue explicitlyconsidered by McDonough & Barczak (1992). They measured thecommercialisation times of 32 innovations in 12 firms, defined as the perceivedimportance of rapid product development according to project leaders at thefirms. The familiarity of the underlying technology of the innovations waslikewise measured through the perceived familiarity that the R&D staffexperienced during the development of the innovations. McDonough & Barczak(1992) also included variables measuring the cognitive problem-solvingorientation of the team members. Their results, in fact, contradict those bySchoonoven et al. (1990), even though the authors acknowledge that the sample

17
of firms might have been biased since the focus was on innovation developmentprojects in smaller firms. More significantly, they concluded that the cognitiveproblem-solving orientation of the R&D staff moderates the relationshipsbetween technological familiarity and commercialisation times.
A more recent study, and especially relevant in this context, is Ali et al. (1995).Their primary objective was to explore the relative impact of the nature ofinnovation, in terms of their novelty to the markets, technological complexity,and different market entry strategies on commercialisation and break-evendurations. The data was collected through structured interviews and a surveycovering a sample of 73 innovations from small firms in a range of differentindustries in the US. Ali et al. (1995) used ordinary least square regression, andalso included control variables capturing industry- (market growth rate, productsubstitutability, life span of new technology), firm- (firm size, familiarity withinnovation), and project- specific (total development costs, relative price ofinnovation) sources of heterogeneity. With respect to commercialisationdurations, the novelty and complexity of innovations both prolonged thedurations (compare also to Griffin 1993). Product advantage as an entry strategy(the innovation perceived as competitive due to it's uniqueness) shortenedcommercialisation but prolonged break-even durations. Moreover, shortercommercialisation durations, larger firm size and market pioneering (first out onthe market with the innovation) were found to be associated with shorter break-even durations. The other control variables did not turn up as significant.
Another relevant study found in the literature is by Karlsson & Åhlström (1999)that elaborates further on the impact of the nature of innovations oncommercialisation durations, this time defined as the time taken from the basicidea to full-scale production. Data collection was restricted to cover six firmsfrom various countries in the automobile industry. Different type of innovationsare distinguished by various dimensions relating to their functionalcharacteristics, such as car performance, comfort, luxury etc. Using simplecorrelation analysis, Karlsson & Åhlström (1999) establish a significantrelationship between the different dimensions of the nature of innovations andcommercialisation durations, measured as a average index for confidentialityreasons. Taken together, as also concluded by Ali et al. (1995) and Karlsson &Åhlström (1999), both of these studies thereby suggest that there is a strategic

18
trade-off between the characteristics of the innovation, and the strive towardsreducing commercialisation durations, especially for competitive reasons.
2.3 Definition of successful innovation and sources ofheterogeneity
With reference to the discussion above, the definitions of successful innovationsused in this paper capture two specific dimensions of successful innovation,amongst many others identifiable in the literature. Both definitions takeadvantage of the survey that I use, which includes survey questions on thenumber of years taken for the innovations to reach commercialisation and break-even (the dependent variables are presented and discussed at greater length insection 4.1 below). The first definition is the shortest possible duration for aninnovation to reach the market, or commercialisation, from the year of the basicidea of the innovation. In this context, the commercialisation durations allude tothe timeliness, or efficiency, of the innovation process along the central chain ofinnovation. This dimension of successful innovation is thus assumed to capturefirm’s ability to accelerate innovation processes for achieving first-moweradvantages ahead of competitors in a specific market niche. The seconddefinition of a successful innovation is the shortest possible duration for aninnovation to reach the point of break-even from the year of commercialisationin terms of generating a positive cash flow. This second dimension thus relatesmore to the commercial success of the innovation, once it has reached themarket and started to accumulate sales. Both definitions of success are thussimilar to those used by Ali et al. (1995).
Before proceeding to the methodological discussion and analysis of the results,some considerations on these definitions of successful innovations arewarranted. First of all, it should be noted that the innovations identified for thepurpose of the survey have passed a threshold criteria of success, in the sensethat they are all commercialised in the markets with a high degree of novelty,even though their commercial success varies. This implies that my definitionsand measurement of successful innovations are relative ones. They do notdistinguish successful innovations from failed ones, but rather distinguishrelatively more successful from relative less successful one's by theircommercialisation and break-even durations. It should also be stressed that an
19
analytical distinction should be made between success in the shorter and longerrun. Hence, an innovation that reaches the market and generates a positive cashflow quickly might offer a temporary advantage to the innovating firm for thereasons discussed above. However, in the longer run, successful innovation willultimately depend on the sustained competitive position of the innovation in themarket, and accumulated sales over a longer period of time.
A second consideration relates to the specific definition used, and theircompatibility with the chain-linked model of innovation and previous research.The definition of the commercialisation duration is relatively clear-cut andidentical to what Ali et al. (1995) call 'cycle time', as well as Griffin (1993) call'total time', but slightly different compared to what Karlsson & Åhlström (1999)call 'product development cycle time'. By and large, it thus appears tocorrespond well to the common understanding of commercialisation times ofinnovations appearing in the relevant literature. With reference to the chain-linked model, the year of basic idea correspond to the initiation of the secondstage of innovation with the introduction of an invention and/or analytical designfor an innovation that is thought to fill a specific market need (compare to Kline& Rosenberg (1986)). While this assumption is necessary for the empirical set-up of this paper, it should be stressed that incremental innovation prior to thefirst invention and/or analytical design is thus assumed away. This might havethe potential effect of biasing in favour of shorter commercialisation durations,especially in industries that are characterised by a higher degree ofcumulativeness in innovation activity.
The definition of the break-even duration is trickier. In terms of the chain-linkedmodel, the break-even point occurs sometime during the fifth and final stage asthe innovation initiates marketing and distribution efforts with the aim ofaccelerating sales. The year of break-even is here defined as the point in timewhen the innovation started to generate a positive cash flows. However, giventhat the durations have been calculated on the basis of a survey, it is uncertainwhether the interpretation of break-even for the survey respondent is compatiblewith the definition used here across all innovations. An alternative interpretationcould be that it indicates the point in time when the accumulated positive cashflow exceeds accumulated investment during the development of the innovation,as defined in Ali et al. (1995). However, this interpretation would assume thatthe survey respondents have the capability to estimate accumulated investments

20
in relation to the accumulated cash flows generated by the innovations - anassumption that I consider less viable. A related consideration to be incorporatedin the analysis is the fact that many break-even durations are right-censoredsince the year of break-even might be out of reach for the survey in the case ofthe most recently commercialised innovations.
Finally, a third consideration concerns sources of heterogeneity due to thedifferent characteristics of the innovations, which will moderate the effects ofdifferent sources of innovations on the durations. With reference to the review ofprevious research, commercialisation durations appear to be affected by thedegree of familiarity of the innovations to the firms, as well as their complexityin terms of the underlying technological knowledge bases (McDonough &Barczak 1992; Ali et al. 1995). Break-even durations appear to be affected bythe novelty of innovations to the markets, since novel innovation have a higherprobability of achieving first mower advantages irrespective of theircommercialisation times. Moreover, Ali et al. (1995) suggest that larger firmsize have greater R&D and marketing resources, whereby the size of thecommercialising firm is another important sources of heterogeneity acrossinnovations. It also seems clear that both commercialisation and break-evendurations should vary from one sector to the next in so far as different sectorsreflect the different nature of underlying knowledge bases that firms draw upon,as well as the nature of the markets and competition that the innovations willface (compare to Malerba & Orsenigo 1997; Marsili 2001).
21
3. Applying duration analysis - modellinghazard functions
3.1 Duration models and the hazard function
Duration analysis is a relatively new econometric technique designed to modelthe length of spells, or durations, of particular states. The substantive problemsthat called for the development of such methods related to the biomedicalsciences and the modelling of survival times of patients with particular diseases,as well as the engineering sciences in analysis of the breakdown times ofmachines or components. Thus duration analysis is often also referred to assurvival, or lifetime, analysis.
In economics, duration analysis has found most widespread application in themodelling of unemployment durations, where the transition from a state ofunemployment to employment is the duration modelled (Allison 1984; Lancaster1990). Other fields in economics concern the modelling of diffusion times oftechnologies, firm exit and entry decisions, rate of obsolescence of patents, timeto investment, or the survival of new products (van den Berg 2000). Durationanalysis also overcomes problems associated with standard regression analysisin cases where the dependent variable is censored, or immeasurable over somerange, that is typical to duration data since some durations often are ongoing atthe time of data collection.
Adhering to the notation used in Kiefer (1988), the probability distribution ofduration can be specified by the distribution function:
(1) ( ) ( )tTtF <= Pr
This function specifies the probability that the random variable T, denoting theduration, is less than some time t. The corresponding density function is:
(2) ( ) ( ) dttdFtf /=
These two functions are equivalent ways of specifying a distribution. A furtheruseful function to define is the survivor function, giving the probability of
22
surviving a duration at least to time t, or that the random variable T will equal orexceed the value t:
(3) ( ) ( ) ( )tTtFtS ≥=−= Pr1
From (2) and (3) the hazard function, and the associated hazard rate, can bederived. It gives the probability that the duration ends at time t conditional on theduration having lasted until time t:
(4) ( ) ( ) ( )tStft /=λ
The hazard function can also be expressed more precisely in terms ofprobabilities as:
(5) ( ) ( ) htThtTtth
/|Prlim0
≥+<≤=→
λ
This equation specifies the hazard function in terms of the limit of h , the shortinterval of length of time after t , as it approaches zero. From above it is easy torealise that the probability distribution function, it's density function, thesurvivor and hazard functions are related and derivable from each other. Whilethe procedure in standard regression analysis usually relies on specifying theprobability distribution functions, the starting point in duration analysis is thespecification of the hazard function. This is because duration models are usuallycast in terms of conditional rather than unconditional probabilities,acknowledging for the fact that the probability that the hazard rate might alsodepend on the length of the duration itself. (Kiefer 1988).
Since the hazard rate also depends on the length of the duration itself, durationanalysis relies on a range of less common probability distributions and relatedmodel parametrisations. The different parametrisations specify how the durationdependency affects the outcome of the estimations. The choice of theparametrisation is tricky in practice, but should reflect theoretical insightsapplicable to the behaviour of the specific types of duration that is modelled, aswell as descriptive analysis of the durations. While the literature identifies awhole range of distributions, the common one's are the exponential, the Weibull,and the logistic distributions (Kiefer 1998; for an extensive overview seeLancaster 1990). In the exponential parametrisation, the hazard rate is modelled

23
as constant over time adhering to an exponential distribution (neutral durationdependency). The Weibull parametrisation relaxes the assumption of a constanthazard rate by allowing it to either increase or decrease over the distribution(positive or negative duration dependency). The logistic parametrisationincorporates durations that exhibit an initially increasing, and thereafterdecreasing, hazard rates, or vice versa (combination of increasing and decreasingduration dependency). (Allison 1984).
3.2 Specification and estimation of the empirical models
Since all innovations in the database are commercialised, the probability ofcommercialisation increases and approaches unity as the innovation processproceeds. Once the innovation is in the market, it should intuitively also be thecase that the probability of break-even increases due to accumulated sales andthe diffusion of the innovation. A relevant starting point for the specification andestimation of the empirical models is therefore one of positive durationdependency in accordance with the Weibull parametrisation of the hazardfunction, where the hazard rate of commercialisation or break-even is assumedto increase as time goes by (positive duration dependency). The assumption ofconstant hazard rates (neutral duration dependency), in accordance with theexponential parametrisation, is clearly too restrictive and unrealistic in thiscontext.
However, it is also possible that the nature of duration dependency might changeover ime. In the case of the commercialisation durations, a reversal fromincreasing to decreasing hazard rates (positive to negative duration dependency)might, for example, relate to a need to resort to basic research to overcomeunexpected bottlenecks in the development of innovations (compare toRosenberg 1982). In the case of the break-even durations, a reversal todecreasing hazard rates might occur in cases where the commercialisation timeof an innovation is delayed, the first mower advantage is lost, and there is moreroom for imitative innovations by competitors which reduces profit margins andsuccessively dampen, or even foreclose, the prospects for achieving a positivecash flow. Taken together, it thus also appears relevant to move beyond theWeibull parametrisations to include logistic parametrisations that incorporates

24
such duration behaviour for the sake of comparison of the underlyingassumptions.
Table 1 presents the functional forms of the Weibull and logisticparametrisations, including the density, survival, and hazard functions. The tableagain adheres to the notation used in Kiefer (1988) for consistency. From thetable it is clear that the hazard function of the Weibull parametrisationincorporates both γ and α as unknown parameters. In both the Weibull andlogistic parametrisations, α determines the dependency of the duration on timet . In the case of the Weibull parametrisation, there is positive durationdependency if 1>α , and negative duration dependency if 1<α . In the specialcase of 1=α , the hazard function remains constant over time, and we are backin the exponential parametrisation. In the case of the logistic parametrisation,there is positive duration dependency, turning gradually into negative durationdependency if 1>α , while there is negative duration dependency if 10 ≤<α .
Table 1. Functional forms of the Weibull and logistic parametrisations of theduration model.
Distribution Density function Survival function Hazard function
Weibull ( ) ( )αα γγα tttf −= − exp1 ( ) ( )αγttS −= exp ( ) 1−= αγαλ tt
Logistic ( ) ( )21 1/ γγα αα tttf += − ( ) ( )γαttS += 1/1 ( ) ( )1 / 1t t tα αλ γα γ−= +
The unknown parameters of the hazard function, including the coefficients of theexplanatory variables, are estimated using the method of maximum likelihood(MLE). The method chooses as parameter estimates those values that maximisethe likelihood, or probability, of observing the data that have actually beenobserved. Moreover MLE combines censored and uncensored observations insuch a way as to produce estimates that are asymptotically unbiased, normallydistributed and efficient. The first step in MLE is to derive the empirical modelfrom the density, survival and hazard functions presented in Table 2 below.

25
Table 2. The empirical models and likelihood functions of the Weibull andlogistic parametrisations of the duration model.
Distribution Empirical model
Weibull: ( ) ( ) 11 exp −− ′== αα αβγαλ txtt
Logistic ( ) ( ) ( ) ( )( )βαβγγαλ αααα ´exp1/´exp1/ 11 xtxtt +=+= −−
Leaving the slightly involved maximisation of the log likelihood functionsunaccounted for here, the interpretation of the coefficients β of the explanatoryvariables included in x′ require some additional discussion. In the general case,the interpretation of the partial derivatives is similar to linear regressioncoefficients. Nonetheless, the interpretation of partial effects should be madewith due care since they will depend on the duration dependency of the hazardfunction, that, in turn, might be influence by unobserved heterogeneity despitethe inclusion of control variables in the model. Instead the main attention shouldbe given to the sign and significance of the coefficients.
The sign of the coefficient indicates the direction of the effect of the explanatoryvariable on the conditional probability that the commercialisation or break-evenduration ends according to equation (5) above in the hazard rate formulation. Apositive sign of the coefficient increases this probability, and shortens theduration, while a negative sign decreases the probability and prolongs theduration. The significance of the coefficients can be tested using standard t-statistics and the associated p-value in the normal fashion. Likewise, the effectsof dropped variables on the durations rely on the log likelihood ratio teststatistics (LR statistic) commonly used in connection with MLE. The LRstatistic is asymptotically Chi-Square distributed with the degrees of freedomequal to the number of restrictions imposed. It is defined as LR = -2 (RLLF -ULLF), where RLLF is the value of the likelihood function of the restrictedmodel and ULLF is the value of the log likelihood of the full, unrestricted,model (Gujarati 1995).

26
Analysis of model specification, and the fit of the model, boils down to selectingthe most appropriate parametrisation of the models. Apart from theoreticalinsights and descriptive analysis of the durations, a common approach is to usethe non-parametric so-called Kaplan-Meier estimates that approximate the shapeof the hazard function prior to the inclusion of explanatory variables. TheKaplan-Meier estimates calculate the probability that a duration ends by dividingthe number of observations reaching the end of the duration by the number ofobservations at risk of reaching the end of the durations at a predefine unit intime, when censored observations are also accounted for. Once the explanatoryvariables are included, residual analysis can be used. In duration analysis theresidual is derived by integrating the hazard function as follows, and hence iscalled the integrated hazard function (Kiefer 1988):
(6) ( ) ( )�=Λt
duut0
λ
The integrated hazard function is a kind of a generalised residual, and can beused to compare the fit of different models by their parametrisation in caseswhere the included explanatory variables are the same. Residual analysisincludes analysing descriptive statistics of the residuals for the durations ofinnovations, t . Table 3 presents the integrated hazard functions of the Weibulland logistic parametrisations of the duration model.
Table 3. The integrated hazard functions of the Weibull and logisticparametrisations of the duration model.
Distribution Integrated hazard function
Weibull: ( ) αγtt =Λ
Logistic ( ) ( )αγtt +=Λ 1ln
3.3 The explanatory variables
The focus of the paper on the relationships between the sources of innovationsand the success of innovations takes the empirical analysis into uncharted water,
27
especially from the viewpoint of previous research that has suffered from a lackof data on individual innovations and the sectoral diversity in the sources ofinnovations. This implies that the choice of substantial explanatory variables hasto rely on both the theoretical framework and the related structure of the surveyin an explorative manner, while an acknowledgement of potential sources ofheterogeneity across the durations of innovations draws on previous researchdiscussed above. My explorative approach also implies that no clear-cuthypothesis concerning the effects of the substantial explanatory variables on thedurations can be made. In this sense, the chain-linked model of innovation canonly serve as a conceptual organiser for identifying different sources ofinnovations that presumably should also affect the commercialisation and break-even durations in different ways.
3.3.1 The substantial variables
A large part of the survey was dedicated to tracing the sources of innovations,both in terms of the origin of innovation and the importance assigned to differentcollaborative partners. The choice of measured variables included in the surveyoriginally reflected the different paths of innovation in the chain-linked model(the theoretical and conceptual points of departure for the survey are discussedin depth in Palmberg et al. 1999). With reference to the chain-linked model, thefirst path along the central chain of innovation should be interpreted as a generaldescription of innovation processes, whereas the remaining three paths introducethe different sources of innovations of concern here. The following set ofexplanatory variables is included in both models to capture the nature of thesedifferent innovation opportunities. The variables have been reduced from thelarger selection of variables using principal component analysis (PCA), as ameans to avoid collinearity between the original set of variables, and are thusorthogonal to each other (see appendix 2 for the results of the PCA; Palmberg2002 for a discussion of the PCA).
28
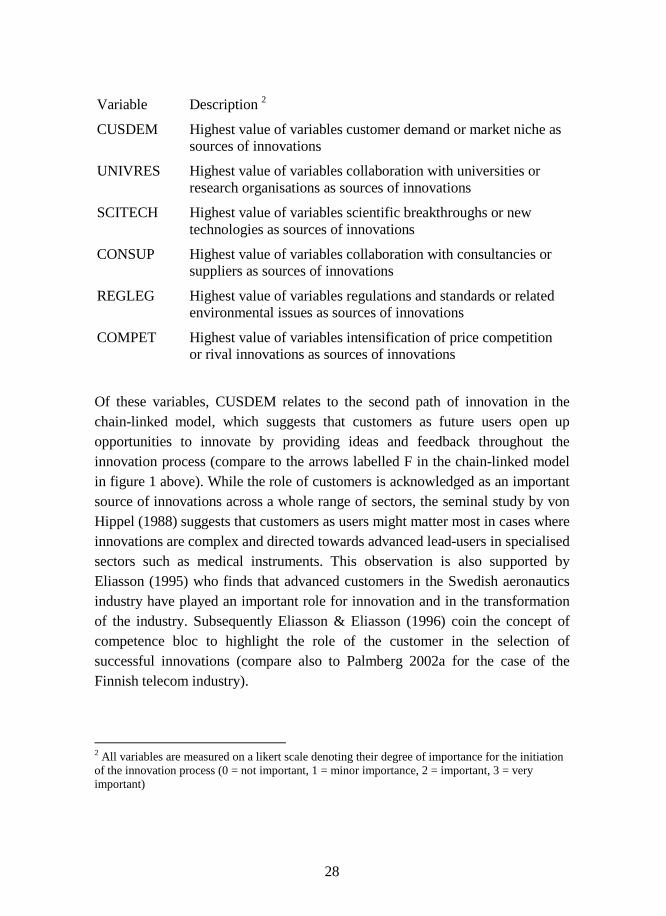
Variable Description 2
CUSDEM Highest value of variables customer demand or market niche assources of innovations
UNIVRES Highest value of variables collaboration with universities orresearch organisations as sources of innovations
SCITECH Highest value of variables scientific breakthroughs or newtechnologies as sources of innovations
CONSUP Highest value of variables collaboration with consultancies orsuppliers as sources of innovations
REGLEG Highest value of variables regulations and standards or relatedenvironmental issues as sources of innovations
COMPET Highest value of variables intensification of price competitionor rival innovations as sources of innovations
Of these variables, CUSDEM relates to the second path of innovation in thechain-linked model, which suggests that customers as future users open upopportunities to innovate by providing ideas and feedback throughout theinnovation process (compare to the arrows labelled F in the chain-linked modelin figure 1 above). While the role of customers is acknowledged as an importantsource of innovations across a whole range of sectors, the seminal study by vonHippel (1988) suggests that customers as users might matter most in cases whereinnovations are complex and directed towards advanced lead-users in specialisedsectors such as medical instruments. This observation is also supported byEliasson (1995) who finds that advanced customers in the Swedish aeronauticsindustry have played an important role for innovation and in the transformationof the industry. Subsequently Eliasson & Eliasson (1996) coin the concept ofcompetence bloc to highlight the role of the customer in the selection ofsuccessful innovations (compare also to Palmberg 2002a for the case of theFinnish telecom industry).
2 All variables are measured on a likert scale denoting their degree of importance for the initiationof the innovation process (0 = not important, 1 = minor importance, 2 = important, 3 = veryimportant)

29
The variable UNIVRES relates to the third path of innovation, which highlightssources of innovations related to developments in the sciences, assimilatedthrough collaboration with universities or research organisations. This variablecaptures innovations that have their origin in basic or applied novel research incases where the pool of existing knowledge is insufficient for the developmentof innovations (compare to the arrow labelled D in the chain-linked model inFigure 1 above). The reliance on novel basic or applied research duringinnovation is particularly common in science-based sectors, the prime examplebeing the pharmaceuticals and chemicals sectors (Pavitt 1984; Gambardella1995). Science-based sectors are also typically characterised by highertechnological opportunities and R&D-intensity due to higher productivity ofR&D in these sectors. Nonetheless, lower R&D-intensities might also concealscience-based innovations, suggesting that innovations drawing on collaborationwith universities and research institutes are common in other sectors as well(Palmberg 2002b).
The variable SCITECH relates to the fourth path of innovation, which highlightssources of innovations relating to scientific breakthrough and new technologiesexternal to the firm, which add to the general pool of knowledge underlyinginnovations (compare to the arrows labelled k in the chain-linked model inFigure 1 above). This variable is thus distinctly different compare to UNIVRES,since innovations draw on the general available pool of knowledge in the firstinstance, rather than directly on novel basic or applied research. Nonetheless,there appears to be two viable means of assimilating this type of generallyavailable knowledge. Firms might become engaged in their own in-house R&Dto develop what Cohen & Levinthal (1990) coin as absorptive capability toabsorb external knowledge. Alternatively, firms might dip into the general poolof knowledge through collaboration with a range of external partners.
The variable CONSUP summarises innovation processes drawing oncollaboration with consultancies and suppliers as carriers of the available pool ofknowledge. I assume that these collaboration with these types of partners pointtowards frequent spillovers and generic knowledge bases, which induce firms toseek complementarities between in-house R&D and external transmitters of suchknowledge. The role of consultancies, especially so-called 'knowledge-intensivebusiness services' (KIBS), are especially important in this context (Leiponen2001). The role of suppliers as sources of innovations through supplying
30
machinery and equipment is also well documented, especially in supplier-dominated sectors where firms a less dedicated to in-house R&D (Pavitt 1984).Taken together, the variable CONSUP can thus also be related to the fourth pathof the chain-linked model.
The inclusion of the two remaining variables REGLEG and COMPET ismotivated more by the structure of the survey, and it's ambition to cover the truediversity in the sources of innovations, rather than to the chain-linked model assuch. The first of these, REGLEG relates to the broader issue of the regulatorychange and environmental issues in connection with innovation. It capturesregulatory change and standardisation, especially related to environmentalissues, that might contribute in various ways to innovation by enforcinginterfaces between previously disconnected technologies, and by opening upnew markets (the construction, telecom, or pharmaceuticals industries are primeexamples). The variable COMPET captures innovation processes induced by acompetitive environment in sectors characterised by price competition and rivalinnovation, assumed to be related to the saturation of markets and the maturingof sectors (compare to the product or industry life cycle discussion in Utterback1994).
3.3.2 Controlling for sources of heterogeneity
The issue of heterogeneity in a duration analysis set-up is important, as washinted above, because unobserved/unaccounted heterogeneity biases in favour ofdecreasing duration dependence, which might blur interpretations and makeinterference more unreliable. The most obvious way to control for heterogeneityis to include the sources of such heterogeneity as explanatory dummy variables.The following dummy variables are thus included in the two models to cater todifferent sources of heterogeneity, listed first for the modelling of

31
commercialisation durations, and thereafter for the modelling of break-evendurations:3
Variable Description
FNOVEL Value 1 if innovation is entirely new to the firm and 0 ifinnovation is a major or minor improvement to existing products
COMPLEX Value 1 if innovation is of the high-complexity type and 0 ifinnovation is of the low-complexity type
The dummy variable FNOVEL captures the technological familiarity of theinnovation to the firm in terms of how much the firm has had to extend it'sknowledge base. The dummy variable COMPLEX captures the degree ofcomplexity of the innovation by the degree to which it involves the combinationof different technologies and related components (a telephone switching systemwould be an example of a high complexity innovation, while a new type of glue-laminated timber would be an example of a low-complexity innovation).Together these two variables are assumed to control for the different nature ofinnovations that McDonough & Barczak (1992), Ali et al. (1995), and Karlsson& Åhlström (1999) proposes as major sources of heterogeneity in terms ofcommercialisation durations. Here the assumption of their effects oncommercialisation durations is also the same, namely that innovations of greaternovelty to the firm, and of higher complexity, should prolong the durations.
Variable Description
MNOVEL Value 1 if innovation is new to the global markets and 0 ifinnovation is a new merely to the Finnish markets
EXPORT Value 1 if innovation has been exported and 0 if innovationhas not been exported
PATENT Value 1 if the innovation has been patented in Finland orabroad prior to commercialisation and 0 if not patented
3 A variable to capture innovations involving the development of process technology was includedin the original models on commercialisation and break-even durations, but was subsequentlydropped due to the insignificance of the related coefficients throughout.

32
Turning to the dummy variables included to control for the different sources ofheterogeneity for the modelling of break-even durations, the attention in thedegree of novelty of innovations shifts from the firm to the market viewpointthrough the inclusion of the dummy variable MNOVEL, rather than FNOVEL.This is because innovations offering new characteristics to consumers globallyrather than domestically should sell better and shorten break-even durationsirrespective of the sources of innovations. Moreover, the specification of themodel for break-even durations requires the inclusion of the dummy variableEXPORT to control for innovations that are exported and thus probably face alarger market that should enhance the diffusion of the innovation, increase salesand hence shorten break-even durations. The effects of EXPORT on break-evendurations could nonetheless be the opposite since the commercialisation ofinnovations on the global markets probably also require greater marketing andlogistic efforts that might prolong break-even durations.
In addition, I include the dummy variable PATENT to capture innovations thathave been patented prior to their commercialisation. In this context, I assumethat the variable PATENT is distinct from MNOVEL in capturing propertyrights acquiring to the firm as the innovator, compared to their perceived noveltyfrom the viewpoint of the consumers on the market. A patented innovation mightact as a deterrent, block the entry of rival imitative innovations and secure theachievement of temporary monopoly profits, despite first mower advantages,and thus shorten break-even durations. However, a patented innovation hasprobably also required more development effort due to the complexity andnovelty of the underlying technology, which might prolong break-evendurations. Moreover, PATENT controls for innovations in product fields andsectors where patent protection is viable in the first place, since it is well knownthat the propensity to patent depends on firm- and sector- specific issues (Patel2000).
As has become evident, all the variables discussed above control for differentsources of heterogeneity due to the different characteristics of innovations,depending also on whether the focus is on commercialisation or break-evendurations. All remaining variables control for the characteristics of the firm andthe origin of the innovations by the sector of the commercialising firm, and areincluded in both models on the commercialisation and break-even durations.
33
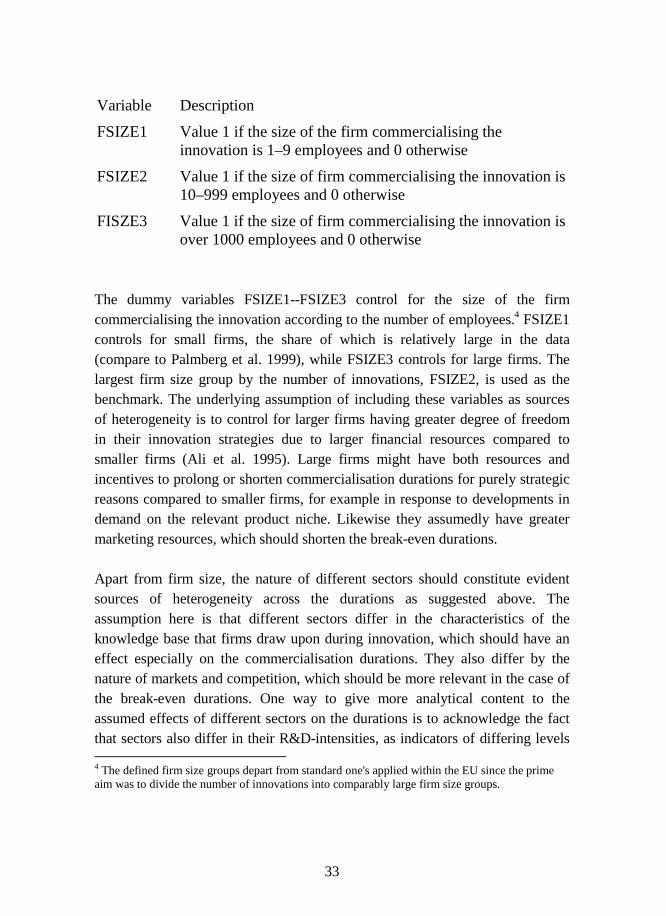
Variable Description
FSIZE1 Value 1 if the size of the firm commercialising theinnovation is 1–9 employees and 0 otherwise
FSIZE2 Value 1 if the size of firm commercialising the innovation is10–999 employees and 0 otherwise
FISZE3 Value 1 if the size of firm commercialising the innovation isover 1000 employees and 0 otherwise
The dummy variables FSIZE1--FSIZE3 control for the size of the firmcommercialising the innovation according to the number of employees.4 FSIZE1controls for small firms, the share of which is relatively large in the data(compare to Palmberg et al. 1999), while FSIZE3 controls for large firms. Thelargest firm size group by the number of innovations, FSIZE2, is used as thebenchmark. The underlying assumption of including these variables as sourcesof heterogeneity is to control for larger firms having greater degree of freedomin their innovation strategies due to larger financial resources compared tosmaller firms (Ali et al. 1995). Large firms might have both resources andincentives to prolong or shorten commercialisation durations for purely strategicreasons compared to smaller firms, for example in response to developments indemand on the relevant product niche. Likewise they assumedly have greatermarketing resources, which should shorten the break-even durations.
Apart from firm size, the nature of different sectors should constitute evidentsources of heterogeneity across the durations as suggested above. Theassumption here is that different sectors differ in the characteristics of theknowledge base that firms draw upon during innovation, which should have aneffect especially on the commercialisation durations. They also differ by thenature of markets and competition, which should be more relevant in the case ofthe break-even durations. One way to give more analytical content to theassumed effects of different sectors on the durations is to acknowledge the factthat sectors also differ in their R&D-intensities, as indicators of differing levels 4 The defined firm size groups depart from standard one's applied within the EU since the primeaim was to divide the number of innovations into comparably large firm size groups.

34
in technological opportunities, or the vitality of developments in the underlyingsciences and technologies that firms draw upon (Klevorick et al. 1995). Hence,the sectoral dummies below are roughly ranked by their R&D-intensities.Sectors spending more than 2 percent of total turnover on R&D are classified ashigh R&D-intensive industries, while those spending less than 2 percent areclassified as low R&D-intensive industries (Hatzichronoglou 1997; StatisticsFinland 2001).5
Variable Description
High R&D-intensive industries
ELECTRO Value 1 if firm commercialising the innovation isclassified in the electronics sector and 0 otherwise
CHEM Value 1 if firm commercialising the innovation isclassified in the chemicals sector and 0 otherwise
INST Value 1 if firm commercialising the innovation isclassified in the instruments sector and 0 otherwise
MACH Value 1 if firm commercialising the innovation isclassified in the machinery sector and 0 otherwise
Low R&D-intensive industries
METAL Value 1 if firm commercialising the innovation isclassified in the metal sector and 0 otherwise
FOOD Value 1 if firm commercialising the innovation isclassified in the foodstuffs sector and 0 otherwise
FOREST Value 1 if firm commercialising the innovation isclassified in the forestry-based sector and 0 otherwise
OTHER Value 1 if firm commercialising the innovation isclassified in other manufacturing sectors and 0otherwise
5 Several different variables capturing average growth rates and R&D-intensities across sectorsand product groups at the year of commercialisation were included in the original models oncommercialisation and break-even durations, but were subsequently dropped due to theinsignificance of the related coefficients throughout.

35
In this set-up, the variables ELECTRO--MACH control for sources ofheterogeneity due to innovations originating in the high R&D-intensiveindustries. Assumedly, commercialisation durations should be longer forinnovations originating in these sectors, due to a greater need to become engagedin systematic R&D and lengthier projects to assimilate different sources ofinnovations. Evident examples are the pharmaceuticals and electronics sectors,in which R&D-intensities tend to be the highest. Alternatively, the variablesMETAL--OTHER control for sources of heterogeneity due to innovationsoriginating in the low R&D-intensive industries in which commercialisationdurations might be shorter. This is due to the different, often incremental, natureof innovation and lesser incentives to become engaged in R&D. The variableMACH, with the greatest number of observations, is used as the benchmark inthe estimations.

36
4. Descriptive and estimation results
4.1 The dependent variables and sources ofheterogeneity
The survey data on the duration of commercialisation and profitability timessuffers from unit non-response. Due to cases where both the year of basic ideaand commercialisation is missing, the number of commercialisation durationsreduces from 598 to 521. Due to left-censored durations, in cases where the yearof the basic idea is unknown, the number of commercialisation durations reducesfrom 521 to 489 in descriptive analysis of the data (1 outlier was removed fromthe sample). The number of break-even durations reduces to 511 due to caseswhere both the year of commercialisation and break-even is missing, and furtherto 344 due to right-censored variables in cases where the year of break-even isbeyond the coverage of the survey (1 outlier was likewise removed). Sincecensored observations can be incorporated in the formulation of the log-likelihood functions and MLE, these will not have to be omitted in theestimations. However, the censored variables have to be omitted from thesubsequent descriptive analysis of the durations.
Turning to the descriptive analysis of the durations, the mean averagecommercialisation duration is 3.5 years, while the mean break-even duration is2.3 years. The durations appear surprisingly short, especially in the case of thebreak-even durations. By the same token it should be added than an assessmentof whether these durations are exceptionally short or not is made difficult by thefact that I have not found any other comparable studies, combining a similarkind of data and definitions of the durations as I do in this paper. The onlyexception is the above referenced study by Ali et al. (1995), who find meancommercialisation durations of 1.55 years, and mean break-even durations of1.45 years, respectively, which seem to be roughly in line with the results herealthough both means are lower. One reason for the lower means in their studymight be that they only included a sample of firms with less than 100 employeesfrom different manufacturing sectors. They also used a looser definition of thenovelty aspects of an innovation.

37
Another important result is the positive and highly significant correlationbetween commercialisation and break-even durations across the board (p<0.01).This is also compatible with a similar correlation found by Ali et al. (1995). Itsuggests that shorter commercialisation durations also leads to shorter break-even durations when the effects of explanatory variables are overlooked, andvice versa. Nonetheless, when the predicted value of commercialisationdurations was included as an explanatory variable in the second model on break-even durations, no significant association was detected.6 Taken together, theassociation between firms' ability to achieve a first mower advantage, as well asthe commercial success of innovations in terms of their potential to generatepositive cash flows quickly, appears to be highly dependent on the moderatingeffects of the included variables capturing different sources of heterogeneity, aswell as different kinds of sources of innovations. This also underlines thestarting point of this paper that the commercialisation and break-even durationscapture two different dimensions of successful innovation, even though theyjointly define successful innovations. Another interesting result is that thedistribution of both durations is skewed to the left, with mediancommercialisation duration of 2.0 and a median break-even duration at 1.0.
4.1.1 Commercialisation durations - descriptives
The mean and median of the commercialisation durations across the differentnature of innovations, characteristics of firms, and sectors to be used asexplanatory control variables are presented in the tables below.
6 The predicted value of the commercialisation durations avoids problems of collinearity withvariable whose coefficients share significant p-values in both models.
38
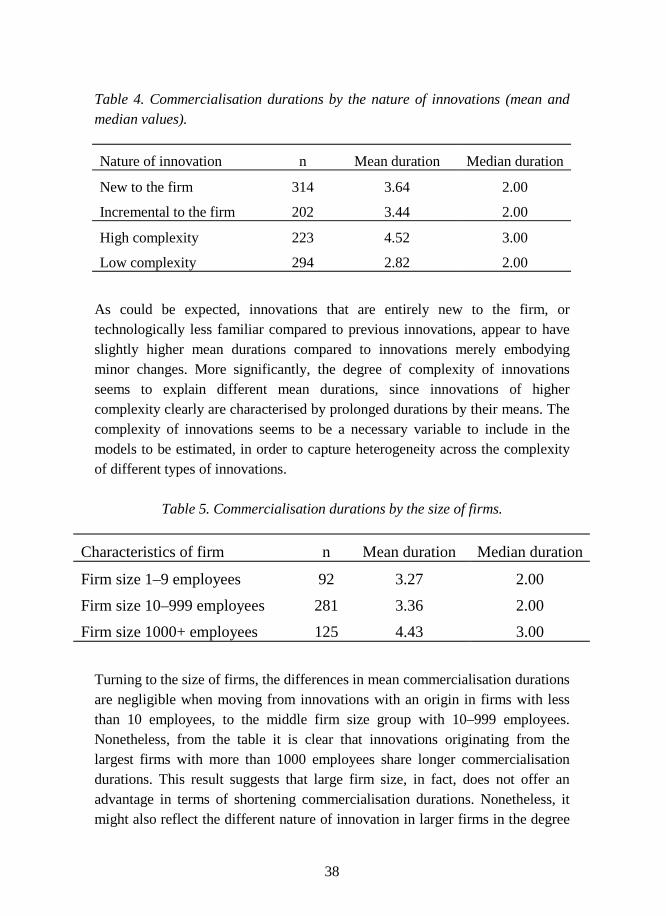
Table 4. Commercialisation durations by the nature of innovations (mean andmedian values).
Nature of innovation n Mean duration Median duration
New to the firm 314 3.64 2.00
Incremental to the firm 202 3.44 2.00
High complexity 223 4.52 3.00
Low complexity 294 2.82 2.00
As could be expected, innovations that are entirely new to the firm, ortechnologically less familiar compared to previous innovations, appear to haveslightly higher mean durations compared to innovations merely embodyingminor changes. More significantly, the degree of complexity of innovationsseems to explain different mean durations, since innovations of highercomplexity clearly are characterised by prolonged durations by their means. Thecomplexity of innovations seems to be a necessary variable to include in themodels to be estimated, in order to capture heterogeneity across the complexityof different types of innovations.
Table 5. Commercialisation durations by the size of firms.
Characteristics of firm n Mean duration Median duration
Firm size 1–9 employees 92 3.27 2.00
Firm size 10–999 employees 281 3.36 2.00
Firm size 1000+ employees 125 4.43 3.00
Turning to the size of firms, the differences in mean commercialisation durationsare negligible when moving from innovations with an origin in firms with lessthan 10 employees, to the middle firm size group with 10–999 employees.Nonetheless, from the table it is clear that innovations originating from thelargest firms with more than 1000 employees share longer commercialisationdurations. This result suggests that large firm size, in fact, does not offer anadvantage in terms of shortening commercialisation durations. Nonetheless, itmight also reflect the different nature of innovation in larger firms in the degree

39
to which they are involved in the development of more complex innovations thatrequired a higher dedication to R&D. Alternatively, they might take advantageof their greater strategic freedom with respect to being better able tointentionally time product launches compared to smaller firms, for example inanticipation of changing trends in demand in the markets, or their competitivepositioning.
Table 6. Commercialisation durations by the sector of origin of innovations.
Origin of innovation n Mean duration Median duration
High R&D-intensive industries
Electronics sector 53 3.68 2.00
Chemicals sector 44 6.59 4.50
Instruments sector 68 4.13 3.00
Machinery sector 141 3.11 2.00
Low R&D-intensive industries
Metals sector 80 3.17 3.00
Foodstuffs sector 43 2.64 2.00
Forestry sector 39 3.16 2.00
Other manufacturing sectors 41 2.45 2.00
The origin of innovations in different sectors clearly differentiates betweendifferent mean durations, motivating the inclusion of the sectoral dummies in themodel. Innovations originating from the R&D-intensive electronics, chemicalsand instruments sectors are characterised by longer commercialisation durations,while innovations originating from the more traditional low R&D-intensivemetals, foodstuffs, forestry and other miscellaneous manufacturing sectors haveshorter durations. With reference to the discussion above, these differencesprobably relate to differences in the nature of the underlying knowledge bases,incentives and requirements of firms to become engaged in more systematicR&D activity, which prolong the durations. In the traditional low R&D-intensiveindustries, the nature of competition (for example, shorter product life cycles)appears to put pressure on firms to shorten their commercialisation durations.

40
4.1.2 Break-even durations - descriptives
The mean and median of the break-even durations included across the differentnature of innovations, characteristics of firms, and sectors to be used asexplanatory control variables are presented in the tables below.
Table 7. Break-even durations by the nature of innovations.
Nature of innovation N Mean duration Median duration
New to the Finnish market 82 1.80 1.00
New to the global markets 264 2.50 2.00
Exported 310 2.48 2.00
Not exported 46 1.25 1.00
Patented 198 2.85 2.00
Not patented 158 1.67 1.00
When looking at mean break-even durations, the novelty of innovations isapproached from the market viewpoint. In this set-up, innovations new to theglobal markets are associated with longer break-even durations compared tothose that are new merely to the Finnish market. Likewise, exported innovationshave longer break-even durations compared to innovations that merely serve thedomestic markets. In fact, both of these results go against the discussion abovewhere I suggested that the relationship should be the opposite - an observationthat awaits further interpretation in the duration analysis that follows. However,in cases where innovations are patented, break-even durations are clearly longercompared to non-patented innovations, motivating the inclusion of this variablein the modelling of break-even durations.

41
Table 8. Break-even durations by the characteristics of firms.
Characteristics of firm n Mean duration Median durationFirm size 1–9 employees 55 2.34 2.00Firm size 10–999 employees 206 2.41 2.00Firm size 1000+ employees 85 2.27 2.00
Again, the size of firms does not seem to differentiate between durations sincethe deviancies of the mean break-even durations from the corresponding averageare small. Clearer differences emerge in terms of the origin of innovations bysectors and the R&D-intensity of industries, according to Table 9. Again higherR&D-intensity is associated with longer durations, while innovations originatingfrom the low-R&D-intensive industries have the shortest durations. The obviousexample of the former is again the chemicals sector, while the lower meanbreak-even durations in the foodstuffs sector is the obvious example of the latter.Hence, this also supports the inclusion of sectoral dummies also in theestimations of break-even durations. The different nature of markets andcompetition, and varying levels of technological opportunities, associated withdifferent sectors appear to matter. Nonetheless, the sectoral origin of innovationsappears less relevant for the break-even durations, compared to thecommercialisation durations.
Table 9. Break-even durations by the sector of origin of innovations.
Origin of innovation n Mean duration Median durationHigh R&D-intensive industriesElectronics sector 33 2.68 1.00Chemicals sector 28 3.09 2.00Instruments sector 56 2.57 2.00Machinery sector 98 2.10 1.00Low R&D-intensive industriesMetals sector 54 2.74 2.00Foodstuffs sector 27 1.84 1.00Forestry sector 23 2.03 1.00Other manufacturing sectors 29 1.55 1.00

42
4.2 The determinants of commercialisation and break-even durations
Following the descriptive analysis of the contribution of variables controlling fordifferent sources of heterogeneity across the durations, the next step is to moveto estimating the models using the Weibull and logistic parametrisations aspresented in Table 2. The approach is to first approximate the shape of thehazard function using the non-parametric Kaplan-Meier estimates as definedabove. Thereafter I present the estimation results of the Weibull and logisticparametrisations of the models that include the explanatory variables. Each fullmodel, including the explanatory variables, is subsequently reduced to a simplermodel in which insignificant variables are dropped based on stepwise loglikelihood ratio tests and the related p-values. For final confirmation of the mostappropriate model for modelling the commercialisation and break-evendurations, I rely on residual analysis based on the integrated hazard defined inequation (8).
The Kaplan-Meier estimates are plotted against the durations to trace the shapeof the approximated hazard function for analysing the nature of the durationdependency, and the relevance of the Weibull and logistic parametrisations ofthe duration models. The estimation results are presented by listing thecoefficients of the explanatory variables and their p-values in the subsequenttables. A positive sign of the coefficient increases the probability that theduration ends, and thereby shortens the duration, while a negative sign decreasesthe probability and prolongs the duration. The number of total and censoredobservations, the value of the estimated parameter α at the data means toindicate the nature of duration dependency, as well as the value of the loglikelihood and the LR test statistic are at the bottom of the table. In this set-up,the LR test statistic denotes the overall significance of the models, as indicatedby the associated p-value. The statistic tests the null hypothesis that allcoefficients are simultaneously equal to zero and hence have no effect on thedurations. The results of the stepwise log likelihood ratio tests are summarisedby presenting the restrictions imposed, the values of the related log likelihood,the LR test statistics, as well as the degrees of freedom involved. Following theestimation results of the reduced models the results of the residual analysis arepresented.

43
4.2.1 Commercialisation durations - estimation results
The approximated hazard rates based on the Kaplan-Meier estimates is presentedin Figure 2 across the whole range of commercialisation durations.
Figure 2. Hazard rates of the commercialisation durations based on the Kaplan-Meier estimates.
According to the figure, the commercialisation durations exhibit positiveduration dependency (increasing hazard rates) up until a duration of 2 years,where after there appears to be a reversal of the duration dependency frompositive to negative (increasing to decreasing hazard rates). When the durationsapproach 15 years, the pattern becomes highly erratic, foremost due to thelimited number of observations at the tail of the distribution. In plain text, theinterpretation is that the probability of an innovation reaching commercialisationappears to increase during the first two years of the duration, after which the
Kaplan-Meier Hazard FunctionDuration
.0
.2
.4
.6
.8
1.0
1.2
-.20 5 10 15 20 25-5
HazardFn

44
tendency is reversed and innovations face declining probabilities ofcommercialisation. Given that the median commercialisation duration also is 2years, the Weibull parametrisation thus seems to an appropriate one for a largeshare of the durations. The reversal of the duration dependency from positive tonegative after that nonetheless also speaks in favour of the logisticparametrisation of the duration model, as suggested above.
Table 10. Estimation results of the models on commercialisation durations(significant coefficients at 0.10 level in bold).
Weibull LogisticVariable Coeff. p-value Coeff. p-value
Constant -1.498 0.000 -1.094 0.000Control variables
FNOVEL 0.001 0.047 -0.001 0.024COMPLEX -0.254 0.010 -0.367 0.000FSIZE1 0.065 0.568 0.020 0.863FSIZE3 0.043 0.667 -0.049 0.651ELECTRO -0.009 0.955 -0.079 0.604CHEM -0.468 0.000 -0.377 0.015INST 0.040 0.782 -0.030 0.849METAL -0.013 0.908 -0.095 0.465FOOD 0.263 0.103 0.167 0.316FOREST -0.137 0.232 0.102 0.498OTHER -0.050 0.754 -0.110 0.576
Substantial variablesCUSDEM 0.164 0.011 0.216 0.001UNIVRES -0.231 0.000 -0.217 0.000SCITECH -0.071 0.050 -0.071 0.062CONSUP 0.080 0.127 -0.003 0.954REGLEG -0.012 0.739 -0.031 0.396COMPET -0.017 0.675 0.000 0.998
Observations 521 521Censored obs. 32 32α 1.220 1.964Log-L -691.477 -682.066LR [χ2(df=17)] 97.322 0.000 91.583 0.000
45
A first inspection of the results reveals that the familiarity of an innovation to thefirm, FNOVEL, it’s degree of complexity, COMPLEX, as well as the origin ofinnovations from the chemicals sector, CHEM, or the foodstuffs sector, FOOD,are the primary observed sources of heterogeneity across the differentcommercialisation durations. In the case of COMPLEX, the coefficient isnegative and highly significant (p<0.01) according to both parametrisations. Thissuggests that a higher degree of complexity of the innovations prolong theircommercialisation durations as expected.
The negative and highly significant (p<0.01) coefficient of the sectoral dummyCHEM confirms the descriptive results above on the longer commercialisationdurations that characterises the chemicals sector. Here the obvious example isthe pharmaceuticals sector, in which high R&D investments and the relatedrequirements to undertake clinical research prior to the commercialisation of aninnovation prolong the durations. In the case of the foodstuffs sector, thecoefficient of FOOD is positive but weakly significant (p<0.10) in the Weibullparametrisation, while the sign remains the same but the coefficient becomesinsignificant in the logistic parametrisation. Hence, the nature of markets andcompetition in this sector seems to differ and shorten the commercialisationdurations for those reasons. Somewhat surprisingly, the degree of familiarity ofinnovations to the firms by the coefficient of the variable FNOVEL shortens thedurations by the positive and moderately significant coefficients (p<0.05),contrary to what was expected. Likewise surprising is the fact that firm size, bythe variables FSIZE1 and FSIZE3, has no apparent effect on the durations.
When moving to the substantial variables capturing the different sources ofinnovations as the focus of this paper, an interesting general result is that theyclearly appear as more important in this context compared to the variablescapturing sources of heterogeneity. The main drivers of shortercommercialisation durations are sources of innovations related to collaborationwith customers, CUSDEM. The related coefficient is positive and highlysignificant (p<0.01) according to both parametrisations. The effect of sourcesrelated to basic or applied novel research, assimilated through collaboration withuniversities or research organisations, UNIVRES, as well as scientificbreakthroughs and new technologies adding to the general pool of knowledge,SCITECH, appears to be the opposite. The coefficient of UNIVRES is negativeand highly significant (p<0.01) according to both the Weibull and logistic
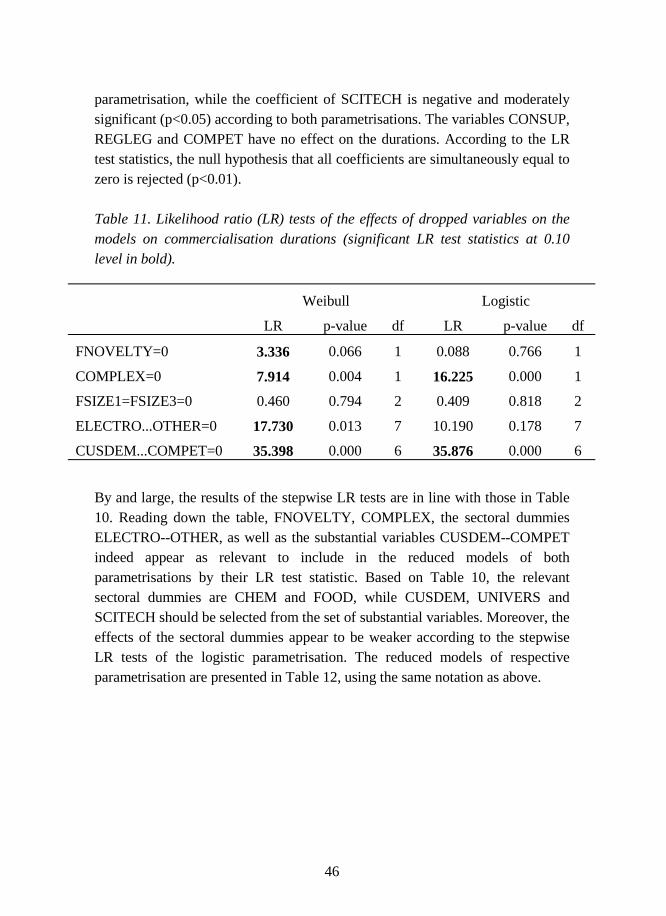
46
parametrisation, while the coefficient of SCITECH is negative and moderatelysignificant (p<0.05) according to both parametrisations. The variables CONSUP,REGLEG and COMPET have no effect on the durations. According to the LRtest statistics, the null hypothesis that all coefficients are simultaneously equal tozero is rejected (p<0.01).
Table 11. Likelihood ratio (LR) tests of the effects of dropped variables on themodels on commercialisation durations (significant LR test statistics at 0.10level in bold).
Weibull Logistic
LR p-value df LR p-value df
FNOVELTY=0 3.336 0.066 1 0.088 0.766 1
COMPLEX=0 7.914 0.004 1 16.225 0.000 1
FSIZE1=FSIZE3=0 0.460 0.794 2 0.409 0.818 2
ELECTRO...OTHER=0 17.730 0.013 7 10.190 0.178 7
CUSDEM...COMPET=0 35.398 0.000 6 35.876 0.000 6
By and large, the results of the stepwise LR tests are in line with those in Table10. Reading down the table, FNOVELTY, COMPLEX, the sectoral dummiesELECTRO--OTHER, as well as the substantial variables CUSDEM--COMPETindeed appear as relevant to include in the reduced models of bothparametrisations by their LR test statistic. Based on Table 10, the relevantsectoral dummies are CHEM and FOOD, while CUSDEM, UNIVERS andSCITECH should be selected from the set of substantial variables. Moreover, theeffects of the sectoral dummies appear to be weaker according to the stepwiseLR tests of the logistic parametrisation. The reduced models of respectiveparametrisation are presented in Table 12, using the same notation as above.

47
Table 12. Estimation results of reduced models on commercialisation durations(significant estimates in bold).
Weibull Logistic
Variable Coeff. p-value Coeff. p-value
Constant -1.543 0.000 -1.150 0.000
FNOVEL 0.001 0.083 -0.001 0.015
COMPLEX -0.229 0.004 -0.348 0.000
CHEM -0.472 0.000 -0.340 0.015
FOOD 0.295 0.049 0.202 0.183
UNIVRES -0.212 0.000 -0.222 0.000
CUSDEM 0.186 0.001 0.205 0.001
SCITECH -0.064 0.053 -0.072 0.054
Observations 521 521
Censored obs. 32 32
α 1.209 1.955
Log-L -693.913 -683.616
LR [χ2(df=7)] 92.454 0.000 88.482 0.000
The signs and significance of the variable coefficients remain the same in thereduced models with the exception of FNOVEL and FOOD, which lose some oftheir significance according to both parametrisations, when compared to the fullmodels. Based on the reduced models, that here are take to represent the finalmodel on the determinants of commercialisation durations, residuals arecalculated and saved for further analysis of the fit the Weibull versus the logisticparametrisations. For the sake of clarity, I rely on the descriptive statistics of theresiduals to determine their variation across the durations in Table 13. Judged bythe lower mean, standard deviation and shorter dispersion of values, the residualof the logistic parametrisation appears to show lesser variation. Hence, thelogistic parametrisations evidently provides a more appropriate description ofthe distribution of the observed commercialisation durations compared to theWeibull parametrisation. The underlying assumption of positive to negative

48
duration dependency of commercialisation durations is thereby furtherconfirmed.
Table 13. Descriptive statistics of residual of the reduced Weibull and logisticmodels on commercialisation durations.
Integrated hazard Mean Std. Dev. Min. Max.
Weibull 0.939 0.933 0.002 5.708
Logistic 0.907 0.841 0.000 5.041
4.2.2 Break-even durations - estimation results
The approximated hazard rates based on the Kaplan-Meier estimates is presentedin Figure 3 across the whole range of break-even durations.7
Kaplan-Meier Hazard FunctionDuration
.00
.05
.10
.15
.20
.25
-.050 5 10 15 20 25-5
HazardFn
Figure 3. The hazard rates of break-even durations based on the Kaplan-Meierestimates. 7 Please note that the scale on the y-axis is different when compared to Figure 2, where the hazardrates of the commercialisation durations are presented.
49
The break-even durations exhibit positive duration dependency (increasinghazard rates) up until 1.5 years. After that, the duration dependency is reversed,and turns negative (decreasing hazard rates) throughout with the exception of atemporary peak at around 17 years. Hence, the interpretation is also similar,namely that the probability of an innovation reaching break-even appears toincrease during the first year after it's commercialisation, where after thetendency is reversed and innovations face declining probabilities of break-even.Given that the median break-even duration is 1 year, the Weibull parametrisationthus again seems to an appropriate one for a large share of the durations. Thereversal of the duration dependency after that nonetheless speaks also in favourof the logistic parametrisation of the duration model, as suggested above.

50
Table 14. Estimation results of the models on break-even durations (coefficientssignificant at 0.10 level in bold).
Weibull Logistic
Variable Coeff. p-value Coeff. p-value
Constant -2.818 0.000 -1.906 0.000
Control variables
MNOVEL 0.001 0.078 0.001 0.046
EXPORT 1.153 0.000 0.756 0.000
PATENT -0.329 0.040 -0.342 0.052
FSIZE1 -0.204 0.359 -0.185 0.415
FSIZE3 -0.156 0.349 -0.182 0.373
ELECTRO -0.135 0.634 -0.258 0.409
CHEM -0.035 0.906 0.024 0.943
INST 0.314 0.253 0.166 0.602
METAL -0.142 0.555 -0.255 0.322
FOOD 0.313 0.273 0.232 0.460
FOREST -0.367 0.141 -0.114 0.718
OTHER -0.114 0.662 0.076 0.819
Substantial variables
CUSDEM 0.227 0.047 0.244 0.051
UNIVRES -0.346 0.002 -0.417 0.001
SCITECH -0.060 0.373 -0.046 0.553
CONSUP 0.008 0.936 -0.026 0.813
REGLEG 0.037 0.582 -0.018 0.811
COMPET 0.227 0.000 0.300 0.000Observations 511 511Censored obs. 167 167α 0.782 1.030Log-L -775.920 -782.178LR [χ2(df=18)] 72.396 0.000 57.835 0.000

51
Among the explanatory variables included in the estimation of break-evendurations, the exportability of innovations by the variable EXPORT, andpatented innovations, PATENT, appear to be the primary sources ofheterogeneity. The coefficients for EXPORT are positive and highly significant(p<0.01) according to both parametrisations, confirming the assumedrelationship between larger markets, the faster diffusion of innovations, andshorter break-even durations. Nonetheless, the moderately significant (p<0.05)and negative coefficient for PATENT suggests that the lesser imitativeness ofinnovations does not shorten their break-even durations.
The effects of the variable MNOVEL on the durations is not clear-cut, eventhough the tendency is that the variable shortens the durations as expected by thepositive sign of the related coefficient - in the Weibull parametrisation it's levelof significance is low (p<0.10), in the logistic parametrisations it is moderate(p<0.05). An interesting result, when compared to the results of the estimationsof commercialisation durations, is the lack of significance of the sectoraldummies.
In these models the substantial variables capturing the different sources ofinnovations likewise appear as more important compared to the variablescapturing sources of heterogeneity. In this set-up, the main driver of shorterbreak-even durations again appears to be collaboration with customers,CUSDEM, with a positive but only moderately significant coefficient (p<0.05)in both parametrisations. Moreover, competitive markets by the variableCOMPET, appears to shorten the durations by the positive and highly significantcoefficient according to both parametrisations (p<0.01). In contrast, the effect ofsources of innovations related to basic or applied novel research assimilatedthrough collaboration with universities or research organisations, UNIVRES,again seems to prolong the durations. The coefficient of UNIVRES is negativeand highly significant (p<0.01) according to both parametrisation. Theremaining variables SCITECH, CONSUP and REGLEG have no effect on thedurations. According to the LR test statistics, the null hypothesis that allcoefficients are simultaneously equal to zero is again rejected in both models(p<0.01).
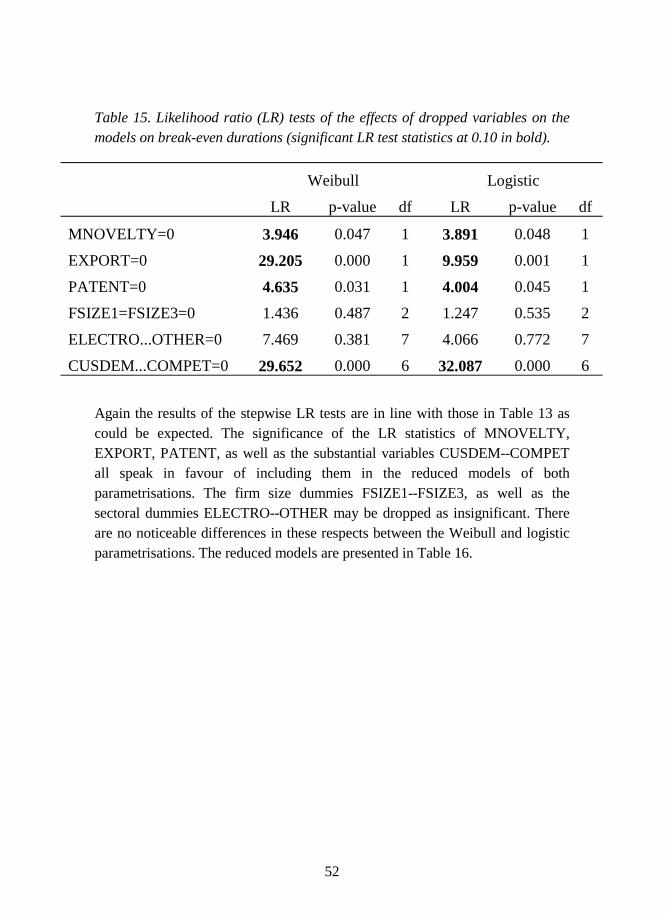
52
Table 15. Likelihood ratio (LR) tests of the effects of dropped variables on themodels on break-even durations (significant LR test statistics at 0.10 in bold).
Weibull Logistic
LR p-value df LR p-value df
MNOVELTY=0 3.946 0.047 1 3.891 0.048 1
EXPORT=0 29.205 0.000 1 9.959 0.001 1
PATENT=0 4.635 0.031 1 4.004 0.045 1
FSIZE1=FSIZE3=0 1.436 0.487 2 1.247 0.535 2
ELECTRO...OTHER=0 7.469 0.381 7 4.066 0.772 7
CUSDEM...COMPET=0 29.652 0.000 6 32.087 0.000 6
Again the results of the stepwise LR tests are in line with those in Table 13 ascould be expected. The significance of the LR statistics of MNOVELTY,EXPORT, PATENT, as well as the substantial variables CUSDEM--COMPETall speak in favour of including them in the reduced models of bothparametrisations. The firm size dummies FSIZE1--FSIZE3, as well as thesectoral dummies ELECTRO--OTHER may be dropped as insignificant. Thereare no noticeable differences in these respects between the Weibull and logisticparametrisations. The reduced models are presented in Table 16.
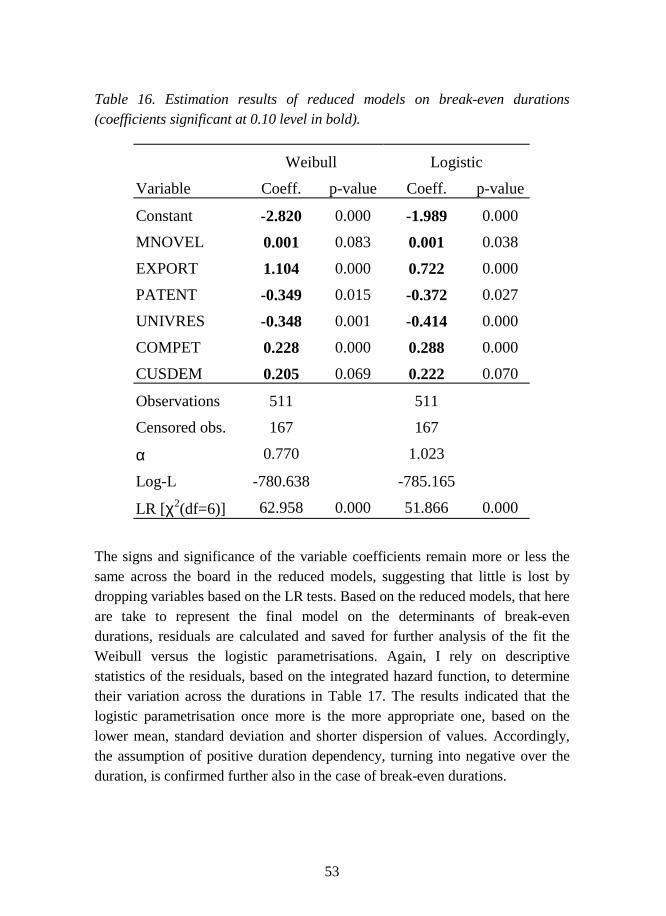
53
Table 16. Estimation results of reduced models on break-even durations(coefficients significant at 0.10 level in bold).
Weibull Logistic
Variable Coeff. p-value Coeff. p-value
Constant -2.820 0.000 -1.989 0.000
MNOVEL 0.001 0.083 0.001 0.038
EXPORT 1.104 0.000 0.722 0.000
PATENT -0.349 0.015 -0.372 0.027
UNIVRES -0.348 0.001 -0.414 0.000
COMPET 0.228 0.000 0.288 0.000
CUSDEM 0.205 0.069 0.222 0.070
Observations 511 511
Censored obs. 167 167
α 0.770 1.023
Log-L -780.638 -785.165
LR [χ2(df=6)] 62.958 0.000 51.866 0.000
The signs and significance of the variable coefficients remain more or less thesame across the board in the reduced models, suggesting that little is lost bydropping variables based on the LR tests. Based on the reduced models, that hereare take to represent the final model on the determinants of break-evendurations, residuals are calculated and saved for further analysis of the fit theWeibull versus the logistic parametrisations. Again, I rely on descriptivestatistics of the residuals, based on the integrated hazard function, to determinetheir variation across the durations in Table 17. The results indicated that thelogistic parametrisation once more is the more appropriate one, based on thelower mean, standard deviation and shorter dispersion of values. Accordingly,the assumption of positive duration dependency, turning into negative over theduration, is confirmed further also in the case of break-even durations.

54
Table 17. Descriptive statistics of residual of the reduced models on break-evendurations.
Integrated hazard Mean Std. Dev. Min. Max.
Weibull 0.688 0.645 0.018 4.918
Logistic 0.664 0.531 0.009 2.867

55
5. A synthesising discussion
5.1 The nature of commercialisation and break-evendurations
The purpose of this paper has been to empirically investigate the relationshipsbetween different types of sources of innovations and two specific dimensions ofsuccessful innovations. The first dimension captures firms' ability to achievefirst mower advantages through shorter commercialisation times. The seconddimension captures the commercial success of innovations through theirpotential to return positive cash flows quickly, once they have been introducedto the market. The point of departure was that the assimilation of differentsources of innovation constitutes a necessary condition for achieving first moweradvantages and commercial success on the market. The empirical analysis drawson a survey of some 600 innovations developed in various manufacturingindustries in Finland during the 1980s and 1990s. The data is applied to durationanalysis, an econometric technique for modelling the length of durations ofparticular states. An important issue in this context was to control for sources ofheterogeneity across innovations by their different characteristics, the nature ofthe commercialising firm, and sectors of origin, that moderate the relationshipsbetween different sources of innovations and the durations. Duration analysisalso incorporates censored dependent variables in cases where the durationswere ongoing at the time of data collection.
A first observation is that both commercialisation and break-even durations aresurprisingly short with a mean of 3.5 years, and 2.3 years respectively. Anassessment of how these results compare to previous studies is difficult due tothe use of incompatible definitions and measurements of durations andinnovations. Nonetheless, it seems fair to conclude that firms face relativelynarrow 'windows of opportunity' in this respect, and need to react swiftly oncethey emerge. This type of conclusion also appears to be in line with observationson the changing nature of competition due to developments in ICT, as well asglobalisation, and the related reduction in product life cycles (Cooper 2001).Commercialisation and break-even durations also appear to be related, sinceshorter commercialisation times correlate significantly with shorter break-eventimes, and vice versa. This is in line with the results in Ali et al. (1995), and
56
indicates that firms are able to achieve shorter commercialisation times without'cutting corners' during the development of innovations from the viewpoint oftheir commercial success in the market. Despite this correlation, the predictedvalues of commercialisation durations had no apparent effect on the length ofbreak-even durations in the estimations, and were hence omitted.
One important issue is the dependency of durations on time, since it reveals thenature of the durations and suggests a relevant parametrisation of the durationmodels. The skeweness of both commercialisation and break-even durationssuggests that the majority of innovations reach the market and break even withincreasing probabilities over time up until a certain threshold in elapsed years.After this threshold, inhibiting forces appear to set in, which prolong thedurations and decrease the probability of commercialisation and break-even.This shift from positive to negative duration dependency was also confirmed,based on Kaplan-Meier estimates and an analysis of the variability of theresiduals over the durations.
The analysis of model specification suggested that a logistic parametrisation wasmore appropriate in both cases. In the case of the commercialisation durations,this result is somewhat surprising given that all innovations included have beencommercialised in the markets, with the probability of commercialisationeventually reaching unity. Nonetheless, a few very long durations at the tail ofthe distribution, after the removal of evident outliers, is apt to place some bias infavour of negative duration dependency (Allison 1984). In the case of the break-even durations, the distribution shows less variability in this respect. Thereversal from positive to negative duration dependency can hence be givengreater analytical content. It might reflect the dynamics of competition on themarkets in cases where the prospects of an innovation to generate a positive cashflow dampens if it does not achieve a first mower advantage due to prolongedcommercialisation times and the emergence of imitative innovations.
5.2 Sources of heterogeneity and strategic trade-offs
The issue of heterogeneity across innovations was acknowledged byincorporating dummy control variables in the models to moderate between thenature of innovations and their durations. At the same time, they capture various
57
trade-offs that are manifested in the strategic choices that firms face duringinnovation. In the case of commercialisation durations, high complexityinnovations are associated with prolonged durations, while the familiarity of theinnovations to the firms had an inconclusive effect. With respect to thecomplexity of innovations, the results are in line with previous research(compare to Griffin 1993; Ali et al. 1995; Karlsson & Åhlström 1999). Hence,there is an evident trade-off between becoming engaged in high complexityinnovations, and the aspirations of firms to be first-mowers in the market. Theeffect of the familiarity of the innovations to the firms conflict with previousresults (compare to Maidique & Zirger 1984; Schoonhoven et al. 1990). Thismight suggest that there is also a set of moderating variables to be included inanalysing this relationship in greater detail - a possible source of unobservedheterogeneity that remains outside the scope of this paper due to non-availabilityof relevant data. As suggested by McDonough & Barczak (1992), firms differ inthe problem-solving orientation, or absorptive capability, to assimilate lessfamiliar technologies (Cohen & Levinthal 1990). Familiarity can also be definedin many different ways, ranging from technological familiarity as in this paper,to the degree to which the innovation fits into existing synergies in R&D,production and marketing between various product lines within the firm(Danneels & Kleinschmidt 2001).
The effects of the size of the commercialising firm and the sector of origin ofinnovations on the commercialisation durations are negligible. According to thedescriptive analysis the largest firms with more than 1000 employees appearedto be associated with longer mean durations. Based on insignificant p-values ofthe coefficients and stepwise LR statistics tests, the variables on firm size werenonetheless dropped from the reduced models as irrelevant. Contrary to what issuggested by Griffin (1993) and Ali et al. (1995), among others, more R&Dresources, which assumedly comes with larger firm size, does not enhance firms'ability to reduce commercialisation times. However, the origin of innovations indifferent sectors differentiated between mean commercialisation durations in thesense that innovations originating in sectors characterise by higher R&D-intensities had longer durations compared to those in the less R&D-intensivesectors. The underlying assumption here was that different sectors capture thecharacteristics of the knowledge base that firms draw upon, as well as thetechnological opportunities, nature of markets and competition that they face(Malerba & Orsenigo 1997; Marsili 2001). In the duration analysis the only
58
significant sectoral dummy variables were those capturing innovationsoriginating from the chemicals and foodstuffs sectors. In the chemicals sector,innovations face prolonged durations primarily due to stringent requirements forclinical research prior to commercialisation (Gambardella 1995). In thefoodstuffs industry, short product life cycles and price competition are probablythe main factors that enforce shorten commercialisation durations (Palmberg2001).
Since break-even durations capture a different dimension of successfulinnovations, different control dummy variables were included. In this context,the degree of novelty of innovations to the markets appears to shorten break-even durations as expected, although the results are inconclusive. This resulthence offers some further confirmation to the relationships, discussed above,between commercialisation and break-even durations by suggesting that a first-mower advantage will also generate positive cash flow more quickly. The effectsof exported and patented innovations are much clearer, due to the higher level ofsignificance of the related coefficients. As expected, an exported innovation cantake advantage of a larger market that evidently enhances the possibilities toachieve a positive cash flow quickly. The prolonging effects of patentedinnovations on break-even durations is surprising, given that stronger propertyrights over the innovation should block the entry of rival imitative innovations,and thereby increase the prospects of generating a positive cash flow quickly(Levin et al. 1987). The appropriate interpretation of this result instead appearsto be that patented innovations involve more demanding development work dueto the complexity and novelty of the underlying technologies, with theprolonging effect.
The size of the commercialising firm and the sector of origin of the innovationshave no apparent effect on the break-even durations, and were hence droppedfrom the reduced models following stepwise LR tests. Despite this the result isinteresting since it suggests that the commercial success of innovations is notdependent on the particular firm size and sectoral setting wherein innovationsare developed. In the case of firm size, one might easily imagine that large firmshave greater marketing resources that would shorten break-even times. Largerfirms are also typically incumbents in the markets, with well-developedcomplementary assets in terms of supplier, retailer and customer relationshipsthat should enhance the saleability of new innovations (Teece 1986). On the

59
other hand, smaller firms might show greater flexibility in response todevelopments in the markets, and may be more focused on particular marketniches where the potential to extend sales are greater. In the case of the sector oforigin of the innovations, the result goes against common assumptions thatcertain R&D-intensive industries provide greater scope for commercial successcompared to the more traditional industries characterised by technologicalmaturity and saturated markets...at least in a short run perspective (compare toPalmberg 2001).
5.3 Sources of innovations, commercialisation andbreak-even durations
The substantial variables capturing the different sources of innovations werederived using a principal component analysis (PCA) on the original set ofvariables on the origin of innovations and the importance assigned to differentcollaborative partners during innovation (Palmberg 2002). The PCA singled outsix different sources of innovations that were related to the chain-linked modelof innovation for analytical purposes. They capture sources related to customerdemand and market niche, collaboration with universities and researchorganisations, scientific breakthrough and new technologies adding to thegeneral pool of knowledge underlying innovation, collaboration with consultantsand suppliers, regulations and standards, as well as competitive pressure due toprice competition and rival innovations. The related variables were included inthe modelling of commercialisation and break-even durations on an explorativebasis.
An important general result is that the effects of different sources of innovationscome out as significant based on p-values for three out of six variablecoefficients, as well as stepwise LR tests. Hence, different sources ofinnovations are significant in conditioning firms' ability to shortencommercialisation and break-even durations, even when the effects of observedheterogeneity are accounted for. Conversely, this underlines the starting point ofthis paper in the diversity in the sources of innovations that cut across both firmand sectoral boundaries. Another general result is the fact that different sourceshave similar effects on commercialisation and break-even durations, with someexceptions. This further confirms the discussion above about the relationships
60
between commercialisation and break-even durations, and their jointcontribution to the definition of successful innovation. Moreover, the resultsremain intact irrespective of the choice of model parametrisation, and thusappear to be robust.
The importance of innovation in line with customer demand for successfulinnovation is a key result of most previous studies, whatever definition ofsuccess is applied (compare to the reviews in Cobbenhagen 2000; Cooper 2001).This result gets further confirmation in this paper, with some modification.Sources of innovations related to customer demand and market nichesignificantly shorten commercialisation durations, implying that customeroriented innovations have a higher probability of reaching the market quickly. Asimilar interpretation seems to be valid with respect to break-even durations,even though the related coefficient loses some of it's significance in the reducedmodel. A parallel can here be drawn to the chain-linked model of innovation,and it's emphasis on continuous feedback from customers as the future users ofinnovations throughout the innovation process (Kline & Rosenberg 1986).Moreover, the importance of competent lead users as sources of innovation andtheir success is well documented, among others by von Hippel (1988) andEliasson (1995). What remains unclear in this paper is the exact nature andcontent of customer orientation, which might range from in-house marketanalysis and short-term interactions with customers, to long-term durablecollaboration.
An especially robust result is the highly significant but opposite effect of sourcesof innovations related to collaboration with universities and researchorganisations. Hence, while collaborative research with the universities orresearch organisations open up new opportunities to innovate, the consequencesare prolonged commercialisation and break-even times of innovations. Thisresult is nonetheless intuitive to the degree that complementary research at theuniversities or research organisations reflects science-based innovation andhigher R&D expenditures, which assumedly prolong both durations (data onfirms' investments in R&D was not available for this study). The result alsospeak in favour of making an analytical distinction between the success ofinnovations in the short and long run. Clearly, a science-based innovation,characterised by prolonged commercialisation and break-even times, mightnonetheless be highly successful in the longer run due to accumulated monopoly

61
rents, once a significant market position is reached - a new breakthroughpharmaceutical is an obvious example of this.
Apart from the similar effects of customer orientation and science-basedinnovation on both durations, an important difference is that scientificbreakthroughs and new technologies prolong commercialisation durations, whilethere is no corresponding effect on the break-even durations. Despite theapplication of PCA to single out sets of distinct types of sources of innovations,an intuitive interpretation is that the related variables likewise capture science-based innovations with similar consequences for commercialisation times.However, with reference to the chain-linked model, these types of sources ofinnovations relate to the general pool of knowledge available to all firms in aparticular sector, whereby they will not acquire any one innovation as a uniquesource of commercial success. Therefore, they will not distinguish betweendifferent lengths of break-even durations. In this context, moderating variablescapturing firms different absorptive capabilities could again extend the analysisfurther in an interesting direction (compare to Cohen & Levinthal 1990).
Finally, an interesting result is the significant effect of variables capturingcompetitive pressure as a source of innovations in shortening break-evendurations. Several interpretations are possible here. One interpretation could bethat the presence of competitive threats increases firms sensitivity to developingcomplementary assets in the upstream and downstream markets. Thesecomplementary assets might include establishing close relationships withsuppliers, retailers and customers, which fend off price competition and rivalinnovations. They might thus enable innovations to break-even quickly despiteweaker appropriability conditions (compare to Teece 1986). On the other hand,competitive pressure might reflect depleted technological opportunities andsaturated markets, as suggested earlier in this paper, and hence point towards theprevalence of different types of innovations in competitive sectors. Induced bycompetition, firms probably have greater incentives to innovate incrementally,whereby lesser R&D expenditures and shorter commercialisation times are alsoreflected in shorter break-even times.

62
5.4 Limitations related to the definition of successfulinnovations
Before concluding the paper, a discussion on the limitations of the analysisundertaken here is warranted, which should accompany the drawing ofmanagerial and policy implications from the findings. At this point I have toreturn to well-charted waters, since most of these limitations are due todifficulties in defining successful innovations. I argue that this paper advancesthe issue due to the uniqueness of the data at hand, as well as the application ofrelatively subjective definitions of success through the measuredcommercialisation and break-even times of innovations. Nonetheless, a firstlimitation stressed repeatedly in this paper, is that these definitions only capturetwo specific dimensions of successful innovation. Even thoughcommercialisation and break-even durations evidently are related, and thusjointly contribute to success, the conceptual problem in this context is that therelationship between the durations, market shares, profitability and growth at thefirm level is unclear. In the relevant literature, there is empirical evidence bothfor and against such a relationship, which obviously would be important toestablish since the ultimate goal of innovation is sustained firm profitability(Lambert & Slater 1999). This is also a direction in which an extension of theanalysis in this paper could go, given that financial data on the firm level couldbe integrated with data on individual innovations in a sensible way.
The relationship between commercialisation and break-even durations ofinnovations, and the profitability of firms, also highlights the analyticalrelevance of distinguishing between success in the short term and long term, ashinted already above. In this paper, my emphasis is on the success of innovationsin the short term, by their ability to achieve a first mower advantage throughshorter commercialisation times, and commercial success through generating apositive cash flow quickly. Furthermore, the difference between the success ofinnovations is one of degree, due to the focus on commercialised innovationsand the particular methods used for their identification that might haveintroduced a survival bias. Accordingly, is seems clear that the interpretation ofthe effects of the different explanatory variables on the durations also have to beread in this light. One such interpretation concerns the prolonging effects of thecomplexity of innovations, their patentability, and resort to collaboration withuniversities and research organisations during their development. In all these

63
cases, firms might have to forego advantages of being first in the markets, andachieving commercial success quickly with their innovations, with the option ofinstead creating a sustained competitive advantage in their market in the longerterm. The literature is rich in examples of science-based, radical, innovationswith disruptive effects for competing firms and whole industries (compare toTushman & Anderson 1986). Related to this is also the question ofappropriability, in so far as quick success comes at the cost of not being able tofend off competitors, appropriate profits and sustain positive cash flows (Levinet al. 1987).
Further limitations relate to specific definitions used in this paper. Theassumption made that shorter commercialisation reflects firms ability to achievea first mower advantage is open for scrutiny, despite the fact that close to 80percent of all innovations were considered new to the global markets by therespondents. Moreover, imitative innovation might also be successful for variousother reasons, the primary one being that excessive risks might be avoided(Freeman & Soete 1997). It also seems clear that the pros and cons of differentcommercialisation strategies might vary over the industry life cycle, or by theoverall position of firms in their markets. In fact, this issue relates back to alarger theoretical discussion on first mower-advantages in the strategicmanagement literature, a proper review of which is outside the scope of thispaper (Lieberman & Montgomery 1988; compare also to Kerin et al. 1992;Robinson et al. 1992). While this issue is an obvious point for further research, itis sufficient to state here that my measure of commercialisation times can merelyfunction as a rough proxy for first mower advantages within the confines of theparticular market niche that the innovation is intended to fill.
Finally, the definition of break-even is subject to the assumption that the point ofbreak-even captures the point in time when the innovation started to generate apositive cash flow, rather than the point in time when accumulated positive cashflows exceeded accumulated investments throughout the innovation process.Even though the results speak in favour of the former definition, there might bedeviations in the interpretations of the respondents that affect the results.Therefore, a further avenue of future research would be to complement the dataon the durations with data on cumulative investments and sales at the productlevel to check for consistency - an ambitious task requiring close collaborationwith the firms.

64
5.5 Policy implications
Based on the literature review and data analysed in this paper, andacknowledging the limitations discussed above, the following four policyimplications might be drawn. First of all, it is clear that the success ofinnovations is a multi-faceted issue that needs careful consideration from apolicy viewpoint. Although this paper has approached the issue from twospecific definitions of successful innovations, it might be justified to set policygoals by a range of other definitions of success, and related indicators. Theliterature reviewed here has suggested many different ways in which firms mightsucceed with their innovations, ranging from their technical novelty, sales ormarket shares, and their deviance from the financial break-even, to thetimeliness of innovation processes, as well as to their commercialisation andbreak-even times as done in this paper. Likewise, firms are engaged in manydifferent innovation processes simultaneously, whereby the nature and strengthof the relationships between the chosen indicators and long-term profitabilityand growth at the firm level are fuzzy.
The main point to be made in this context is to propagate for a better awarenessof the multi-faceted nature of the success of innovations in designing policiesand setting objectives. Accordingly, one might consider different types of policyschemes for achieving different types of success, depending on the objectives.For example, if the objective is to increase the technical novelty of innovationswith the purpose of enhancing spillovers, policies promoting networkingthroughout the innovation process might be appropriate. On the other hand, ifthe objectives are related to timeliness, or shorter commercialisation and break-even times, a more viable option might be the fostering of user-producerinteraction, as well as the provision of complementary R&D and other resourcesto speed up the process. Generally speaking, it would seem appropriate to beclear about the policy objectives and the underlying policy choices, sincedifferent types of success might also conflict with each other in theircontribution to the long-term firm profitability and growth. A policy relevantextension of this study would be an attempt to map, in greater detail, the effectsof different types of policy options, for example different types of R&D fundingschemes, on different indicators of the success of innovations.

65
When turning to the empirical results, a second policy implication relates toissues of the timing of policy intervention. Even though it is difficult to judge‘how quick is quick’ due to the lack of comparable results on the durations ofinnovations, I suggested that both the mean commercialisation and break-evendurations are short. Innovation processes unfold rapidly following theidentification of a market need and the point in time when the basic idea wasvoiced within the firm, to commercialisation, and onward towards generating apositive cash flow. Given that firms thereby also face ‘narrow windows ofopportunities’ to innovate, policymakers likewise face ‘narrow windows ofopportunities’ to promote innovations. Thus, this is another viewpoint thatwarrants proper attention in policy design. One direct and concrete consequencewould be to streamline decision-making in line with the need for speed duringinnovation. Another issue relates to the identification of the appropriate point intime during the innovation process, at which policy intervention of a specifickind has the greatest effect. Firms will obviously face different bottlenecks andproblems during the invention stage, compared to the design, testing productionor distribution stages of a typical innovation process (compare to the discussionof the chain-linked model of innovation in section 2.1). In addition, there areimportant sectoral differences in the commercialisation and break-even durationsdue to the different nature of technologies, markets and competition. Thesesectoral differences should also be acknowledged and taken into account.
Thirdly, and related to the first point, the results clearly point towards certaintrade-offs between the nature of innovations and their durations. From a policyviewpoint, these trade-offs translate into different choices that a policy makermight have to make in the design of policy. Clearly, an objective to decreasecommercialisation times is more difficult in the case of complex innovations,which involve the combination of different technologies and relatedcomponents. Similarly, in so far as patented innovations at the technologicalfrontier require more development effort, there are poorer prospects for policiesaiming at the speeding up of break-even times. Thus, the question here is reallyone of trading different choices against each other, and it underlines further themulti-faceted nature of the success of innovations. Clearly, innovations differgreatly in terms of the underlying knowledge base, both in observable andunobservable ways. Accordingly, there is a strong case for tailored policyintervention, not only due to sectoral differences in technologies, markets and
66
the nature of competition, but also due to qualitative differences acrossinnovations within sectors and firms.
The fourth, and final, policy implication derives from the signs and significanceof the substantial variables capturing the effects of different sources ofinnovations on the durations. From the results, it is possible to suggest bestpractices based on the profile of innovation processes that achieve fastcommercialisation and break-even times. In the case of commercialisationdurations, the profile is clearly one where innovations emerge throughcollaboration with customers in respond to demand in the market place.However, while this result confirms a range of other studies on successfulinnovation, more insights on the precise nature of customer involvement in theinnovation process would be required in order to draw specific policyimplication – an issue that goes beyond the scope of this paper. In the case ofbreak-even durations, the profile is slightly different. In addition to collaborationwith customers, innovations induced by price competition and rival innovations,in a competitive environment, capture ‘best practice’ profiles of innovationprocesses. This is an interesting result, since it suggests that a policy objective toachieve rapid generation of a positive cash flow is viable also in sectorscharacterised by saturated markets and depleted technological opportunities.Successful innovation, by this indicator, is not only confined to the high-techsectors where technological opportunities are greater.
67
6. ConclusionsEmpirical research on successful innovations is characterised by the applicationof a range of different definitions of success, of which firms' abilities to shortenthe commercialisation and break-even times of innovations are two that are oftendiscussed. In this paper, I elaborate further on these specific definitions ofsuccessful innovations by applying duration analysis for modelling therelationships between different sources of innovations, and thecommercialisation and break-even durations as measures of first moveradvantages, as well as the commercial success of innovations.
Both the commercialisation and the break-even durations are surprisingly short,although comparisons to previous studies are made difficult by incompatibledefinition and measurement of innovations and durations. The results alsosuggest that there is an association between shorter commercialisation andbreak-even durations, even though this relationship is moderated by variouscharacteristics of innovations and different sources of innovations. Furthermore,the results largely confirm previous research on the effects of different sourcesof heterogeneity on the durations, due to different characteristics of innovations,which also introduce different strategic trade-offs to firms during innovation. Inthe case of commercialisation times, high complexity of innovations has aprolonging effect, along with their origin in the R&D-intensive chemicals sector.Innovations new to the firm surprisingly shorten the durations. In the case ofbreak-even durations, market novelty and exported innovations shorten theirdurations, while patented innovations prolong them.
By and large, the effects of firm size and sector of origin of innovations on thedurations appear as far less significant than different sources of innovations.This underlines the importance of incorporating the diversity in sources ofinnovations in the analysis of successful innovation, which cuts across both firmsize and sectoral boundaries. In this context, innovations related to customerdemand and market niche shorten both the commercialisation and the break-even durations, and thus appear as crucial for the success of innovations. Incontrast, science-based innovations are characterised by longer durations, eventhough the effects on the success of innovations in the longer run might besubject to different dynamics not accounted for in this paper. Moreover,competitive markets are associated with shorter break-even durations, suggesting

68
that the successful innovations also emerge under conditions of depletedtechnological opportunities and saturated markets characterised by fierce pricecompetition. Nonetheless, the results are subject to a number of limitationsrelated to differences in success in the short-term and long-term, as well as to thedefinition of successful innovation through the commercialisation and break-even durations.
69
ReferencesAli, A., Krapfel, R. & Labahn, D. (1995). Product innovativeness and entrystrategy: impact on cycle time and break-even time. Journal of ProductInnovation Management, 12, 54–69.
Allison, P. (1984). Event history analysis: regression for longitudinal event data.Sage Publications, Newbury Park.
Cesaratto, S. & Mangano, S. (1993). Technological profiles and economicperformance in Italian manufacturing sector. Economics of Innovation and NewTechnology.
Clark, K. & Fujimoto, T. (1991). Product development performance. HarvardBusiness School Press, Cambridge MA.
Cobbenhagen, J. (2000). Successful innovation. Towards a new theory for themanagement of small and medium-sized enterprises. Edward Elgar, Cheltenham,UK.
Cohen, W. & Levinthal, D. (1990). Absorptive capability: a new perspective onlearning and innovation. Administrative Science Quarterly, vol. 35, issue 1, 128–152.
Cooper, G. (1979). The dimensions of industrial new product success andfailure. Journal of Marketing, 43, 993–1003.
Cooper, G. (1980). Project NewProd: factors in new product success. EuropeanJournal of Marketing, 14, 277–292.
Cooper, R. (2001). Winning at new products - accelerating the process from ideato launch. Perseus Publishing, Cambridge MA.
Cooper, G. & Kleinschimdt, E. (1987). What makes a new product a winner:success factors at the project level. R&D Management, 17(3), 175–189.

70
Cooper, G. & Kleinschmidt, E. (1995). Benchmarking the firm's critical successfactors in new product development. Journal of Product InnovationManagement, 12, 374–391.
Daneels, E & Kleinschmidt, E. (2001). Product innovativeness from the firm’sperspective: its dimensions and their relation with project selection andperformance. Research Policy 18, 357-373.
Eliasson, G. (1995). Teknologigeneratorer eller nationellt prestigeprojekt(Technology generators or national prestige projects?). City University Press,Ystad.
Eliasson, G. & Eliasson, Å. (1996). The biotechnology competence bloc. Revued'Economic Industrielle, 78(4), 7–23.
Freeman, C. (1994). The economics of technological change: a critical survey.Cambridge Journal of Economics, vol. 18, 463–514.
Freeman, C. & Soete, L. (1997). The economics of industrial innovation. PinterPublishers, London.
Gambardella, A. (1995). Science and innovation: the US pharmaceuticalsindustry in the 1990s. Cambridge University Press, Cambridge UK.
Griffin, A. (1993). Metrics for measuring product development cycle time.Journal of Product Innovation Management, 10, 112–125.
Hall, P. (1994). Innovation, economics and evolution: theoretical perspectiveson changing technology in economic systems. Harvester, Wheatsheaf.
Harabi, N. (1995). Sources of technical progress: empirical evidence from Swissindustry. Economics of Innovation and New Technology, vol. 14, 67–76.
Hatzichronoglou, T. (1997). Revision of the high-technology sector and productclassification. OECD Working Paper Series 1997/2, Paris.

71
Karlsson, C. & Åhlström, P. (1999). Technological level and productdevelopment cycle time. Journal of Product Innovation Management, 16, 352–362.
Kerin, R., Varadarajan, R. & Peterson, R. (1992). First mower advantage: asynthesis, conceptual framework, and research propositions. Journal ofMarketing, vol. 56, 33–52.
Kiefer, N. (1988). Economic duration data and hazard functions. Journal ofEconomic Literature, vol. XXVI, 646–679.
Kleinknecht, A. & Bains, D. (1993). New concepts in innovation outputmeasurement. The Macmillan Press, Houndsmill UK.
Kleinknecht, A., van Montfort, K. & Brouwer, E. (2002). The non-trivial choicebetween innovation indicators. Economics of Innovation and New Technology,vol. 11(2), 109–121.
Klevorick, A., Levin, R., Nelson, R. & Winter, S. (1995). On the sources ofinterindustry differences in technological opportunities. Research Policy, 24,185–205.
Kline, S. & Rosenberg, N. (1986). An overview of the process of innovation. In:Landau, G. & Rosenberg, N. (eds.) The positive sum strategy: harnessingtechnology for economic growth. National Academy Press, Washington.
Lambert, D. & Slater, S. (1999). First, fast, and on time: the path to success. Oris it? Journal of Product Innovation Management, 16: 427–438.
Lancaster, T. (1990). The econometric analysis of transition data. CambridgeUniversity Press, Cambridge UK.
Leiponen, A. (2001). Knowledge services in the Innovation System. ETLA B185.

72
Levin, R., Klevorick, A., Nelson, R. & Winter, S. (1987). Appropriating thereturns from industrial research and development. Brookings Paper onEconomic Activity, no. 3, 783–820.
Lieberman, M. & Montgomery, D. (1988). First-mower advantages. StrategicManagement Journal, 9, 41–58.
Maidique, M. & Zirger, B. (1984). A study of success and failure in productinnovation: the case of the US electronics industry. IEEE Transactions onEngineering Management, vol. EM-31, no. 4, 192–203.
Malerba, F. & Orsenigo, L. (1997). Technological regimes and sectoral patternsof innovative activities. Industrial and Corporate Change, Vol. 6, No. 1.
Marsili, O. (2001). On the anatomy and evolution of industries - technologicalchange and industrial dynamics. Edward Elgar Publishing.
McDonough, E. & Barczak, G. (1992). The effects of cognitive problem-solvingorientation and technological familiarity on faster new product development.Journal of Product Innovation Management, 9, 44–52.
Montoya-Weiss, M. & Calantone, R. (1994). Determinants of new productperformance: a review and meta-analysis. Journal of Product InnovationManagement, 11, 397–417.
Niininen, P. & Saarinen, J. (2000). Innovations and the success of firms. VTTGroup for Technology Studies Working Paper Series No. 53/00.
Palmberg, C. (2001). Sectoral patterns of innovation and competencerequirements: a closer look at the low-tech industries. Sitra Report Series, no. 8.
Palmberg, C. (2002). The sources, sectoral patterns and nature of innovation -looking behind R&D-intensities. Kungliga Tekniska Högskolan,Forskningsrapport TRITA-IEO-R 2002:03.

73
Palmberg, C. (2002a). Technological systems and competent procurers - thetransformation of Nokia and the Finnish telecom industry revisited?Telecommunications Policy 26, 129–148.
Palmberg, C. (2002b). The many faces of absorptive capability in low-techindustries: the case of glue-lam timber and foodstuffs. Paper presented as theDRUID 2002 conference on "Industrial dynamics of the new and old economy -who is embracing whom?".
Palmberg, C., Leppälahti, A., Lemola, T. & Toivanen, H. (1999). Towards abetter understanding of industrial renewal in Finland - a new perspective. VTTGroup for Technology Studies Working Paper Series, No. 41/99.
Patel, P. (2000). Technological indicators of performance. In: Tidd, J. (ed.)From knowledge management to strategic competence – measuringtechnological, market and organisational innovation. Imperial College Press,London.
Pavitt, K. (1984). Sectoral patterns of technical change: towards a taxonomy anda theory, Research Policy, 13, 343–373.
Pavitt, K. (1998). Technologies, products and organization in the innovatingfirm: what Adam Smith tells us and Joseph Schumpeter doesn't. Industrial andCorporate Change, 7(3), 433–452.
Robinson, W., Fornell, C. & Sullivan, M. (1992). Are market pioneersintrinsically stronger than later entrants? Strategic Management Journal, vol. 13,609–624.
Rosenberg, N. (1982). Inside the black box: technology and economics.Cambridge University Press, Cambridge.
Rothwell, R. (1994). Industrial innovation: success, strategy, trends. In:Dodgson, M. & Rothwell, R. (eds.) Handbook of industrial innovation. ElgarEdward Cheltenham.

74
Rothwell, R., Freeman, C., Horsley, A., Jervis, A. B. & Townsend, J.(1974).SAPPHO updated: project SAPPHO phase II. Research Policy, 3, 258–291.
Santarelli, E. & Piergiovanni, R. (1996). Analyzing literature-based innovationoutput indicators: the Italian experience. Research Policy, 25, 689–711.
Schoonhoven, C., Eisenhardt, K. & Lyman, K. (1990). Speeding products tomarket: waiting time to first product introduction in new firms. AdministrativeScience Quarterly, 35, 177–207.
Statistics Finland. (2001). Tiedolla tietoyhteiskuntaan III.
Teece, D. (1986). Profiting from technological innovation: implications forintegration, collaboration, licensing and public policy. Research Policy, vol. 11,271–287.
Townsend, J., Henwood, F., Thomas, G., Pavitt, K. & Wyatt, S. (1981). Scienceand technology indicators for the UK - innovations in Britain since 1945. SPRUOccasional Paper, No. 16.
Tushman, M. & Anderson, P. (1986). Technological discontinuities andorganizational environments. Administrative Science Quarterly, 31, 439–465.
Utterback, J. (1994). Mastering the dynamics of innovation. Harvard BusinessSchool Press, Boston.
van den Berg, G. (2000). Duration models: specification, identification, andmultiple durations. In: Heckman, J. & Leamer, E. (eds.) Handbook ofEconometrics, vol. V. North Holland, Amsterdam.
von Hippel, E. (1988). The sources of innovation. Oxford University Press, NewYork.

Appendix 1: The principal componentanalysis
Principal component analysis (PCA) is a multivariate technique used to identifya smaller number of factors, or principal components, to represent relationshipsbetween correlated variables in a larger data set. As a rule of thumb, componentloadings above 0.5 are regarded as significant. Surrogate variables can be usedto represent each component in a regression to deal with collinearity problems ifall original variables are included in the model (Hair et al. 1992; Gujarati 1995).In the duration models the PCA is used to single out whichever two variablesthat receive the highest component loading to represent the underlying principalcomponent, that are taken to represent different sources of innovations. Theresult is presented below, with the two selected variables in bold (see Palmberg2002 for details).
Variables8 1 2 3 4 5 6
Scientific breakthrough 0.448 0.612New technologies 0.161 0.852Public program 0.612 0.117 0.212 0.119Market niche 0.750 0.136Customer demand 0.168 0.811Price competition 0.101 0.828Rival innovation 0.117 0.823 0.132Environmental issues 0.852Regulations, legislation 0.106 0.820Customers 0.553 0.111 0.483Suppliers 0.678 0.120 0.327Consultants 0.885 0.187Competitors 0.574 0.194 0.263Universities 0.187 0.794 0.101Research organisations 0.407 0.660 0.116 0.133
Cumulative 16% 31% 41% 50% 57% 63%
8 Since the universe of 'all' Finnish innovation is unknown, it has not been possible to motivate anduse weighted values of the variables in the principal component analysis.
1/1
ReferencesGujarati, D. (1995). Basic Econometrics. McGraw-Hill, New York.
Hair, J., Anderson, R., Tatham, R. & Black, W. (1992). Multivariate dataanalysis with readings. Prentice Hill, New Jersey.
Palmberg, C. (2002). The sources, sectoral patterns and nature of innovation -looking behind R&D-intensities. Kungliga Tekniska Högskolan,Forskningsrapport TRITAIEO-R 2002:03.
1/2

Appendix 2: Descriptive statistics ofexplanatory variables
Table A 2:1. Substantial variables common to all models.
Mean Std.Dev. Min. Max. n
UNIVRES 0.544 0.745 0 3 521
REGLEG 1.144 1.145 0 3 521
COMPET 1.248 1.062 0 3 521
CUSDEM 2.562 0.688 0 3 521
CONSUP 0.831 0.822 0 3 521
SCITECH 1.113 1.178 0 3 521
Table A 2:2. Control dummy variables for the model on commercialisationdurations.
Mean Std.Dev. Min. Max. n
FNOVEL 0.560 0.490 0 1 521
COMPLEX 0.428 0.495 0 1 521
Table A 2:3. Control dummy variables for the model on break-even durations.
Mean Std.Dev. Min. Max. n
MNOVEL 0.774 2.719 0 1 511
EXPORT 0.748 2.308 0 1 511
PATENT 0.539 1.023 0 1 511
2/1

Table A 2:4. Control dummy variables common to all models.
Mean Std.Dev. Min. Max. n
FSIZE1 0.176 0.382 0 1 521
FSIZE2 0.280 0.4492 0 1 521
FSIZE3 0.259 0.4382 0 1 521
ELECTRO 0.096 0.295 0 1 521
CHEM 0.092 0.289 0 1 521
INST 0.119 0.324 0 1 521
MACH 0.278 0.448 0 1 521
METAL 0.153 0.360 0 1 521
FOOD 0.081 0.272 0 1 521
FOREST 0.088 0.284 0 1 521
OTHER 0.073 0.260 0 1 521
2/2

3/ 1
Appendix 3: Stepwise models oncommercialisation and break-even
durations
Table A3:1. Weibull parametrisation of commercialisation durations.
Model 1 Model 2 Model 3 Model 4 Model 5Variable Coeff. p-value Coeff. p-value Coeff. p-value Coeff. p-value Coeff. p-value
Constant -1.608 0.000 -1.634 0.000 -1.473 0.000 -1.529 0.000 -1.194 0.000Control variables
FNOVEL 0.001 0.028 0.001 0.043 0.001 0.064 0.012 0.041COMPLEX -0.271 0.006 -0.259 0.008 -0.296 0.000 -0.388 0.000FSIZE1 0.072 0.527 0.088 0.431 0.138 0.218 0.106 0.327FSIZE3 0.054 0.593 0.053 0.604 0.130 0.150 0.490 0.960ELECTRO 0.015 0.925 -0.031 0.839 0.004 0.978 -0.016 0.911CHEM -0.449 0.000 -0.512 0.000 -0.478 0.000 -0.520 0.001INST 0.067 0.638 -0.048 0.725 0.051 0.719 0.013 0.918METAL -0.006 0.960 0.035 0.758 -0.017 0.873 0.058 0.958FOOD 0.274 0.091 0.329 0.038 0.275 0.082 0.263 0.114FOREST -0.114 0.315 -0.078 0.495 -0.150 0.177 -0.145 0.206OTHER -0.045 0.779 0.057 0.720 -0.049 0.757 -0.055 0.723
Substantial variablesUNIVRES -0.221 0.000 -0.256 0.000 -0.232 0.000 -0.250 0.000REGLEG -0.010 0.792 -0.005 0.882 -0.010 0.793 -0.022 0.558COMPET -0.083 0.835 -0.009 0.809 -0.018 0.642 -0.005 0.888CUSDEM 0.199 0.000 0.172 0.009 0.163 0.010 0.159 0.010CONSUP 0.061 0.210 0.087 0.086 0.081 0.118 0.077 0.132SCITECH -0.066 0.069 -0.090 0.009 -0.071 0.046 -0.076 0.029
Observations 521 521 521 521 521Censored obs. 32 32 32 32 32α 1.213 1.215 1.218 1.190 1.182Log-L -693.158 -695.434 -691.707 -700.342 -709.176LR [χ2]* 93.960 0.000 89.408 0.000 96.862 0.000 75.592 0.000 61.924 0.000
* The degrees of freedom vary depending on the number of dropped variables.
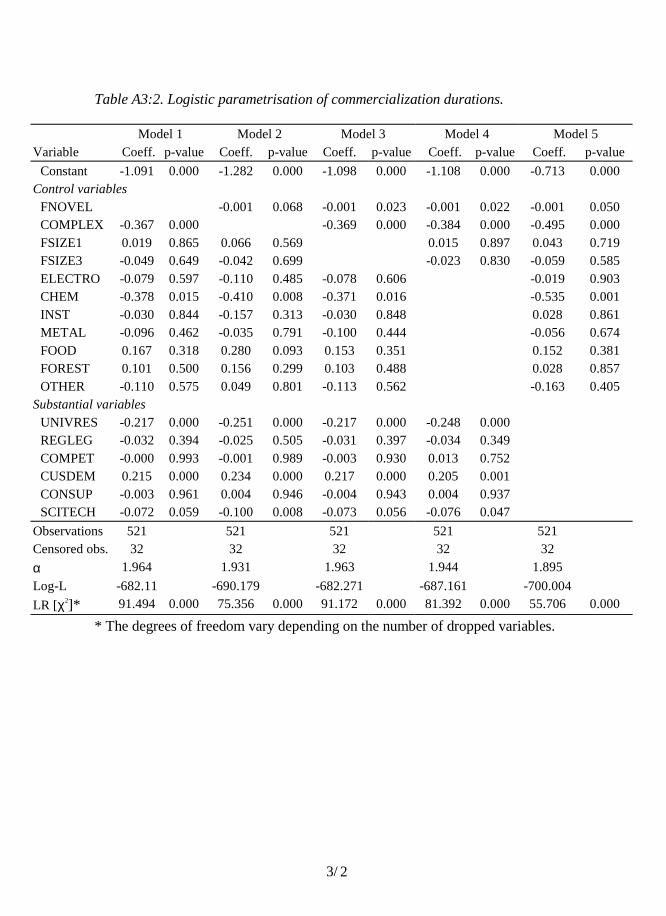
3/ 2
Table A3:2. Logistic parametrisation of commercialization durations.
Model 1 Model 2 Model 3 Model 4 Model 5Variable Coeff. p-value Coeff. p-value Coeff. p-value Coeff. p-value Coeff. p-value
Constant -1.091 0.000 -1.282 0.000 -1.098 0.000 -1.108 0.000 -0.713 0.000Control variables
FNOVEL -0.001 0.068 -0.001 0.023 -0.001 0.022 -0.001 0.050COMPLEX -0.367 0.000 -0.369 0.000 -0.384 0.000 -0.495 0.000FSIZE1 0.019 0.865 0.066 0.569 0.015 0.897 0.043 0.719FSIZE3 -0.049 0.649 -0.042 0.699 -0.023 0.830 -0.059 0.585ELECTRO -0.079 0.597 -0.110 0.485 -0.078 0.606 -0.019 0.903CHEM -0.378 0.015 -0.410 0.008 -0.371 0.016 -0.535 0.001INST -0.030 0.844 -0.157 0.313 -0.030 0.848 0.028 0.861METAL -0.096 0.462 -0.035 0.791 -0.100 0.444 -0.056 0.674FOOD 0.167 0.318 0.280 0.093 0.153 0.351 0.152 0.381FOREST 0.101 0.500 0.156 0.299 0.103 0.488 0.028 0.857OTHER -0.110 0.575 0.049 0.801 -0.113 0.562 -0.163 0.405
Substantial variablesUNIVRES -0.217 0.000 -0.251 0.000 -0.217 0.000 -0.248 0.000REGLEG -0.032 0.394 -0.025 0.505 -0.031 0.397 -0.034 0.349COMPET -0.000 0.993 -0.001 0.989 -0.003 0.930 0.013 0.752CUSDEM 0.215 0.000 0.234 0.000 0.217 0.000 0.205 0.001CONSUP -0.003 0.961 0.004 0.946 -0.004 0.943 0.004 0.937SCITECH -0.072 0.059 -0.100 0.008 -0.073 0.056 -0.076 0.047
Observations 521 521 521 521 521Censored obs. 32 32 32 32 32α 1.964 1.931 1.963 1.944 1.895Log-L -682.11 -690.179 -682.271 -687.161 -700.004LR [χ2]* 91.494 0.000 75.356 0.000 91.172 0.000 81.392 0.000 55.706 0.000
* The degrees of freedom vary depending on the number of dropped variables.

3/ 3
Table A3:3. Weibull parametrisation of break-even durations.
Model 1 Model 2 Model 3 Model 4 Model 5 Model 6Variable Coeff. p-value Coeff. p-value Coeff. p-value Coeff. p-value Coeff. p-value Coeff. p-value
Constant -2.996 0.000 -2.089 0.000 -2.959 0.000 -2.876 0.000 -2.783 0.000 -2.067 0.000Control variables
MNOVEL 0.001 0.056 0.001 0.130 0.001 0.089 0.001 0.063 0.001 0.056EXPORT 1.157 0.000 1.069 0.000 1.153 0.000 1.135 0.000 1.139 0.000PATENT -0.287 0.071 -0.151 0.339 -0.342 0.032 -0.331 0.024 -0.434 0.006FSIZE1 -0.186 0.405 -0.266 0.243 -0.228 0.314 -0.142 0.504 -0.103 0.652FSIZE3 -0.151 0.363 -0.091 0.579 -0.177 0.284 -0.132 0.417 -0.084 0.611ELECTRO -0.119 0.678 -0.181 0.511 -0.097 0.729 -0.185 0.507 -0.276 0.322CHEM -0.004 0.989 0.003 0.993 0.006 0.983 -0.036 0.902 -0.439 0.107INST 0.331 0.224 0.425 0.136 0.359 0.187 0.260 0.309 0.135 0.624METAL -0.134 0.580 -0.281 0.208 -0.149 0.539 -0.155 0.522 -0.107 0.646FOOD 0.359 0.211 -0.099 0.700 0.405 0.148 0.316 0.274 0.346 0.256FOREST -0.346 0.161 -0.383 0.136 -0.259 0.284 -0.347 0.164 -0.303 0.250OTHER -0.082 0.756 -0.179 0.516 -0.075 0.775 -0.138 0.602 -0.267 0.302
Substantial variablesUNIVRES -0.332 0.003 -0.315 0.006 -0.370 0.001 -0.327 0.004 -0.336 0.002REGLEG 0.037 0.591 0.053 0.438 0.052 0.448 0.039 0.555 0.007 0.916COMPET 0.232 0.000 0.256 0.000 0.242 0.000 0.222 0.000 0.226 0.000CUSDEM 0.259 0.022 0.233 0.042 0.223 0.053 0.228 0.046 0.225 0.048CONSUP 0.009 0.927 0.055 0.577 -0.006 0.947 0.001 0.993 -0.008 0.933SCITECH -0.054 0.428 -0.028 0.683 -0.063 0.357 -0.064 0.346 -0.060 0.355
Observations 511 511 511 511 511 511Censored obs. 167 167 167 167 167 167α 0.781 0.758 0.780 0.773 0.773 0.760Log-L -777.893 -790.52 -778.23 -776.63 -779.654 -790.746LR [χ2]* 68.448 0.000 43.194 0.000 67.774 0.000 70.974 0.000 64.926 0.000 42.742 0.000
* The degrees of freedom vary depending on the number of dropped variables.
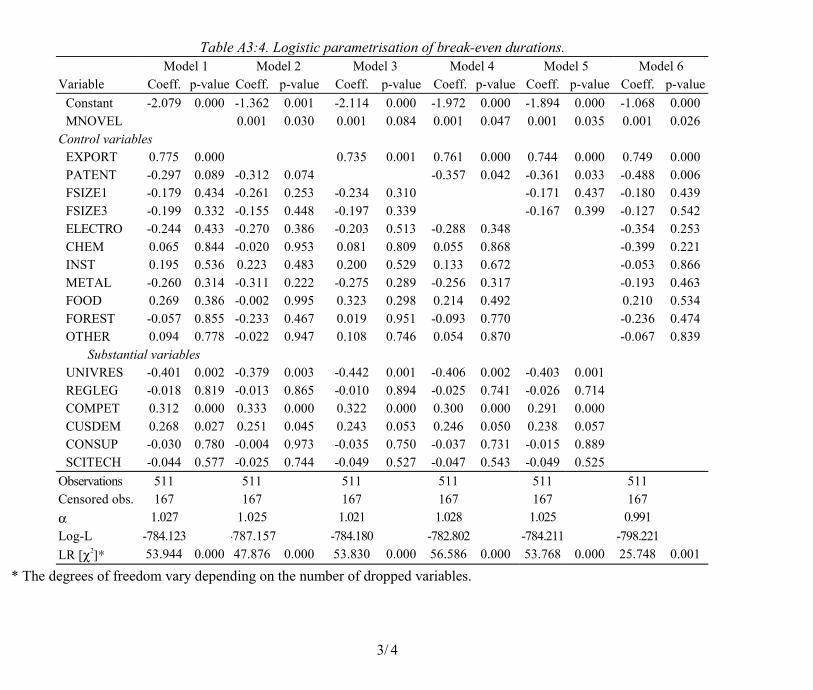
3/ 4
Table A3:4. Logistic parametrisation of break-even durations.Model 1 Model 2 Model 3 Model 4 Model 5 Model 6
Variable Coeff. p-value Coeff. p-value Coeff. p-value Coeff. p-value Coeff. p-value Coeff. p-valueConstant -2.079 0.000 -1.362 0.001 -2.114 0.000 -1.972 0.000 -1.894 0.000 -1.068 0.000MNOVEL 0.001 0.030 0.001 0.084 0.001 0.047 0.001 0.035 0.001 0.026
Control variablesEXPORT 0.775 0.000 0.735 0.001 0.761 0.000 0.744 0.000 0.749 0.000PATENT -0.297 0.089 -0.312 0.074 -0.357 0.042 -0.361 0.033 -0.488 0.006FSIZE1 -0.179 0.434 -0.261 0.253 -0.234 0.310 -0.171 0.437 -0.180 0.439FSIZE3 -0.199 0.332 -0.155 0.448 -0.197 0.339 -0.167 0.399 -0.127 0.542ELECTRO -0.244 0.433 -0.270 0.386 -0.203 0.513 -0.288 0.348 -0.354 0.253CHEM 0.065 0.844 -0.020 0.953 0.081 0.809 0.055 0.868 -0.399 0.221INST 0.195 0.536 0.223 0.483 0.200 0.529 0.133 0.672 -0.053 0.866METAL -0.260 0.314 -0.311 0.222 -0.275 0.289 -0.256 0.317 -0.193 0.463FOOD 0.269 0.386 -0.002 0.995 0.323 0.298 0.214 0.492 0.210 0.534FOREST -0.057 0.855 -0.233 0.467 0.019 0.951 -0.093 0.770 -0.236 0.474OTHER 0.094 0.778 -0.022 0.947 0.108 0.746 0.054 0.870 -0.067 0.839
Substantial variablesUNIVRES -0.401 0.002 -0.379 0.003 -0.442 0.001 -0.406 0.002 -0.403 0.001REGLEG -0.018 0.819 -0.013 0.865 -0.010 0.894 -0.025 0.741 -0.026 0.714COMPET 0.312 0.000 0.333 0.000 0.322 0.000 0.300 0.000 0.291 0.000CUSDEM 0.268 0.027 0.251 0.045 0.243 0.053 0.246 0.050 0.238 0.057CONSUP -0.030 0.780 -0.004 0.973 -0.035 0.750 -0.037 0.731 -0.015 0.889SCITECH -0.044 0.577 -0.025 0.744 -0.049 0.527 -0.047 0.543 -0.049 0.525
Observations 511 511 511 511 511 511Censored obs. 167 167 167 167 167 167α 1.027 1.025 1.021 1.028 1.025 0.991Log-L -784.123 -787.157 -784.180 -782.802 -784.211 -798.221LR [χ2]* 53.944 0.000 47.876 0.000 53.830 0.000 56.586 0.000 53.768 0.000 25.748 0.001
* The degrees of freedom vary depending on the number of dropped variables.

Published by Series title, number andreport code of publication
VTT Publications 486VTT–PUBS–486
Author(s)Palmberg, Christopher
Title
Successful innovationThe determinants of commercialisation and break-even times ofinnovationsAbstractSuccessful innovation is typically defined at the firm level where market shares,productivity, or profitability is taken as an indicator of success. Nonetheless, firms aresimultaneously involved in many innovation development projects with varying success.This paper defines the success of innovations through the time taken for the innovationsto reach commercialisation and the point of break-even, to investigate the relationshipsbetween the sources and success of innovations. The paper uses a database of Finnishinnovations commercialised during the 1980s and 1990s, and contributes to previousresearch by covering a range of different types of innovations from various industries, andby applying econometric duration analysis. The results carry implications for themanagement of innovation and the design of policy from the viewpoint of trade-offsbetween the timeliness, objective and outcomes of innovation.
Keywordsinnovation sources, successful innovation, duration analysis
Activity unitVTT Technology Studies, Tekniikantie 12, P.O.Box 10021, FIN–02044 VTT, Finland
ISBN Project number951–38–6025–6 (soft back ed.)951–38–6026–4 (URL:http://www.inf.vtt.fi/pdf/ )
01SU00029
Date Language Pages PriceDecember 2002 English 74 p.+ app. 8 p. B
Name of project Commissioned bySfinno 2001 National Technology Agency (Tekes)
Series title and ISSN Sold byVTT Publications1235–0621 (soft back ed.)1455–0849 (URL: http://www.inf.vtt.fi/pdf/)
VTT Information ServiceP.O.Box 2000, FIN–02044 VTT, FinlandPhone internat. +358 9 456 4404Fax +358 9 456 4374
VTT PU
BLICATIO
NS 486
Successful innovation. The determinants of com
mercialisation and break-even tim
es of innovations
Tätä julkaisua myy Denna publikation säljs av This publication is available from
VTT TIETOPALVELU VTT INFORMATIONSTJÄNST VTT INFORMATION SERVICEPL 2000 PB 2000 P.O.Box 200002044 VTT 02044 VTT FIN�02044 VTT, Finland
Puh. (09) 456 4404 Tel. (09) 456 4404 Phone internat. +358 9 456 4404Faksi (09) 456 4374 Fax (09) 456 4374 Fax +358 9 456 4374
ISBN 951–38–6025–6 (soft back ed.) ISBN 951–38–6026–4 (URL: http://www.inf.vtt.fi/pdf/)ISSN 1235–0621 (soft back ed.) ISSN 1455–0849 (URL: http://www.inf.vtt.fi/pdf/)
ESPOO 2002ESPOO 2002ESPOO 2002ESPOO 2002ESPOO 2002 VTT PUBLICATIONS 486
Christopher Palmberg
Successful innovation
The determinants of commercialisation and break-eventimes of innovations
This publication defines the success of innovations through the time takenfor innovations to reach commercialisation and the point of break-even, toinvestigate the relationships between the sources and success of innovations.The publication uses a database of Finnish innovations, and contributes toprevious research by covering a range of different types of innovations fromvarious industries, and by applying econometric duration analysis.
The results indicate that commercialisation and break-even times aresurprisingly short. Complex innovations are associated with longercommercialisation times, while exported innovations are associated withshorter break-even times. Different sources of innovation appear to havegreater effects on the durations than firm size and the origin of innovationsin specific sectors. Innovations related to customer demand and marketniche shorten both commercialisation and break-even times, while science-based innovations prolong them. An interesting result is also thatcompetitive markets shorten the break-even times of innovations.
The results carry implications for the management of innovation and thedesign of policy from the viewpoint of trade-offs between the timeliness,objectives and outcomes of innovation.