substation of the future: a feasibility study · pdf fileschool of electrical and computer...
TRANSCRIPT

1
Substation of the Future: A Feasibility Study
Sakis MeliopoulosGeorgia Power Distinguished Professor
School of Electrical and Computer EngineeringGeorgia Institute of TechnologyAtlanta, Georgia 30332-0250
PSERC Public Webinar, November 9, 2010

2
Industry Advisors• Floyd Galvan, Shannon Watts – ENTERGY• Raymond Vice – Southern Company• Bruce Fardanesh, George Stefopoulos – NYPA• Lisa Beard – Quanta• Paul Myrda – EPRI• Jamshid Afnan – ISO-NE• Simon Chiang – PG&E
Research Team• Tao Yang, GRA, WSU• Curtis Roe, GRA, GIT• Sungyun Choi, GRA, GIT• Anjan Bose, WSU• Sakis Meliopoulos, GIT
Acknowledgements

3
Project SummaryDigital technologies for data acquisition, automation and control have been continuouslyevolving for the last three decades. We formulated a revolutionary utilization andintegration of existing and proposed technologies for the design of the substation of thefuture.
The formulated substation of the future is based on a synchronized, in-site (voltagetransformer (VT), current transformer (CT), breaker, etc), digital data acquisition systemthat meets the requirements of all substation applications. Data transportation is all digitaland granular. The system feeds data to the various applications in the form that isneeded by the particular application. Data are validated via state estimation methodsrunning at very fast rates. Applications that have been considered are: (a) SCADA andvisibility functions, (b) protection and control functions, (c) power quality monitoring, (d)equipment health monitoring, and (e) enterprise data needs.
A feasibility study has been performed that provided data for the expected performanceof the new approach.
The proposed project is a feasibility study to determine the feasibility of the approach andthe implications, i.e. advantages and disadvantages.

4
History of Substation Automation/Control CentersProject Background
Experimental SetUp
Substation Level Data Acquisition and Processing
Substation Level Data Filtering and Calibration
Substation-Control Center Functions
Project Achievements
Future Work
Presentation Overview

5
Indicator
Control
Control Center
CommunicationsTerminal
EncoderDecoder
UserInterface
RTU IED DisturbanceRecorders
Relays
GPS
LocalComputer
CommunicationsTerminal
To Data Base Remote Access
SCADA
SCADA circa 1923
SCADA circa 2003
History: Evolution of Utility Automation
Communication Standards Substation Automation - Present

6
Project Background: Substation Architectures: SmartGrid
Protection, Control, Communications
Physical System
GE HardFiber System
Note: GE announced the HardFiber product months after we submitted the proposal

7
Real Time ModelState Estimation
ApplicationsLoad ForecastingOptimization (ED, OPF)VAR ControlAvailable Transfer capabilitySecurity AssessmentCongestion managementDynamic Line RatingTransient StabilityEM Transients, etc.Visualizations
Markets: Day Ahead, Power Balance,Spot Pricing, Transmission Pricing (FTR, FGR), Ancillary Services
Modern EMS: Present State of the Art: C&O and P&C
Control & Operation Protection & Control
Smart Grid Focus: Real Time Model, Component and System Protection, Communications
Component Protectiongenerators, transformers, lines, motors, capacitors, reactors
System ProtectionSpecial Protection Schemes, Load Shedding, Out of Step Protection, etc.
CommunicationsSubstation Automation, Enterprize, InterControl Center
A Large Number of Standards – Examples:OASIS: Open Access Same-Time Information System
UCA: Utility Communication Architecture
ICCP: Inter-Control Center Communications Protocol
C37.118, IEC 61850, DNP3.0, ..
CCAPI: Control Center Application Program Interface
CIM: Common Information Model

8
Laboratory SetUp For Evaluating Proposed ApproachesScale Model with Instrumentation, Relays and Local Area Network

9

10 1010
Test Set-up For Assessing the Quality of Data
11 1111
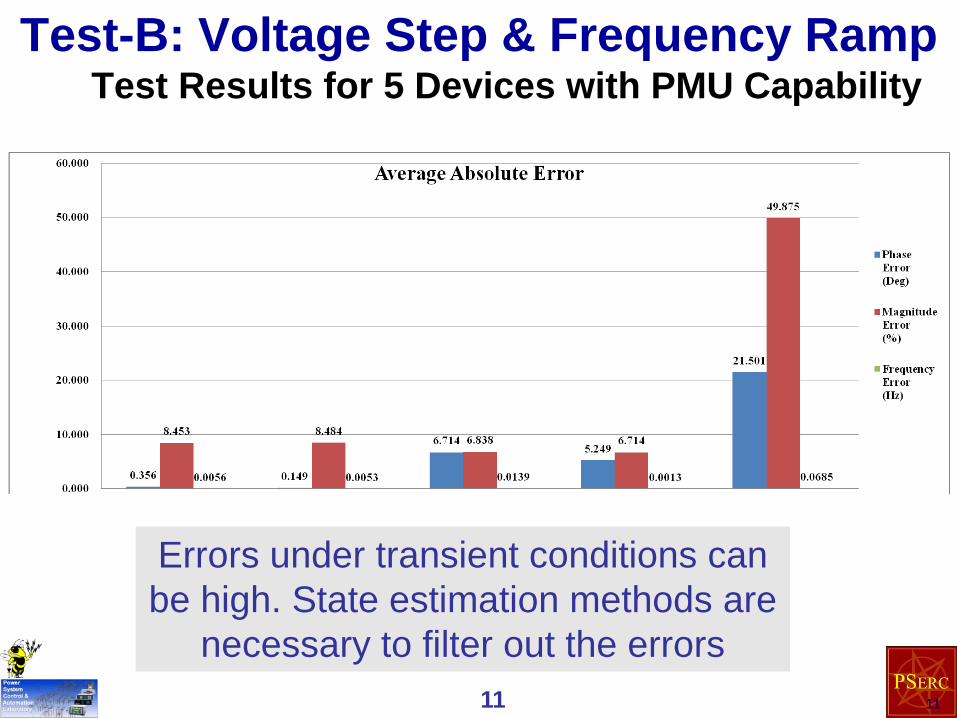
Test-B: Voltage Step & Frequency RampTest Results for 5 Devices with PMU Capability
Errors under transient conditions can be high. State estimation methods are
necessary to filter out the errors

12
Overall Approach
FromThis
ToThis

13
Overall Approach
Communication Options: Merging Units to Control House1. Fiber2. Wires3. Highly Directional, GigaHertz Antennas

14
Conceptual Design of UGPSSMBasic Design Requirements
FidelityReliabilityMinimal time latencies (goal: better than 1 msec) – achieved using GE’s Hard Fiber
GPS SynchronizationRedundant GPS input signalsIndependent data acquisition channels (no multiplexing)Direct GPS synchronizationTransfer function better than best expected instrument transformerRedundant communication channelsSteaming data - throughput
Mapping InformationDevice identity to define network pointInstrumentation channel modelData error correction
Overall PerformanceTiming error metrics have been measured using the laboratory setupAdditional metrics to be examined are: throughput and total latency

15
Conceptual Design of UGPSSM
Design is Based on Macrodyne’s First PMU 1620Jay Murphy, January 1992
A/D Converter(Σ∆ Modulation)
Input Protection &Isolation Section
OpticalIsolation
µP
Mem
ory
SamplingClock
Digitized Data2880 s/s
A/D Converter(Σ∆ Modulation)
Input Protection &Isolation Section
OpticalIsolation
Sampling Clock
GPSReceiver
Digitized Data2880 s/s
1PPS
IRIGB
GPSAntenna
Comm
OpticalIsolation
OpticalIsolation
AnalogInputsV : 300VI : 2V
Remote
Contacts

16
The UGPSSM handles the following data:
16
Conceptual Design of UGPSSM
∑∑ +++=ji
mjijii
iim xxxcz,
, ηβα
+
−−
−
=
)()(
)()(
)()(
0)(
2
1
2
1
2221
1211
tftf
htbhtb
tytv
AAAAti
MODELS:Object Oriented Device Model: i(t): current, v(t): voltage, y(t): internal variable
CONNECTIVITY:The name of node connected with other components
– e.g. GEN_A, GEN_B, GEN_C, GEN_N
MEASUREMENTS:Numerical value and measurement model:

17
Data Flow / Applications
18
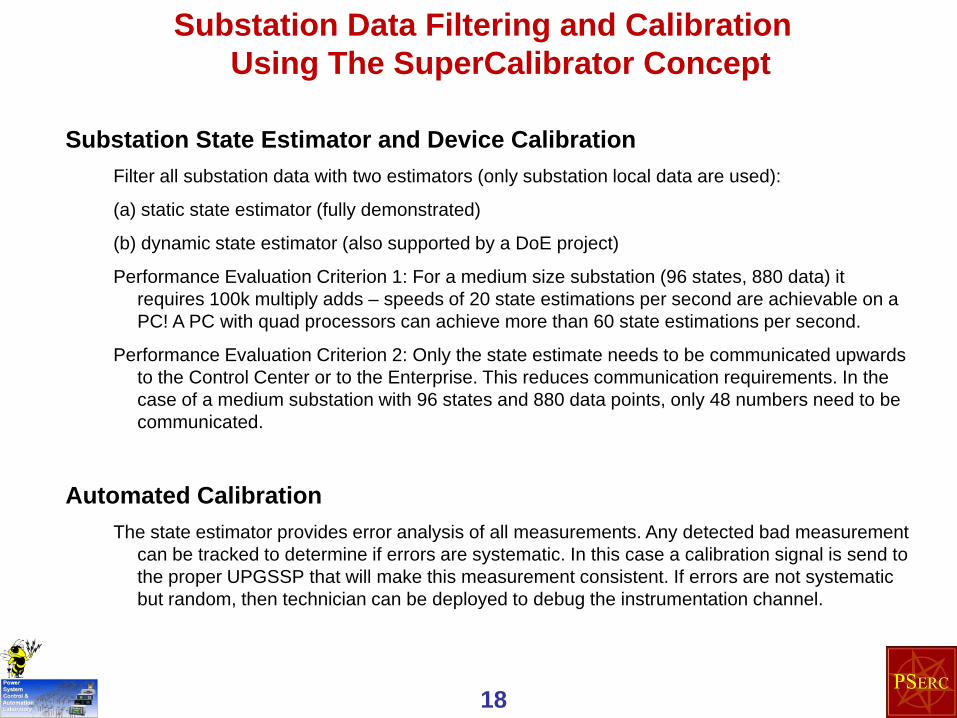
Substation Data Filtering and CalibrationUsing The SuperCalibrator Concept
Substation State Estimator and Device CalibrationFilter all substation data with two estimators (only substation local data are used):
(a) static state estimator (fully demonstrated)
(b) dynamic state estimator (also supported by a DoE project)
Performance Evaluation Criterion 1: For a medium size substation (96 states, 880 data) it requires 100k multiply adds – speeds of 20 state estimations per second are achievable on a PC! A PC with quad processors can achieve more than 60 state estimations per second.
Performance Evaluation Criterion 2: Only the state estimate needs to be communicated upwards to the Control Center or to the Enterprise. This reduces communication requirements. In the case of a medium substation with 96 states and 880 data points, only 48 numbers need to be communicated.
Automated CalibrationThe state estimator provides error analysis of all measurements. Any detected bad measurement
can be tracked to determine if errors are systematic. In this case a calibration signal is send to the proper UPGSSP that will make this measurement consistent. If errors are not systematic but random, then technician can be deployed to debug the instrumentation channel.

19
DQSE: Timing ResultsSubstation States 96
Actual Measurements 192
Total Measurements (Actual + Virtual)
880
Average DQSE Execution Time per Time Step: 50 msec(Variability: 1.5 msec)
A PC with Quad Processors Can Perform 4 State Estimations per 50 msec or About 80 State Estimations per second. Further Improvements Can be Made by
Optimizing Computer Codes
• PC, i7-930 Processor, 2.8 Gz• Code is not optimized• We have identified a number of efficiency improvements

20
The Dynamic State Estimator Can Operate at speeds of 60 times per second.When a fault occurs it triggers the introduction of another state.Specifically the length to the fault (fault location) is introduced as another state variable to be estimated.
State Estimation Based Fault Locating

21
Conceptual Design of Alarms and Event Recording
Alarm Processing• The approach provides the estimated state at very frequent intervals – 60 times per
second is possible. The state estimate provides the exact state of the substation and therefore the root cause of any disturbance. Alarm initiation should be based on the root cause and not on individual alarms received from various devices.
• Issues of configuration for alarm processing have not addressed. It is believed that this is a straightforward procedure.
Archiving and Fault Recording• The objectives of archiving and fault recording were defined as the capability to fully
reconstruct the operation of the system for any interval of time for both the normal operation as well as disturbance conditions. Standards to achieve this goal are not presently available. For this reason, a new procedure and protocol was developed. It is described in the next few slides.
• The developed procedures provides the capability for full “play back” capability of the system operation for any interval of time.
• Storage capabilities are modest. It is estimated that up to six months of data can be stored in a standard PC for a medium size substation.

22
• System FULL MODEL stored once a day in WinIGS format – time of day can be arbitrarily selected, for example at 2 am. (example storage follows)
• Report system changes by exception – UTC time (example storage follows)
• Storage of state data: at each occurrence of the state estimator, the estimated states are stored in COMTRADE-like format. (example storage follows)
Objectives: Play-Back Normal Operationor Disturbance
Substation Storage SchemeFull Model + Model Changes + Data
23
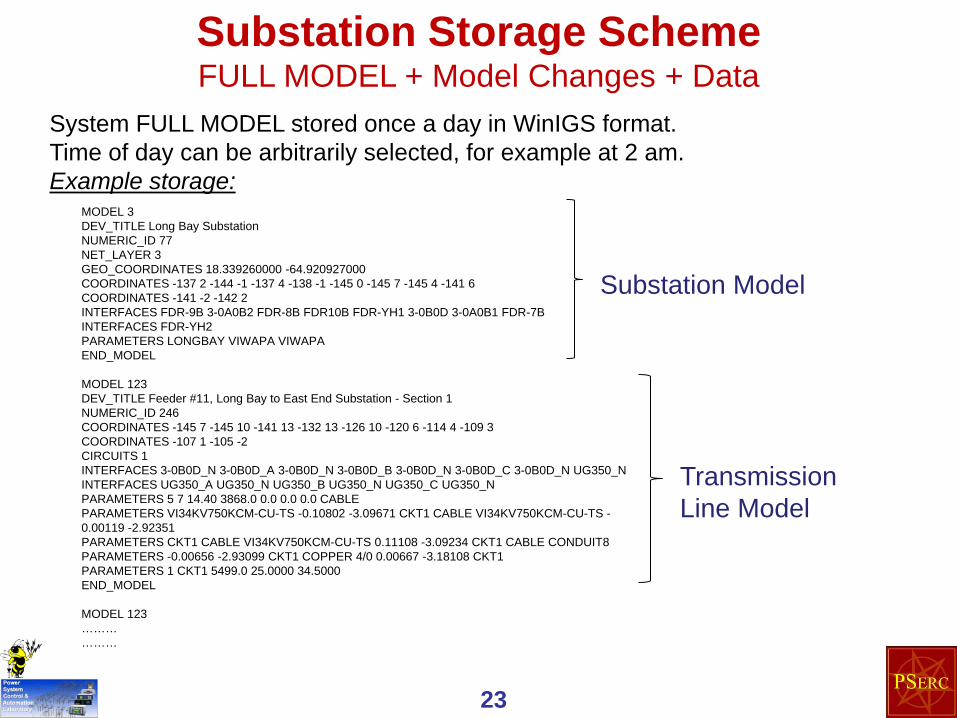
System FULL MODEL stored once a day in WinIGS format.Time of day can be arbitrarily selected, for example at 2 am.Example storage:
Substation Storage SchemeFULL MODEL + Model Changes + Data
MODEL 3DEV_TITLE Long Bay SubstationNUMERIC_ID 77NET_LAYER 3GEO_COORDINATES 18.339260000 -64.920927000COORDINATES -137 2 -144 -1 -137 4 -138 -1 -145 0 -145 7 -145 4 -141 6COORDINATES -141 -2 -142 2INTERFACES FDR-9B 3-0A0B2 FDR-8B FDR10B FDR-YH1 3-0B0D 3-0A0B1 FDR-7BINTERFACES FDR-YH2PARAMETERS LONGBAY VIWAPA VIWAPAEND_MODEL
MODEL 123DEV_TITLE Feeder #11, Long Bay to East End Substation - Section 1NUMERIC_ID 246COORDINATES -145 7 -145 10 -141 13 -132 13 -126 10 -120 6 -114 4 -109 3COORDINATES -107 1 -105 -2CIRCUITS 1INTERFACES 3-0B0D_N 3-0B0D_A 3-0B0D_N 3-0B0D_B 3-0B0D_N 3-0B0D_C 3-0B0D_N UG350_NINTERFACES UG350_A UG350_N UG350_B UG350_N UG350_C UG350_NPARAMETERS 5 7 14.40 3868.0 0.0 0.0 0.0 CABLEPARAMETERS VI34KV750KCM-CU-TS -0.10802 -3.09671 CKT1 CABLE VI34KV750KCM-CU-TS -0.00119 -2.92351PARAMETERS CKT1 CABLE VI34KV750KCM-CU-TS 0.11108 -3.09234 CKT1 CABLE CONDUIT8PARAMETERS -0.00656 -2.93099 CKT1 COPPER 4/0 0.00667 -3.18108 CKT1PARAMETERS 1 CKT1 5499.0 25.0000 34.5000END_MODEL
MODEL 123………………
Substation Model
TransmissionLine Model

24
Report system changes by exception – UTC time
Substation Storage SchemeFull Model + MODEL CHANGES + Data
MODEL_CHANGETIME 1267771497 450123TYPE XFMR_TAPDEVICE_ID 1265VALUE R12
END_MODEL_CHANGE
MODEL_CHANGETIME 1267771791 609355TYPE BREAKER_OPERATIONDEVICE_ID 3409VALUE CLOSE
END_MODEL_CHANGE
. . .
. . .
. . .
SOC + Fractional SecondMarch 05, 01:44:57.450123
File Format – Each line begins with a keywordoptionally followed by one or more arguments.

25
Storage of state data: at each occurrence of the state estimator, the estimated states are stored in COMTRADE-like format. The following File Types Are Used:
Configuration Files: Description of State Names Types and Locations
State Data Files: State Values plus Model Change Information
Triggered Event Files: Waveform data recorded for each triggeringevent in COMTRADE format.
Substation Storage SchemeFull Model + MODEL CHANGES + Data

26
Storage of state data: at each occurrence of the state estimator, the estimated states are stored in COMTRADE-like format.
Configuration File – One for Each Day
Substation Storage SchemeFull Model + MODEL CHANGES + Data
File Naming Standard: CompanyName_SubstationName_SOC.scf
File Content:<Title or Brief Description><SOC> <uSec><Number of States><State Name>, <State Type>, <Bus Name>, <Phase>, <Power Device ID><State Name>, <State Type>, <Bus Name>, <Phase>, <Power Device ID>. . . . . .
Where:
• SOC: is the Second of Century Time Code defined as the number of seconds elapsed since midnight of January 1, 1970 (in UTC time)
• uSec is a fractional second value in microseconds.
• Above structure repeated each time the set of states changes
27
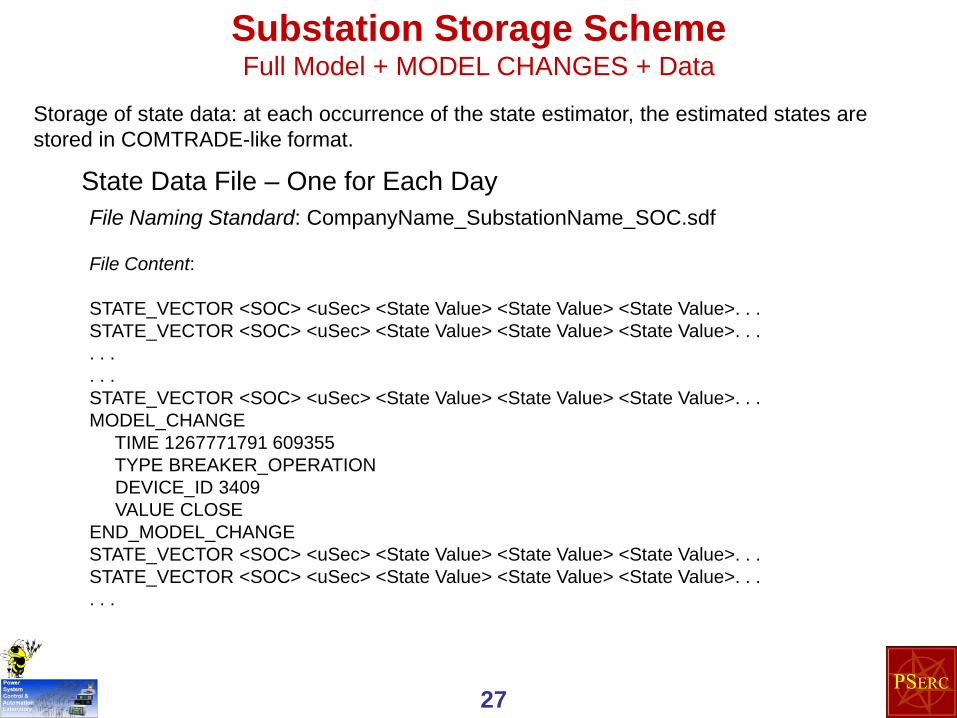
Storage of state data: at each occurrence of the state estimator, the estimated states are stored in COMTRADE-like format.
State Data File – One for Each Day
Substation Storage SchemeFull Model + MODEL CHANGES + Data
File Naming Standard: CompanyName_SubstationName_SOC.sdf
File Content:
STATE_VECTOR <SOC> <uSec> <State Value> <State Value> <State Value>. . . STATE_VECTOR <SOC> <uSec> <State Value> <State Value> <State Value>. . . . . .. . .STATE_VECTOR <SOC> <uSec> <State Value> <State Value> <State Value>. . .MODEL_CHANGE
TIME 1267771791 609355TYPE BREAKER_OPERATIONDEVICE_ID 3409VALUE CLOSE
END_MODEL_CHANGESTATE_VECTOR <SOC> <uSec> <State Value> <State Value> <State Value>. . .STATE_VECTOR <SOC> <uSec> <State Value> <State Value> <State Value>. . .. . .

28
Storage of state data: at each occurrence of the state estimator, the estimated states are stored in COMTRADE-like format.
Triggered Event Files – One for Each Event
Substation Storage SchemeFull Model + MODEL CHANGES + Data
File Naming Standard:
CompanyName_SubstationName_SOC.cfgCompanyName_SubstationName_SOC.dat
File Content:
Standard COMTRADE Waveform File Format

29
Conceptual Design of Substation Protection & Control
Protective Relaying AlgorithmsThe possibility of performing protection functions for the entire substation using (a) filtered data (estimated data) and (b) entire substation state has been investigated for a generic substation. Assuming that relaying decisions do not need to be faster than two cycles, the approach will yield reliable and secure relaying decisions.
The approach also provides the capability for integrated monitoring of the health and the settings of the relaying scheme. Failures of subsystems, for example blown fuse on a PT, single pole stuck, inaccurate CT data in relays, etc. can be immediately identified.
Validation Work 1: Application to generating substations: Consider all protection functions required at a generating substation and examine in a systematic way how each one of the functions can be performed in the proposed scheme. Develop metrics to assess performance. Compare traditional relay response and “substation relay” response using actual field data of various events.
Validation Work 2: Application to transmission substations: Consider all protection functions required at a transmission or distribution substation and examine in a systematic way how each one of the functions can be performed in the proposed scheme. Develop metrics to assess performance. Compare traditional relay response and “substation relay” response using actual field data of various events.

30
Control Center Operations• Monitoring (Data Acquisition)
This is the main function of a control center. In this scheme, the data available from each substation is qualitatively and quantitatively different. The control center must subscribe to the particular set of data that the operator wants to monitor at each sub.
• Supervisory ControlThere are only a few points – usually circuit breakers – that are manually controlled by the operator.
• Automatic ControlThe only automatic control today is AGC but there may be many more in the future. Moreover, the control center need not be the only node where such control is done.
• ApplicationsSimilarly, applications may not be computed at the control center although the results may need to be displayed to the operator.

31
Data Flow / Applications / Communications / Flow Rates
WAMSCC
SCC
G
SCC
G
SCC
SCC
SCC
Substation Control ComputerWide Area Monitoring SystemControl Ceneter
* SCC** WAMS
CC
*
**
*
*
*
*
Substation LevelWide Area Level
Control Center State Estimator: Collect substation real time model and synthesize system wide real time model (Distributed State Estimator). The approach enables system wide state estimation at rates of 60 times per second.
Wide Area Monitoring: Streaming data of validated substation state into the control center provides wide area monitoring at speeds of 60 phasors per second or better and unprecedented quality.
System Protection: Wide area monitoring at the above stated speeds provide the best infrastructure for system protection.
Control Center Applications: All control center applications can run on a validated real time model that updated 60 times per second.
32
Project Achievements • Ability of the proposed approach to deliver data to substation computers with minimum
latency (target value of 1 millisecond) without any loss of information. Status: Achieved with C37.118 (larger time latencies exist for IEC 61850)
• Performance Quantification of proposed approach on a variety of issues relative to vital applications in monitoring, control and protection of the system. Demonstrated for State Estimation, Power Quality Analysis, Fault Locating and Protection Functions
• Evaluation of the ability to perform all protective functions in a substation using the output of the substation dynamic estimator and the time latencies that will be involved in this process. Favorable impact on protection reliability, security and selectivity.
• Evaluation of the expected improvements in communicating with the control center and the company enterprise in general. Demonstrated that required throughput between substation and control center has been minimized.
• Substantial savings since there is no need for wiring within the substation versus the cost of equipping each instrument transformer with a UGPSSM and LAN interface.

33
Future WorkThe present project was a feasibility study. Yet, a laboratory was established for evaluating some of the proposed architectures and procedures for the substation of the future.
The findings, expected performance and potential cost reductions justify further work on the subject. Therefore we propose the following future work:
1. Address the issue of migration of old substations with aging infrastructure to a fully automated substation closer to the vision of the substation of the future.
2. Additional developments in the laboratory to enable a complete setup of a substation of the future as designed in the present project. The objectives of the new work is to experimentally measure the performance of (a) dynamic state estimation using C37.118 and IEC 61850, (b) the performance of the state estimation based fault locating, (c) the performance of the storage and play back capability, and (d) the performance of the integrated protection functions based on filtered data and entire substation state (as opposed to present day relays that operate with limited information, for example three voltages and three currents).
3. Apply “lessons learned” and technologies to distribution systems. Develop advanced distribution management systems active distribution systems.

34
Active Future Distribution Systems (with distributed energy resources – solar, wind, PHEVs, fuel cells,…).
Smart Grid Technologies: Distributed Monitoring, Control, Protection and Operations system. Target Speeds 10 times per second. One Important Driver: Integration of Renewables and Other Resources into the Grid.
Functions: (a) Optimal operation of the distribution system under normal operating conditions, (b) Emergency management in cases of faults and assist the power grid when needed, (c) Assist Voltage recovery, (d) Assist cold load pickup, (e) Balance Feeder, (f) etc., etc.
Challenges• Inertia-less Interface• Protection/Control• Disturbance ride-through requirements• Safe Communications• Safety• Load/Generation Control• Integrated Optimization