substance use and substance use disorder · pdf filesubstance use and substance use disorder...
TRANSCRIPT

Substance Use and Substance Use Disorder by Industry
National Survey on Drug Use and Health
Short Report April 16, 2015
SUBSTANCE USE AND SUBSTANCE USE DISORDERBY INDUSTRY
AUTHORS
Donna M. Bush, Ph.D., F-ABFT, and Rachel N. Lipari, Ph.D.
INTRODUCTION
Substance use negatively affects U.S. industry through lost productivity, workplace accidentsand injuries, employee absenteeism, low morale, and increased illness. U.S. companies losebillions of dollars a year because of employees' alcohol and drug use and related problems.1
Research shows that the rate of substance use varies by occupation and industry.2
The National Survey on Drug Use and Health (NSDUH) gathers information about substanceuse and dependence or abuse. NSDUH defines illicit drugs as marijuana/hashish, cocaine(including crack), inhalants, hallucinogens, heroin, or prescription-type drugs usednonmedically.3 Heavy alcohol use is defined as drinking five or more drinks on the sameoccasion (i.e., at the same time or within a couple of hours of each other) on 5 or more daysin the past 30 days. NSDUH also includes a series of questions to assess symptoms ofdependence on or abuse of alcohol or illicit drugs during the past year. These questions areused to classify persons as dependent on or abusing substances based on criteria in thefourth edition of the Diagnostic and Statistical Manual of Mental Disorders (DSM-IV).4 In thisreport, dependence on or abuse of alcohol or illicit drugs is referred to as a "substance usedisorder."
This report is one of several designed to update SAMHSA’s Analytic Series A–29, WorkerSubstance Use and Workplace Policies and Programs, published in 2007. To enhance thestatistical power and analytic capability and ensure consistency in time frames across all ofthe updated reports, 5-year time periods were chosen. This issue of The CBHSQ Report usescombined data from the 2008 to 2012 surveys to present estimates of substance usebehaviors (past month illicit drug use and past month heavy alcohol use) and past yearsubstance use disorder among persons aged 18 to 64 who are employed full time byindustry category. Full-time employment is defined as working 35 or more hours per weekand working in the past week or having a job despite not working in the past week. NSDUHincludes questions to assess the type of business or industry in which these respondentsworked. Using the North American Industry Classification System (NAICS) developed by theU.S. Census Bureau, 19 major industry groupings were identified.
Combined data from 2008 to 2012 indicate that an●
annual average of 8.7 percent of full-time workersaged 18 to 64 used alcohol heavily in the pastmonth, 8.6 percent used illicit drugs in the pastmonth, and 9.5 percent were dependent on orabused alcohol or illicit drugs in the past year.
The highest rates of past month heavy alcohol use●
among full-time workers aged 18 to 64 were foundin the mining (17.5 percent) and constructionindustries (16.5 percent).
The highest rates of past month illicit drug use●
were found in the accommodations and foodservices industry (19.1 percent).
The workers in the accommodations and food●
services industry (16.9 percent) had the highestrates of past year substance use disorder.
In Brief

The analyses presented in this report includes comparisons of the 2008 to 2012 rates of illicit drug use and heavy alcohol use across industriesand comparisons of the 2008 to 2012 rates with the 2003 to 2007 rates within each industry. For this report, testing for differences acrossindustry groupings included two phases. First, differences across industries were assessed by making pair-wise comparisons between industries(e.g., the rates for each industry were compared with those of every other industry) to identify whether any industry had significantly higherrates than all other industries. A second test was conducted to assess whether significant differences between industries were the result ofdifferences in the age and gender composition of the industry.5 Previous research has shown that males have higher substance use rates thanfemales and adults aged 18 to 25 have higher substance use rates than older adults.6 As a result, male-dominated or youth-dominated industriescould have higher substance use rates at the overall level, but when the industry’s age and gender distribution was taken into account, theindustry might not differ from other industries. The final section of this report presents comparisons of combined 2008 to 2012 data withcombined 2003 to 2007 data.
SUBSTANCE USE, BY INDUSTRY CATEGORY
Rates of substance use behaviors and substance use disorder varied across industry groupings. The overall rate of past month heavy alcohol useamong full-time workers aged 18 to 64 was 8.7 percent. Rates of past month heavy alcohol use ranged from 17.5 percent among workers in themining industry to 4.4 percent among workers in the health care and social assistance industry (Figure 1).
Figure 1. Past month heavy alcohol use among adults aged 18 to 64employed full time, by industry category: combined 2008 to 2012
* The full title of this category is "Management of companies and enterprises,administration, support, waste management, and remediation services.”Source: SAMHSA, Center for Behavioral Health Statistics and Quality, National Surveyson Drug Use and Health (NSDUHs) 2008 to 2010 (revised March 2012) and 2011 to2012.

Workers in the mining (17.5 percent) and construction (16.5 percent) industries had the highest rates of past month heavy alcohol use. For theworkers in the construction industry, this finding remained true even when controlling for gender and age differences across industries.7 Thisindicates that there is something unique about past month heavy alcohol use for the construction industry that would remain even if theconstruction industry had the same gender and age distribution of any other industry (see Tables A1–A2). However, for the mining industry, thishigher rate did not remain when controlling for age or gender differences. This indicates that the high heavy alcohol use rate in the miningindustry can be attributed to the demographic composition of the mining industry.
The overall rate of past month illicit drug use among full-time workers aged 18 to 64 was 8.6 percent. Rates of past month illicit drug use rangedfrom 19.1 percent among workers in the accommodations and food services industry to 4.3 percent among workers in the public administrationindustry (Figure 2). These findings remained true even when controlling for gender and age differences across industries (see Tables A3–A4).
Figure 2. Past month illicit drug use among adults aged 18 to 64 employedfull time, by industry category: combined 2008 to 2012
* The full title of this category is "Management of companies and enterprises,administration, support, waste management, and remediation services.”Source: SAMHSA, Center for Behavioral Health Statistics and Quality, National Surveyson Drug Use and Health (NSDUHs) 2008 to 2010 (revised March 2012) and 2011 to2012.
The overall rate of past year substance use disorder among full-time workers aged 18 to 64 was 9.5 percent. Rates of past year substance usedisorder ranged from 16.9 percent among workers in the accommodations and food services industry to 5.5 percent among workers in theeducational services industry (Figure 3). Although the accommodations and food services industry group had the highest rate of past yearsubstance use disorder, this finding did not remain true after controlling for age and gender distributions. This indicates that the high rate can beattributed to the demographic composition of the accommodation and food services industry (see Tables A5–A6).

Figure 3. Past year substance use disorder among adults aged 18 to 64employed full time, by industry category: combined 2008 to 2012
* The full title of this category is "Management of companies and enterprises,administration, support, waste management, and remediation services.”Source: SAMHSA, Center for Behavioral Health Statistics and Quality, National Surveyson Drug Use and Health (NSDUHs) 2008 to 2010 (revised March 2012) and 2011 to2012.
TRENDS
Comparisons between combined 2003 to 2007 data and combined 2008 to 2012 data show some changes in rates of substance use behaviors ordisorders by industry category (Figures 4–6). Between the two time periods, rates of past month illicit drug use increased among workers in theaccommodations and food services industry (from 16.9 to 19.1 percent) and in the educational services industry (from 3.7 to 4.8 percent), anddecreased among workers in the construction services industry (from 13.9 to 11.6 percent). Additionally, decreases were seen in the rates ofpast year substance use disorder in four industry categories: construction (from 17.3 to 14.3 percent), management (from 13.8 to 11.4 percent),wholesale trade (from 13.4 to 10.4 percent), and manufacturing (from 10.4 to 9.3 percent). The changes within each industry between the twotime periods do not account for any changes in the demographic composition (e.g., age distribution) that may have occurred within theindustries.

Figure 4. Past month heavy alcohol use among adults aged 18 to 64employed full time, by industry category: combined 2003 to 2007 andcombined 2008 to 2012
* The full title of this category is "Management of companies and enterprises,administration, support, waste management, and remediation services.”Source: SAMHSA, Center for Behavioral Health Statistics and Quality, National Surveyson Drug Use and Health (NSDUHs) 2003 to 2005, 2006 to 2010 (revised March 2012)and 2011 to 2012.

Figure 5. Past month illicit drug use among adults aged 18 to 64 employedfull time, by industry category: combined 2003 to 2007 and combined 2008to 2012
* Difference between estimates for 2003 to 2007 and for 2008 to 2012 are statisticallysignificant at .05 level.** The full title of this category is "Management of companies and enterprises,administration, support, waste management, and remediation services.”Source: SAMHSA, Center for Behavioral Health Statistics and Quality, National Surveyson Drug Use and Health (NSDUHs) 2003 to 2005, 2006 to 2010 (revised March 2012)and 2011 to 2012.

Figure 6. Past year substance use disorder among adults aged 18 to 64employed full time, by industry category: combined 2003 to 2007 andcombined 2008 to 2012
* Difference between estimates for 2003 to 2007 and for 2008 to 2012 are statisticallysignificant at .05 level.** The full title of this category is "Management of companies and enterprises,administration, support, waste management, and remediation services.”Source: SAMHSA, Center for Behavioral Health Statistics and Quality, National Surveyson Drug Use and Health (NSDUHs) 2003 to 2005, 2006 to 2010 (revised March 2012)and 2011 to 2012.

DISCUSSION
Employee heavy alcohol use, use of illicit drugs, and substance use disorder are associated with negative work behaviors such as absenteeismand frequent job changes.2 This report indicates that the prevalence of substance use and substance use disorders is not consistent acrossindustries. For example, the lowest rates of heavy alcohol use, illicit drug use, and substance use disorder were generally seen in education,health care and social assistance, and public administration. In contrast, higher rates were generally seen in mining, construction, andaccommodations and food services industries. There are demographic differences in the age and gender composition across industries, andsome of the differences in substance use rates across industries were statistically significant even when controlling for age or gender.Differences across industries that did not remain significant when controlling for age and gender are still important to identify. Employers inindustries that have higher or lower rates of heavy alcohol use, use of illicit drugs, and substance use disorder that can be attributed to thedemographic composition of their industry can use this information when developing prevention/education programs.
When heavy alcohol use, use of illicit drugs, and substance use disorder rates are examined over time, it appears that some industries have hada reduction in rates; however, there were increases as well. An extension of this research could examine whether the changes in use ratescorrespond to either changes in climate in the industries (e.g., attitudes towards substance use, distribution of prevention messages) or shifts inthe demographic compositions of the industries across these time periods.
Studies also have indicated that employers vary in their treatment of substance use issues and that workplace-based Employee AssistancePrograms can be a valuable resource for obtaining help for substance-using workers.8,9 Given the lifetime health and economic burdens fromalcohol use, illicit drug, and substance use disorders, this report illustrates the need to monitor industries individually.
END NOTES
Office of National Drug Control Policy, Executive Office of the President. (2011). How illicit drug use affects business and the economy. Retrieved from1.http://www.whitehouse.gov/sites/default/files/ondcp/Fact_Sheets/effects_of_drugs_on_economy_jw_5-24-11_0.pdfLarson, S. L., Eyerman, J., Foster, M. S., & Gfroerer, J. C. (2007). Worker substance use and workplace policies and programs (HHS Publication No. SMA2.07–4273, Analytic Series A–29). Rockville, MD: Substance Abuse and Mental Health Services Administration, Office of Applied Studies.Nonmedical use is defined as the use of prescription-type drugs not prescribed for the respondent by a physician or used only for the experience or feeling3.they caused. Nonmedical use of any prescription-type pain reliever, sedative, stimulant, or tranquilizer does not include over-the-counter drugs.Nonmedical use of stimulants includes methamphetamine use.American Psychiatric Association. (1994). Diagnostic and statistical manual of mental disorders (4th ed.). Washington, DC.4.This test was based on logistic regression models in which gender and age groups were included as main effects predictors along with an industry5.indicator. Logistic regression is a statistical method used to determine if there is a relationship (that is, an association) between an outcome with twopossibilities and a known characteristic, such as gender.Center for Behavioral Health Statistics and Quality. (2013). Results from the 2012 National Survey on Drug Use and Health: Summary of national findings6.(HHS Publication No. SMA 13–4795, NSDUH Series H–46). Rockville, MD: Substance Abuse and Mental Health Services Administration.This was model based in that gender and age groups were included as main effects predictors in logistic regression models along with an industry7.indicator.Delaney, W., Grube, J. W., & Ames, G. M. (1998). Predicting likelihood of seeking help through the Employee Assistance Program among salaried and union8.hourly employees. Addiction, 93(3), 399–410.Reynolds, G. S., & Lehman, W. E. (2003). Levels of substance use and willingness to use the Employee Assistance Program. Journal of Behavioral Health9.Services & Research, 30(2), 238–248.
SUGGESTED CITATION
D.M. Bush and R.N. Lipari. The CBHSQ Report: Substance Use and Substance Use Disorder, by Industry. (April 16, 2015). Substance Abuse andMental Health Services Administration, Center for Behavioral Health Statistics and Quality. Rockville, MD.

SUPPORTING TABLES
Table S1. Past month heavy alcohol use among full-time workers aged 18 to64, by industry categories: combined 2003 to 2007 and combined 2008 to2012 (supports Figures 1 and 4 and text in “Trends” section)
SE = standard error.* The full title of this category is “Management of companies and enterprises,administration, support, waste management, and remediation services.”Source: SAMHSA, Center for Behavioral Health Statistics and Quality, National Surveyson Drug Use and Health (NSDUHs), 2003 to 2005, 2006 to 2010 (revised March 2012),and 2011 to 2012.

Table S2. Past month illicit drug use among full-time workers aged 18 to 64,by industry categories: combined 2003 to 2007 and combined 2008 to 2012(supports Figures 2 and 5 and text in “Trends” section)
SE = standard error.* The full title of this category is “Management of companies and enterprises,administration, support, waste management, and remediation services.”Source: SAMHSA, Center for Behavioral Health Statistics and Quality, National Surveyson Drug Use and Health (NSDUHs), 2003 to 2005, 2006 to 2010 (revised March 2012),and 2011 to 2012.

Table S3. Past year substance use disorder among full-time workers aged 18-64, by industry categories: combined 2003 to 2007 and combined 2008 to2012 (supports Figures 3 and 6 and text in “Trends” section
SE = standard error.* The full title of this category is “Management of companies and enterprises,administration, support, waste management, and remediation services.”Source: SAMHSA, Center for Behavioral Health Statistics and Quality, National Surveyson Drug Use and Health (NSDUHs), 2003 to 2005, 2006 to 2010 (revised March 2012),and 2011 to 2012.

ADDITIONAL TABLES
Table A1. Past month heavy alcohol use among full-time workers aged 18 to64, by industry categories and gender: combined 2008 to 2012
SE = standard error.*Low precision; no estimate reported.** The full title of this category is “Management of companies and enterprises,administration, support, waste management, and remediation services.”Source: SAMHSA, Center for Behavioral Health Statistics and Quality, National Surveyson Drug Use and Health (NSDUHs) 2008 to 2010 (revised March 2012) and 2011 to2012.
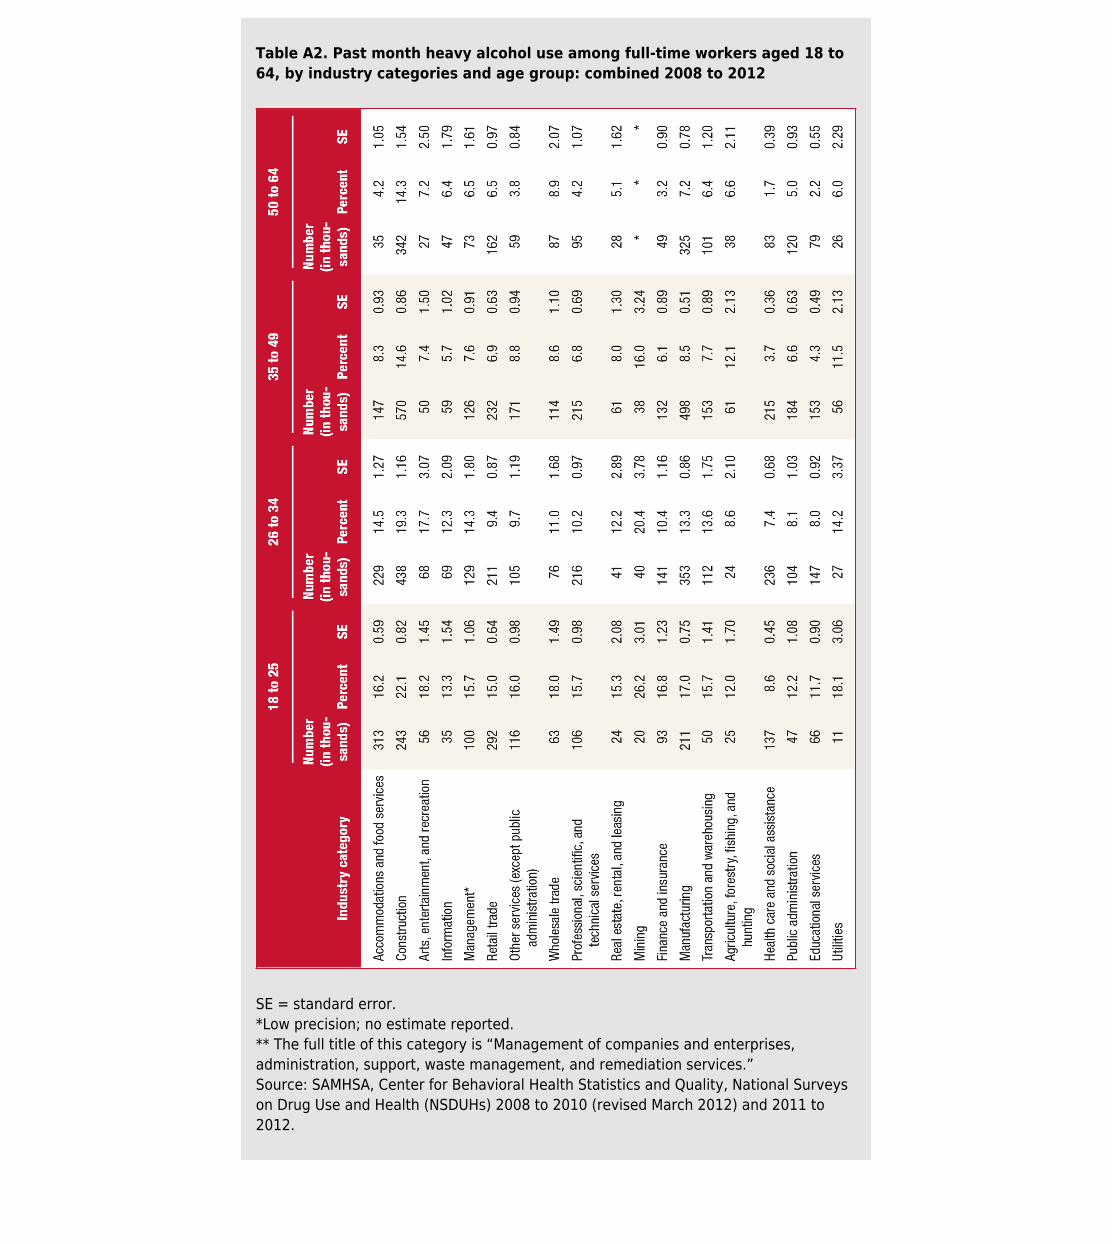
Table A2. Past month heavy alcohol use among full-time workers aged 18 to64, by industry categories and age group: combined 2008 to 2012
SE = standard error.*Low precision; no estimate reported.** The full title of this category is “Management of companies and enterprises,administration, support, waste management, and remediation services.”Source: SAMHSA, Center for Behavioral Health Statistics and Quality, National Surveyson Drug Use and Health (NSDUHs) 2008 to 2010 (revised March 2012) and 2011 to2012.

Table A3. Past month illicit drug use among full-time workers aged 18 to 64,by industry categories and gender: combined 2008 to 2012
SE = standard error.*Low precision; no estimate reported.** The full title of this category is “Management of companies and enterprises,administration, support, waste management, and remediation services.”Source: SAMHSA, Center for Behavioral Health Statistics and Quality, National Surveyson Drug Use and Health (NSDUHs) 2008 to 2010 (revised March 2012) and 2011 to2012.

Table A4. Past month illicit drug use among full-time workers aged 18 to 64,by industry categories and age group: combined 2008 to 2012
SE = standard error.*Low precision; no estimate reported.** The full title of this category is “Management of companies and enterprises,administration, support, waste management, and remediation services.”Source: SAMHSA, Center for Behavioral Health Statistics and Quality, National Surveyson Drug Use and Health (NSDUHs) 2008 to 2010 (revised March 2012) and 2011 to2012.

Table A5. Past year substance use disorder among full-time workers aged 18to 64, by industry categories and gender: combined 2008 to 2012
SE = standard error.*Low precision; no estimate reported.** The full title of this category is “Management of companies and enterprises,administration, support, waste management, and remediation services.”Source: SAMHSA, Center for Behavioral Health Statistics and Quality, National Surveyson Drug Use and Health (NSDUHs) 2008 to 2010 (revised March 2012) and 2011 to2012.

Table A6. Past year substance use disorder among full-time workers aged 18to 64, by industry categories and age group: combined 2008 to 2012
SE = standard error.*Low precision; no estimate reported.** The full title of this category is “Management of companies and enterprises,administration, support, waste management, and remediation services.”Source: SAMHSA, Center for Behavioral Health Statistics and Quality, National Surveyson Drug Use and Health (NSDUHs) 2008 to 2010 (revised March 2012) and 2011 to2012.

SUMMARY
Background: Substance use negatively affects U.S. industry through lost productivity, workplace accidents and injuries, employee absenteeism,low morale, and increased illness. Research shows that the rate of substance use varies by occupation and industry. Method: Combined 2003-2007 and 2008-2012 National Survey on Drug Use and Health (NSDUH) estimates for past month heavy alcohol use, past month illicit drug useand past year substance use disorder (SUD) for full-time employees aged 18-64 in 19 industry categories were analyzed. Results: Combineddata from 2008-2012 indicate an annual average of 8.7% of full-time workers aged 18 to 64 used alcohol heavily, 8.6% used illicit drugs, and9.5% had SUD. The highest rates of heavy alcohol use were found in the mining (17.5%) and construction industries (16.5%). The highest ratesof illicit drug use were found in the accommodations and food services industry (19.1%). Workers in the accommodations and food servicesindustry (16.9%) had the highest SUD rates. Between the two time periods, rates of illicit drug use increased in the accommodations and foodservices industry (from 16.9 to 19.1%) and in the educational services industry (from 3.7 to 4.8%), and decreased among workers in theconstruction services industry (from 13.9 to11.6%). Decreases were seen in the past year SUD rates in construction (from 17.3 to 14.3%),management (from 13.8 to 11.4%), wholesale trade (from 13.4 to 10.4%), and manufacturing (from 10.4 to 9.3%). Conclusion: The prevalenceof substance use and SUD is not consistent across industries. The lowest rates of heavy alcohol use, illicit drug use, and SUD were generally seenin education, health care and social assistance, and public administration. Higher rates were generally seen in mining, construction, andaccommodations and food services industries. When heavy alcohol use, use of illicit drugs, and SUD are examined over time, it appears thatsome industries have had a reduction in rates; however, there were increases as well.
Keywords: full time workers aged 18-64, worker drug use, industry, illicit drug use, heavy alcohol use, substance use disorder, National Surveyon Drug Use and Health, NSDUH
AUTHOR INFORMATION
KEYWORDSOccupation, Short Report, Population Data, 2012, Employers, Public Health Professionals, Alcohol Abuse, Substance Abuse, Workers and Workplace, Drug UseTrends, Workplace Trends, Alcohol, Illegal Drugs, Multi-Year Trend, All US States Only
The Substance Abuse and Mental Health Services Administration (SAMHSA) is the agency within the U.S. Department of Health and Human Services that leads public health efforts to advancethe behavioral health of the nation. SAMHSA's mission is to reduce the impact of substance abuse and mental illness on America's communities.
The National Survey on Drug Use and Health (NSDUH) is an annual survey sponsored by The Substance Abuse and Mental Health Services Administration (SAMHSA). The data used in this reportare based on information obtained from adolescents aged 12 to 17 (23,500 in 2001 and 22,500 in 2012). The Survey collects data by administering questionnaires to a representative sample ofthe population through face-to-face interviews at their place of residence.
The NSDUH Report is prepared by The Center for Behavioral Health Statistics and Quality (CBHSQ), SAMHSA, and by RTI International in Research Triangle Park, North Carolina. (RTI Internationalis a trade name of Research Triangle Institute.)
Information on the most recent NSDUH is available in the following publication:
Center for Behavior Health Statistics and Quality. (2013). Results from the 2012 National Survey on Drug Use and Health: Summary of national findings (HHS Publication No. SMA 13-4795,NSDUH Series H-46). Rockville, MD : Substance Abuse and Mental Health Services Administration.
Also available online: http://www.samhsa.gov/data/population-data-nsduh.