substance abuse delta, michigan
TRANSCRIPT

COMMUNITY HEALTH NEEDS ASSESSMENT 2013
ST. FRANCIS HOSPITAL Delta County
Prepared by: Dr. Laurence G. Weinzimmer and Professor Eric Michel

St. Francis Hospital Community Health-‐Needs Assessment
2
TABLE OF CONTENTS
EXECUTIVE SUMMARY .................................................................................................. 9
I. INTRODUCTION ............................................................................................................. 13
II METHODS ........................................................................................................................ 20
III. PHASE 1 – COMMUNITY ASSESSMENT .................................................................. 24 Chapter 1. Demographic Profile ................................................................................. 25 1.1 Population ..................................................................................................... 25 1.2 Age Distribution ........................................................................................... 28 1.3 Household/Family ......................................................................................... 33 1.4 Economic Information .................................................................................. 38 1.5 Education ...................................................................................................... 40 1.6 People with Disabilities ................................................................................ 43 Demographic Profile: Strategic Implications ..................................................... 45 Chapter 2. Prevention .................................................................................................. 47 2.1 Accessibility ................................................................................................. 47 2.2 Wellness ........................................................................................................ 49 Prevention: Strategic Implications ...................................................................... 57 Chapter 3. Symptoms/Predictors ................................................................................ 59 3.1 Tobacco Use ................................................................................................. 59 3.2 Drug and Alcohol Abuse .............................................................................. 60 3.3 Overweight and Obesity ............................................................................... 60 Symptoms/Predictors: Strategic Implications ..................................................... 61 Chapter 4. Diseases/Morbidity .................................................................................... 65 4.1 Age Related .................................................................................................. 65 4.2 Cardiovascular .............................................................................................. 67 4.3 Respiratory .................................................................................................... 80 4.4 Cancer ........................................................................................................... 84 4.5 Type 2 Diabetes ............................................................................................ 93 4.6 Infectious Diseases ....................................................................................... 95 4.7 Injuries .......................................................................................................... 95 Diseases/Morbidity: Strategic Implications ........................................................ 97 Chapter 5. Mortality .................................................................................................... 99 5.1 Leading Causes of Death .............................................................................. 99 Mortality: Strategic Implications ........................................................................ 103

St. Francis Hospital Community Health-‐Needs Assessment
3
IV. PHASE 2 – PRIMARY DATA RESEARCH FOR COMMUNITY HEALTH NEEDS 105 Chapter 6. General Characteristics of Respondents ................................................... 106 6.1 Age ................................................................................................................ 106 6.2 Race and Ethnicity ........................................................................................ 107 6.3 Educational Attainment ................................................................................ 108 6.4 Income Distribution ...................................................................................... 109 6.5 Living Arrangements .................................................................................... 110 6.6 Household Composition ............................................................................... 111 6.7 Employment Status ....................................................................................... 111 6.8 Gender ........................................................................................................... 112 Chapter 7. Findings and Results Community Perceptions .......................................... 113 7.1 Health Problems in the Community ............................................................. 113 7.2 Unhealthy Behaviors .................................................................................... 118 7.3 Issues with Quality of Life ........................................................................... 123 Community Perceptions: Strategic Implications ................................................ 125 Chapter 8. Accessibility to Health Care ...................................................................... 126 8.1 Choice of Medical Care ................................................................................ 126 8.2 Frequency of Checkups ................................................................................ 128 8.3 Access to Medical Care ................................................................................ 131 8.4 Access to Prescription Drugs ........................................................................ 135 8.5 Access to Dental Care ................................................................................... 137 8.6 Access to Counseling .................................................................................... 143 8.7 Access to Information ................................................................................... 147 8.8 Personal Physician ........................................................................................ 147 8.9 Type of Insurance ......................................................................................... 149 Access to Health Care: Strategic Implications ................................................... 149 Chapter 9. Health-Related Behaviors .......................................................................... 151 9.1 Physical Exercise .......................................................................................... 151 9.2 Healthy Eating .............................................................................................. 152 9.3 Smoking ........................................................................................................ 153 9.4 Overall Health ............................................................................................... 155 Healthy Behaviors: Strategic Implications ......................................................... 157 V. PHASE 3 – PRIORITIZATION OF HEALTH-RELATED ISSUES .............................. 159 Chapter 10. Prioritization of Health-Related Issues .................................................... 159 10.1 Summary of Community Health Issues ...................................................... 159 10.2 Community Resources ................................................................................ 161 10.3 Priority of Community Heath-Related Issues ............................................. 167 VI. APPENDIX...................................................................................................................... 170

St. Francis Hospital Community Health-‐Needs Assessment
4
LIST OF EXHIBITS Figure 1. Community Needs Assessment Framework Table 1.1.1-1. Population of Delta County, 2000 and 2010 Table 1.1.1-2. Population of Municipalities in Delta County, 2000 and 2010 Table 1.1.2-1. 2000-2010 Population Growth Rate for Municipalities in Delta County Table 1.2-1. Age Distribution of Delta County Residents, 2010 vs. 2007 Table 1.2-2. Median Age of Residents in Delta County, 2010 vs. 2007 Table 1.2-3. Population of Delta County Region Under 18 Years of Age, 2010 vs. 2007 Table 1.2-4. Population of Delta County 62 Years of Age and Over, 2010 vs. 2007 Table 1.2.2-1. Gender Distribution of Delta County Residents, 2010 vs. 2007 Table 1.2.3-1. Racial Distribution of Delta County Residents, 2010 vs. 2007 Table 1.3-1. Growth Rate in Number of Family Households Delta County, 2007-2010 Table 1.3.1-1. Family Composition in Delta County, 2010 vs. 2007 Table 1.3.3-1. Three-year Growth Rate in the Percentage of Delta County Residents who are Married, but not separated, 2007-2010 Table 1.3.3-2. Three-year Growth Rate in the Percentage of Delta County Residents who are Divorced or Separated, 2007-2010 Table 1.3.3-3. Three-year Growth Rate in the Percentage of Delta County Residents who are Widowed or Never Married, 2007-2010 Table 1.3.4-1. Births to Teenage Mothers in Delta County Region vs. State of Michigan, 2009 vs. 2006 Table 1.4.1-1. Median Household Income for Delta County, 2007 vs. 2010 Table 1.4.2-1. Average Annual Unemployment Rate for Delta County, 2002-2011 Table 1.4.3-1. Percentage of Families Living in Poverty in Delta County, 2010 vs. 2007 Table 1.5.1-1. Grade 3 Student Achievement in Delta County 2011-2012 Table 1.5.1-2. Grade 8 Student Achievement in Delta County 2011-2012 Table 1.5.2-1. High School Graduation Rates in Delta County, 2007-2008 vs. 2010-2011 Table 1.6.1-1. Average Number of Physically Unhealthy Days Reported in the Past 30 Days by Delta County Residents, 2010 vs. 2012 Table 1.6.1-2. Average Number of Mentally Unhealthy Days Reported in the Past 30 Days by Delta County Residents, 2010 vs. 2012 Table 2.1.1-1. Percentage of Delta County Respondents with Health Care Coverage, 2010 vs. 2012 Table 2.1.2-3. Percentage of Delta County Region Respondents with a Usual Health Care Provider, 2005-2007 vs. 2008-2010 Table 2.1.2-4. Percentage of Delta County Region Respondents who have not Visited a Dentist in 2+ Years, 2004-2006 vs. 2007-2009 Table 2.2.2-1. Percentage of Delta County Region Residents with High Cholesterol Table 2.2.2-2. Time Since Last Cholesterol Screening by Delta County Region Residents Table 2.2.2-3. Percentage of Delta County Region Residents with High Blood Pressure Table 2.2.2-4. Percentage of Delta County Region Residents who had a Clinical Breast Exam in the Past Year Table 2.2.2-5 Percentage of Delta County Region Residents Who Had an Appropriately Timed Pap Test within the Past 3 Years

St. Francis Hospital Community Health-‐Needs Assessment
5
Table 2.2.3-1. Percentage of Delta County Region Residents who had a Flu Vaccine in the Past Year Table 2.2.3-2. Percentage of Delta County Region Residents Who ever had the Pneumonia Vaccine Table 2.2.4-1. Percentage of Delta County Region Residents who have not participated in any leisure-time physical activities or exercises during the past month Table 2.2.4-2. Percentage of Delta County Region Residents who have consumed less than 5 servings of fruits/vegetables per day Table 2.2.5-1. Percentage of Delta County Region Residents Missing 6 or more teeth due to gum disease or tooth decay Table 3.1-1. Smoking Status of Residents in Delta County Table 3.2-1. Percent of Delta County Residents at Risk for Acute/Binge Drinking Table 3.3-1. Overweight and Obesity in Delta County Region and State of Michigan Table 4.1.1-1. Percentage Live Births with Low Birth Weight in Delta County, 2010 vs. 2012 Table 4.1.2-1. Percentage of Babies Born with Adequate or Better Prenatal Care based on Kotelchuck Index Scores in Delta County, 2009-2011 Table 4.2.1-1. Inpatient Hypertension Cases at St. Francis Hospital from Delta County Region Table 4.2.2-1. Inpatient Chest Pain – Noncardiac Cases at St. Francis Hospital from Delta County Region Table 4.2.2-2. Inpatient Carditis Cases at St. Francis Hospital from Delta County Region Table 4.2.2-3. Inpatient Congenital Cardiac Anomaly Cases at St. Francis Hospital From Delta County Region Table 4.2.2-4. Inpatient Arterial Embolism Cases at St. Francis Hospital from Delta County Region Table 4.2.2-5. Inpatient Coronary Atherosclerosis Cases at St. Francis Hospital from Delta County Region Table 4.2.2-6. Inpatient Disease of Venous System Cases at St. Francis Hospital from Delta County Region Table 4.2.2-7. Inpatient Dysrhythmia & Cardiac Arrest Cases at St. Francis Hospital from Delta County Region Table 4.2.2-8. Inpatient Heart Failure Cases at St. Francis Hospital from Delta County Region Table 4.2.2-9. Inpatient Heart Valve Disease Cases at St. Francis Hospital from Delta County Region Table 4.2.2-10. Inpatient Myocardial Infarction Cases at St. Francis Hospital from Delta County Region Table 4.2.2-11. Inpatient Other Cardiovascular Disease Cases at St. Francis Hospital from Delta County Region Table 4.2.2-12 Inpatient Vascular Disease Cases at St. Francis Hospital from Delta County Region Table 4.2.3-1. Inpatient Brain Tumor and Stroke Cases at St. Francis Hospital from Delta County Region Table 4.3.1-1. Inpatient Asthma Cases at St. Francis Hospital from Delta County Region Table 4.3.1-2. Percent of Delta County Region Residents Who Still Have Asthma Table 4.3.2-1. Inpatient Pneumonia Including Aspiration Cases at St. Francis Hospital from Delta County Region

St. Francis Hospital Community Health-‐Needs Assessment
6
Table 4.3.3-1. Inpatient Chronic Obstructive Pulmonary Disease Cases at St. Francis Hospital from Delta County Region Table 4.4-1. Ten-Year Age Adjusted Average Incidence Counts of Selected Cancers, 2000- 2009 Table 4.4-2. Five-Year Invasive Cancer Incidence by State at Diagnosis of Delta County Residents, 1985-2009 Table 4.4.1-1. Inpatient Breast Cancer Cases at St. Francis Hospital from Delta County Region Table 4.4.1-2. Inpatient Lung Cancer Cases at St. Francis Hospital from Delta County Region Table 4.4.1-3. Inpatient Prostate Cancer Cases at St. Francis Hospital from Delta County Region Table 4.4.1-4. Inpatient Pancreas Cancer Cases at St. Francis Hospital from Delta County Region Table 4.4.1-5. Inpatient Colorectal Cancer Cases at St. Francis Hospital from Delta County Region Table 4.4.1-6. Inpatient Cervical and Other Female Genital Cancer Including Precancer Cases at St. Francis Hospital from Delta County Region Table 4.4.2-1. Inpatient Leukemia Cases at St. Francis Hospital from Delta County Region Table 4.5-1. Inpatient Type II Cases at St. Francis Hospital from Delta County Region Table 4.5-2. Inpatient Type 1 Cases at St. Francis Hospital from Delta County Region Table 4.5-3. Percent of Delta County Region Residents who have Diabetes Table 4.6.1-1. Chlamydia and Gonorrhea Cases by Selected Age Group, 2006-2011 Table 4.7.1-1 Percentage of Fatal Injuries Attributed to Suicide in Delta County, 2005-2010 Table 4.7.2-1. Percentage of Unintentional Fatal Injuries Attributed to Motor Vehicles, 2005- 2010 Table 5.1-1. Top 5 Leading Causes of Death for all Races by County, 2010 Table 5.1-2. Primary Care Physician Visits per Decadent in the Last Two Years of Life Before Death, 2003-2007 Table 5.1-3. Specialist Care Physician Visits per Decadent in the Last Two Years of Life Before Death, 2003-2007 Table 5.1-4. Primary Care Physician Visits per Decadent in the Last 6 Months of Life Before Death, 2003-2007 Table 5.1-5. Specialists Care Physician Visits per Decadent in the Last 6 Months of Life Before Death, 2003-2007 Table 6.1. Age Distribution for Delta County and Deep Poverty Table 6.2. Race/Ethnicity Distribution for Delta County and Deep Poverty Table 6.3. Highest Educational Attainment for Delta County and Deep Poverty Table 6.4. Income Distribution for Delta County Table 6.5. Living Arrangement Distribution for Delta County and Deep Poverty Table 6.6. Household Composition for Delta County and Deep Poverty Table 6.8. Gender Composition for Delta County and Deep Poverty Table 7.1.1. Delta County Frequencies for Most Important Perceived Health Problems in the Community Table 7.1.2. Frequencies for Most Important Perceived Health Problems in the Community
from Individuals Living in Poverty Table 7.1.3. Significant Correlations among Most Important Perceived Health Problems in the Community and Demographic Variables

St. Francis Hospital Community Health-‐Needs Assessment
7
Table 7.2.1. Delta County Frequencies for Most Important Perceived Unhealthy Behaviors in the Community Table 7.2.2. Frequencies for Most Important Perceived Unhealthy Behaviors in the
Community from Individuals Living in Poverty Table 7.2.3. Significant Correlations among Most Important Perceived Unhealthy Behaviors in the Community and Demographic Variables Table 7.3.1. Delta County Frequencies for Most Important Perceived Factors that Impact Quality of Life Table 7.3.2. Frequencies for Most Important Perceived Factors that Impact Quality of Life from Individuals Living in Poverty Table 7.3.3. Significant Correlations among Most Important Perceived Factors that Impact Quality of Life and Demographic Variables Table 8.1.1. Delta County Frequencies for Choice of Medical Care Table 8.1.2. Frequencies for Choice of Medical Care from Individuals Living in Poverty Table 8.1.3. Significant Correlations among Choice of Health Care and Demographic
Variables Table 8.2.1. Delta County Frequencies for Time Since Last Checkup Table 8.2.2. Frequencies for Time Since Last Checkup from Individuals Living in Poverty Table 8.2.3. Significant Correlations for Time Since Last Checkup Table 8.3.1. Frequencies for “Was there a time when you needed medical care but were not
able to get it?” for Delta County and Individuals Living in Poverty Table 8.3.2. Significant Correlations for “Was there a time when you needed medical care but
were not able to get it?” Table 8.3.3.1. Frequencies for “Why weren’t you able to get medical care?” for Delta County Table 8.3.3.2. Significant Correlations for “Was there a time when you needed medical care but were not able to get it?” Table 8.4.1. Frequencies for “Was there a time when you needed prescription medicine but
were not able to get it?” for Delta County and Individuals Living in Poverty Table 8.4.2. Significant Correlations for “Was there a time in the last year when you needed prescription medication and were unable to get it?” Table 8.4.3. Frequencies for “Why weren’t you able to get prescription medicine?” for Delta County Table 8.4.4. Significant Correlations for Reasons Why Individuals Were Not Able to Obtain Prescription Medication in the Past Year Table 8.5.1. Frequencies for Time Since Last Dental Checkup for Delta County and Individuals Living in Poverty Table 8.5.2. Significant Correlations for Time Since Last Dental Checkup Table 8.5.3 Frequencies for “Was there a time when you needed dental care but were not able to get it?” for Delta County and Individuals Living in Poverty Table 8.5.4 Significant Correlations for “In the last year, was there a time when you needed dental care but could not get it?” Table 8.5.5 Frequencies for “Why weren’t you able to get dental care?” for Delta County Table 8.5.6 Significant Correlations for “Why weren’t you able to get dental care?” Table 8.6.1 Frequencies for “Was there a time when you needed counseling but were not able
to get it?” for Delta County and Individuals Living in Poverty

St. Francis Hospital Community Health-‐Needs Assessment
8
Table 8.6.2 Significant Correlations for “In the last year, was there a time when you needed counseling but could not get it?” Table 8.6.3 Frequencies for “Why weren’t you able to get counseling?” for Delta County Table 8.6.4 Significant Correlations for Reasons Why Individuals Were Not Able to Obtain Counseling in the Past Year Table 8.7.1 Frequencies for “Where do you get most of your medical information?” for Delta County and Individuals Living in Poverty Table 8.8.1 Frequencies for “Do you have a personal physician?” for Delta County and Individuals Living in Poverty Table 8.8.2 Significant Correlations among Access to a Personal Physician and Demographic Variables Table 8.9.1 Frequencies for Insurance Coverage for Delta County and Individuals Living in
Poverty Table 9.1.1 Frequencies for “In the last week, how many times did you exercise?” for Delta
County and Individuals Living in Poverty Table 9.1.2 Significant Correlations among “In the last week, how many times did you exercise?” and Demographic Variables Table 9.2.1 Frequencies for “On a typical day, how many servings of fruits and/or vegetables
do you eat?” for Delta County and Individuals Living in Poverty Table 9.2.2 Significant Correlations among Number of Servings of Fruits and Vegetables
Consumed Daily and Demographic Variables Table 9.3.1 Frequencies for “On a typical day, how many cigarettes do you smoke?” for Delta
County and Individuals Living in Poverty Table 9.3.2 Significant Correlations among Number of Cigarettes Smoked Daily and Demographic Variables Table 9.4.1 Frequencies for “Overall, my physical health is __” for Delta County and
Individuals Living in Poverty Table 9.4.2 Significant Correlations among Overall Physical Health and Demographic Variables Table 9.4.3 Frequencies for “Overall, my physical health is __” for Delta County and
Individuals Living in Poverty Table 9.4.4 Significant Correlations among Overall Mental Health and Demographic Variables Table 10.2 Relationship between Community Resources and Community Needs Figure 10.3 Importance/Urgency Matrix for Community Health Needs

St. Francis Hospital Community Health-‐Needs Assessment
9
EXECUTIVE SUMMARY
The Delta County Community Health-Needs Assessment highlights the health needs and well being of residents in Delta County. Through this needs assessment, collaborative community partners have identified numerous health issues impacting individuals and families in the area. Several themes are prevalent in this health-needs assessment – the demographic composition of the Delta County region, the predictors and prevalence for diseases, leading causes of mortality, accessibility to health services and healthy behaviors.
Results from this study can be used for strategic decision-making purposes as they directly relate to the health needs of the community. The study was designed to assess issues and trends impacting the communities served by OSF St. Francis Hospital, as well as perceptions of targeted stakeholder groups. Specifically, this assessment provides a detailed analysis of: (1) Delta County area community health needs using secondary data; and (2) an assessment of perceptions and behaviors regarding health-related challenges in the community, including accessibility to needed health care.
PHASE I – USE OF SECONDARY DATA TO IDENTIFY NEEDS
Chapters 1-5 include a detailed analysis of secondary data to assess information regarding the health status of the community. In order to perform these analyses, information was collected from numerous secondary sources, including publically available sources as well as private sources of data. Strategic implications are discussed at the end of each chapter. Specifically, Phase I of the study highlights several critical areas:
Demographics – Changing demographics forecasts indicate an increase in chronic conditions such as diabetes, asthma, heart disease, and obesity. Three specific demographic trends in the region will have a significant impact on health issues, including:
Elderly Population – The 62 and older population has seen a significant increase between 2007 and 2010. While individuals aged 62 and over have recently increased from 21.1% to 23.2% in Delta County, national forecasts estimate that individuals over age 65 will increase by one-third by 2022.
Poverty – Families living in poverty increased by 1.3% from 2007 to 2010 and the median annual household income in Delta County is $8,000 less than state averages.
Accessibility to Health Care – The lack of insurance coverage is more prevalent among socioeconomically disadvantaged groups that are often at high risk for disease and illness. Thus, a vicious cycle results where individuals who are at the highest risk for diseases are unable to receive screenings, thus perpetuating a cycle of disease. This is compounded by unhealthy lifestyles. Even though the State of Michigan is trending positively in terms of individuals having identifiable health-care providers, Delta County is trending negatively.
Obesity – Research strongly suggests that obesity is a significant problem facing youth and adults nationally. In Delta County, 41% of people are overweight versus 35.3% in the State of Michigan. Additionally, almost 30% of residents in Delta County are considered obese.

St. Francis Hospital Community Health-‐Needs Assessment
10
Risky Behavior – For those identifying themselves as smokers, Delta County is 8.5% higher than State of Michigan averages. Moreover, there has been a 4.5% increase for those identifying themselves as smokers in Delta County between 2005-2007 and 2008-2010. In contrast, there was a decrease for those identifying themselves as smokers for the State of Michigan during same time frame. Also, in Delta County, 25% of respondents engage in binge drinking versus 18% in the State of Michigan. Both figures exceed the US national 90th percentile benchmark of 8%. Also, alcohol abuse and drug abuse were rated the most prevalent unhealthy behaviors among survey respondents. Specifically those with more education rated alcohol abuse higher and those with a Native American background rated drug abuse higher. Mental Health – While there was a slight decrease in average number of mentally unhealthy days indicated by Delta County residents between 2010 and 2012 from 4 to 3.5 days in the last month, it is 30% higher when compared to the U.S. 90th percentile.
Morbidity Issues – Several different diseases have seen significant growth between 2008-2011.
Hypertension – There are higher rates of hypertension in Delta County (32.5%) versus the State of Michigan (28%). Asthma – Asthma rates are higher in Delta County (17.2%) than in the State of Michigan (15.6%). Diabetes – Type II diabetes rates are higher in Delta County (9.8%) versus rates for the State of Michigan (9.5%).
Mortality – The leading causes of death include diseases of the heart and cancer. However, COPD was higher (6.1%) than the State of Michigan (5.8%).
PHASE II – COLLECTION, ANALYSIS AND INTERPRETATION OF PRIMARY DATA
A comprehensive understanding of targeted stakeholders was completed in Chapters 6-9. Specifically, it was important to understand how “at risk” or economically disadvantaged people perceived: (1) relative importance of health issues; (2) relative importance of unhealthy behaviors; and (3) access to health care, dental care, counseling and prescription medications. Through this type of research, opportunities were identified for improving how community health needs are addressed. Additionally, findings provided insights into how perceptions are affected by demographic characteristics. Critical findings include:
Misperceptions of community health issues – inconsistencies exist between people’s perceptions of health issues and actual data.
Heart disease – Residents in Delta County rate heart disease relatively low compared to actual causes of mortality.
Diabetes – Residents of Delta County also rate diabetes relatively low, even though rates in Delta County are higher than state averages.

St. Francis Hospital Community Health-‐Needs Assessment
11
Perceptions of the importance of access to health services – Access to health services is rated as the highest determinant to quality of life after job opportunities, particular among women and older respondents.
Access to Medical Services – Several issues relating to health service access were identified.
Choice of Medical Care – Only 60% of people living in deep poverty seek medical services at a clinic or doctor’s office. For this segment of the population, it is very common to seek medical services from an emergency department (11%). Those that tend to use the ED for primary care include men, younger people, and less educated people with lower incomes.
Access to Medical Care and Prescription Medications – Thirty percent of the population living in poverty indicated there was a time in the last year when they were not able to get medical care when needed. The leading causes were lack of insurance and inability to afford a copayment or deductible. Similar results were found for access to prescription medication.
Access to Dental Care – While significant research exists linking dental care to numerous diseases, including heart disease, only 55% of the aggregate population had a checkup in the last year and only 31% of those living in poverty had a checkup. Moreover, 25% of those living in poverty have not been to the dentist for 5 or more years. Specifically, younger respondents, Native Americans, lower income, homeless individuals and less educated people were less likely to visit a dentist.
Access to Counseling – Approximately 21% of people living in poverty indicated they were not able to get counseling when they needed it over the last 12 months. Leading indicators are younger people, less educated and homelessness. While affordability and insurance were the leading reasons, fear and embarrassment were also significant.
Access to Information – Across categories, residents of Delta County get most of their medical information from doctors.
Type of Insurance – Across Delta County, the most prevalent type of insurance is private or commercial; however, those living in poverty are disproportionately more reliant on Medicaid. Also for those living in poverty, 30% do not have any type of insurance at all.
Healthy Behaviors – Several issues relating to healthy behaviors were identified.
Physical Exercise – Men are more likely to engage in physical exercise. However, only 13% of the population engages in exercise at least 5 times a week.
Healthy Eating – Less than 2% of the population consumes at least the minimum recommended servings of fruits/vegetables in a day. Those that are more likely to have healthy eating habits include women, people with higher educations and more income, and older people.
Decrease Smoking – Less educated people, men, younger people, Native Americans and homeless people are more likely to smoke.
Self-Perceptions of Health – In terms of self-perceptions of physical and mental health, 95% of the population indicated that they were in average or good physical health. Similar results were found for residents’ self-perceptions of mental health.
St. Francis Hospital Community Health-‐Needs Assessment
12
PHASE III – PRIORITIZATION OF HEALTH-RELATED ISSUES
The identification and prioritization of the most important health-related issues in Delta County are identified in Chapter 10. After summarizing all of the issues in the Community Health Needs Assessment, a comprehensive analysis of existing community resources was performed to identify the efficacy to which health-related issues were being addressed. Finally, a collaborative team of leaders in the healthcare community used an importance/urgency methodology to consider the most critical issues in the area, including:
o Obesity o Risky Behaviors-Substance Abuse o Mental Health o Community Misperceptions o Diabetes
Specific criteria used to identify these issues included: (1) magnitude to the community; (2) strategic importance to the community; (3) existing community resources; (4) potential for impact; and (5) trends and future forecasts.

St. Francis Hospital Community Health-‐Needs Assessment
13
I. INTRODUCTION
Background
The Patient Protection and Affordable Care Act (Affordable Care Act), enacted March 23, 2010 adds new requirements on tax-exempt hospitals to conduct community health-needs assessments and to adopt implementation strategies to meet the community health needs identified through the assessments. This community health-needs assessment (CHNA) takes into account input from specific individuals who represent the broad interest of the community served by OSF/Saint Francis Hospital, including those with special knowledge of or expertise in public health. For this study, a community health-needs assessment is defined as a systematic process involving the community, to identify and analyze community health needs and assets in order to prioritize these needs, and to plan and act upon unmet community health needs. Results from this assessment will be made widely available to the public.
The structure of the CHNA is based on standards used by the Internal Revenue Service to develop Form 990, Schedule H–Hospitals, designated solely for tax-exempt hospitals. The fundamental areas of the community needs assessment are illustrated in Figure 1.
Figure 1. Community Needs Assessment Framework

St. Francis Hospital Community Health-‐Needs Assessment
14
The community health-needs assessment is divided into three distinct phases. Phase I focuses on collection of existing secondary data relating to a comprehensive health profile and drawing strategic inferences. Phase II focuses on primary data collection to assess perspectives of key stakeholders, including those with special knowledge of the health community. Primary data collection includes a concerted effort to target the at-risk population in the region. Phase III focuses on the prioritization of needs within the community.
Design of the Collaborative Team: Community Engagement, Broad Representation and Special Knowledge
In order to engage the entire community in the CHNA process, a collaborative team of health-professional experts and key community advocates was created. Members for the sixteen-person Collaborative team were carefully selected to ensure representation of the broad interests of the community. Specifically, team members included representatives from the OSF/St. Francis Hospital, public health specialists, RNs/physicians and administrators from clinics serving the at-risk population, social-service providers, pastors and representation the United Way. Note that numerous partner and agency organizations also participated in this study. Specific discussion of these organizations can be found in the METHODS section. Engagement occurred throughout the entire process, resulting in shared ownership of the assessment. The entire collaborative team met in November of 2012 and in January of 2013. Additionally numerous meetings were held between the facilitators and specific individuals during the process.
Specifically, members of the Collaborative Team consisted of individuals with special knowledge of and expertise in the health care of the community. Individuals, affiliations, titles and expertise are as follows:
Erik Barnhart is a Medical Social Worker with 19 years of hospice/home health care. He is a certified Advance Care Planning facilitator for OSF Home Care Services. Erik is a lifelong resident of Escanaba area with his wife Diane and six children. Hobbies and activities include cooking, BBQ’ing, sporting events with children, walks and bike rides.
Dave Berg, LMSW is the Chief Operating Officer of Pathways Community Mental Health. He holds a Masters Degree in Social Work from Indiana University and is a Michigan Licensed Social Worker with Clinical and Macro Practice endorsements. Dave has over 20 years of combined clinical and administrative experience in community mental health services in Indiana, Wisconsin, and Michigan. His primary expertise is in adult mental health, outpatient, case management, community support, and emergency services.
Ruth Botbyl is a prevention specialist at Public Health, Delta & Menominee Counties. She received her bachelor's degree in School Health from Mankato State University in Mankato, MN. She has worked for Public Health since 2001 in Alcohol & Other Drug Services with Prevention. She coordinates a community prevention council, Substance Abuse & Violence Education Council of Delta County, (SAVE). Ruth is a member of the Tri-County Safe Harbor Board of Directors, serving as the secretary for the last 2 1/2 years.

St. Francis Hospital Community Health-‐Needs Assessment
15
Mary Busick is a retired special education teacher with 32 years of service. She began working as a case manager at Voices for Youth in 2007 and now works with homeless youth, education, employment, housing and basic needs.
Charlene Carlson spent 21 years as the pastoral associate at St Anne Catholic Church. In retirement, she leads a weekly bible study at St. Anne and a bereavement group in the fall and spring. She is a spiritual director for individual and also works at Marygrove Retreat Center on silent directed retreats. During the two-week fall school, she serves as a spiritual director at Our Lady Of Divine Providence School of Spirituality.
Tamie Cunningham is the Executive Director of Tri-County Safe Harbor, Inc. (formerly known as the Alliance Against Violence and Abuse, Inc), which provides services to domestic violence and sexual assault survivors. She received her bachelor's degree in Forensics and Psychology from Weber State University in Ogden, UT. She has worked for Tri-County Safe Harbor since October 2011 and was the Treasurer of the Tri-County Safe Harbor Board of Directors prior to becoming the Executive Director. Tamie is directly responsible for supervising the organizational and financial operations of Safe Harbor, along with community relations, education and awareness. She is a member of the Substance Abuse and Violence Education (SAVE) Council for Delta County. Tamie's previous experience was working for the United States Air Force as a Program Manager for 13 years.
Joan Ecclesine is the Health/Disabilities Manager for the MDS CAA Early Childhood Program (Menominee-Delta-Schoolcraft Head Start, Early Head Start and Great Start Readiness Programs).
Mary Lu Gaudette works professionally as a broker in securities sales and service representing over 100 investment firms. She retired as a full-time Registered Rep. (insurance agent) from Prudential Ins. Co. in 2001. She has volunteered in many service arenas. Mary Lu became a Vincentian in 2008. She serves as an intake worker in the Escanaba St. Vincent de Paul Financial Service Center, as Treasurer of the St. Anne Conference of St. Vincent de Paul and as the Spiritual Advisor for the Escanaba District Council.
Sandra (Sandy) Guenette is the Manager of Social Services at OSF St. Francis Hospital. She received her Bachelor’s degree in Social Work from Northern Michigan University in 1980. She began her medical social work career in skilled nursing facilities and transitioned to OSF St. Francis Hospital in 1983. Her main areas of focus in caring for patients are discharge planning, information and referral, financial assistance, palliative care and case management. In addition to all aspects of managing the department, she works closely with interdisciplinary team members in all units of the hospital, community physicians groups, home health care and other local service agencies to aid the patient’s experience.

St. Francis Hospital Community Health-‐Needs Assessment
16
Irene Lenbergis the Director of Administrative Support Services at Public Health, Delta & Menominee Counties. She is responsible for human resources and personnel, as well as directing the activities and projects of the IT department. She graduated from Lake Superior State University in 1997 with a Bachelor’s of Science in Accounting. She started at the Health Department as an accountant in 1998, became accounting supervisor in 2004, and Administrative Director in 2009.
Julie Mallard has been the executive director of the United Way of Delta County since 2005. She is originally from Florida, growing up in the Tampa area and earning her Bachelor's degree in Public Relations from the University of Florida. After six years working in public relations and fund development for the local Girl Scout council in Tampa, Julie was ready for a change of scenery. Small-town life seemed appealing and she had family in the U.P., so in the winter of 1994 she moved to Manistique and went to work as marketing director and volunteer coordinator for North Woods Home Nursing and Hospice. She was with North Woods for 11 years as the company expanded to include not only home health and hospice services, but also private duty, outpatient therapy and assisted living. Julie eventually moved to Escanaba to work primarily at North Woods Assisted Living, where she was responsible for sales and marketing of all the North Woods companies as well as activities and communications with tenants and their families at the assisted living facility. In the fall of 2005, the executive director position opened at the United Way of Delta County and Julie returned to her nonprofit roots. She has spent the past seven years building relationships with companies and individual donors, educating the community on the work of the United Way and its affiliated programs, serving in community groups and collaborative boards addressing a variety of issues, from substance abuse to early childhood education and raising hundreds of thousands of dollars each year to be invested back into our community. Julie resides in Escanaba with her teenage daughter and son, is an active volunteer with Escanaba Noon Kiwanis Club and Holy Name Catholic School and enjoys photography.
Deacon Dan Powers has been Executive Director at Catholic Social Services for 3 years. Deacon Dan moved to the UP from San Diego, California where he was ordained a Deacon in 2006. Catholic Social Services is an organization which seeks to nurture and strengthen families in the Upper Peninsula. It has a growing Child Welfare ministry which currently cares for 20 children in its foster care services. The agency also facilitates 6-10 adoptions every year.
Kay Pryal is a Caseworker at Lutheran Social Services, Voices For Youth Program. She works with homeless youth from ages 10 to 21 years old. Her previous social work employment includes Big Brothers Big Sisters mentoring program and a caseworker at Department of Human Services. She received her BSW from Northern Michigan University.
Kathy Ryno, RN, MSN, is the Health Occupation Instructor at the Delta Schoolcraft I.S.D. Career Tech Center in Escanaba, Michigan for the past 19 years. She is also an adjunct faculty member at Bay College in Escanaba for the past ten years. An active member at the YMCA; she is a certified yoga instructor. Kathy started her nursing

St. Francis Hospital Community Health-‐Needs Assessment
17
education at Bay College and completed her BSN from Northern Michigan University, and a Master’s degree in Nursing Education from Bellin College of Nursing in Green Bay, Wisconsin. She has been an officer with the Escanaba Eagle’s Auxillary for the past ten years and belongs to the state Michigan Health Occupation Educators Association as a regional representative and the student organization Health Occupation Students of America. She is a tutor for the Delta County Literacy Council and a member of the County Health Department Family Planning advisory committee.
Caron Salo is the Senior Program /Center Director for the Northern Lights YMCA located in Escanaba and Iron Mountain. She has worked for the YMCA since 1996. At the Delta program center, she is responsible for all aspects of YMCA program development and administration including budget management, marketing, community partnerships, and strategic planning. At the Dickinson Center, Caron oversees the management of the facility including program, membership & community development, budget management, fundraising, and marketing. Currently, Caron is a member of the OSF St. Francis Advisory Board but has also served as a Jaycee and a member of many health related coalitions in our community. Lanna Scannell (CHNA Project Liaison) is the manager of community relations and development for OSF St. Francis Hospital & Medical Group. She received her bachelor’s degree in Journalism and Public Relations from Central Michigan University in Mount Pleasant, MI, and her master of business administration degree from Lake Superior State University in Sault Ste. Marie, MI. She has worked for OSF since 1994, overseeing marketing, community relations, advertising, development and government relation’s efforts, as well as the hospital’s Auxiliary members and volunteers. She is a member of the Delta County Chamber of Commerce board of directors and a co-chair for the Substance Abuse and Violence Education (SAVE) Council for Delta County.
Elsie Stafford is a Registered Nurse and a Licensed Nursing Home Administrator. As a NHA she has managed both long-term care facilities and Assisted Living centers in the State of Michigan since 2001. After graduating with and AAS in nursing, she worked as an RN in many capacities for 40 years, specifically in long term care for over 20 years. Currently she serves on the Bay College nursing advisory board, the Aging and Disability Resource Collaborative of the UP, member of Health Care Association of Michigan and Catholic Health Association. She is directly responsible for directing and supervising the overall operations of the Bishop Noa Home Senior Community.
Jim Wayne has had more than 28 years’ experience with OSF St. Francis Hospital & Medical Group, serving as Chief Financial Officer and Vice President of Finance prior to his retirement on January 30, 2013. As part of his responsibilities, he maintained oversight of the Business Office, Medical Records Department, Foundation and OSF Medical Group physician practices. He was instrumental in leading the Hospital through development of a provider-based medical group – improving reimbursement for physician care – and more recently through the conversion to critical access hospital status. He was a part of a capital campaign in 2000 to bring dialysis services to Delta County; guided OSF through the addition of Home Health services, including a partnership agreement with the former Bay de Noc Hospice to provide end-of-life care to

St. Francis Hospital Community Health-‐Needs Assessment
18
terminally ill patients; and formation of the OSF Medical Group. He has also been actively involved in the community, representing OSF St. Francis Hospital & Medical Group on many service organizations and at various community events, including the Medical Access Coalition of Delta and Menominee counties, Upper Peninsula Healthcare Coalition, United Way of Delta County, Escanaba Noon Kiwanis and the Escanaba Gus Macker and Slamfest community events.
Sherry Whitman has served for the past nine years as Planner/Program Developer and MMAP Regional Coordinator for UPCAP. As the Planner/Program Developer, Ms. Whitman is responsible to draft UPCAP’s U.P. Area Agency on Aging’s Annual Implementation Plan for Older Adults, helping to develop and administer new programs and ensure the quality of existing programs for seniors. She is a Master Trainer for Matter of Balance: Managing Concerns About Falls™ and a certified leader for Creating Confident Caregivers, both evidenced-based prevention programs that teach people how to manage their health & well-being. As MMAP Regional Coordinator, she is responsible to recruit, train, mentor, and supervise over 45 volunteer Medicare/Medicaid Assistance counselors throughout the Upper Peninsula. Additionally, she is on the statewide MMAP Advisory Council and is a Certified Medicaid Specialist. Ms. Whitman graduated from the University of WI-Oshkosh with degrees in Communication and Business Administration.
Mary Williams, RN is a lifelong resident of Escanaba and has been a registered nurse for 22 years. She has worked as a nursing supervisor in both acute and long-term care settings. Mary is the Director of the Medical Access Coalition of Delta & Menominee Counties where she has spent the last 7 years assisting low income, uninsured residents to access medication and affordable healthcare.
In addition to collaborative team members, the following facilitators managed the process and prepared the Community Health Needs Assessment. Their qualifications and expertise are as follows:
Michelle A. Carrothers (Coordinator) is currently the Director of Debt Management and Revenue Cycle for OSF Healthcare System, a position she has served in since 2002. Michelle has over 27 years of health care experience. Michelle obtained both a Bachelor of Science Degree and Masters of Business Administration Degree from Bradley University in Peoria, IL. She attained her CPA in 1984 and has earned her FHFMA certification in 2011. Currently, she serves on the Revenue Cycle Key Performance Indicator Task Force and the National Advisory Council for HFMA National. Michelle chaired the Illinois Hospital Association Medicaid Cost Work Group and was a member of the IHA task force that developed the statewide Community Benefit Report that is submitted to the Attorney General’s Office. Dawn Irion (Coordinator) is the Community Benefits Coordinator at OSF Healthcare System. She has worked for OSF Healthcare system since 2004 and has helped coordinate the submission of the Community Benefit Attorney General report since 2008. She has coordinated and gathered information used in filing IRS Form 990
St. Francis Hospital Community Health-‐Needs Assessment
19
Schedule H since 2009 and is a member of Healthcare Financial Management Association.
Eric J. Michel (Research Associate) MBA, is a faculty member in Leadership at Christopher Newport University in Newport News, VA. Previously, he served on the faculty of the Foster College of Business at Bradley University in Peoria, IL. Professor Michel has coauthored over a dozen papers on leadership and organizational strategy for presentations at national conferences and for publication in academic journals. He serves as a consultant to not-for-profit and healthcare organizations in the areas of executive development and community assessment. Dr. Laurence G. Weinzimmer (Principal Investigator) Ph.D. is the Caterpillar Inc. Professor of Strategic Management in the Foster College of Business at Bradley University in Peoria, IL. An internationally recognized thought leader in organizational strategy and leadership, he is a sought-after consultant to numerous Fortune 100 companies and not-for-profit organizations. Dr. Weinzimmer has authored over 100 academic papers and four books, including two national best sellers. His work appears in 15 languages, and he has been widely honored for his research accomplishments by many prestigious organizations, including the Academy of Management. Dr. Weinzimmer has served as principle investigator for numerous community assessments, including the United Way, Economic Development Council and numerous hospitals.
Definition of the Community
In order to determine the geographic boundaries for the primary and secondary markets for OSF/Saint Francis Hospital, analyses were completed to identify what percentage of inpatient and outpatient activity was represented from Delta County. Data show that Delta County represents over 80% of all patients.
In terms of patient categories for this CHNA, in addition to defining the community by geographic boundaries, this study will target the at-risk populations as an area of potential opportunity to improve the health of this population.
Purpose of the Community Health-Needs Assessment
In the initial meeting, the collaborative committee identified the purpose of this study. Specifically, this study has been designed to provide necessary information to health-care organizations, including hospitals, clinics and the health departments, in order to create strategic plans in program design, access and delivery. Results of this study will act as the platform to allow health-care organizations to orchestrate limited resources to improve management of high-priority challenges. By working together, the hospital, clinics and health departments will use this CHNA to help improve the quality of health care in the defined community. When feasible, data are assessed longitudinally to assess changes and patterns and benchmarked with state averages.

St. Francis Hospital Community Health-‐Needs Assessment
20
II. METHODS To complete the comprehensive community health-needs assessment, multiple sources
were examined. Secondary statistical data were used for the first phase of the project. Additionally, based on a sample of 871 survey respondents from Delta County, phase two focused on assessing perceptions of the community health issues, unhealthy behaviors, issues with quality of life, healthy behaviors and access to health care. Data were collected to assess the importance of specific issues, as well as access to health care. Phase I. Secondary Data for Community Health Needs Assessment
We first used existing secondary statistical data to develop an overall assessment of the health-related issues in the community. Note that several tables were aggregated from numerous data sources. Five chapters were completed based on assessment of secondary data. Each chapter contains numerous categories. Within each category, there are specific sections, including definitions, importance of categories, data and interpretations. At the end of each chapter there is a section on the key strategic implications that can be drawn from the data. Note that most of the data used for this phase was acquired via publically available data sets. However, for specific sections of Chapter 2 and the majority of Chapter 4, the most recent data available were from 2009. Given a purpose of this assessment is to measure subsequent improvements to community health over time, using data that are three-four years old is not sufficient. Therefore we used COMPdata from 2008-2011 for all of our disease categories. This required manual aggregation of data. Based on several retreats, a collaborative team of experts from the OSF System identified six primary categories of diseases, including: age related, cardiovascular, respiratory, cancer, Type II diabetes and infections. We also identified secondary causes of diseases as well as intentional and unintentional injuries. In order to define each disease category, we used modified definitions developed by Sg2. Sg2 specializes in consulting for health care organizations. Their team of experts includes MDs, PhDs, RNs and health care leaders with extensive strategic, operational, clinical, academic, technological and financial experience.
Phase II. Primary Data Collection
This section describes the research methods used to collect, code, verify and analyze primary data. Three specific areas include the research design used for this study: survey design, data collection and data integrity.
A. Survey Instrument Design
Initially, all surveys used in previous health-needs assessments that we were able to identify were assessed to identify common themes and approaches to collecting community health-needs data. In all, 15 surveys were identified. By leveraging best practices from these surveys, we created our own pilot survey. To ensure that all critical areas were being addressed, a collaborative team of experts from the OSF System were involved in survey design/approval

St. Francis Hospital Community Health-‐Needs Assessment
21
through several fact-finding sessions. Specifically, for the community health need assessment, five specific areas were included:
Ratings of health problems in the community – to assess the importance of various community health concerns. Survey items included areas assessing topics such as cancer, diabetes and obesity. In all, there were 20 choices provided for survey respondents.
Ratings of unhealthy behaviors in the community – to assess the importance of various unhealthy behaviors. Survey items included areas assessing topics such as violence, drug abuse and smoking. In all, there were 14 choices provided for survey respondents.
Ratings of issues with quality of life – to assess the importance of various issues relating to quality of life in the community. Survey items included areas assessing topics such as access to health care, safer neighborhoods and effective public transportation. In all, there were nine choices provided for survey respondents.
Accessibility to health care – to assess the degree to which residents could have access to health care when needed. Survey items included areas assessing topics such as access to medical, dental and mental care, as well as access to prescription drugs.
Healthy behaviors – to assess the degree to which residents exhibited healthy behaviors. The survey focused on areas such as exercise, healthy eating habits and smoking.
Finally, demographic information was collected to assess background information necessary to segment markets in terms of the five categories discussed above.
After the initial survey was designed, a pilot study was created to test the psychometric properties and statistical validity of the survey instrument. The pilot study was conducted at the Heartland Community Health Clinic’s three facilities. The Heartland Clinic was chosen as it serves the at-risk population and is located in close proximity to the OSF corporate facilities. This was necessary to create a standardized survey instrument for all hospitals in the OSF System. A total of 130 surveys were collected. Results from the pilot survey revealed specific items to be included/excluded in the final survey instrument. Selection criteria for the final survey included validity, reliability and frequency measures based on responses from the pilot sample. Note that these surveys were not included in the final sample. A copy of the final survey is included in Appendix 1.
B. Sample Size
In order to identify our potential population, we first identified the percentage of the Delta County population that was living in poverty. Specifically, we multiplied the population of the county by its respective poverty rate to identify the minimum sample size to study the at-risk

St. Francis Hospital Community Health-‐Needs Assessment
22
population. The poverty rate for Delta County was 12.7%. The total population used for Delta County in 2011 was 37,106, yielding a total of 4,713 residents living in poverty.
We assumed a normal approximation to the hypergeometric given the targeted sample size.
n = (Nz2pq)/(E2 (N-1) + z2 pq
where:
n = the required sample size
N = the population size
pq = population proportions (set at .05)
z = the value that specified the confidence interval (use 95% CI)
E =desired accuracy of sample proportions (set at +/- .05)
For Delta County, the minimum sample size for those living in poverty was 352 respondents. Final results for data collection yielded a total of 544 respondents living in poverty for this CHNA and data for the total aggregate population yielded a total of 871 usable responses. This more than met the threshold of the desired 95% confidence interval. Specifically, these numbers approached the threshold for achieving a 99% confidence interval for those living in poverty and exceeded the 99% confidence interval threshold for the aggregate population.
C. Data Collection
To collect data in this study, two techniques were used. First, an online version of the survey was created. Additionally paper surveys were used. Second, a paper version of the survey was distributed.
To specifically target the at-risk population, surveys were distributed at the Community Thanksgiving Dinner, the Community Christmas Dinner, the senior luncheon, at blood drives and in churches. Specific partner organizations included the Salvation Army, St. Vincent DePaul, the Medical Access Coalition, Voices for Youth, the Alliance Against Victims and Abuse, the Community Action Agency and the County Health Department. Note that since we specifically targeted the at-risk population as part of the data collection effort, this became a stratified sample, as we did not specifically target other groups based on their socio-economic status. However, when using convenience-sampling techniques, we made a concerted effort to assure randomness in order to mitigate potential bias in the sample.
D. Data Integrity
Comprehensive analyses were performed to verify the integrity of the data for this research. Without proper validation of the raw data, any interpretation of results could be inaccurate and

St. Francis Hospital Community Health-‐Needs Assessment
23
misleading if used for decision making. Therefore, several tests were performed to ensure that the data were valid. These tests were performed before any analyses were undertaken. Data were checked for coding accuracy, using descriptive frequency statistics to verify that all data items were coded correctly. This was followed by analyses of means and standard deviations and comparison of primary data statistics to existing secondary data. Additionally, for regression models, residual analyses were performed to ensure that the data met assumptions of the underlying models. Specifically, residuals were analyzed to make sure (1) the data were normally distributed, (2) no patterns existed among residuals (e.g., heteroscedasticity) and (3) no significant outliers biased the outputs.
E. Analytic Techniques
In order to ensure statistical validity, we used several different analytic techniques to assess data. Specifically, frequencies and descriptive statistics were used for identifying patterns in residents’ rating of various health concerns. Additionally appropriate statistical techniques were used for identification of existing relationships between perceptions, behaviors and demographic data. Specifically, we used Pearson correlations, x2 tests and tetrachoric correlations when appropriate, given characteristics of the specific data being analyzed.

St. Francis Hospital Community Health-‐Needs Assessment
24
PHASE I – SECONDARY DATA RESEARCH FOR
COMMUNITY HEALTH NEEDS
In this section of the community health needs assessment, there are five chapters that assess different aspects of the general community as well as specific health-related issues. All of the information in this section is taken from secondary data sources. As described in the METHODS section, some data sources are publically available and other data sources are comprised of aggregated hospital data from 2011.
The chapters are as follows:
CHAPTER 1. DEMOGRAPHIC PROFILE
CHAPTER 2. PREVENTION
CHAPTER 3. SYMPTOMS/PREDICTORS
CHAPTER 4. DISEASES/MORBIDITY
CHAPTER 5. MORTALITY
St. Francis Hospital Community Health-‐Needs Assessment
25
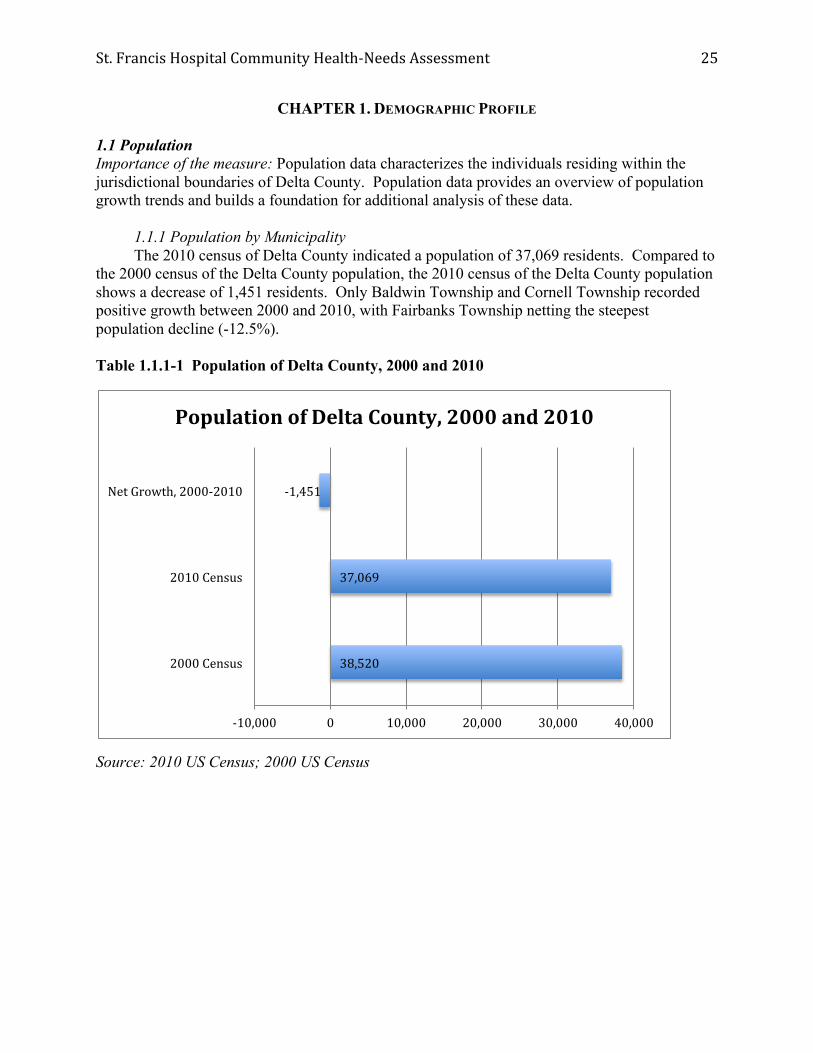
CHAPTER 1. DEMOGRAPHIC PROFILE 1.1 Population Importance of the measure: Population data characterizes the individuals residing within the jurisdictional boundaries of Delta County. Population data provides an overview of population growth trends and builds a foundation for additional analysis of these data. 1.1.1 Population by Municipality The 2010 census of Delta County indicated a population of 37,069 residents. Compared to the 2000 census of the Delta County population, the 2010 census of the Delta County population shows a decrease of 1,451 residents. Only Baldwin Township and Cornell Township recorded positive growth between 2000 and 2010, with Fairbanks Township netting the steepest population decline (-12.5%). Table 1.1.1-1 Population of Delta County, 2000 and 2010
Source: 2010 US Census; 2000 US Census
38,520
37,069
-‐1,451
-‐10,000 0 10,000 20,000 30,000 40,000
2000 Census
2010 Census
Net Growth, 2000-‐2010
Population of Delta County, 2000 and 2010

St. Francis Hospital Community Health-‐Needs Assessment
26
Table 1.1.1-2 Population of Municipalities in Delta County, 2000 and 2010
County/Municipality 2000 Census 2010 Census Net Growth rate, 2000-2010
Delta County 38,520 37,069 -3.7%
Baldwin township 748 759 1.5%
Bark River township 1,650 1,578 -4.2%
Bay de Noc township 329 305 -7.3%
Brampton township 1,090 1,050 -3.7%
Cornell township 557 593 6.5%
Ensign township 780 748 -4.1%
Escanaba city 13,140 12,616 -4.0%
Escanaba township 3,587 3,482 -2.9%
Fairbanks township 321 281 -12.5%
Ford River township 2,241 2,054 -8.1%
Garden township 817 750 -8.2%
Gladstone city 5,032 4,973 -1.2%
Maple Ridge township 808 766 -5.4%
Masonville township 1,877 1,734 -7.6%
Nahma township 499 495 -0.8%
Wells township 5,044 4,885 -3.2%
Source: 2010 US Census; 2000 US Census

St. Francis Hospital Community Health-‐Needs Assessment
27
1.1.2 Growth Rates Data from the last three censuses (1990, 2000, 2010) indicate varied population growth for Delta County. Between 1990 and 2000, the population of Delta County increased by 1.9%. However, during the time period 2000-2010, the population of Delta County decreased by 3.7%. Of the sixteen municipalities in Delta County, fourteen municipalities experienced negative population growth between 2000 and 2010.
Table 1.1.2-1 2000-2010 Population Growth Rate for Municipalities in Delta County
Source: 2010 US Census; 2000 US Census
-‐3.2%
-‐0.8%
-‐7.6%
-‐5.4%
-‐1.2%
-‐8.2%
-‐8.1%
-‐12.5%
-‐2.9%
-‐4.0%
-‐4.1%
6.5%
-‐3.7%
-‐7.3%
-‐4.2%
1.5%
-‐15.0% -‐10.0% -‐5.0% 0.0% 5.0% 10.0%
Wells township
Nahma township
Masonville township
Maple Ridge township
Gladstone city
Garden township
Ford River township
Fairbanks township
Escanaba township
Escanaba city
Ensign township
Cornell township
Brampton township
Bay de Noc township
Bark River township
Baldwin township
2000-‐2010 Population Growth Rate for Municipalities in Delta County
2000-‐2010 Population Growth Rate

St. Francis Hospital Community Health-‐Needs Assessment
28
1.2 Age, Gender and Race Distribution Importance of the measure: Population data broken down by age groups, gender, and race provides a foundation to analyze the issues and trends that impact demographic factors including economic growth and the distribution of health care services. Understanding the cultural diversity of communities is essential when considering health care infrastructure and service delivery systems. 1.2.1 Age
As indicated in Table 1.2-1, individuals between 60-64 years of age is the age group experiencing the strongest growth in Delta County between 2007 and 2010, as this population increased from 5.1% of the population in 2007 to 7.3% of the population in 2010. Conversely, the age group experiencing the most significant decline is individuals between 20-24 years of age.
Table 1.2-1 Age Distribution of Delta County Residents, 2010 vs. 2007
Source: 2010 US Census; 2007 American Community Survey
5.4%
5.7%
6.0%
6.3%
4.7%
9.8%
11.2%
15.9%
8.5%
7.3%
9.7%
6.7%
2.7%
5.3%
5.3%
6.3%
6.9%
6.5%
10.2%
12.3%
16.7%
7.2%
5.1%
8.8%
6.5%
2.8%
0.0% 2.0% 4.0% 6.0% 8.0% 10.0% 12.0% 14.0% 16.0% 18.0%
Under 5 yrs
5 -‐ 9
10 -‐ 14
15 -‐ 19
20 -‐ 24
25 -‐ 34
35 -‐ 44
45 -‐ 54
55 -‐ 59
60 -‐ 64
65 -‐ 74
75 -‐ 84
85 yrs and over
Age Distribution of Delta County Residents, 2010 vs. 2007
Delta County 2010 Delta County 2007

St. Francis Hospital Community Health-‐Needs Assessment
29
With the increase in the population of older individuals in Delta County, the median age of residents has also increased. The median age of residents in Delta County in 2010 was 45.6 compared to 43.4 in 2007. The growth in the population of older adults compounded by the decline in the population of younger adults contributed to the increase in median age.
Table 1.2-2 Median Age of Residents in Delta County, 2010 vs. 2007
Source: 2010 US Census; 2007 American Community Survey
45.6
43.4
35
37
39
41
43
45
47
Median Age of Residents in Delta County
Delta County 2010
Delta County 2007

St. Francis Hospital Community Health-‐Needs Assessment
30
Data from 2010 suggest a gradual decline in the populations of youths. Across Delta County, youths under 18 years of age comprise approximately 20% of the population. The under 18 population has decreased in Delta County from 21.1% to 20.9% between 2007 and 2010.
Table 1.2-3 Population of Delta County Under 18 Years of Age, 2010 vs. 2007
Source: 2010 US Census; 2007 American Community Survey
The national trend concerning the aging of the baby-boomer population is reflected in the 2010 data for Delta County. Between 2007 and 2010, the percentage of older adults, age 62 and over, has increased by 2.1% in Delta County.
Table 1.2-4 Population of Delta County Region 62 Years of Age and Over, 2010 vs. 2007
Source: 2010 US Census; 2007 American Community Survey
20.90%
21.10%
20.8%
20.9%
20.9%
21.0%
21.0%
21.1%
21.1%
21.2%
Delta County 2010 Delta County 2007
Population of Delta County Under 18 Years of Age, 2010 vs. 2007
23.2%
21.1%
16.0%
17.0%
18.0%
19.0%
20.0%
21.0%
22.0%
23.0%
24.0%
Population of Delta County Region 62 Years of Age and Over, 2010 vs. 2007
Delta County 2010 Delta County 2007

St. Francis Hospital Community Health-‐Needs Assessment
31
1.2.2 Gender The gender distribution of Delta County residents has remained relatively consistent between 2007 and 2010. Data indicates that there are more women than men.
Table 1.2.2-1 Gender Distribution of Delta County Residents, 2010 vs. 2007
Source: 2010 US Census; 2007 American Community Survey
50.5%
50.8%
49.5% 49.2%
48.0%
49.0%
50.0%
51.0%
2010 2007
Delta County
Female population Male population
St. Francis Hospital Community Health-‐Needs Assessment
32
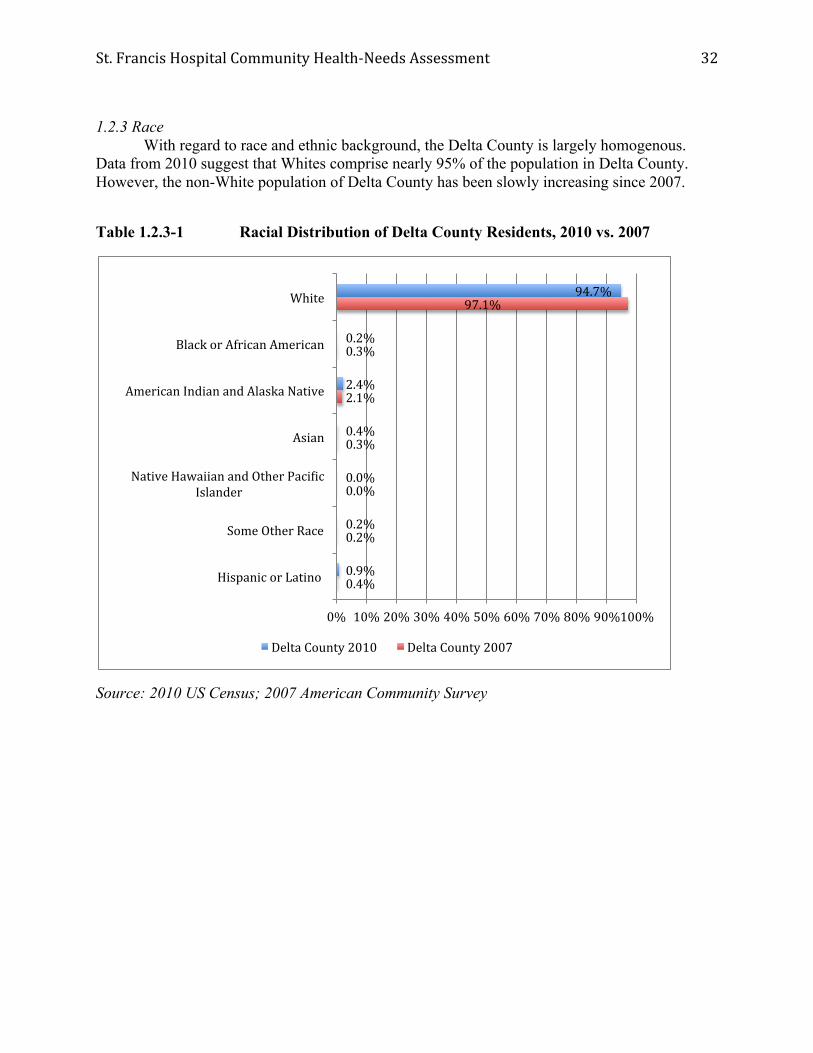
1.2.3 Race With regard to race and ethnic background, the Delta County is largely homogenous. Data from 2010 suggest that Whites comprise nearly 95% of the population in Delta County. However, the non-White population of Delta County has been slowly increasing since 2007.
Table 1.2.3-1 Racial Distribution of Delta County Residents, 2010 vs. 2007
Source: 2010 US Census; 2007 American Community Survey
94.7%
0.2%
2.4%
0.4%
0.0%
0.2%
0.9%
97.1%
0.3%
2.1%
0.3%
0.0%
0.2%
0.4%
0% 10% 20% 30% 40% 50% 60% 70% 80% 90% 100%
White
Black or African American
American Indian and Alaska Native
Asian
Native Hawaiian and Other PaciWic Islander
Some Other Race
Hispanic or Latino
Delta County 2010 Delta County 2007

St. Francis Hospital Community Health-‐Needs Assessment
33
1.3 Household/family
Importance of the measure: Families are the backbone of society in Delta County, as they dramatically impact the health and development of children and provide support and well-being for older adults. As indicated in Table 1.3-1, the number of family households within Delta County increased between 2007 and 2010 by 1.4%.
Table 1.3-1 Growth Rate in Number of Family Households within Delta County, 2007-2010
Source: 2010 US Census; 2007 American Community Survey
1.40%
0.00%
0.20%
0.40%
0.60%
0.80%
1.00%
1.20%
1.40%
1.60%
Delta County
2007-‐2010 Growth Rate
St. Francis Hospital Community Health-‐Needs Assessment
34
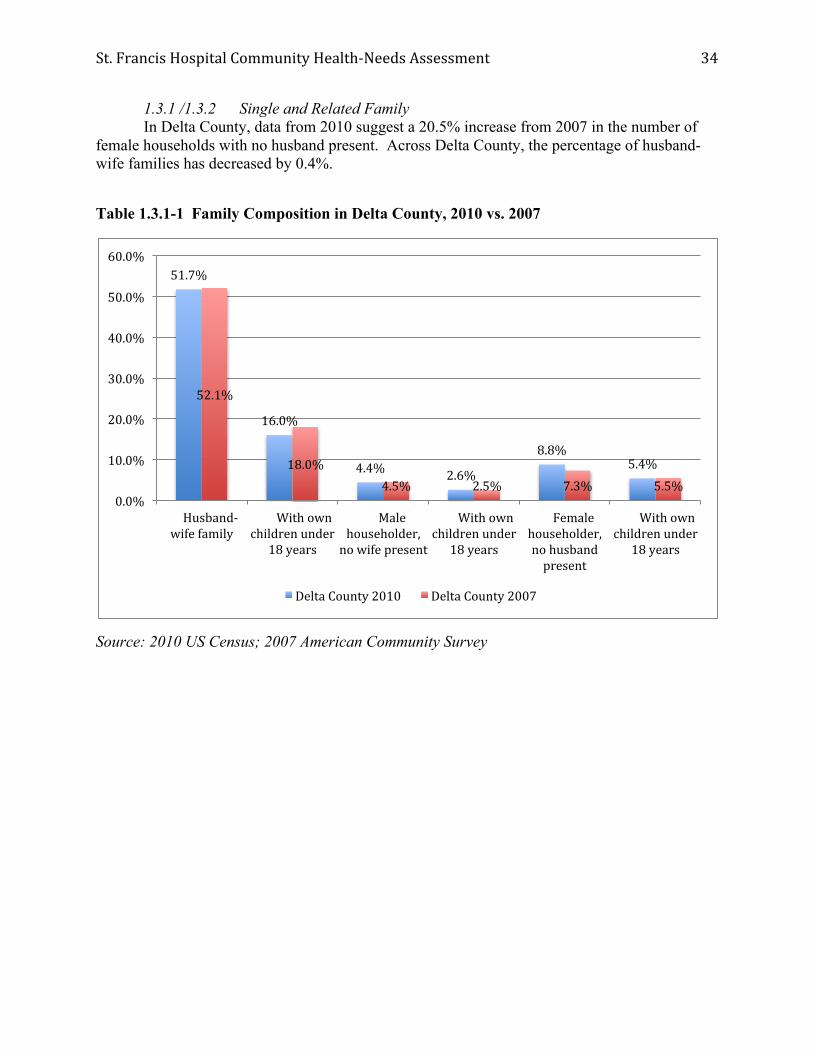
1.3.1 /1.3.2 Single and Related Family In Delta County, data from 2010 suggest a 20.5% increase from 2007 in the number of female households with no husband present. Across Delta County, the percentage of husband-wife families has decreased by 0.4%.
Table 1.3.1-1 Family Composition in Delta County, 2010 vs. 2007
Source: 2010 US Census; 2007 American Community Survey
51.7%
16.0%
4.4% 2.6%
8.8% 5.4%
52.1%
18.0% 4.5% 2.5% 7.3% 5.5%
0.0%
10.0%
20.0%
30.0%
40.0%
50.0%
60.0%
Husband-‐wife family
With own children under
18 years
Male householder, no wife present
With own children under
18 years
Female householder, no husband present
With own children under
18 years
Delta County 2010 Delta County 2007

St. Francis Hospital Community Health-‐Needs Assessment
35
1.3.3 Marital status Between 2007 and 2010, Delta County experienced a 0.2% growth rate in the percentage of residents who are married but not separated. These findings run counter to data from the State of Michigan which suggest a decline of 2.3% during the same time period.
Table 1.3.3-1 Three-year Growth Rate in the Percentage of Delta County Residents who are Married, but not Separated, 2007-2010
Source: 2010 US Census; 2007 American Community Survey
0.2%
-‐2.3% -‐3.0%
-‐2.0%
-‐1.0%
0.0%
1.0%
2.0%
3.0%
4.0%
5.0%
6.0%
Delta County State of Michigan
Three-‐year Growth Rate in the Number of Delta County Residents who are
Married, but not Separated, 2007-‐2010

St. Francis Hospital Community Health-‐Needs Assessment
36
The three-year growth rate in the percentage of Delta County residents who are divorced (0.2%) is lower than the State of Michigan average (0.5%). The three-year growth rate in the percentage of Delta County residents who are separated (0.2%) is greater than the State of Michigan average (0%).
Table 1.3.3-2 Three-year Growth Rate in the Percentage of Delta County Residents who are Divorced or Separated, 2007-2010
Source: 2010 US Census; 2007 American Community Survey
0.2%
0.5%
0.2%
0% 0.0%
0.2%
0.4%
0.6%
Delta County State of Michigan
Three-‐year Growth Rate in the Number of Delta County
Residents who are Divorced or Separated, 2007-‐2010
Divorced
Separated

St. Francis Hospital Community Health-‐Needs Assessment
37
The percentage of residents in Delta County who are widowed or never married are trending in opposite directions compared with State of Michigan averages between 2007 and 2010. The percentage change of non-married residents in Delta County between 2007 and 2010 is considerably less than the State of Michigan average.
Table 1.3.3-3 Three-year Growth Rate in the Percentage of Delta County Residents who are Widowed or Never Married, 2007-2010
Source: 2010 US Census; 2007 American Community Survey
-‐0.4%
0.1%
-‐0.1%
1.8%
-‐1.0% -‐0.5% 0.0% 0.5% 1.0% 1.5% 2.0%
Delta County State of Michigan
Three-‐year Growth Rate in the Number of Delta County
Residents who are Widowed or Never Married, 2007-‐2010
Widowed
Never Married

St. Francis Hospital Community Health-‐Needs Assessment
38
1.3.4 Early Sexual Activity Leading to Births from Teenage Mothers With regard to teenage birth rates, Delta County has a significantly lower teen birth rate in relation to the State of Michigan for both 2005-2007 and 2008-2010. Table 1.3.4-1: Births to Teenage Mothers per 1000 Females in Delta County vs. State of Michigan, 2005-2007 vs. 2008-2010.
Source: Michigan Department of Community Health
1.4 Economic information Importance of the measure: Median income divides households into two segments with one half of households earning more than the median income and the other half earning less. Because median income is not significantly impacted by unusually high or low-income values, it is considered to be a more reliable indicator than average income. To live in poverty means to not have enough income to meet one’s basic needs. Accordingly, poverty is associated with numerous chronic social, health, education, and employment conditions.
1.4.1 Median income level
For 2007 and 2010, the median household income in Delta County lagged behind the State of Michigan median household income.
30.2
51.1
30.3
53.8
0.0
10.0
20.0
30.0
40.0
50.0
60.0
Delta County State of Michigan
Births to Teenage Mothers per 1000 Females in Delta County vs. State of Michigan, 2005-‐2007 vs. 2008-‐2010
2008-‐2010
2005-‐2007

St. Francis Hospital Community Health-‐Needs Assessment
39
Table 1.4.1-1: Median Household Income for Delta County, 2007 vs. 2010
Source: 2007 & 2010 American Community Survey
1.4.2 Unemployment The Delta County unemployment rates parallel both the State of Michigan and national trends. Unemployment in Delta County was higher than the state average until 2008, when the rate of unemployment in Delta County was lower than the state average.
Table 1.4.2-1: Average Annual Unemployment Rate for Delta County, 2002-2011
Source: Bureau of Labor Statistics
$40,496 $48,432
$37,884
$48,642
$0
$10,000
$20,000
$30,000
$40,000
$50,000
$60,000
Delta County State of Michigan
Median Household Income for Delta County, 2007 vs. 2010
2010
2007
0.0% 2.0% 4.0% 6.0% 8.0% 10.0% 12.0% 14.0% 16.0%
Average Unemployment Rate for Delta County, 2002-‐2011
Delta County
State of Michigan

St. Francis Hospital Community Health-‐Needs Assessment
40
1.4.3 Families in poverty
Poverty has a significant impact on the development of children and youth. Poverty rates in Delta County are significantly higher for single-mother led households compared to married-couple families and all families.
Table 1.4.3-1: Percentage of Families Living in Poverty in Delta County, 2010 vs. 2007
Source: 2010 and 2007 American Community Survey 1.5 Education Importance of the measure: According to the National Center for Educational Statistics, “the better educated a person is, the more likely that person is to report being in ‘excellent’ or ‘very good’ health, regardless of income” (NCES, 2005). Educational attainment and reading/math scores are well researched, with findings strongly related to an individual’s propensity to earn a higher salary, gain better employment, and foster multifaceted success in life. As such, research suggests that the higher the level of educational attainment and the more successful children are in school, the better one’s heath will be and the greater likelihood of one selecting healthy lifestyle choices.
1.5.1 3rd/8th grade reading and math
In 2011-2012, 6 of the 8 school districts in Delta County had higher averages than the State of Michigan average (36% “not proficient”) for the percentage of 3rd grade students who were “not proficient” at math. These districts included Bark River-Harris (55% “not proficient”), Big Bay De Noc (44% “not proficient”), Manistique Area (41% “not proficient”), Mid Peninsula (54% “not proficient”), Nah Tah Wahsh Public (64% “not proficient”), and Rapid River Public (58% “not proficient”). Two school districts underperformed the State of Michigan
0.0% 5.0% 10.0% 15.0% 20.0% 25.0% 30.0% 35.0% 40.0%
2010 2007 2010 2007
Delta County State of Michigan
Percentage of Families Living in Poverty in Delta County, 2010 vs. 2007
All families
Married-‐couple families
Female householder, no husband present

St. Francis Hospital Community Health-‐Needs Assessment
41
(11% “not proficient”) in terms of 3rd grade readings scores: Mid Peninsula (15% “not proficient”) and Rapid River Public (16% “not proficient”).
Table 1.5.1-1 Grade 3 Student Achievement in Delta County 2011-2012
Note: Bark River-Harris, Big Bay De Noc, Gladstone Area, and Manistique Area all reported that less than 5% of 3rd grade students were “not proficient” at reading. Precise percentages were not reported.
Source: Michigan Department of Education, 2011-2012 School Report Card, mischooldata.org
7%
15%
9%
16%
11%
55%
44%
26%
27%
41%
54%
64%
58%
36%
0% 10% 20% 30% 40% 50% 60% 70%
Bark River-‐Harris
Big Bay De Noc
Escanaba Area Public
Gladstone Area
Manistique Area
Mid Peninsula
Nah Tah Wahsh Public
Rapid River Public
State of Michigan
Percentage of 3rd Grade Students Deemed "Not ProVicient" at Reading and Math in
Delta County 2011-‐2012
2012 Reading 2012 Math

St. Francis Hospital Community Health-‐Needs Assessment
42
Similarly, in 2011-2012, 5 of the 8 school districts in Delta County had higher averages than the State of Michigan average (39% “not proficient”) for the percentage of 8th grade students who were “not proficient” at math. These districts included Bark River-Harris (52% “not proficient”), Big Bay De Noc (81% “not proficient”), Gladstone Area (42% “not proficient”), Mid Peninsula (53% “not proficient”), and Nah Tah Wahsh Public (45% “not proficient). Four school districts underperformed the State of Michigan (11% “not proficient”) in terms of 8th grade readings scores: Big Bay De Noc (22% “not proficient”), Mid Peninsula (40% “not proficient”), Nah Tah Wahsh Public (45% “not proficient), and Rapid River Public (16% “not proficient”).
Table 1.5.1-2 Grade 8 Student Achievement in Delta County 2011-2012
Source: Michigan Department of Education, 2011-2012 School Report Card, mischooldata.org
6%
22%
10%
14%
14%
40%
45%
16%
11%
52%
81%
39%
42%
37%
53%
45%
28%
39%
0% 10% 20% 30% 40% 50% 60% 70% 80% 90%
Bark River-‐Harris
Big Bay De Noc
Escanaba Area Public
Gladstone Area
Manistique Area
Mid Peninsula
Nah Tah Wahsh Public
Rapid River Public
State of Michigan
Percentage of 8th Grade Students Deemed "Not ProVicient" at Reading and Math in
Delta County 2011-‐2012
Reading Math

St. Francis Hospital Community Health-‐Needs Assessment
43
1.5.3 High School graduation rates
High school graduation rates in 2007-2008 and 2010-2011 in Delta County are above the state average (which is 75.5% and 74.33% for years 2007-2008 and 2010-2011, respectively). Two districts experienced a decline in graduation rates between 2007-2008 and 2010-2011 (Big Bay De Noc and Gladstone Area).
Table 1.5.3-1 High School Graduation Rates in Delta County, 2007-2008 vs. 2010-2011
Source: Michigan Department of Education, 2007-2008 and 2010-2011 School Report Cards, mischooldata.org
1.6 People with Disabilities Importance of the measure: According to the US Census Bureau, a disability can be a long-lasting physical, mental or emotional condition. This condition can make it difficult for a person to do activities such as walking, climbing stairs, dressing, bathing, learning, or remembering. This condition can also impede a person from being independent, from being able to go outside the home alone or to work at a job or business. This condition can also impact a person’s ability to achieve an education and can influence a person’s ability to access appropriate health care.
1.6.1 Physical
In 2012, residents of Delta County reported experiencing 3.6 days per month in which he or she felt physically unhealthy. While this is an improvement since 2010, the figures for Delta County exceed the state average and national benchmarks pegged to data from the Center for Disease Control Behavioral Risk Factor Surveillance System database.
91.67% 94.29% 88.89% 91.24% 83% 92.31% 92.50% 75.50%
94.29% 91.67% 93.55% 86.84% 85.71% 94.74% 96.40% 74.33%
0% 20% 40% 60% 80% 100% 120%
High School Graduation Rates in Delta County, 2007-‐2008 vs. 2010-‐2011
2007-‐2008 2010-‐2011

St. Francis Hospital Community Health-‐Needs Assessment
44
Table 1.6.1-1 Average Number of Physically Unhealthy Days Reported in the Past 30 Days by Delta County Residents, 2010 vs. 2012
Source: Michigan Behavioral Risk Factor Surveillance System
1.6.2 Mental In 2012, residents of Delta County reported experiencing 3.5 days per month in which he or she felt mentally unhealthy. While this is an improvement since 2010, the figures for Delta County are less than the state average, yet lag national benchmarks pegged to data from the Center for Disease Control Behavioral Risk Factor Surveillance System database.
Table 1.6.1-2 Average Number of Mentally Unhealthy Days Reported in the Past 30 Days by Delta County Residents, 2010 vs. 2012
Source: Michigan Behavioral Risk Factor Surveillance System
0.0
1.0
2.0
3.0
4.0
5.0
6.0
Delta County National Benchmark (90th Percentile)
State of Michigan
2010
2012
0.0
0.5
1.0
1.5
2.0
2.5
3.0
3.5
4.0
4.5
Delta County National Benchmark (90th Percentile)
State of Michigan
2010
2012

St. Francis Hospital Community Health-‐Needs Assessment
45
Demographic Profile: Strategic Implications
Changing demographics and health care:
Recent data in May 2012 from the Kaiser Family Foundation1 and Congressional Budget Office2 suggest that the number of individuals 65 years and older in the United States will increase by one-third between 2012 and 2022. With the changing demographics, it is anticipated an increase in chronic conditions such as diabetes, asthma, and heart disease, and obesity will contribute to the growing cost of health care3. In addition, advances in medical technology and medicine may enable individuals to live longer, thus requiring extensive medical care.
Of particular note, the population of individuals 60-64 years of age increased by 2.2% in Delta County between 2007 and 2010. As individuals age and live with disabilities, it greatly impacts the degree of self-sufficiency and medical care required to maintain satisfactory well-being. With the changing demographics resulting from the aging of baby boomers, it is anticipated Delta County will experience an increase in the number of elderly individuals living with disabilities and chronic conditions.
Educational attainment and health care:
For over two decades, empirical research strongly suggests a positive relationship between education and health4,5,6,7 (Adams, 2002; House et. al, 1990; Ross & Wu, 1995; Sander, 1999). The predominant way education impacts better health is through enhancing the decision-making capabilities of an individual. In this way, when an individual is better educated, he or she tends to have a better understanding of symptoms, be better equipped to explain symptoms to a doctor, and make better choices with regard to individual health inputs. Accordingly, more effective treatments and positive outcomes result later in life.
A symbiotic relationship exists between health and education. Consider that healthier children miss fewer days of school and are more "ready to learn.” Success in school begins prior to kindergarten as new research on cognitive development shows the importance of health, nutrition, and intellectual stimulation during the first years of life. To be prepared to learn in kindergarten, children need pre-literacy skills. They must also be able to make and keep friends, develop positive relationships with adults, and feel a sense of opportunity and excitement for the world around them. As their child's first teacher, much of this responsibility falls upon parents.
Research tells us the most reliable predictor of educational success for children is whether they are reading at grade level by the end of 3rd grade. Note that according to data presented in Chapter 1, while most school districts are above the State of Michigan averages, certain school districts (e.g., Mid Peninsula and Rapid River) report more students deemed “not proficient” compared to 3rd grade students across the State of Michigan.
According to research, a child from a low-income family who completes algebra has virtually the same chance of going to college as a child from an upper-income family who passes the course. Thus, it is not about the math, it's about learning to problem solve. Particularly troubling are data indicating six of eight school districts in Delta County reporting more students deemed “not proficient” in math compared to 3rd grade students across the State of Michigan. This trend continues to 8th grade, where five of eight school districts in Delta County report more
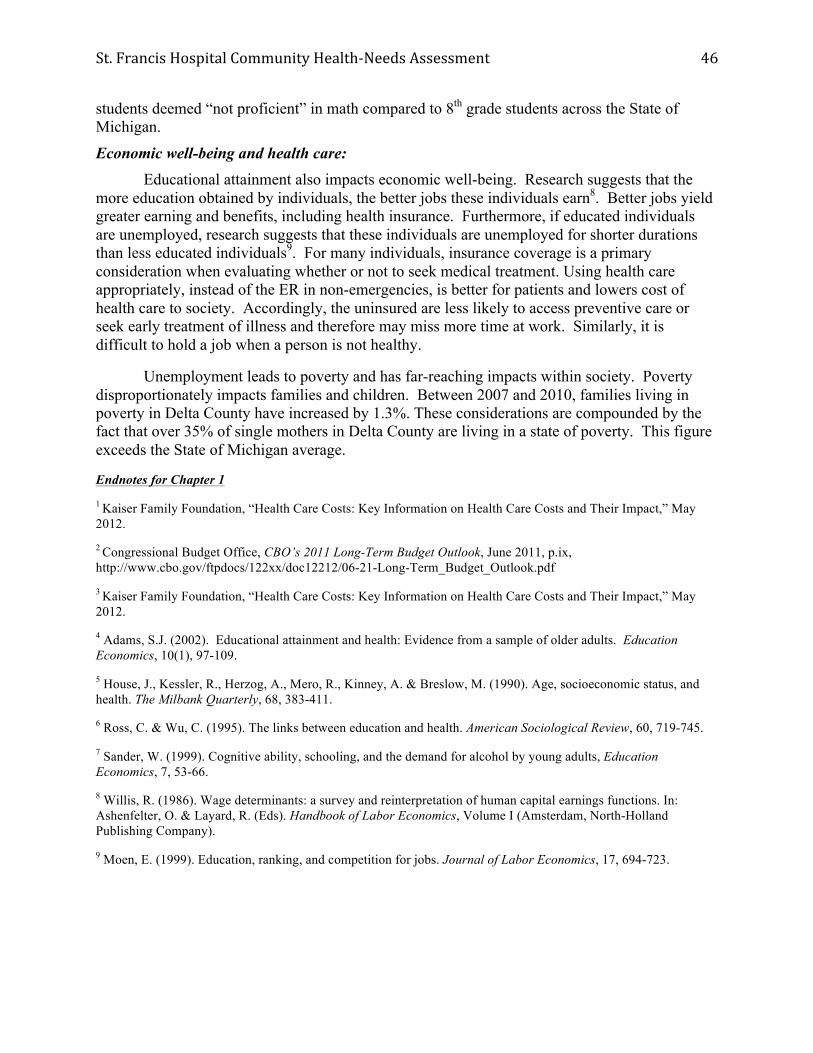
St. Francis Hospital Community Health-‐Needs Assessment
46
students deemed “not proficient” in math compared to 8th grade students across the State of Michigan.
Economic well-being and health care: Educational attainment also impacts economic well-being. Research suggests that the
more education obtained by individuals, the better jobs these individuals earn8. Better jobs yield greater earning and benefits, including health insurance. Furthermore, if educated individuals are unemployed, research suggests that these individuals are unemployed for shorter durations than less educated individuals9. For many individuals, insurance coverage is a primary consideration when evaluating whether or not to seek medical treatment. Using health care appropriately, instead of the ER in non-emergencies, is better for patients and lowers cost of health care to society. Accordingly, the uninsured are less likely to access preventive care or seek early treatment of illness and therefore may miss more time at work. Similarly, it is difficult to hold a job when a person is not healthy.
Unemployment leads to poverty and has far-reaching impacts within society. Poverty disproportionately impacts families and children. Between 2007 and 2010, families living in poverty in Delta County have increased by 1.3%. These considerations are compounded by the fact that over 35% of single mothers in Delta County are living in a state of poverty. This figure exceeds the State of Michigan average.
Endnotes for Chapter 1
1 Kaiser Family Foundation, “Health Care Costs: Key Information on Health Care Costs and Their Impact,” May 2012.
2 Congressional Budget Office, CBO’s 2011 Long-Term Budget Outlook, June 2011, p.ix, http://www.cbo.gov/ftpdocs/122xx/doc12212/06-21-Long-Term_Budget_Outlook.pdf
3 Kaiser Family Foundation, “Health Care Costs: Key Information on Health Care Costs and Their Impact,” May 2012.
4 Adams, S.J. (2002). Educational attainment and health: Evidence from a sample of older adults. Education Economics, 10(1), 97-109.
5 House, J., Kessler, R., Herzog, A., Mero, R., Kinney, A. & Breslow, M. (1990). Age, socioeconomic status, and health. The Milbank Quarterly, 68, 383-411.
6 Ross, C. & Wu, C. (1995). The links between education and health. American Sociological Review, 60, 719-745.
7 Sander, W. (1999). Cognitive ability, schooling, and the demand for alcohol by young adults, Education Economics, 7, 53-66.
8 Willis, R. (1986). Wage determinants: a survey and reinterpretation of human capital earnings functions. In: Ashenfelter, O. & Layard, R. (Eds). Handbook of Labor Economics, Volume I (Amsterdam, North-Holland Publishing Company).
9 Moen, E. (1999). Education, ranking, and competition for jobs. Journal of Labor Economics, 17, 694-723.

St. Francis Hospital Community Health-‐Needs Assessment
47
CHAPTER 2. PREVENTION 2.1 Accessibility Importance of the measure: It is critical for health care services to be accessible to the constituencies who will take advantage of its benefits. Therefore, accessibility to health care must address both the financial costs associated with health care and the supply and demand of medical services. 2.1.1 Insurance Coverage With regard to medical insurance coverage, data gathered from the Michigan Behavioral Risk Factor Surveillance System suggest that residents in Delta County possess health care coverage at a similar percentage (86.0%) when compared to the State of Michigan average. Table 2.1.1-1 Percentage of Delta County Respondents with Health Care Coverage, 2010-vs. 2012
Source: Michigan Behavioral Risk Factor Surveillance System
2.1.2 Access and utilization
Physician capacity can be measured using various metrics. One commonly utilized method is to evaluate what percentage of individuals have a usual health care provider. A usual health care provider signifies that these individuals are more likely to partake in wellness check-ups and less likely to utilize emergency room visits as their primary health care service.
89.0% 90.0% 88.0%
86.0% 89.0% 86.0% 80.0%
85.0%
90.0%
95.0%
100.0%
Delta County National Benchmark (90th
Percentile)
State of Michigan
Percentage of Delta County Respondents with Health Care Coverage, 2010 vs. 2012
2010
2012

St. Francis Hospital Community Health-‐Needs Assessment
48
In the Delta County BRFSS (Behavioral Risk Factor Surveillance System) Region, defined as Delta-Menominee Counties, the most recent data indicate approximately 81% of residents utilize a regular health care provider. Between 2005-2007 and 2008-2010, the percentage of residents in Delta County decreased by 2.5%. On the contrary, the percentage of State of Michigan residents increased by 2.0% during the same time frame.
Table 2.1.2-3 Percentage of Delta County Region Respondents with a Usual Health Care Provider, 2005-2007 vs. 2008-2010
Source: Michigan Behavioral Risk Factor Surveillance System
Another metric to gain insight into the capacity of physicians is the percentage of residents who have not visited physicians within the last year. With regard to the percentage of respondents the Delta County BRFSS Region who have not visited a dentist in the last year, 37.2% of residents did not see a dentist in the last year. This percentage lags significantly behind the State of Michigan average.
81.0% 87.5%
83.5% 85.5%
0.0%
25.0%
50.0%
75.0%
100.0%
Delta-‐Menominee County State of Michigan
Percentage of Delta County Region Respondents with a Usual Health Care Provider, 2005-‐2007 vs. 2008-‐2010
2008-‐2010
2005-‐2007

St. Francis Hospital Community Health-‐Needs Assessment
49
Table 2.1.2-4 Percentage of Delta County Region Residents who have not Visited a Dentist in the past year, 2008-2010
Source: Michigan Behavioral Risk Factor Surveillance System
2.2 Wellness Importance of the measure: Preventative health care measures, including scheduling routine well-visits, engaging in a healthy lifestyle, and undertaking screenings for diseases, are essential to combating morbidity and mortality and help reduce health care costs.
2.2.2 Early detection
Residents in the Delta County BRFSS Region report increased prevalence of high cholesterol. The percentage of residents who report they have high cholesterol (38.8%) is lower than the State of Michigan average of 39.3%.
In addition, approximately 66% of Delta County residents report having had a cholesterol screening within the last year. These data for 2005-2007 are lower than the State of Michigan average of 77.2%.
37.2%
26.2%
0.0% 5.0% 10.0% 15.0% 20.0% 25.0% 30.0% 35.0% 40.0%
Delta-‐Menominee County State of Michigan
Percentage of Delta County Region Residents who have not Visited a Dentist in the past year, 2008-‐2010
2008-‐2010

St. Francis Hospital Community Health-‐Needs Assessment
50
Table 2.2.2-1: Percentage of Delta County Region Residents with High Cholesterol
Source: Michigan Behavioral Risk Factor Surveillance System
Table 2.2.2-2: Percentage of Delta County Region Respondents who have Checked Cholesterol in the Last Five Years, 2005-2007
Source: Michigan Behavioral Risk Factor Surveillance System
38.8%
39.3%
38.4%
38.6%
38.8%
39.0%
39.2%
39.4%
Delta-‐Menominee County State of Michigan
Percentage of Delta County Region Residents with High Cholesterol
2005-‐2007
60.0%
65.0%
70.0%
75.0%
80.0%
66.7% 77.2%
Delta-‐Menominee County State of Michigan
Percentage of Delta County Region Respondents who have Checked Cholesterol in the Last Five Years,
2005-‐2007
2005-‐2007

St. Francis Hospital Community Health-‐Needs Assessment
51
With regard to high blood pressure, the residents in the Delta County BRFSS Region report a higher percentage of individuals with high blood pressure than residents in the State of Michigan as a whole for 2005-2007.
Table 2.2.2-3: Percentage of Delta County Region Residents with High Blood Pressure
Source: Michigan Behavioral Risk Factor Surveillance System
Mammograms and PSA tests help to screen individuals for breast and prostate cancers. With regard to mammograms, 58.1% of Delta County Region residents underwent a clinical breast exam in the past year. These data are higher than the State of Michigan average of 54.6%.
26.0% 27.0% 28.0% 29.0% 30.0% 31.0% 32.0% 33.0%
Delta-‐Menominee County State of Michigan
Percentage of Delta County Region Residents with High Blood
Pressure
2005-‐2007

St. Francis Hospital Community Health-‐Needs Assessment
52
Table 2.2.2-4 Percentage of Delta County Region Residents who had a Clinical Breast Exam in the Past Year
Source: Michigan Behavioral Risk Factor Surveillance System
Research suggests pap smears are important in detecting pre-cancerous cells in the uterus and cervix. Data from the 2008-2010 Michigan BRFSS indicate that 76.5% of Delta County BRFSS Region residents have had a pap smear within the last three years. This percentage is lower than the State of Michigan average (79.3%).
Table 2.2.2-5 Percentage of Delta County Region Residents who had an Appropriately Timed Pap Test within the Past 3 Years
Source: Michigan Behavioral Risk Factor Surveillance System
58.10%
54.60%
52.00%
54.00%
56.00%
58.00%
60.00%
Delta-‐Menominee County State of Michigan
Percentage of Delta County Region Residents who had a
Clinical Breast Exam in the Past Year
2008-‐2010
76.50%
79.30%
75.00% 76.00% 77.00% 78.00% 79.00% 80.00%
Delta-‐Menominee County State of Michigan
Percentage of Delta County Region Residents who had an Appropriately Timed Pap Test
within the Past 3 Years
2008-‐2010

St. Francis Hospital Community Health-‐Needs Assessment
53
2.2.3 Immunizations
The overall health of a community is impacted by preventative measures including immunizations and vaccinations. The percentage of people who have had a flu shot in the past year is approximately 62.7% in the Delta County BRFSS Region. This percentage is over 6 percentage points lower than the State of Michigan average (68.9%) during the same time frame.
Table 2.2.3-1 Percentage of Delta County Region Residents who had a Flu Vaccine in the Past Year
Source: Michigan Behavioral Risk Factor Surveillance System
Compared to flu shots, pneumonia shots are more frequent with 66.3% of Delta County BRFSS Region residents having had the pneumonia vaccine. These percentages are just slightly below the State of Michigan rates.
62.70%
68.90%
58.00%
60.00%
62.00%
64.00%
66.00%
68.00%
70.00%
Delta-‐Menominee County State of Michigan
Percentage of Delta County Region Residents who had a Flu
Vaccine in the Past Year
2008-‐2010

St. Francis Hospital Community Health-‐Needs Assessment
54
Table 2.2.3-2 Percentage of Delta County Region Residents who ever had the Pneumonia Vaccine
Source: Michigan Behavioral Risk Factor Surveillance System
2.2.4 Healthy lifestyle
A healthy lifestyle, comprised of regular physical activity and nutritious diet, has been shown to increase physical, mental, and emotional well-being.
Residents in the Delta County BRFSS Region adhere to regular sustained physical activity guidelines at a lower propensity than the State of Michigan average. The most recent data from 2008-2010 indicate that 23.5% of Delta County residents have not participated in any leisure-time physical activities or exercises during the past month.
66.30%
67.10%
65.80% 66.00% 66.20% 66.40% 66.60% 66.80% 67.00% 67.20%
Delta-‐Menominee County State of Michigan
Percentage of Delta County Region Residents who ever had
the Pneumonia Vaccine
2008-‐2010
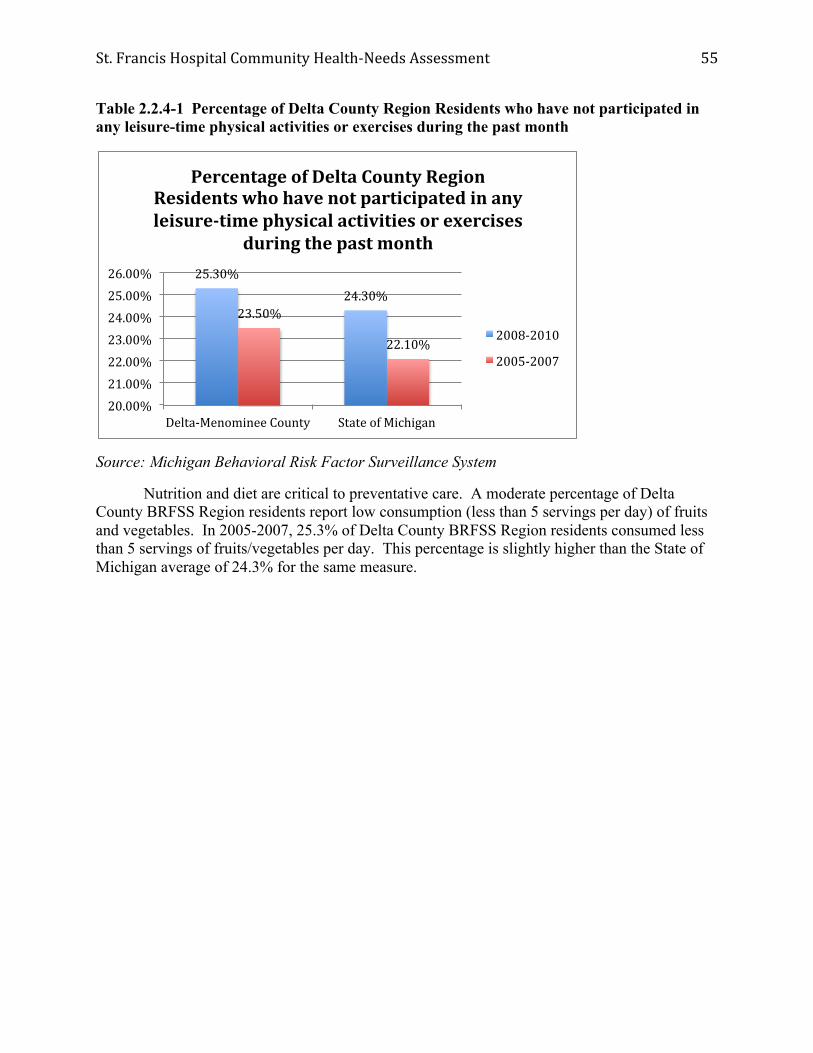
St. Francis Hospital Community Health-‐Needs Assessment
55
Table 2.2.4-1 Percentage of Delta County Region Residents who have not participated in any leisure-time physical activities or exercises during the past month
Source: Michigan Behavioral Risk Factor Surveillance System
Nutrition and diet are critical to preventative care. A moderate percentage of Delta County BRFSS Region residents report low consumption (less than 5 servings per day) of fruits and vegetables. In 2005-2007, 25.3% of Delta County BRFSS Region residents consumed less than 5 servings of fruits/vegetables per day. This percentage is slightly higher than the State of Michigan average of 24.3% for the same measure.
25.30% 24.30%
23.50%
22.10%
20.00% 21.00% 22.00% 23.00% 24.00% 25.00% 26.00%
Delta-‐Menominee County State of Michigan
Percentage of Delta County Region Residents who have not participated in any leisure-‐time physical activities or exercises
during the past month
2008-‐2010
2005-‐2007

St. Francis Hospital Community Health-‐Needs Assessment
56
Table 2.2.4-2 Percentage of Delta County Region Residents who have consumed less than 5 servings of fruits/vegetables per day
Source: Michigan Behavioral Risk Factor Surveillance System
2.2.5 Oral Health
Research suggests that poor oral hygiene leads to more serious medical concerns. For the 2008-2010 time frame, nearly 20% of Delta County Region residents are missing 6 or more teeth due to gum disease or tooth decay. These figures are over 6 percentage points higher than comparable data from the State of Michigan as a whole.
Table 2.2.5-1 Percentage of Delta County Region Residents Missing 6 or more teeth due to gum disease or tooth decay
Source: Michigan Behavioral Risk Factor Surveillance System
25.30%
24.30%
23.80% 24.00% 24.20% 24.40% 24.60% 24.80% 25.00% 25.20% 25.40%
Delta-‐Menominee County State of Michigan
Percentage of Delta County Region Residents who have consumed less than 5 servings of fruits/vegetables per day
2005-‐2007
19.9%
13.8%
0.0%
5.0%
10.0%
15.0%
20.0%
25.0%
Delta-‐Menominee County State of Michigan
Percentage of Delta County Region Residents missing 6 or more teeth due to
gum disease or tooth decay
2008-‐2010

St. Francis Hospital Community Health-‐Needs Assessment
57
Prevention: Strategic Implications
Increase health care insurance coverage:
Research suggests that private health insurance companies cover nearly 1/3 of the national health expenditures. According to the Kaiser Family Foundation, private health insurance companies comprised 32.7% of the health expenditures in the United States for 2010.1 While this percentage has held constant around 32% since 1990, it marks an increase of approximately 11% since 1960. Medicare covered approximately 20.2% of national health expenditures in 2010, up nearly 4% since 2000. In addition, data suggest the out-of-pocket expenses incurred by individuals has steadily decreased, from a high of 33.4% of national health care expenditures in 1970 to 14.7% in 2000, and now 11.6% in 2010. The data are clear: Americans are paying less for out-of-pocket health care expenditures and relying more and more on private or public insurance policies to shoulder the financial burdens of health care. Private funds provided approximately 55% of health care payments in 2010 compared to 45% from federal and local government funds. 2
The rising cost of health care services has resulted in a significant number of families cutting back on care and electing to postpone or cancel treatments. A 2011 Kaiser Health Tracking Poll found that 50% of Americans have cut back on medical treatments in the past 12 months based on cost concerns. 3 Furthermore, 40% reported being “very worried” about having to shoulder more of the financial burden for their health care. Data seem to reinforce this concern, as health insurance premiums have consistently outpaced inflation and the growth in worker earnings.
Increase the prevalence of preventative health care screens:
There appears to be a relationship between individuals who have health insurance and individuals who take advantage of preventative health care screenings. Research for over twenty years suggests that the strongest predictors of failure to receive screening tests was lack of insurance coverage. 4 Furthermore, research suggests that lack of insurance coverage is more prevalent among socioeconomically disadvantaged groups that are often at high risk for disease and illness. 5 Thus, a vicious cycle results where individuals who are at the highest risk for diseases are unable to receiving screening, thus perpetuating a cycle of disease and high health care expenditures.
Screening guidelines from the United States Preventative Services Task Force offer insight on appropriate preventative care and screenings for youth, adults, and older individuals. 6 Adherence to these guidelines provides data-driven benchmarks from physicians in the fields of primary care and preventative medicine. Above all, it is critical for physicians and patients to engage in thorough evaluation of treatment options and engage in high-quality shared decision-making regarding treatment options. 7
With regard to immunizations, the Center for Disease Control’s Advisory Committee on Immunization Practices recommends everyone 6 months and older receive a flu vaccination every year. 8 The percentage of people who have had a flu shot in the past year is approximately 62.7% in the Delta County BRFSS Region. This percentage is over 6 percentage points lower

St. Francis Hospital Community Health-‐Needs Assessment
58
than the State of Michigan average (68.9%) during the same time frame and still considerably lower than the recommendations from the CDC.
Endnotes for Chapter 2 1 Kaiser Family Foundation, “Health Care Costs: Key Information on Health Care Costs and Their Impact,” May 2012. 2 Ibid. 3 Kaiser Family Foundation, Kaiser Health Tracking Poll, Toplines, August 10-15, 2011, pp.16-18, http://www.kff.org/kaiserpolls/8217.cfm. 4 U.S. Department of Health and Human Services, Agency for Healthcare Research and Quality, National Healthcare Disparities Report, 2005. 5 U.S. Department of Health and Human Services, Healthy People 2010. Retrieved from http://www.healthlypeople.gov/ 6 U.S. Preventative Screening Task Force, Recommendations for Adults, Adolescents, and Children. Retrieved from http://www.uspreventativeservicestaskforce.org 7 Ibid. 8 Centers for Disease Control and Prevention, Advisory Committee for Immunization Practices, Comprehensive Recommendations. Retrieved from http://www.cdc.gov/vaccines/pubs/ACIP-list.htm

St. Francis Hospital Community Health-‐Needs Assessment
59
CHAPTER 3. SYMPTOMS AND PREDICTORS 3.1 Tobacco Use Importance of the measure: In order to appropriately allocate health care resources, a thorough analysis of the leading indicators regarding morbidity and disease must be conducted. In this way, health care services and personnel can target affected populations more effectively. Research suggests tobacco use facilitates a wide variety of adverse medical conditions. Smoking significantly impacts the health status of individuals. Smoking rates in the Delta County region are 8.1% higher than rates across the State of Michigan as a whole. Nearly half of the residents within the Delta County region classify themselves as non-smokers, whereas approximately a quarter of residents are former smokers.
Table 3.1-1: Smoking Status of Residents in the Delta County Region
Source: Michigan Behavioral Risk Factor Surveillance System
27.8% 23.3% 19.7% 21.7%
23.3% 21.6% 25.6% 25.7%
49.0% 55.1% 54.8% 52.6%
0.0%
10.0%
20.0%
30.0%
40.0%
50.0%
60.0%
2008-‐2010 2005-‐2007 2008-‐2010 2005-‐2007
Delta-‐Menominee County State of Michigan
Smoking Status of Delta County Region Residents
smoker former smoker non-‐smoker

St. Francis Hospital Community Health-‐Needs Assessment
60
3.2 Drug and Alcohol Abuse
Importance of the measure: Alcohol and drugs impair decision-making, often leading to adverse consequences and outcomes. Research suggests that alcohol is a gateway drug for youths, leading to increased usage of substances in adult years. Accordingly, the values and behaviors toward substance usage by high school students is a leading indicator of adult substance abuse in later years.
Compared to the State of Michigan average (18.0%), Delta County has a higher percentage of residents at risk for acute or binge drinking, as 2011 and 2012 rates suggest a quarter of residents engage in binge or heavy drinking.
Table 3.2-1: Percent of Delta County Residents at Risk for Acute/Binge Drinking
Source: Michigan Behavioral Risk Factor Surveillance System
3.3 Overweight and Obesity Importance of the measure: Individuals who are overweight and obese place greater stress on internal organs, thus increasing the propensity to utilize health services.
In terms of obesity and being overweight, Table 3.3-1 shows the number of people in the Delta County BRFSS Region who have trouble with their weight has increased over the five years from 2005 to 2010. Note specifically that while the proportion of overweight people in Delta County has increased, comparable proportions of overweight individuals across Michigan have decreased.
25.0%
8.0% 18.0%
25.0%
8.0%
19.0%
0.0% 5.0% 10.0% 15.0% 20.0% 25.0% 30.0%
Delta County National Benchmark (90th Percentile)
State of Michigan
Percent of Delta County Residents At Risk for Acute/Binge Drinking
2012 2011

St. Francis Hospital Community Health-‐Needs Assessment
61
Table 3.3-1: Overweight and Obesity in Delta County Region and State of Michigan
Source: Michigan Behavioral Risk Factor Surveillance System
Symptoms/Predictors: Strategic Implications
Effectively combating youth obesity:
Research strongly suggests that obesity is a significant problem facing youth and adults nationally, in Michigan, and within the Delta County BRFSS Region. The US Surgeon General has characterized obesity as “the fastest-growing, most threatening disease in America today.”1 According to obesity prevention initiatives in similar Midwestern states, upwards of 20% of children are obese2. Similarly, data from 2010 indicate 62% of adults in similar Midwestern states are obese or overweight, with a disproportionate number of obese or overweight individuals living in rural areas. The financial burden of overweight and obese individuals is staggering, as the estimated annual medical costs attributed to obesity in some Midwestern states for 1998-2000 exceeded 3.4 billion dollars3.
29.4%
35.3% 33.8%
36.1%
41.0% 38.6% 35.3% 36.3%
29.6%
26.1%
30.9% 27.6%
0.0%
5.0%
10.0%
15.0%
20.0%
25.0%
30.0%
35.0%
40.0%
45.0%
2008-‐2010 2005-‐2007 2008-‐2010 2005-‐2007
Delta-‐Menominee County State of Michigan
Overweight and Obesity in Delta County Region and State of Michigan
underweight/normal
overweight
obese

St. Francis Hospital Community Health-‐Needs Assessment
62
With children, research has linked obesity to numerous chronic diseases including Type II diabetes4, hypertension, high blood pressure, and asthma. Adverse physical health side effects of obesity include orthopedic problems with weakened joints and lower bone density5. Detrimental mental health side effects include low self-esteem, poor body image, symptoms of depression and suicide ideation6. Obesity impacts educational performance as studies suggest that overweight students miss one day of school per month on average and school absenteeism of obese children is six times higher that of non-obese children7.
With adults, obesity has far-reaching consequences. Legislative testimony has indicated that obesity-related illnesses contribute to worker absenteeism, slow workflow, and high worker compensation rates.8 A Duke University study on the effects of obesity in the workforce noted 13 times more missed work days by obese employees than non-obese employees. Nationwide, lack of physical activity and poor nutrition contribute to an estimated 300,000 preventable deaths per year.
Within the Delta County BRFSS Region, leading indicators suggest obesity is a growing concern. With regard to nutrition, evidence suggests residents in the Delta County BRFSS Region are not eating enough fruits and vegetables. Between 2005 and 2007, 25% of Delta County BRFSS Region residents consumed less than 5 or more servings of fruits and vegetables per day. These figures are a full percentage point greater than the State of Michigan average.
Research indicates physical activity helps to prevent illness and obesity9. Data regarding the values toward exercise and the actual time spent exercising may contribute to obesity in the Delta County BRFSS Region. For example, data from the Center for Disease Control indicate that 66% of children walked or biked to school in 1973. By 2000, that figure had decreased to only 13%.10 Nearly a quarter of Delta County BRFSS residents do not meet the moderate activity standard.
Aggressively addressing youth substance abuse:
The use of tobacco, alcohol, and other drugs is a significant contributor to the escalating costs of health care service delivery. According to the Center for Disease Control, tobacco use is the leading preventable cause of death in the United States. 11 On a societal level, alcohol, tobacco, and other drug use leads to accidents, violent behavior, emotional trauma, and assaults. It is estimated that drug-induced related risky behavior needlessly drains community resources such as police intervention, emergency services, and criminal justice costs.
The Surgeon General contends that “alcohol remains the most heavily abused substance by America’s youth.” 12 Dr. Peter Monti, Director of the Center for Alcohol and Addiction Studies at Brown University notes that alcohol disrupts the continued growth of an adolescent’s brain and “impacts the brain’s ability to learn life skills.” 13 Studies show that an adolescent needs to only drink half as much alcohol as an adult to suffer similar adverse brain effects. 14
Research shows that cigarette smoking as a teenager leads to higher risks for lung cancer as an adult, reduces the rates of lung growth, and the maximum level of lung function that could be achieved. 15

St. Francis Hospital Community Health-‐Needs Assessment
63
Financially, underage drinking is estimated to cost the nation upwards of $62 billion dollars annually in deaths, injuries, and other economic losses.16 A Columbia University study examining the impacts of substance abuse in mid-sized cities and rural America suggested that tobacco use was more prevalent in mid-sized cities and rural areas than large metropolitan areas; specifically, young adults in mid-sized cities and rural areas were 30% more likely than adults in larger cities to have smoked a cigarette in the last month. 17
In the Delta County BRFSS Region, smoking rates have increased between 2005-2007 and 2008-2010, whereas smoking trends for the State of Michigan as a whole have declined during the same time period. Furthermore, rates for residents at risk for acute or binge drinking are also higher than the state average.
Endnotes for Chapter 3 1 Childhood Obesity: An epidemic is gripping California and the nation: How did we get here? What do we do now? Advertising supplement to The New York Times, Kaiser Permanente, UC San Francisco Medical School, UCLA Medical School, January 2006. 2 Obesity Prevention Initiative Act (PA 96-0155): A Report to the Illinois General Assembly, Illinois Department of Public Health, December 2010. 3 Ibid. 4 Crawford, P., Mitchell, T., & Ikeda, J. (2000). Childhood Overweight: A Fact Sheet for Professionals, UCB/Cooperative Extension University of California-Berkeley. 5 Xiang, H. (2005). Obesity and Risk of Nonfatal Unintentional Injuries, American Journal of Preventative Medicine, 29,1, 41-45. 6 U.S. Department of Health and Human Services, Healthy People 2010. Retrieved from http://www.healthlypeople.gov/ 7 Schwimmer, J.B., Burwinkle, T.M., & Varni, J.W. (2003). Health-Related Quality of Life of Severely Obese Children and Adolescents. Journal of the American Medical Association. 289(14), 1818. 8 Obesity Prevention Initiative Act (PA 96-0155): A Report to the Illinois General Assembly, Illinois Department of Public Health, December 2010. 9 The Learning Connection: The Value of Improving Nutrition and Physical Activity in Our Schools. Retrieved from http://www.actionforhealthykids.org 10 U.S. Center for Disease Control and Prevention, Youth Physical Activity: The Role of Families. Retrieved from http://www.cdc.gov/healthyyouth 11 U.S. Center for Disease Control and Prevention, Smoking and Tobacco Use: Data and Statistics. Retrieved from http://www.cdc.gov/tobacco

St. Francis Hospital Community Health-‐Needs Assessment
64
12 U.S. Department of Health and Human Services. The Surgeon General's Call to Action to Prevent and Reduce Underage Drinking. Rockville, MD: U.S. Department of Health and Human Services; 2007. Retrieved from http://www.surgeongeneral.gov/topics/underagedrinking/ 13 Monti, P.M., et al. (2005). Adolescence: Booze, Brains, and Behavior. Alcoholism: Clinical and Experimental Research. 29, 2, 207-220. 14 American Medical Association, Harmful Consequences of Alcohol Use on the Brains of Children. 15 Preventing Tobacco Use Among Young People, Executive Summary, A Report of the Surgeon General, 1994, Ch. 1. 16 Pacific Institute for Research and Evaluation, State Underage Drinking Fact Sheets, 2004. 17 The National Center on Addiction and Substance Abuse at Columbia University, Adolescent Substance Use: America’s #1 Public Health Problem, June 2011.

St. Francis Hospital Community Health-‐Needs Assessment
65
CHAPTER 4. DISEASES/MORBIDITY
Note in this chapter, given the lack of recent disease/morbidity data from existing secondary data sources, much of the data used in this chapter was manually gathered from OSF St. Francis Hospital in Escanaba.
4.1 Age related
Importance of the measure: Age related statistics regarding morbidity gain insight into the prevalence of disease within two vulnerable populations – the very young and the very old. Health care services designed to meet the needs of these populations are very expensive and therefore, a thorough understanding of the leading indicators for these populations helps with managing service delivery costs.
4.1.1 Low birth-weight rates
Low birth rate is defined as the percentage of infants born below 2,500 grams or 5.5 pounds. In contrast, the average newborn weighs about 7 pounds. The percentage of babies born with low birth weights in Delta County was less than the State of Michigan average.
Table 4.1.1-1: Percentage of Live Births with Low Birthweight in Delta County, 2010 vs. 2012
Source: National Vital Statistics System, Center for Disease Control
4.1.2 Initiation of prenatal care
Prenatal care is comprehensive medical care provided for the mother and fetus, which includes screening and treatment for medical conditions as well as identification and interventions for behavioral risk factors associated with adverse birth outcomes. Kotelchuck Index Scores are used to determine the quantity of prenatal visits received between initiation of
0.0% 1.0% 2.0% 3.0% 4.0% 5.0% 6.0% 7.0% 8.0% 9.0%
2010 2012 2010 2012 2010 2012
Delta County State of Michigan
National Benchmark (90th %)
Percentage of Live Births with Low Birthweight (< 2500 grams) in Delta County, 2010 vs. 2012
Low Birth Weight (<2500 grams)

St. Francis Hospital Community Health-‐Needs Assessment
66
services and delivery. Adequate (80%-109% of expected visits) and Adequate Plus (receiving 110% of recommended services) of received services is compared to the number of expected visits for the period when care began and the delivery date.
Babies born between 2009-2011 in Delta County (66.8%) lag the State of Michigan average of 68.3% of babies born with “Adequate” or “Adequate Plus.”
Table 4.1.2-1: Percentage of Babies Born with Adequate or Better Prenatal Care based on Kotelchuck Index Scores in Delta County, 2009-2011
Source: Michigan Department of Community Health
66.8%
68.3%
66.0%
66.5%
67.0%
67.5%
68.0%
68.5%
Delta County State of Michigan
Percentage of Babies Born with Adequate or Better Prenatal Care based on Kotelchuck Index Scores in Delta County,
2009-‐2011

St. Francis Hospital Community Health-‐Needs Assessment
67
4.2 Cardiovascular
Importance of the measure: Cardiovascular disease is defined as all diseases of the heart and blood vessels, including ischemic (also known as coronary) heart disease, cerebrovascular disease, congestive heart failure, hypertensive disease, and atherosclerosis. 4.2.1 Hypertension High blood pressure, which is also known as hypertension, is dangerous because it forces the heart to work extra hard to pump blood out to the rest of the body and contributes to the development of the hardening of the arteries and heart failure. Cases of hypertension at St. Francis Hospital peaked between July 2009 and June 2010 when 4 instances were reported in individuals age 65 and older. The most recent data indicate 2 cases of hypertension and 1 case of hypertension complication between July 2011 and June 2012. Table 4.2.1-1 Inpatient Hypertension Cases at St. Francis Hospital from Delta County Region
Source: COMPdata 2012
-‐
1 1
2
-‐
1
4
5
-‐
1
-‐
1
-‐
1
-‐
1
-‐ -‐ -‐ -‐ -‐ -‐ -‐ -‐ -‐ -‐
3 3
-‐
1 1
2
-‐
1
2
3
4
5
6
18-‐44
45-‐64
65+
Total
18-‐44
45-‐64
65+
Total
18-‐44
45-‐64
65+
Total
18-‐44
45-‐64
65+
Total
Jul 08 -‐ Jun 09 Jul 09 -‐ Jun 10 Jul 10 -‐ Jun 11 Jul 11 -‐ Jun 12
Cases
Inpatient Hypertension Cases at St. Francis Hospital from Delta County Region, July 08 -‐ June 12
Hypertension
Hypertension Complication

St. Francis Hospital Community Health-‐Needs Assessment
68
4.2.2 Coronary artery
Cases of inpatient chest pain at St. Francis Hospital peaked between July 2008 and June 2009 when 8 instances were reported in individuals age 65 and older and 11 cases overall. The most recent data indicate 1 case of chest pain between July 2011 and June 2012.
Table 4.2.2-1 Inpatient Chest Pain – Noncardiac Cases at St. Francis Hospital from Delta County Region
Source: COMPdata 2012
Cases of carditis have remained constant across the four-year time frame at 1 case per year. Between July 2010 and June 2011, there were zero reported cases of inpatient carditis.
-‐
3
8
11
1
4 5
10
-‐
3
6
9
-‐ -‐ 1 1
-‐
2
4
6
8
10
12
18-‐44
45-‐64
65+
Total
18-‐44
45-‐64
65+
Total
18-‐44
45-‐64
65+
Total
18-‐44
45-‐64
65+
Total
Jul 08 -‐ Jun 09 Jul 09 -‐ Jun 10 Jul 10 -‐ Jun 11 Jul 11 -‐ Jun 12
Cases
Inpatient Chest Pain -‐ Noncardiac Cases at St. Francis Hospital from Delta County Region, July 08 -‐ June 12

St. Francis Hospital Community Health-‐Needs Assessment
69
Table 4.2.2-2 Inpatient Carditis Cases at St. Francis Hospital from Delta County Region
Source: COMPdata 2012
Between July 2008 and June 2012, there was one reported case of congenital cardiac anomaly. The case was reported in an individual 65 years of age and over.
Table 4.2.2-3 Inpatient Congenital Cardiac Anomaly Cases at St. Francis Hospital From Delta County Region
Source: COMPdata 2012
-‐
1
-‐
1 1
-‐ -‐
1
-‐ -‐ -‐ -‐ -‐
1
-‐
1
-‐
1
2 18-‐44
45-‐64
65+
Total
18-‐44
45-‐64
65+
Total
18-‐44
45-‐64
65+
Total
18-‐44
45-‐64
65+
Total
Jul 08 -‐ Jun 09 Jul 09 -‐ Jun 10 Jul 10 -‐ Jun 11 Jul 11 -‐ Jun 12
Cases
Inpatient Carditis Cases at St. Francis Hospital from Delta County Region, July 08 -‐ June 12
-‐ -‐ -‐ -‐ -‐ -‐ -‐ -‐ -‐ -‐ -‐ -‐ -‐ -‐
1 1
-‐
1
2
18-‐44
45-‐64
65+
Total
18-‐44
45-‐64
65+
Total
18-‐44
45-‐64
65+
Total
18-‐44
45-‐64
65+
Total
Jul 08 -‐ Jun 09 Jul 09 -‐ Jun 10 Jul 10 -‐ Jun 11 Jul 11 -‐ Jun 12
Cases
Inpatient Congenital Cardiac Anomaly Cases at St. Francis Hospital from Delta County Region, July 08 -‐ June 12

St. Francis Hospital Community Health-‐Needs Assessment
70
Between July 2008 and June 2012, there were three reported cases of arterial embolism. One case was reported in an individual 18-44 and two cases were reported in individuals 65 years of age and over. There have been zero instances of arterial embolism since July 2009.
Table 4.2.2-4 Inpatient Arterial Embolism Cases at St. Francis Hospital from Delta County Region
Source: COMPdata 2012
1
-‐
2
3
-‐ -‐ -‐ -‐ -‐ -‐ -‐ -‐ -‐ -‐ -‐ -‐ -‐
1
2
3
4
18-‐44
45-‐64
65+
Total
18-‐44
45-‐64
65+
Total
18-‐44
45-‐64
65+
Total
18-‐44
45-‐64
65+
Total
Jul 08 -‐ Jun 09 Jul 09 -‐ Jun 10 Jul 10 -‐ Jun 11 Jul 11 -‐ Jun 12
Cases
Inpatient Arterial Embolism Cases at St. Francis Hospital from Delta County Region, July 08 -‐ June 12

St. Francis Hospital Community Health-‐Needs Assessment
71
Over the past four years, the number of treated cases of coronary atherosclerosis at St. Francis Hospital has decreased from 4 cases between July 2008-June 2009 and July 2011-June 2012. For the most recent time period, three cases were reported.
Table 4.2.2-5 Inpatient Coronary Atherosclerosis Cases at St. Francis Hospital from Delta County Region
Source: COMPdata 2012
-‐ -‐
4 4
-‐ -‐
3 3
-‐
1
2
3
-‐
2
1
3
-‐
1
2
3
4
5
18-‐44
45-‐64
65+
Total
18-‐44
45-‐64
65+
Total
18-‐44
45-‐64
65+
Total
18-‐44
45-‐64
65+
Total
Jul 08 -‐ Jun 09 Jul 09 -‐ Jun 10 Jul 10 -‐ Jun 11 Jul 11 -‐ Jun 12
Cases
Inpatient Coronary Atherosclerosis Cases at St. Francis Hospital from Delta County Region, July 08 -‐ June 12

St. Francis Hospital Community Health-‐Needs Assessment
72
Cases of disease of the venous system at St. Francis Hospital have decreased by 75% between 2008 (12 cases) and 2011 (3 cases) for inpatient admissions. Cases of disease of the venous system peaked between July 2009-June 2010 when 21 cases were reported.
Table 4.2.2-6 Inpatient Disease of Venous System Cases at St. Francis Hospital from Delta County Region
Source: COMPdata 2012
2 5 5
12
2
8 11
21
2 4
6
12
-‐ 3
-‐ 3
-‐
5
10
15
20
25
18-‐44
45-‐64
65+
Total
18-‐44
45-‐64
65+
Total
18-‐44
45-‐64
65+
Total
18-‐44
45-‐64
65+
Total
Jul 08 -‐ Jun 09 Jul 09 -‐ Jun 10 Jul 10 -‐ Jun 11 Jul 11 -‐ Jun 12
Cases
Inpatient Disease of Venous System Cases at St. Francis Hospital from Delta County Region, July 08 -‐ June 12

St. Francis Hospital Community Health-‐Needs Assessment
73
Cases of dysrhythmia and cardiac arrest at St. Francis Hospital have decreased by 29.8% between 2008 (57 cases) and 2011 (40 cases) for inpatient admissions.
Of particular interest, cases of dysrhythmia and cardiac arrest in individuals age 65 and over have decreased by 22.2% during the same time frame for inpatient admissions.
Table 4.2.2-7 Inpatient Dysrhythmia & Cardiac Arrest Cases at St. Francis Hospital from Delta County Region
Source: COMPdata 2012
3 9
45
57
2 8
48
58
-‐
13
40
53
-‐ 5
35 40
-‐
10
20
30
40
50
60
70
18-‐44
45-‐64
65+
Total
18-‐44
45-‐64
65+
Total
18-‐44
45-‐64
65+
Total
18-‐44
45-‐64
65+
Total
Jul 08 -‐ Jun 09 Jul 09 -‐ Jun 10 Jul 10 -‐ Jun 11 Jul 11 -‐ Jun 12
Cases
Inpatient Dysrhythmia & Cardiac Arrest Cases at St. Francis Hospital from Delta County Region, July 08 -‐ June 12

St. Francis Hospital Community Health-‐Needs Assessment
74
There has been a 22.6% decrease in the number of treated cases of heart failure at St. Francis Hospital between 2008 (84 cases) and 2011 (65 cases) for inpatient admissions. The number of cases peaked between July 2009 and June 2010 when 97 cases were reported.
Table 4.2.2-8 Inpatient Heart Failure Cases at St. Francis Hospital from Delta County Region
Source: COMPdata 2012
-‐ 11
73 84
-‐ 9
88 97
-‐ 10
73 83
1 4
60 65
-‐
20
40
60
80
100
120
18-‐44
45-‐64
65+
Total
18-‐44
45-‐64
65+
Total
18-‐44
45-‐64
65+
Total
18-‐44
45-‐64
65+
Total
Jul 08 -‐ Jun 09 Jul 09 -‐ Jun 10 Jul 10 -‐ Jun 11 Jul 11 -‐ Jun 12
Cases
Inpatient Heart Failure Cases at St. Francis Hospital from Delta County Region, July 08 -‐ June 12

St. Francis Hospital Community Health-‐Needs Assessment
75
Between July 2008 and June 2012, there were seven reported cases of heart valve disease. All cases were reported in individuals 65 years of age and over. There have been two instances of heart valve disease since July 2010.
Table 4.2.2-9 Inpatient Heart Valve Disease Cases at St. Francis Hospital from Delta County Region
Source: COMPdata 2012
-‐ -‐
2 2
-‐ -‐
3 3
-‐ -‐ -‐ -‐ -‐ -‐
2 2
-‐
1
2
3
4
18-‐44
45-‐64
65+
Total
18-‐44
45-‐64
65+
Total
18-‐44
45-‐64
65+
Total
18-‐44
45-‐64
65+
Total
Jul 08 -‐ Jun 09 Jul 09 -‐ Jun 10 Jul 10 -‐ Jun 11 Jul 11 -‐ Jun 12
Cases
Inpatient Heart Valve Disease Cases at St. Francis Hospital from Delta County Region, July 08 -‐ June 12

St. Francis Hospital Community Health-‐Needs Assessment
76
Cases of myocardial infarction at St. Francis Hospital have decreased by 59.1% between 2008 (44 cases) and 2011 (18 cases) for inpatient admissions.
Of particular interest, cases of myocardial infarction peaked in July 2008-June 2009 when 44 cases were reported.
Table 4.2.2-10 Inpatient Myocardial Infarction Cases at St. Francis Hospital from Delta County Region
Source: COMPdata 2012
-‐ 2
42 44
-‐ 3
23 26
1 2
25 28
-‐ 1
17 18
-‐ 5 10 15 20 25 30 35 40 45 50
18-‐44
45-‐64
65+
Total
18-‐44
45-‐64
65+
Total
18-‐44
45-‐64
65+
Total
18-‐44
45-‐64
65+
Total
Jul 08 -‐ Jun 09 Jul 09 -‐ Jun 10 Jul 10 -‐ Jun 11 Jul 11 -‐ Jun 12
Cases
Inpatient Myocardial Infarction Cases at St. Francis Hospital from Delta County Region, July 08 -‐ June 12

St. Francis Hospital Community Health-‐Needs Assessment
77
Cases of other cardiovascular disease at St. Francis Hospital have decreased by 27.5% between 2008 (29 cases) and 2011 (21 cases) for inpatient admissions.
Of particular interest, cases of other cardiovascular disease peaked in July 2010-June 2011 when 36 cases were reported.
Table 4.2.2-11 Inpatient Other Cardiovascular Disease Cases at St. Francis Hospital from Delta County Region
Source: COMPdata 2012
3
10
16
29
1
8
19
28
3
13
20
36
-‐
5
16
21
-‐
5
10
15
20
25
30
35
40
18-‐44
45-‐64
65+
Total
18-‐44
45-‐64
65+
Total
18-‐44
45-‐64
65+
Total
18-‐44
45-‐64
65+
Total
Jul 08 -‐ Jun 09 Jul 09 -‐ Jun 10 Jul 10 -‐ Jun 11 Jul 11 -‐ Jun 12
Cases
Inpatient Other Cardiovascular Disease Cases at St. Francis Hospital from Delta County Region, July 08 -‐ June 12

St. Francis Hospital Community Health-‐Needs Assessment
78
Cases of other vascular disease at St. Francis Hospital have decreased by 20% between 2008 (20 cases) and 2011 (16 cases) for inpatient admissions.
Of particular interest, cases of other vascular disease peaked in July 2009-June 2010 when 21 cases were reported.
Table 4.2.2-12 Inpatient Vascular Disease Cases at St. Francis Hospital from Delta County Region
Source: COMPdata 2012
-‐
6
14
20
2
6
13
21
-‐ 3
8 11
-‐
8 8
16
-‐
5
10
15
20
25
18-‐44
45-‐64
65+
Total
18-‐44
45-‐64
65+
Total
18-‐44
45-‐64
65+
Total
18-‐44
45-‐64
65+
Total
Jul 08 -‐ Jun 09 Jul 09 -‐ Jun 10 Jul 10 -‐ Jun 11 Jul 11 -‐ Jun 12
Cases
Inpatient Vascular Disease Cases at St. Francis Hospital from Delta County Region, July 08 -‐ June 12

St. Francis Hospital Community Health-‐Needs Assessment
79
4.2.3 Stroke
Cases of stroke at St. Francis Hospital have decreased by 15.2% between 2008 (46 cases) and 2011 (39 cases) for inpatient admissions. Cases of brain tumor have ranged from zero to six cases during the same time frame for inpatient admissions.
Table 4.2.3-1 Inpatient Brain Tumor and Stroke Cases at St. Francis Hospital from Delta County Region
Source: COMPdata 2012
0 1 0 1 0 0 0 0 0 0 1 1 0 0 1 1
0
3
43
46
1
5
38
44
0
4
31
35
1
6
32
39
0
5
10
15
20
25
30
35
40
45
50
18-‐44
45-‐64
65+
Total
18-‐44
45-‐64
65+
Total
18-‐44
45-‐64
65+
Total
18-‐44
45-‐64
65+
Total
Jul 08 -‐ Jun 09 Jul 09 -‐ Jun 10 Jul 10 -‐ Jun 11 Jul 11 -‐ Jun 12
Inpatient Brain Tumor and Stroke Cases at St. Francis Hospital from Delta County Region
Brain Tumor
Stroke

St. Francis Hospital Community Health-‐Needs Assessment
80
4.3 Respiratory
Importance of the measure: Disease of the respiratory system includes acute upper respiratory infections such as
influenza, pneumonia, bronchitis, asthma, emphysema, and Chronic Obstructive Pulmonary Disease (COPD). These conditions are characterized by breathlessness, wheezing, chronic coughing, frequent respiratory infections, and chest tightness. Many respiratory conditions can be successfully controlled with medical supervision and treatment. However, children and adults who do not have access to adequate medical care are likely to experience repeated serious episodes, trips to the emergency room and absences from school and work. Hospitalization rates illustrate the worst episodes of respiratory diseases and are a proxy measure for inadequate treatment. 4.3.1 Asthma Treated cases of asthma in Delta County have increased by 47% between 2008 (17 cases) and 2011 (25 cases) for inpatient admissions. Of particular interest, cases of asthma in individuals age 65 and older have increased 180% for inpatient admissions during the same time frame. According to the Michigan BRFSS, asthma rates in the Delta County Region are higher than the average rate for the State of Michigan.
Table 4.3.1-1 Inpatient Asthma Cases at St. Francis Hospital from Delta County Region
Source: COMPdata 2012
5 2
5 5
17
6 5 3 4
18
3 4 7
2
16
3 -‐
8
14
25
-‐
5
10
15
20
25
30
0-‐17
18-‐44
45-‐64
65+
Total
0-‐17
18-‐44
45-‐64
65+
Total
0-‐17
18-‐44
45-‐64
65+
Total
0-‐17
18-‐44
45-‐64
65+
Total
Jul 08 -‐ Jun 09 Jul 09 -‐ Jun 10 Jul 10 -‐ Jun 11 Jul 11 -‐ Jun 12
Cases
Inpatient Asthma Cases at St. Francis Hospital from Delta County Region, July 08 -‐ June 12

St. Francis Hospital Community Health-‐Needs Assessment
81
Table 4.3.1-2 Percent of Delta County Region Residents Who Still Have Asthma
Source: Michigan Department of Public Health
10.7% 9.3%
13.2%
10.1%
0.0% 2.0% 4.0% 6.0% 8.0% 10.0% 12.0% 14.0%
Delta-‐Menominee County State of Michigan
Percent of Delta County Region Residents Who Still Have Asthma
2005-‐2007 2008-‐2010

St. Francis Hospital Community Health-‐Needs Assessment
82
4.3.2 Pneumonia
Cases of pneumonia St. Francis Hospital have decreased by 44.5% between 2008 and 2011 for inpatient admissions.
Table 4.3.2-1 Inpatient Pneumonia Including Aspiration Cases at St. Francis Hospital from Delta County Region
Source: COMPdata 2012
13 14 39
109
175
21 13
45
146
225
28 8
33
86
155
11 1 10
75 97
-‐
50
100
150
200
250
0-‐17
18-‐44
45-‐64
65+
Total
0-‐17
18-‐44
45-‐64
65+
Total
0-‐17
18-‐44
45-‐64
65+
Total
0-‐17
18-‐44
45-‐64
65+
Total
Jul 08 -‐ Jun 09 Jul 09 -‐ Jun 10 Jul 10 -‐ Jun 11 Jul 11 -‐ Jun 12
Cases
Inpatient Pneumonia Including Aspiration Cases at St. Francis Hospital from Delta County Region, July 08 -‐ June 12
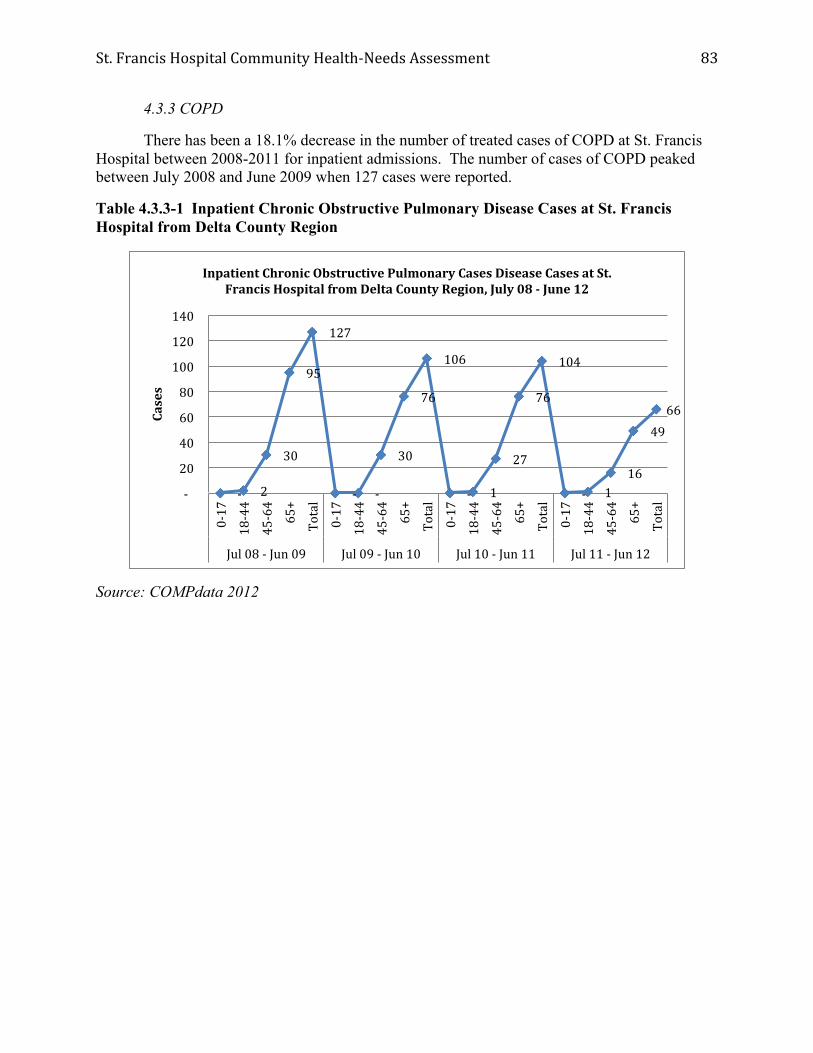
St. Francis Hospital Community Health-‐Needs Assessment
83
4.3.3 COPD
There has been a 18.1% decrease in the number of treated cases of COPD at St. Francis Hospital between 2008-2011 for inpatient admissions. The number of cases of COPD peaked between July 2008 and June 2009 when 127 cases were reported.
Table 4.3.3-1 Inpatient Chronic Obstructive Pulmonary Disease Cases at St. Francis Hospital from Delta County Region
Source: COMPdata 2012
-‐ 2
30
95
127
-‐ -‐
30
76
106
-‐ 1
27
76
104
-‐ 1 16
49 66
-‐
20
40
60
80
100
120
140
0-‐17
18-‐44
45-‐64
65+
Total
0-‐17
18-‐44
45-‐64
65+
Total
0-‐17
18-‐44
45-‐64
65+
Total
0-‐17
18-‐44
45-‐64
65+
Total
Jul 08 -‐ Jun 09 Jul 09 -‐ Jun 10 Jul 10 -‐ Jun 11 Jul 11 -‐ Jun 12
Cases
Inpatient Chronic Obstructive Pulmonary Cases Disease Cases at St. Francis Hospital from Delta County Region, July 08 -‐ June 12

St. Francis Hospital Community Health-‐Needs Assessment
84
4.4 Cancer
Importance of the measure: Cancer is caused by the abnormal growth of cells in the body and many causes of cancer have been identified. Generally, each type of cancer has its own symptoms, outlook for cure, and methods for treatment. Cancer is one of the leading causes of death in Delta County.
Tables 4.4-1 and 4.4-2 provide longitudinal data on the incidence counts of breast, lung, colorectal, and prostate cancers in Delta County.
Table 4.4-1 Ten-Year Age-Adjusted Average Incidence Counts of Selected Cancers, 2000-2009
Source: Michigan Department of Community Health
0 50 100 150 200 250
2000
2001
2002
2003
2004
2005
2006
2007
2008
2009
Breast Delta County Breast Michigan Colorectal Delta County
Colorectal Michigan Lung Delta County Lung Michigan
Prostate Delta County Prostate Michigan

St. Francis Hospital Community Health-‐Needs Assessment
85
Table 4.4-2 Five-Year Invasive Cancer Incidence by State at Diagnosis of Delta County Residents, 1985-2009
Source: Michigan Department of Community Health
0
200
400
600
800
1000
1200
1400
Five-‐Year Invasive Cancer Incidence by State at Diagnosis of Delta County Residents, 1985-‐2009
1985-‐1989
1990-‐1994
1995-‐1999
2000-‐2004
2005-‐2009

St. Francis Hospital Community Health-‐Needs Assessment
86
4.4.1 Carcinoma
Cases of breast cancer at St. Francis Hospital have remained relatively stable between 2008 and 2011, averaging approximately 5 cases per year. The number of cases of breast cancer peaked between July 2010 and June 2011 when 7 cases were reported.
Table 4.4.1-1 Inpatient Breast Cancer Cases at St. Francis Hospital from Delta County Region
Source: COMPdata 2012
0 0
5 5
0
1
5
6
0
2
5
7
0
1
4
5
0
1
2
3
4
5
6
7
8
18-‐44
45-‐64
65+
Total
18-‐44
45-‐64
65+
Total
18-‐44
45-‐64
65+
Total
18-‐44
45-‐64
65+
Total
Jul 08 -‐ Jun 09 Jul 09 -‐ Jun 10 Jul 10 -‐ Jun 11 Jul 11 -‐ Jun 12
Inpatient Breast Cancer Cases at St. Francis Hospital from Delta County Region

St. Francis Hospital Community Health-‐Needs Assessment
87
Cases of lung cancer at St. Francis Hospital have increased by 66% between 2008 (3 cases) and 2011 (5 cases) for inpatient admissions. The number of cases of lung cancer peaked between July 2009 and June 2010 when 8 cases were reported.
Table 4.4.1-2 Inpatient Lung Cancer Cases at St. Francis Hospital from Delta County Region
Source: COMPdata 2012
0 0
3 3
0 0
8 8
0
1
6
7
0
2
3
5
0
1
2
3
4
5
6
7
8
9
18-‐44
45-‐64
65+
Total
18-‐44
45-‐64
65+
Total
18-‐44
45-‐64
65+
Total
18-‐44
45-‐64
65+
Total
Jul 08 -‐ Jun 09 Jul 09 -‐ Jun 10 Jul 10 -‐ Jun 11 Jul 11 -‐ Jun 12
Inpatient Lung Cancer Cases at St. Francis Hospital from Delta County Region

St. Francis Hospital Community Health-‐Needs Assessment
88
Between July 2008 and June 2012, there were two reported cases of prostate cancer at St. Francis Hospital. Both cases were reported in individuals 65 years of age and over.
Table 4.4.1-3 Inpatient Prostate Cancer Cases at St. Francis Hospital from Delta County Region
Source: COMPdata 2012
0 0
1 1
0 0 0 0 0 0
1 1
0 0 0 0 0
1
2
18-‐44
45-‐64
65+
Total
18-‐44
45-‐64
65+
Total
18-‐44
45-‐64
65+
Total
18-‐44
45-‐64
65+
Total
Jul 08 -‐ Jun 09 Jul 09 -‐ Jun 10 Jul 10 -‐ Jun 11 Jul 11 -‐ Jun 12
Inpatient Prostate Cancer Cases at St. Francis Hospital from Delta County Region
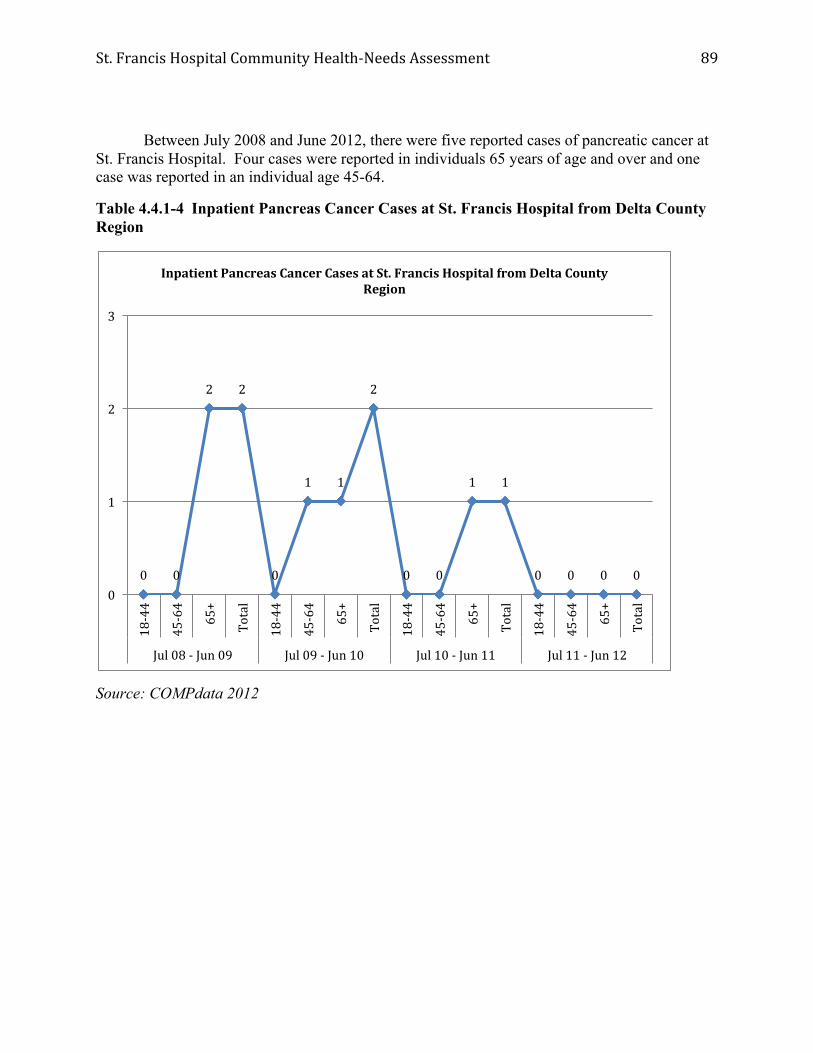
St. Francis Hospital Community Health-‐Needs Assessment
89
Between July 2008 and June 2012, there were five reported cases of pancreatic cancer at St. Francis Hospital. Four cases were reported in individuals 65 years of age and over and one case was reported in an individual age 45-64.
Table 4.4.1-4 Inpatient Pancreas Cancer Cases at St. Francis Hospital from Delta County Region
Source: COMPdata 2012
0 0
2 2
0
1 1
2
0 0
1 1
0 0 0 0 0
1
2
3
18-‐44
45-‐64
65+
Total
18-‐44
45-‐64
65+
Total
18-‐44
45-‐64
65+
Total
18-‐44
45-‐64
65+
Total
Jul 08 -‐ Jun 09 Jul 09 -‐ Jun 10 Jul 10 -‐ Jun 11 Jul 11 -‐ Jun 12
Inpatient Pancreas Cancer Cases at St. Francis Hospital from Delta County Region

St. Francis Hospital Community Health-‐Needs Assessment
90
Cases of colorectal cancer at St. Francis Hospital have increased by 22.2% between 2008 and 2011 for inpatient admissions. The number of cases of colorectal cancer peaked between July 2009 and July 2010 when 14 cases were reported.
Table 4.4.1-5 Inpatient Colorectal Cancer Cases at St. Francis Hospital from Delta County Region
Source: COMPdata 2012
0
3
6
9
0
1
13
14
2
1 1
4
0
1
10
11
0
2
4
6
8
10
12
14
16
18-‐44
45-‐64
65+
Total
18-‐44
45-‐64
65+
Total
18-‐44
45-‐64
65+
Total
18-‐44
45-‐64
65+
Total
Jul 08 -‐ Jun 09 Jul 09 -‐ Jun 10 Jul 10 -‐ Jun 11 Jul 11 -‐ Jun 12
Inpatient Colorectal Cancer Cases at St. Francis Hospital from Delta County Region

St. Francis Hospital Community Health-‐Needs Assessment
91
Between July 2008 and June 2012, there were five reported cases of cervical and other female genital cancer at St. Francis Hospital. One cases was reported in an individual 65 years of age and over, three cases were reported in individuals age 45-64, and one case was reported in an individual age 18-44.
Table 4.4.1-6 Inpatient Cervical and Other Female Genital Cancer Including Precancer Cases at St. Francis Hospital from Delta County Region
Source: COMPdata 2012
0
1
0
1
0 0 0 0
1 1
0
2
0
1 1
2
0
1
2
3
18-‐44
45-‐64
65+
Total
18-‐44
45-‐64
65+
Total
18-‐44
45-‐64
65+
Total
18-‐44
45-‐64
65+
Total
Jul 08 -‐ Jun 09 Jul 09 -‐ Jun 10 Jul 10 -‐ Jun 11 Jul 11 -‐ Jun 12
Inpatient Cervical and Other Female Genital Cancer Including Precancer Cases at St. Francis Hospital from Delta County Region

St. Francis Hospital Community Health-‐Needs Assessment
92
4.4.2 Leukemia
Between July 2008 and June 2012, there were six reported cases of cervical and other female genital cancer at St. Francis Hospital. Two cases were reported in individuals 65 years of age and over, three cases were reported in individuals age 45-64, and one case was reported in an individual age 18-44.
Table 4.4.2-1 Inpatient Leukemia Cases at St. Francis Hospital from Delta County Region
Source: COMPdata 2012
0
2
0
2
0
1
0
1 1
0 0
1
0 0
2 2
0
1
2
3
18-‐44
45-‐64
65+
Total
18-‐44
45-‐64
65+
Total
18-‐44
45-‐64
65+
Total
18-‐44
45-‐64
65+
Total
Jul 08 -‐ Jun 09 Jul 09 -‐ Jun 10 Jul 10 -‐ Jun 11 Jul 11 -‐ Jun 12
Inpatient Leukemia Cases at St. Francis Hospital from Delta County Region

St. Francis Hospital Community Health-‐Needs Assessment
93
4.5 Type II Diabetes Importance of the measure: Diabetes is the leading cause of kidney failure, adult blindness and amputations and is a leading contributor to strokes and heart attacks. It is estimated that 90-95% of individuals with diabetes have Type II diabetes (previously known as adult-onset diabetes). Only 10-15% of individuals with diabetes have Type I diabetes (previously known as juvenile diabetes). The overall number of Type II Diabetes cases for inpatient admissions at St. Francis Hospital increased slightly between 2008 (15 cases) and 2011 (16 cases). The overall number of treated cases of Type I Diabetes decreased by 21% for inpatient admissions during the same time period. Data from the Michigan BRFSS indicate that nearly 10% of Delta County BRFSS Region residents have diabetes. Compared to data from the State of Michigan, the prevalence of diabetes now exceeds the state average. Table 4.5-1 Inpatient Type II Cases at St. Francis Hospital from Delta County Region
Source: COMPdata 2012
-‐
5 4
6
15
-‐
4 6
9
19
-‐ 2
6 4
12
-‐
5 7
4
16
-‐ 2 4 6 8 10 12 14 16 18 20
0-‐17
18-‐44
45-‐64
65+
Total
0-‐17
18-‐44
45-‐64
65+
Total
0-‐17
18-‐44
45-‐64
65+
Total
0-‐17
18-‐44
45-‐64
65+
Total
Jul 08 -‐ Jun 09 Jul 09 -‐ Jun 10 Jul 10 -‐ Jun 11 Jul 11 -‐ Jun 12
Cases
Inpatient Type II Cases at St. Francis Hospital from Delta County Region, July 08 -‐ June 12

St. Francis Hospital Community Health-‐Needs Assessment
94
Table 4.5-2 Inpatient Type 1 Cases at St. Francis Hospital from Delta County Region
Source: COMPdata 201
Table 4.5-3 Percent of Delta County Region Residents who have Diabetes
Source: Michigan Department of Public Health
4
13
2 -‐
19
3
10
-‐ -‐
13
2
9
1 -‐
12
2
10
3
-‐
15
-‐ 2 4 6 8 10 12 14 16 18 20
0-‐17
18-‐44
45-‐64
65+
Total
0-‐17
18-‐44
45-‐64
65+
Total
0-‐17
18-‐44
45-‐64
65+
Total
0-‐17
18-‐44
45-‐64
65+
Total
Jul 08 -‐ Jun 09 Jul 09 -‐ Jun 10 Jul 10 -‐ Jun 11 Jul 11 -‐ Jun 12
Cases
Inpatient Type I Cases at St. Francis Hospital from Delta County Region, July 08 -‐ June 12
9.7%
8.5% 9.8% 9.5%
7.5%
8.0%
8.5%
9.0%
9.5%
10.0%
Delta-‐Menominee County State of Michigan
Percent of Delta County Region Residents who have Diabetes
2005-‐2007 2008-‐2010
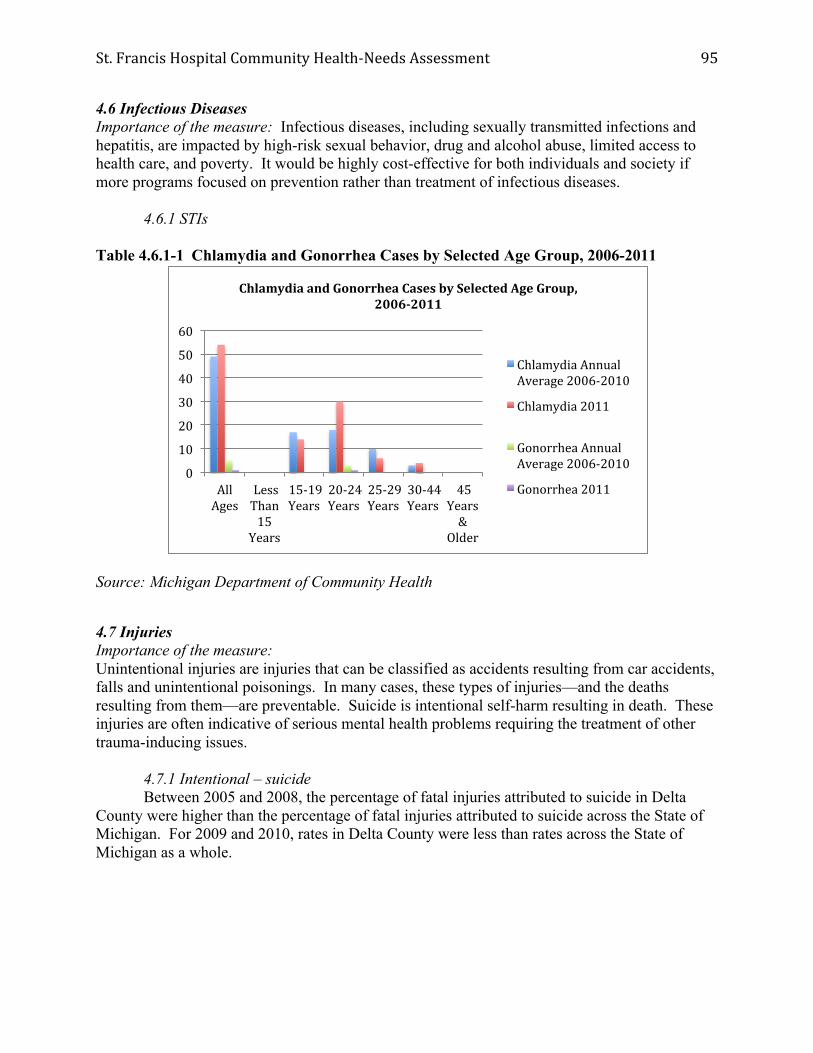
St. Francis Hospital Community Health-‐Needs Assessment
95
4.6 Infectious Diseases Importance of the measure: Infectious diseases, including sexually transmitted infections and hepatitis, are impacted by high-risk sexual behavior, drug and alcohol abuse, limited access to health care, and poverty. It would be highly cost-effective for both individuals and society if more programs focused on prevention rather than treatment of infectious diseases. 4.6.1 STIs Table 4.6.1-1 Chlamydia and Gonorrhea Cases by Selected Age Group, 2006-2011
Source: Michigan Department of Community Health
4.7 Injuries Importance of the measure: Unintentional injuries are injuries that can be classified as accidents resulting from car accidents, falls and unintentional poisonings. In many cases, these types of injuries—and the deaths resulting from them—are preventable. Suicide is intentional self-harm resulting in death. These injuries are often indicative of serious mental health problems requiring the treatment of other trauma-inducing issues. 4.7.1 Intentional – suicide Between 2005 and 2008, the percentage of fatal injuries attributed to suicide in Delta County were higher than the percentage of fatal injuries attributed to suicide across the State of Michigan. For 2009 and 2010, rates in Delta County were less than rates across the State of Michigan as a whole.
0
10
20
30
40
50
60
All Ages
Less Than 15 Years
15-‐19 Years
20-‐24 Years
25-‐29 Years
30-‐44 Years
45 Years &
Older
Chlamydia and Gonorrhea Cases by Selected Age Group, 2006-‐2011
Chlamydia Annual Average 2006-‐2010
Chlamydia 2011
Gonorrhea Annual Average 2006-‐2010
Gonorrhea 2011

St. Francis Hospital Community Health-‐Needs Assessment
96
Table 4.7.1-1 Percentage of Fatal Injuries Attributed to Suicide in Delta County, 2005- 2010
Source: Michigan Department of Community Health
4.7.2 Unintentional – motor vehicle Research suggests that car accidents are a leading cause of unintentional injuries. In Delta County, rates have historically been lower than rates across the State of Michigan, however, in 2008 and 2010, rates in Delta County were higher than rates across the State of Michigan.
33.3
38.1
24 20
7.1
20
19.9 19.6 19 19.9 19.7 21 0
5
10
15
20
25
30
35
40
45
2005 2006 2007 2008 2009 2010
Percentage of Fatal Injuries Attributed to Suicide in Delta County, 2005-‐2010
Delta County
State of Michigan

St. Francis Hospital Community Health-‐Needs Assessment
97
Table 4.7.2-1 Percentage of Unintentional Fatal Injuries Attributed to Motor Vehicles, 2005-2010
Source: Michigan Department of Community Health
Diseases/Morbidity: Strategic Implications
Emphasize prenatal health and infant care: It is essential that infants and children begin life healthy and preferably, at normal birth weights. Research suggests that infants born at low birth weight are at greater risk for life-threatening complications including infections, breathing problems, neurological problems and Sudden Infant Death Syndrome (SIDS).1 Other studies suggest that low birth weight babies are also at a higher risk for developmental disabilities, such as learning disabilities and attention deficits, than babies with normal birth weights. Cognitive function of low birth weight babies may also be diminished leading to higher rates of sub-average IQ (< 85) than normal birth weight babies. 2 Regular prenatal care is a vital aspect in producing healthy babies and children. The employment of screening and treatment for medical conditions as well as identification and interventions for behavioral risk factors associated with poor birth outcomes are important aspects of prenatal care. Research suggests that women who receive adequate prenatal care are more likely to have better birth outcomes, such as full term and normal weight babies.3 Prenatal care can provide health risk assessments for the mother and fetus, early intervention for medical conditions and education to encourage healthy habits, including nutritional and substance-free health during pregnancy. According to a study by The National Public Health and Hospital Institute, cost of care and other financial barriers were cited as reasons expectant mothers did not get adequate prenatal care.4
16.7 16.7
25
40
15.4
35.3 38.4
34.6 33.9 31.4
27.8 29.7
0 5 10 15 20 25 30 35 40 45
2005 2006 2007 2008 2009 2010
Percentage of Unintentional Fatal Injuries Attributed to Motor Vehicles, 2005-‐2010
Delta County
State of Michigan

St. Francis Hospital Community Health-‐Needs Assessment
98
Emphasize the link between blood pressure and cardiovascular diseases: Research from the Center for Disease Control estimated that the total cost of cardiovascular diseases in the United States for 2010 was $444 billion. 5 In essence, one out of every six dollars spent on health care is spent on the diagnosis and treatment of cardiovascular diseases. 6 However, controlling one’s blood pressure and decreasing one’s intake of cholesterol also reduces the risk of cardiovascular diseases. For example, research from the CDC suggests a “12–13 point reduction in average systolic blood pressure over 4 years can reduce heart disease risk by 21%, stroke risk by 37%, and risk of total cardiovascular death by 25%.” 7 Endnotes Chapter 4 1 Lucile Packard Children’s Hospital at Stanford University, High-Risk Newborn: Low Birthweight. Retrieved from http://www.lpch.org/DiseaseHealthInfo/HealthLibrary/hrnewborn/lbw.html. 2 Kessenich, M. (2003). Developmental Outcomes of Premature, Low Birth Weight, and Medically Fragile Infants. Newborn and Infant Nursing Reviews, 3, 3, 80-87. 3 Kiely, J.L. & Kogan, M.D. (1994). Prenatal Care. In Public Health Surveillance for Women, Infants, and Children. Atlanta, GA: U.S. Center for Disease Control 4 The National Public Health and Hospital Institute. Barriers to Prenatal Care Study: A Survey of Women Who Deliver at Public Hospitals, 2003. 5 U.S. Center for Disease Control and Prevention. Heart Disease and Stroke Prevention – At A Glance 2011. 6 Ibid. 7 Ibid.

St. Francis Hospital Community Health-‐Needs Assessment
99
CHAPTER 5. MORTALITY
Importance of the measure: Presenting data that focuses on diseases provides an opportunity to analyze the ratio of sick individuals to healthy individuals in Delta County and, in addition, define and quantify what diseases are causing the most death and disability. The top two leading causes of death in the State of Michigan and Delta County are nearly identical as a percentage of total deaths across all races. Diseases of the Heart comprise 26% of deaths in Delta County and Cancer comprises 23% of deaths in Delta County. While Chronic Lower Respiratory Disease contributes to more deaths in Delta County than the State of Michigan as a whole, the incidence of stroke in Delta County is less prevalent than across the State of Michigan as a whole.
Table 5.1-1. Top 5 Leading Causes of Death for all Races by County, 2010
Rank Delta County State of Michigan
1 Diseases of Heart (26.1%) Diseases of Heart (26.5%)
2 Cancer (23.5%) Cancer (23.4%)
3 Chronic Lower Respiratory Disease (6.1%) Chronic Lower Respiratory Disease (5.8%)
4 Stroke (4.9%) Stroke (5.1%)
5 Accidents (4.0%) Accidents (4.3%)
Source: Michigan Department of Community Health

St. Francis Hospital Community Health-‐Needs Assessment
100
With regard to the number of primary care physician visits per decadent in the last two years of life prior to death, OSF St. Francis Hospital rates lower than the State of Michigan average and the US average. Compared as a ratio to the US average, primary care physicians at St. Francis Hospital averaged 0.93 visits between 2003-2007. Table 5.1-2 Primary Care Physician Visits per Decadent in the Last Two Years of Life Before Death, 2003-2007
Source: Dartmouth Atlas of Health Care
0 0.2 0.4 0.6 0.8 1
1.2 1.4
OSF St. Francis Hospital
State of Michigan Average
US Average US 90th Percentile
US 50th Percentile
Primary Care Physician Visits per Decadent in the Last Two Years of Life Before Death, 2003-‐2007
2001-‐2005
2003-‐2007

St. Francis Hospital Community Health-‐Needs Assessment
101
With regard to the number of specialist care physician visits per decadent in the last two years of life prior to death, OSF St. Francis Hospital rates lower than the State of Michigan average and the US average. Compared as a ratio to the US average, specialist physicians at St. Francis Hospital averaged .49 visits between 2003-2007. Table 5.1-3 Specialist Care Physician Visits per Decadent in the Last Two Years of Life Before Death, 2003-2007
Source: Dartmouth Atlas of Health Care
0 0.2 0.4 0.6 0.8 1
1.2 1.4 1.6 1.8
OSF St. Francis Hospital
State of Michigan Average
US Average US 90th Percentile
US 50th Percentile
Specialist Care Physician Visits per Decadent In the Last Two Years of Life
Before Death, 2003-‐2007
2001-‐2005 2003-‐2007

St. Francis Hospital Community Health-‐Needs Assessment
102
With regard to the number of primary care physician visits per decadent in the last six months of life prior to death, OSF St. Francis Hospital rates lower than the State of Michigan average and the US average. Compared as a ratio to the US average, primary care physicians at St. Francis Hospital averaged .83 visits between 2003-2007. Table 5.1-4 Primary Care Physician Visits per Decadent in the Last 6 Months of Life Before Death, 2001-2007
Source: Dartmouth Atlas of Health Care With regard to the number of specialist care physician visits per decadent in the last six months of life prior to death, OSF St. Francis Hospital rates lower than the State of Michigan average and the US average. Compared as a ratio to the US average, specialist physicians at St. Francis Hospital averaged .43 visits between 2003-2007.
0
0.5
1
1.5
OSF St. Francis Hospital
State of Michigan Average
US Average US 90th Percentile
US 50th Percentile
Primary Care Physician Visits per Decadent In the Last 6 Months of Life Before Death, 2001-‐2007
2001-‐2005
2003-‐2007

St. Francis Hospital Community Health-‐Needs Assessment
103
Table 5.1-5 Specialists Care Physician Visits per Decadent in the Last 6 Months of Life Before Death, 2001-2007
Source: Dartmouth Atlas of Health Care Mortality: Strategic Implications Minimize unnecessary medical interventions to decrease mortality rates: Three decades of research suggests that more care for patients is associated with higher mortality.1 This paradox is best explained by the fact that all medical procedures possess risk and by increasing the number of interventions a patient receives, the more risk incurred by the patient. More risk increases the chances of errors and additional physicians becoming involved to treat the patient. The Institute of Medicine contends that this fragmentary nature of the US health care delivery system is one of the major drivers of poor quality and higher costs. 2 Poor quality disproportionately impacts those with chronic illnesses. Statistically, an estimated 90 million Americans live with at least one chronic illness, 70% of Americans die from chronic disease, and 90% of deaths among the Medicare population are attributed to just nine chronic illnesses: congestive heart failure, chronic lung disease, cancer, coronary artery disease, renal failure, peripheral vascular disease, diabetes, chronic liver disease, and dementia.3 The costs to treat chronic diseases are staggering, as inefficiencies drive up the cost of care. Patients with chronic conditions are often treated by primary care providers in addition to specialists. In most cases, little is done to coordinate treatments. Over time, as the chronic condition becomes more debilitating, patients require more care and the cost of care increases. According to the Dartmouth Institute for Health Policy and Clinical Practice, patients with chronic illnesses in their last two years of life account for nearly 32% of total Medicare spending. 4 Furthermore, overtreatment in the U.S. wastes an estimated 20 to 30 cents on every health care dollar spent.5
0
0.5
1
1.5
2
OSF St. Francis Hospital
State of Michigan Average
US Average US 90th Percentile
US 50th Percentile
Specialists Care Physician Visits per Decadent In the Last 6 Months of Life Before Death, 2001-‐2007
2001-‐2005
2003-‐2007

St. Francis Hospital Community Health-‐Needs Assessment
104
As noted in Tables 5.1-2 to 5.1-5, St. Francis Hospital rates lower than the State of Michigan and US national averages with regard to the number of primary physician and specialist physician patient visits in the last two years and six months of life. Address the diverse needs of underserved populations: Research suggests individuals of color are at greater risk to be afflicted with violent crime, perinatal conditions, and chronic diseases. The U.S. Bureau of Justice notes that a racial divide impacts the prevalence of individuals being stricken by violent crime. In 2005, national homicide rates for African Americans were six times higher than the rates for whites. 6 Adverse perinatal conditions include poor maternal health and nutrition, inadequate care during pregnancy and childbirth, and problems relating to premature births. With regard to chronic diseases including heart disease and cancer, the U.S. Department of Health and Human Services’ Office of Minority Health suggests African Americans are 30% less likely to be diagnosed with heart disease than Whites, but are more likely to die from it. Furthermore, African Americans are 1.5 times more likely than Whites to have high blood pressure and African American women are 1.7 times more likely to be obese.7 The incidence of strokes disproportionately impacts African Americans, as they are 70% more prone to having a stroke than Whites. With mortality rates, Black men are 60% more likely to die from a stroke. For stroke survivors, African Americans are more often disabled than Whites.8 For cancer, Black men are 30% more likely than Whites to have new cases of prostate cancer and are twice as likely to be diagnosed with stomach cancer. The 5-year survival rates for African Americans are lower for lung and pancreatic cancer, and they are 2.4 times as likely to die from prostate cancer. Black women are 10% less likely to be diagnosed with breast cancer than Whites, but they are 34% more likely to die from it. Black women are twice as likely to be diagnosed with stomach cancer and are 2.4 times more likely to die.9 Endnotes for Chapter 5 1 The Dartmouth Institute for Health Policy and Clinical Practice. (2008). Tracking the Care of Patients with Severe Chronic Illness. 2 Institute of Medicine. (2001). Crossing the Quality Chasm: A New Health System for the 21st Century. 3 The Dartmouth Institute for Health Policy and Clinical Practice. (2008). Tracking the Care of Patients with Severe Chronic Illness. 4 Ibid. 5 Skinner, J.S., Fisher, E.S., & Wennberg, J.E. (2005). The Efficiency of Medicare. In D. Wise (ed.) Analyses in the Economics of Aging. Chicago: University of Chicago Press and NBER. 6 U.S. Bureau of Justice Statistics, Homicide Trends in the U.S. Retrieved from http://bjs.ojp.usdoj.gov/content/homicide/race.cfm 7 U.S. Department of Health and Human Services’ Office of Minority Health. 8,9 Ibid.

St. Francis Hospital Community Health-‐Needs Assessment
105
PHASE II – PRIMARY DATA RESEARCH FOR COMMUNITY HEALTH NEEDS
To meet requirements of section 501(r)(3) of Schedule H Form 990, “…a community health needs assessment must take into account input from persons who represent the broad interests of the community served by the hospital(s), including those with special knowledge of or expertise in public health …” Moreover, for strategic planning purposes of each hospital, perceptions of various stakeholder groups can provide important insights into perceptions of the community regarding general health-care effectiveness.
Numerous opportunities may exist that are related to impacting community health benefits, but are not published in secondary research sources. Rather they are discovered through unbiased data collection, rigorous statistical modeling and analyses, and simple, common-sense interpretations and conclusions. Through this type of research, the health-care community can expect to identify areas for self-improvement, opportunities for addressing community needs and underlying perceptions of how demographics impact the community’s perceptions and effectiveness.
Phase II research consists of providing structure, information, documentation and practical interpretation of data. Five specific objectives are accomplished in the primary research:
• Create a statistically valid research instrument to collect necessary information; • Collect data using a partnership process (rather than respondent mentality); • Assess perceptions of current/potential community issues; • Segment markets based on key demographics; • Draw conclusions and discuss potential future directions to improve the health of the
community.
In Phase II of the community health needs assessment, there are four chapters that assess different aspects of the general community as well as specific health-related issues for the at-risk population. The chapters are as follows:
CHAPTER 6. GENERAL CHARACTERISTICS OF RESPONDENTS
CHAPTER 7. FINDINGS AND RESULTS COMMUNITY PERCEPTIONS
CHAPTER 8. ACCESSIBILITY TO HEALTH CARE
CHAPTER 9. HEALTH-RELATED BEHAVIORS

St. Francis Hospital Community Health-‐Needs Assessment
106
CHAPTER 6. GENERAL CHARACTERISTICS OF RESPONDENTS
As mentioned in the Methods section of this study, data were collected via on-line surveys and paper surveys. In this chapter, the characteristics of the sample are presented. A total of 871 surveys were completed. All data includes the entire sample, except where specifically noted.
Note that for most characteristics in this chapter, data are analyzed for: (1) the overall sample; and (2) by the at risk population. According to the CDC, at risk populations are characterized by economic disadvantage. Specifically, according to the CDC Public Health Workbook, at risk populations are defined as those individuals living in deep poverty, which for this study is operationalized as those with a household income of less than $20,000. Note that 544 respondents were in this income category.
6.1 Age
The average age of respondents was 54.21 years old. The distribution is reflective of the 2010 Census data, however, the mean age of surveyed respondents is slightly older, compared to the Census average age of 45.6 years old. This occurred because survey respondents were all adults, age 18 and above.
Table 6.1 Age Distribution for Delta County and Deep Poverty
4.4
15.6 12.1
16 19.1 16.7 16.1
9.2
29.4
12.3 16.8
11.5 9 11.8
0 5 10 15 20 25 30 35
Under 20 21-‐30 31-‐40 41-‐50 51-‐60 61-‐70 71 and older
Percentage of Respondents
Age Distribution for Delta County and Deep Poverty
Delta County Poverty

St. Francis Hospital Community Health-‐Needs Assessment
107
6.2 Race and Ethnicity
Table 6.2 Race/Ethnicity Distribution for Delta County and Deep Poverty
Overall demographics for race/ethnicity mirrored the secondary data assessed in Phase I. Comparing to Census data, the survey respondents, most ethnic backgrounds were similar to one another. While the percentage of individuals identifying as White was lower in the survey data, higher percentages of individuals identifying as Native Americans and Other were included in the study.
89.3
0.1
1
3.6
0.8
0
5.2
90.8
0.3
0.2
5.3
1.1
0
2.3
0 10 20 30 40 50 60 70 80 90 100
White
Black/African American
Hispanic/Latino
Native American/American Indian/Alaska Native
PaciWic Islander (Native Hawaiian, Samoan, Guamanian/Chamorro)
Asian (Indian, Pakistani, Japanese, Chinese, Korean, Vietnamese, Filipino/a)
Other
Race/Ethnicity Distribution for Delta County and Deep Poverty
Delta County
Poverty

St. Francis Hospital Community Health-‐Needs Assessment
108
6.3 Educational Attainment
Level of education for survey respondents was similar to Census data; however, note that 17.1% of those living in poverty have not completed high school.
Table 6.3 Highest Educational Attainment for Delta County and Deep Poverty
7.6
17.7 11.4
28.4 26.1
5.7 3.1 0.9 5.5
9.6
30
36.9
11.6 5.5
0 5 10 15 20 25 30 35 40
Percentage of Respondents
Highest Educational Attainment for Delta County and Deep Poverty
Delta County Poverty
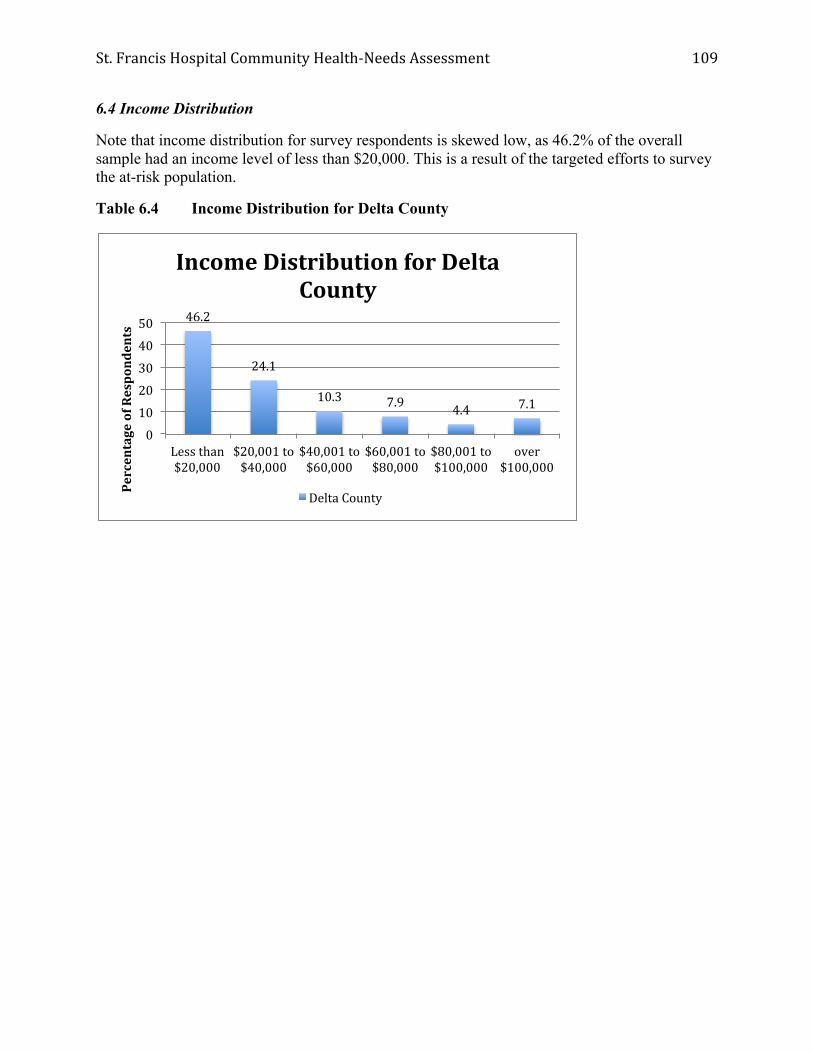
St. Francis Hospital Community Health-‐Needs Assessment
109
6.4 Income Distribution
Note that income distribution for survey respondents is skewed low, as 46.2% of the overall sample had an income level of less than $20,000. This is a result of the targeted efforts to survey the at-risk population.
Table 6.4 Income Distribution for Delta County
46.2
24.1
10.3 7.9 4.4 7.1
0
10
20
30
40
50
Less than $20,000
$20,001 to $40,000
$40,001 to $60,000
$60,001 to $80,000
$80,001 to $100,000
over $100,000
Percentage of Respondents
Income Distribution for Delta County
Delta County
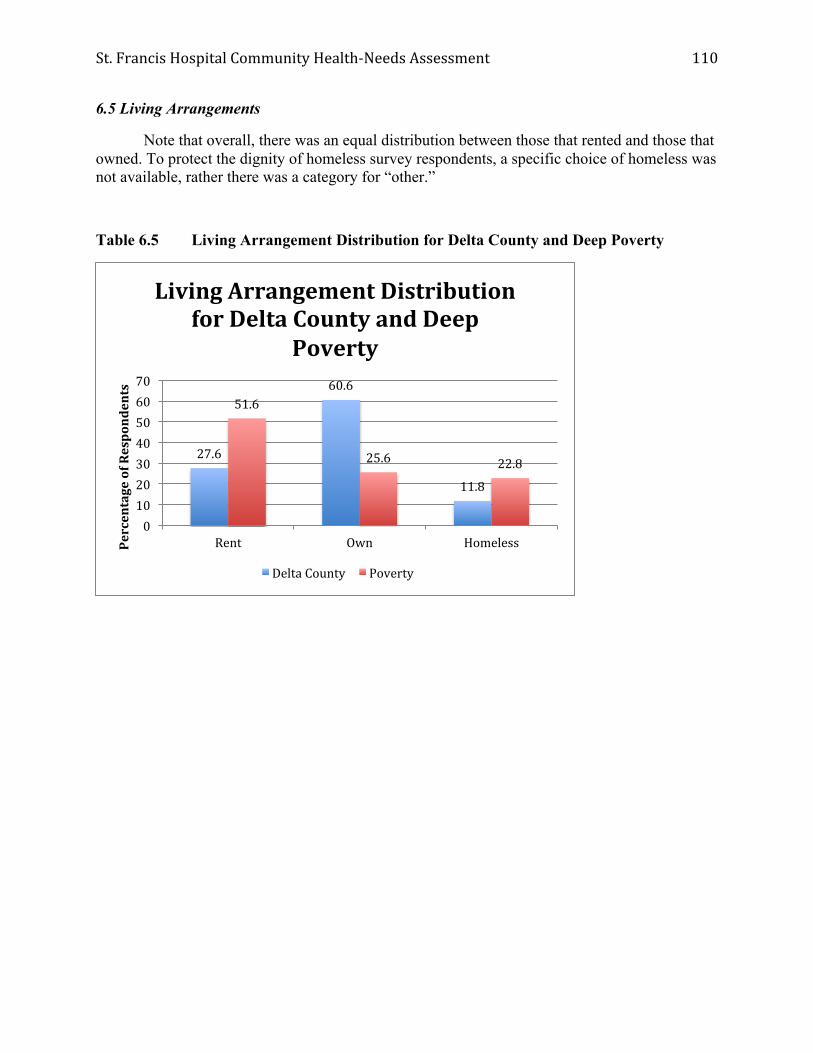
St. Francis Hospital Community Health-‐Needs Assessment
110
6.5 Living Arrangements
Note that overall, there was an equal distribution between those that rented and those that owned. To protect the dignity of homeless survey respondents, a specific choice of homeless was not available, rather there was a category for “other.”
Table 6.5 Living Arrangement Distribution for Delta County and Deep Poverty
27.6
60.6
11.8
51.6
25.6 22.8
0 10 20 30 40 50 60 70
Rent Own Homeless Percentage of Respondents
Living Arrangement Distribution for Delta County and Deep
Poverty
Delta County Poverty

St. Francis Hospital Community Health-‐Needs Assessment
111
6.6 Household Composition
Household composition is based on the number of individuals living in a household. Overall the most prevalent response was 2 people per household, with the exception of those living in deep poverty, where the most prevalent response was a single household.
Table 6.6 Household Composition for Delta County and Deep Poverty
6.7 Employment Status
For employment status, overall, 28% of respondents were employed full time, 16% were employed part time, and 10% were unemployed. The rest of the population was either retired, in school, disabled, or served in the armed forces or was a homemaker.
23.9
39.4
13 12.3 11.4
31.1 26.5
15.4 14 13
0
10
20
30
40
50
1 2 3 4 5 or more
Percentage of Respondents
Number of People in the Home
Household Composition for Delta County and Deep Poverty
Delta County
Poverty

St. Francis Hospital Community Health-‐Needs Assessment
112
6.8 Gender
The one demographic variable that was significantly skewed was gender. Overall 68.7% of respondents were women and 31.3% of respondents were men. According to Census data, there are more women in Delta County, but not to the extent of the survey respondents. For this type of survey, it is expected that women would be more likely to fill out the survey compared to men. Note that in a research study performed by the Heart of Illinois United Way in 2011, a positive correlation was found between women and concern for health-care related issues. Stated differently, women are more interested in participating in these types of surveys then men.
Table 6.8 Gender Composition for Delta County and Deep Poverty
31.3 32.4
68.7 67.6
0 10 20 30 40 50 60 70 80
Delta County Poverty
Percentage of Respondents
Gender Composition for Delta County and Deep Poverty
Male Female

St. Francis Hospital Community Health-‐Needs Assessment
113
CHAPTER 7. COMMUNITY PERCEPTIONS
In this chapter results of the first three sections of the survey are analyzed and discussed. Specifically, perceptions of Health Problems in the Community, Unhealthy Behaviors and factors impacting Quality of Life are presented. First, aggregate scores are presented. Then responses are presented for those living in deep poverty. After each category, correlation analyses between perceptions and demographic variables are presented in order to identify where certain demographic characteristics influence the way respondents perceive specific attributes of the community.
Note that for aggregated perceptions of the Delta County community, modifications to data were made given the skewed income data and skewed gender data. Therefore specific cases were selected randomly based on income and gender, in order to replicate the demographics of the community based on Census data. The sample used for aggregated analyses contains 638 responses.
7.1 Health Problems in the Community
7.1.1 Aggregated Results
The first dimension of the survey asked respondents to rate the three most important health problems in the community. Respondents had a choice of 20 different options. The health problem that rated highest was cancer. It was significantly higher than other categories based on t-tests between sample means.
This was followed by obesity, aging issues, and mental health issues. Statistically, all three of these choices were rated similarly. The next set of health problems identified were diabetes and heart disease, followed by dental health and chronic pain. Other categories were only identified 10% of the time or less.
Note that perceptions of the community were accurate in some cases, but inaccurate in others. For example, while cancer is a leading cause of mortality in Delta County, the number of cases treated has been steadily declining. Also, obesity is an important issue and the survey respondents accurately identified obesity as an important health problem.
In contrast, heart disease/heart attacks rated 6th on the list. This is the leading cause of death in Delta County.

St. Francis Hospital Community Health-‐Needs Assessment
114
Table 7.1.1 Delta County Frequencies for Most Important Perceived Health Problems in the Community
Note: n=638
47.5 39.7
37.5 36.2
27.7 22.8
16.9 10.8
8.9 4.8 4.6 4.1
2.6 2.6 2.3 2.2 1.7 1.4 1 0.1
0 5 10 15 20 25 30 35 40 45 50
Cancer Obesity/overweight
Aging issues Mental health issues
Diabetes Heart disease/attack
Dental health Chronic pain
Infectious diseases STI
Lung disease Injuries
Teenage pregnancy Stroke
HIV/AIDS Birth defects
Kidney disease Liver disease Infant death
Lead poisoning
Percentage of Respondents
Delta County Frequencies for Most Important Health Problems in the
Community

St. Francis Hospital Community Health-‐Needs Assessment
115
7.1.2 Perceptions of Individuals Living in Poverty
When assessing perceptions of those living in poverty, it can be seen that many of the health problems change in terms of importance. Mental health is the most important health problem and cancer is the second most important. Of particular interest, dental health and risky behavior such as “teenage pregnancy” become more important. However, heart disease/attack become even less important than the overall Delta County scores.
Table 7.1.2 Frequencies for Most Important Perceived Health Problems in the Community
from Individuals Living in Poverty
41.2 40.9
30.8 26.9 26.3
23 20.7
16.5 16.2
11.5 10.4
7.5 7.3
4.8 3.1 3.1 2.5 2.5 1.7 0.3
0 10 20 30 40 50
Mental health issues Cancer
Obesity/overweight Dental health Aging issues
Diabetes Teenage pregnancy
Heart disease/attack Chronic pain
Infectious diseases STI
Injuries Lung disease HIV/AIDS
Birth defects Kidney disease
Stroke Liver disease Infant death
Lead poisoning
Percentage of Respondents
Frequencies for Most Important Perceived Health Problems in the Community from Individuals Living
in Poverty
Delta County

St. Francis Hospital Community Health-‐Needs Assessment
116
7.1.4 Relationships between Perceptions and Demographics
Only significant relationships are reported in this section. The threshold used for significant correlations is (p < .05) given the sample size. The following relationships can be identified.
Aging Issues tend to be rated higher by individuals with the following characteristics: Older, educated, and higher income.
Birth Defects tend to be rated higher by individuals with lower income.
Cancer tends to be rated higher by individuals with the following characteristics: women, older, and White ethnicity.
Chronic pain tends to be rated higher by individuals with the following characteristics: Less educated and lower income.
Dental health tends to be rated higher by individuals with the following characteristics: Younger, less educated, and lower income.
Diabetes tends to be rated higher by older individuals.
Heart disease/attack tend to be rated higher by people with the following characteristics: Older, educated, and higher income.
HIV/AIDS tends to be rated higher by people with the following characteristics: Younger, less educated, and lower income. Individuals of White ethnicity tend to rate HIV/AIDS lower.
Infectious diseases tends to be rated higher by younger individuals.
Liver disease tends to be rated higher by younger individuals and by individuals of Native American ethnicity.
Mental Health Issues tend to be rated higher by younger individuals and by individuals of Native American ethnicity.
Obesity/Overweight tends to be rated higher by people with the following characteristics: White ethnicity, higher education, and higher income.
STIs tend to be rated higher by people with the following characteristics: younger, less educated, and lower income.
“Teenage Pregnancy” tends to be rated higher by people with the following characteristics: younger, less educated, and lower income.

St. Francis Hospital Community Health-‐Needs Assessment
117
Table 7.1.3 Significant Correlations among Most Important Perceived Health Problems in the Community and Demographic Variables
Gender Age Race
(White) Native
American Education Income
Aging issues + + +
Birth defects -
Cancer + + +
Chronic pain - -
Dental health - - -
Diabetes +
Heart disease/ Heart attack + + +
HIV/AIDS - - - - Infectious diseases -
Liver disease - +
Lung disease
Mental health issues - +
Obesity/ overweight + + +
STI - - - Teenage
pregnancy - - -

St. Francis Hospital Community Health-‐Needs Assessment
118
7.2 Unhealthy Behaviors
Respondents were asked to select the three most important unhealthy behaviors in the community out of a total of 14 choices based on importance. Again note that the modified sample of 638 was used for aggregated responses in order to more accurately reflect the characteristics of the Delta County population.
7.2.1 Aggregate Unhealthy Behaviors
The unhealthy behaviors that rated highest were drug abuse and alcohol abuse. They were both significantly higher than other categories based on t-tests between sample means.
This was followed by smoking, lack of exercise, and poor eating habits. Statistically, these three choices were rated similarly. The next set of unhealthy behaviors identified was angry behavior and violence. Suicide and child abuse followed next. Other categories were only identified 10% of the time or less.
Note that perceptions of the community were accurate in some cases, but inaccurate in others. For example, while drug and alcohol abuse are concerns Delta County, the number of individuals that smoke has increased steadily.

St. Francis Hospital Community Health-‐Needs Assessment
119
Table 7.2.1 Delta County Frequencies for Most Important Perceived Unhealthy Behaviors in the Community
Note: n=638
7.2.2 Perceptions of Individuals Living in Poverty
When assessing perceptions of those living in poverty, it can be seen that major issues like domestic abuse and child abuse become more important, indicating that individuals in poverty perceive more problems with violence in the home. Similarly alcohol abuse is significantly more important.
53.3 36.7
28 26.1 25.3
21.5 20.2
15.5 11.3
8.2 5.6
3.2 3 2.5
0 10 20 30 40 50 60
Drug abuse Alcohol abuse
Smoking Lack of exercise
Poor eating habits Angry behavior/violence
Domestic violence Suicide
Child abuse Not being able to receive a routine checkup
Reckless driving Unsafe sex Elder abuse
Failure to wear seatbelts
Percentage of Respondents
Delta County Frequencies for Most Important Perceived Unhealthy Behaviors in the Community

St. Francis Hospital Community Health-‐Needs Assessment
120
Table 7.2.3 Frequencies for Most Important Perceived Unhealthy Behaviors in the Community from Individuals Living in Poverty
58.3
56.3
30.5
23.8
22.4
22.4
18.8
16.5
16.2
8.7
8.1
4.8
4.5
3.9
0 10 20 30 40 50 60 70
Alcohol abuse
Drug abuse
Angry behavior/violence
Smoking
Domestic violence
Suicide
Lack of exercise
Child abuse
Poor eating habits
Reckless driving
Not being able to receive a routine checkup
Elder abuse
Unsafe sex
Failure to wear seatbelts
Percentage of Respondents
County Frequencies for Most Important Unhealthy Behaviors in the Community from individuals living in
poverty

St. Francis Hospital Community Health-‐Needs Assessment
121
7.2.3 Relationships between Perceptions and Demographics
Only significant relationships are reported in this section. The threshold used for significant correlations is (p < .01) given the large sample size. The following relationships can be identified.
Anger/Violence tends to be rated higher by individuals with the following characteristics: less educated and lower income.
Alcohol abuse tends to be rated higher by individuals with the following characteristics: educated and higher income.
Child abuse tends to be rated higher by individuals with the following characteristics: Women, younger, Native American ethnicity, less educated, and lower income.
Domestic Violence tends to be rated higher by older individuals and individuals identifying with White ethnicity.
Failure to wear a seatbelt tends to be rated higher by individuals with the following characteristics: Younger, less educated, and lower income.
Drug abuse tends to be rated higher by individuals identifying with Native American ethnicity.
Lack of exercise tends to be rated higher by people with the following characteristics: Men, older, educated, and higher income. Individuals identifying with Native American ethnicity tend to rate it lower.
Poor eating habits tends to be rated higher by people with the following characteristics: Educated and higher income.
Reckless driving tends to be rated higher by people with the following characteristic: Lower income.
Suicide tends to be rated higher by individuals with the following characteristics: younger, less educated, and lower income.

St. Francis Hospital Community Health-‐Needs Assessment
122
Table 7.2.3 Significant Correlations among Most Important Perceived Unhealthy Behaviors in the Community and Demographic Variables
Gender Age Race
(White) Native
American Education Income
Angry behavior/violence - -
Alcohol abuse + +
Child abuse + - + - - Domestic violence + +
Failure to wear seatbelts - - -
Drug abuse +
Elder abuse
Lack of exercise - + - + + Not being able to receive a routine
checkup
Poor eating habits + +
Reckless driving - Smoking
Suicide - - - Unsafe sex

St. Francis Hospital Community Health-‐Needs Assessment
123
7.3 Issues with Quality of Life
Respondents were asked to select the three most important issues impacting quality of life in the community out of a total of 9 choices based on importance. Again note that the modified sample of 638 was used for aggregated responses in order to more accurately reflect the characteristics of Delta County.
7.3.1 Aggregate issues impacting quality of life
The issues impacting quality of life that rated highest were job opportunities and access to health care. They were both significantly higher than other categories based on t-tests between sample means. It is not surprising that job opportunities was rated high given the recent recession.
This was followed by affordable housing. The next factors impacting quality of life identified were healthy food choices and less poverty. Statistically, both of these choices were rated similarly. This was followed by safer neighborhoods and transportation.
Table 7.3.1 Delta County Frequencies for Most Important Perceived Factors that Impact Quality of Life
Note: n=638
66.8 48.7
37.9 31.4 29.7
24.1 18.2
7.5 6.2
0 10 20 30 40 50 60 70 80
Job opportunities Access to health services
Affordable housing Healthy food choices
Less poverty Safer neighborhoods/schools Good public transportation Availability of child care Better school attendance
Percentage of Respondents
Delta County Frequencies for Most Important Perceived Factors
that Impact Quality of Life

St. Francis Hospital Community Health-‐Needs Assessment
124
7.3.2 Perceptions of Individuals Living in Poverty
When assessing perceptions of those living in poverty, it can be seen that perceptions are similar to the aggregated sample. With the exception of increased importance for affordable housing, the results are similar to the previous tables.
Table 7.3.2 Frequencies for Most Important Perceived Factors that Impact Quality of Life from Individuals Living in Poverty
7.3.3 Relationships between Perceptions and Demographics
Only significant relationships are reported in this section. The threshold used for significant correlations is (p < .01) given the large sample size. The following relationships can be identified.
Access to health services tend to be rated higher by individuals with the following characteristics: Women and older.
Affordable housing tend to be rated higher by people with the following characteristics: Younger, less educated, and lower income. Individuals identifying with Native American ethnicity tend to rate it lower.
Availability of child care tends to be rated higher by women and younger people.
Better school attendace tends to be rated higher by younger people and individuals identifying with White ethnicity.
Public transportation tends to be rated higher by older people.
68.6 49.9
45.9 33.1
27.2 22.7
20.2 9 7.6
0 10 20 30 40 50 60 70 80
Job opportunities Affordable housing
Access to health services Less poverty
Healthy food choices Good public transportation
Safer neighborhoods/schools Availability of child care Better school attendance
Percentage of Respondents
Frequencies for Most Important Perceived Factors that Impact Quality of Life from Individuals
Living in Poverty

St. Francis Hospital Community Health-‐Needs Assessment
125
Safer neighborhoods tends to be rated higher by White ethnicity and higher income.
7.3.3 Significant Correlations among Most Important Perceived Factors that Impact Quality of Life and Demographic Variables
Gender Age Race
(White) Native
American Education Income
Access to health services + +
Affordable housing - - - -
Availability of child care + -
Better school attendance - +
Job opportunities
Good public transportation +
Healthy food choices
Less poverty
Safer neighborhoods/schools + +
Community Perceptions: Strategic Implications
Heart disease appears to be perceived relatively low compared to actual causes of mortality. Specifically, younger people and low-income respondents appear to have the largest misperceptions regarding the importance of understanding heart disease in the community.
Additionally, dental health seems to be rated relatively low, even though annual dental checkups are lower than state averages. Younger respondents and those with lower income and education appeared to have the largest misperceptions.
Finally, there appears to be a misperception between perceived issues with diabetes and actual cases of diabetes. Specifically, younger respondents tend to misperceive the importance of diabetes in the community.

St. Francis Hospital Community Health-‐Needs Assessment
126
CHAPTER 8. ACCESSIBILITY TO HEALTH CARE
In this chapter, results examining access to health services are presented. Specifically, access to medical care, prescription medication, dental care and counseling are presented. First, scores are presented for Delta County. Next, responses are presented for those living in deep poverty. After each category, relationships between accessibility and demographic variables are presented in order to identify where certain demographic characteristics influence access to health services.
8.1 Choice of Medical Care
Respondents were asked to select the type of health care they used when they were sick. Six different alternatives were presented, including clinic or doctor’s office, emergency department, Urgent care facility, health department, no medical treatment, and other. The modified sample of 638 was used for aggregated responses in order to more accurately reflect the demographic characteristics for Delta County.
8.1.1 Aggregate Reponses
The most common response was clinic/doctor’s office, where 70.9% of survey respondents chose this as their primary choice for medical care. This was followed by not seeking medical attention (13%), other (7%), the emergency department at a hospital (5.1%), urgent care (3%) and health department (1%). Note however that Health Department numbers may be skewed lower, as no surveys were distributed at the Health Department to ensure accurate measures for accessibility to health care. Moreover, respondents may have interpreted the Health Department as a clinic.
Table 8.1.1 Delta County Frequencies for Choice of Medical Care
n=638
70.9 13
7 5.1 3 1
0 10 20 30 40 50 60 70 80
Clinic/Doctor's ofWice I don't seek medical attention
Other Emergency Department
Urgent Care Center Health Department
Percentage of Respondents
Delta County Frequencies for Choice of Medical Care

St. Francis Hospital Community Health-‐Needs Assessment
127
8.1.2. Perceptions of individuals living in poverty
Note that for individuals living in poverty, only 60% choose a clinic/doctor’s office as their first choice for medical care. Nineteen percent use an urgent care center and 10.5% utilize the emergency department when sick.
Table 8.1.2 Frequencies for Choice of Medical Care from Individuals Living in Poverty
8.1.3 Relationships between Choice of Medical Care and Demographics
Note that for Chapter 8 and 9 the homeless are added as a demographic variable.
Health department tends to be rated higher by people with the following characteristics: Women, older, White ethnicity, educated, and higher income. Individuals identifying with Native American ethnicity tend to rate it lower.
Emergency department tends to be rated higher by people with the following characteristics: men, younger, White ethnicity, less education, and lower income. Individuals identifying with Native American ethnicity tend to rate it lower.
Don’t seek medical treatment tends to be rated higher by people with the following characteristics: younger and individuals identifying with Native American ethnicity. Individuals identifying with White ethnicity tend to rate it lower.
60 19
10.5 5 3.5 2
0 10 20 30 40 50 60 70
Clinic/Doctor's ofWice Urgent Care Center
Emergency Department Other
Health Department I don't seek medical attention
Percentage of Respondents
Frequencies for Choice of Medical Care from individuals living in
poverty

St. Francis Hospital Community Health-‐Needs Assessment
128
Table 8.1.3 Significant Correlations among Choice of Health Care and Demographic Variables
Gender Age Race
(White) Native
American Education Income
Health Department + + + - + +
Emergency Department - - + - - -
Clinic/Doctor's office
I don't seek medical attention - - + -
Urgent Care Center
8.2 Frequency of Checkups
8.2.1 Aggregated responses
Respondents were asked how often they had a checkup. Of respondents, 67.7% received a checkup in the last year, 13.8% in the past 1-2 years, 6.8% in the last 3-5 years, 8.5% 5 years or more and 3.2% have never been to a doctor’s office for a checkup. The modified sample of 638 was used for aggregated responses in order to more accurately reflect the demographic characteristics of Delta County.
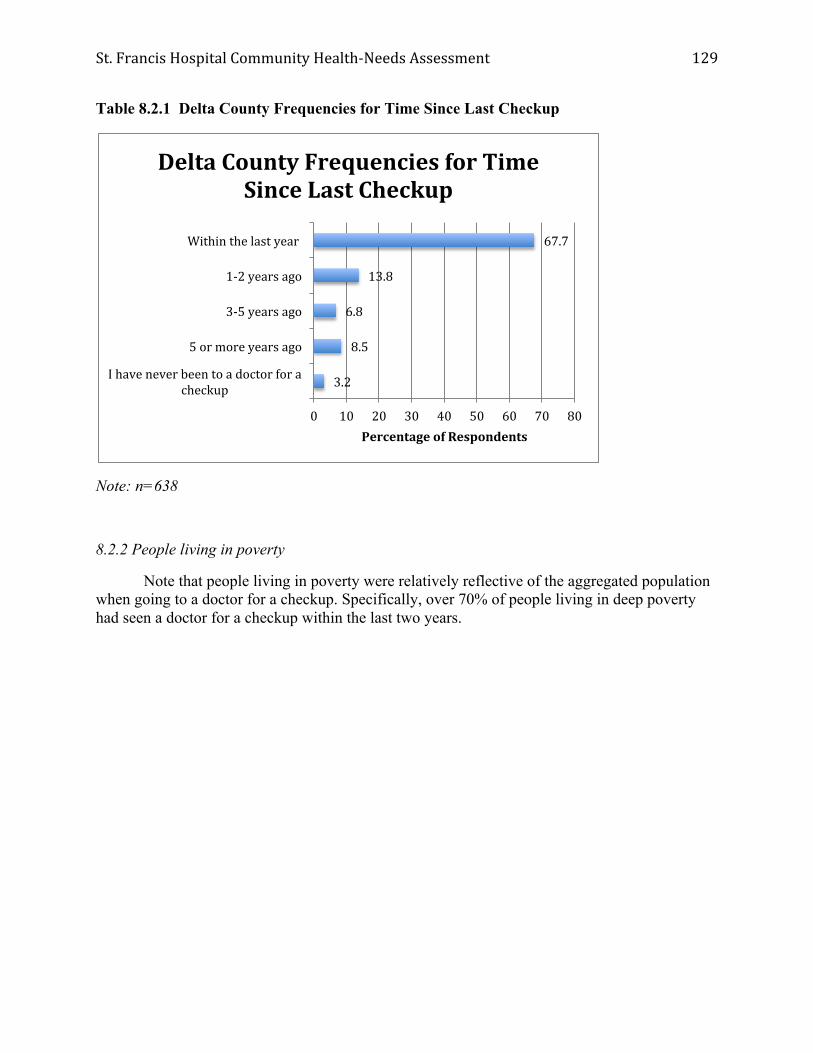
St. Francis Hospital Community Health-‐Needs Assessment
129
Table 8.2.1 Delta County Frequencies for Time Since Last Checkup
Note: n=638
8.2.2 People living in poverty
Note that people living in poverty were relatively reflective of the aggregated population when going to a doctor for a checkup. Specifically, over 70% of people living in deep poverty had seen a doctor for a checkup within the last two years.
67.7
13.8
6.8
8.5
3.2
0 10 20 30 40 50 60 70 80
Within the last year
1-‐2 years ago
3-‐5 years ago
5 or more years ago
I have never been to a doctor for a checkup
Percentage of Respondents
Delta County Frequencies for Time Since Last Checkup

St. Francis Hospital Community Health-‐Needs Assessment
130
Table 8.2.2 Frequencies for Time Since Last Checkup from Individuals Living in Poverty
8.2.3 Relationships between frequency of checkups and demographics
The data show that men, younger people, individuals with less income, and homeless individuals are less likely to get a checkup at a doctor’s office. Moreover, results of Ordinary-Least-Squared regression models show that homelessness is the most important predictor, followed by income and gender, based on significance levels of beta coefficients.
Table 8.2.3 Significant Correlations for Time Since Last Checkup
Gender -
Age -
Income - Homeless +
8.3 Access to Medical Care
Respondents were asked, “Was there a time when you needed medical care but were not able to get it?” 81% of Delta County residents were able to receive medical care, however compared to
58.8 15.9
9.7 12.2
3.4
0 10 20 30 40 50 60 70
Within the last year 1-‐2 years ago 3-‐5 years ago
5 or more years ago I have never been to a doctor for a
Percentage of Respondents
Frequencies for Time Since Last Checkup from Individuals Living
in Poverty

St. Francis Hospital Community Health-‐Needs Assessment
131
individuals living in deep poverty, only 70% were able to receive medical care. Put differently, 30% of individuals living in poverty could not get access to medical care when necessary.
Table 8.3.1 Frequencies for “Was there a time when you needed medical care but were not able to get it?” for Delta County and Individuals Living in Poverty
For relationships between access to medical care and demographics, note that the relationships are reverse coded. Therefore a survey respondent was more likely to answer that they did not have access to medical care if they identified with Native American ethnicity and were homeless. Individuals who were older, of White ethnicity, possessed more education, and higher income were less likely to have difficulty accessing medical care. Logit regression results indicate that less education, younger people and homeless were the most important predictors respectively, based on significance levels of beta coefficients.
81 70
19 30
0
20
40
60
80
100
Delta County Poverty
Percentage of Respondents
Frequencies for “Was there a time when you needed medical care but were not able to get it?” for Delta County and Individuals
Living in Poverty
No
Yes

St. Francis Hospital Community Health-‐Needs Assessment
132
Table 8.3.2 Significant Correlations for “Was there a time when you needed medical care but were not able to get it?”
Age -
White -
Native American +
Education -
Income -
Homeless +
The leading causes of why someone did not have access to medical care were no insurance (66%) and the inability to afford copayments or deductibles (25%). This was followed by too long to wait for an appointment (14%) and the doctor refusing to accept insurance or Medicaid (5%). Note that total percentages do not equal 100% as respondents could choose more than one answer.

St. Francis Hospital Community Health-‐Needs Assessment
133
Table 8.3.3.1 Frequencies for “Why weren’t you able to get medical care?” for Delta County
Note: n=167
8.3.3.2 Relationships between Needing Medical Care and Demographics
No insurance tends to be rated higher by people with the following characteristics: younger, less educated, lower income, and homeless.
Can’t afford copay/deductible tends to be rated higher by people with the following characteristics: younger.
No way to get to the Doctor tends to be rated higher by people with the following characteristics: younger, Native American ethnicity, less educated, and lower income.
66
25
14
1
5
1
2
0 10 20 30 40 50 60 70
I didn't have heath insurance
I couldn't afford to pay my co-‐pay or deductable
Too long to wait for appointment
I didn't have any way to get to the doctor
The doctor or clinic refused to take my insurance or Medicaid
I didn't know how to Wind a doctor
Fear
Percentage of Respondents
Frequencies for “Why weren’t you able to get medical care?” for Delta County

St. Francis Hospital Community Health-‐Needs Assessment
134
Refused insurance or Medicaid tends to be rated higher by people with the following characteristics: Native American ethnicity, less educated, lower income, and homeless. Individuals of White ethnicity tend to rate it lower.
Fear tends to be rated higher by younger individuals.
Table 8.3.3.2 Significant Correlations for “Was there a time when you needed medical care but were not able to get it?”
8.4 Access to Prescription Drugs
Respondents were asked, “Was there a time when you needed prescription medicine but were not able to get it?” 79% of Delta County residents were able to receive prescription medicine, however compared to individuals living in deep poverty, only 66% were able to receive prescription drugs. Put differently, 34% of individuals living in poverty could not get access to medical care when necessary.
Gender Age Race
(White) Native
American Education Income Homeless
No Insurance - - - +
Can't afford copay/deductible -
No way to get to Doctor - + - -
Refused my insurance/Medicaid - + - - +
I don't know how to find a doctor
Too long for an appointment
Fear -

St. Francis Hospital Community Health-‐Needs Assessment
135
For relationships between access to prescription medications and demographics, logit regression results indicate that low income, homeless, younger people, less educated and non-White residents were the most important predictors respectively, based on significance levels of beta coefficients.
Table 8.4.1 Frequencies for “Was there a time when you needed prescription medicine but were not able to get it?” for Delta County and Individuals Living in Poverty
The leading causes of why someone did not have access to prescription medicine were no insurance (42%) and the inability to afford copayments or deductibles (35%). This was followed by no way to get to the pharmacy (5%). Note that total percentages do not equal 100% as respondents could choose more than one answer.
21
34
79
66
0 10 20 30 40 50 60 70 80 90
Overall Poverty
Percentage of Respondents
Frequencies for “Was there a time when you needed prescription medicine but were not able to get it?” for Delta County and
Individuals Living in Poverty
Yes
No

St. Francis Hospital Community Health-‐Needs Assessment
136
Table 8.4.2 Significant Correlations for “Was there a time in the last year when you needed prescription medication and were unable to get it?”
Age -
Education -
Income -
Homeless +
For relationships between needing prescription drugs and demographics, note that the relationships are reverse coded. Therefore a survey respondent was more likely to answer that they did not have access to prescription drugs if they were younger, they possessed less education, lower income, and were homeless.
Table 8.4.3 Frequencies for “Why weren’t you able to get prescription medicine?” for Delta County
Note: n=167
42
35
5
4
1
0 5 10 15 20 25 30 35 40 45
I didn't have heath insurance
I couldn't afford to pay my co-‐pay or deductable
I didn't have any way to get to the pharmacy
The pharmacy refused to take my insurance or Medicaid
I didn’t know how to Wind a pharmacy
Percentage of Respondents
Frequencies for “Why weren’t you able to get prescription medicine?” for
Delta County

St. Francis Hospital Community Health-‐Needs Assessment
137
Table 8.4.4 Significant Correlations for Reasons Why Individuals Were Not Able to Obtain Prescription Medication in the Past Year
Note that “No Insurance” tends to be rated higher by people with the following characteristics: Younger, less educated, and homeless. In addition, younger individuals are more likely to rate “couldn’t afford copay/deductible” as reasons they were unable to obtain prescription drugs in the past year. Finally, individuals with lower incomes and homeless individuals are more likely to rate “I didn’t have any way to get to the pharmacy” as reasons they were unable to obtain prescription drugs in the past year.
8.5 Access to Dental Care
Respondents were asked when was the last time that they had a dental checkup. Residents in Delta County indicated that 55% of residents have had a dental checkup in the last year. For those living in deep poverty, only 31% had a dental checkup in the last year.
Note that Ordinary-Least-Squared regression modeling indicates that homelessness, lower income, Native American ethnicity and lower education contribute to lower rated access to dental checkups, based on significance levels of beta coefficients.
Gender Age Race
(White) Native
American Education Income Homeless
No Insurance - - +
Can't afford copay/deductible -
I didn’t know how to find a pharmacy
Refused my insurance/Medicaid I didn't have any way to get to the pharmacy - -

St. Francis Hospital Community Health-‐Needs Assessment
138
Table 8.5.1 Frequencies for Time Since Last Dental Checkup for Delta County and Individuals Living in Poverty
Respondents were then asked, “Was there a time when you needed dental care but were not able to get it?” Note that for Delta County, only 27% respondents indicated that they were unable to obtain dental care when they needed it. Compared to the figures for people living in poverty, 42% indicated that they could not get access to dental care when necessary.
Logistic regression modeling indicated that lower income, younger age and non-White residents were more likely not to have access to dental care, based on significance levels of beta coefficients.
55
17
11 15
2
31
25
16
25
3
0
10
20
30
40
50
60
Within the last year
1-‐2 years ago
3-‐5 years ago
5 or more years ago
I have never
been to a dentist for a checkup
Percentage of Respondents
Frequencies for Time Since Last Dental Checkup for Delta County and Individuals Living in Poverty
Delta County
Poverty

St. Francis Hospital Community Health-‐Needs Assessment
139
Table 8.5.2 Significant Correlations for Time Since Last Dental Checkup
Gender
Age -
White - Native American +
Education -
Income -
Homeless +
For relationships between time since last dental checkup and demographic variables, note that the relationships are reverse coded. Therefore a survey respondent was more likely to answer that a longer time has passed since his or her last dental checkup if they were younger, they were of Native American ethnicity, they were of lower income, possessed less education and were homeless.

St. Francis Hospital Community Health-‐Needs Assessment
140
Table 8.5.3 Frequencies for “Was there a time when you needed dental care but were not able to get it?” for Delta County and Individuals Living in Poverty
The leading causes of why someone did not have access to dental care were no insurance (71%) and the inability to afford copayments or deductibles (24%). While fear was a non-issue with access to medical care, 5% of respondents indicated they did not get access to dental care because they were uncomfortable going to the dentist. Note that total percentages do not equal 100% as respondents could choose more than one answer.
27
42
73
53
0 10 20 30 40 50 60 70 80
Delta County Poverty
Percentage of Respondents
Frequencies for “Was there a time when you needed dental care but were not able to get it?” for Delta County and Individuals Living in
Poverty
Yes
No

St. Francis Hospital Community Health-‐Needs Assessment
141
Table 8.5.4 Significant Correlations for “In the last year, was there a time when you needed dental care but could not get it?”
Gender
Age -
White - Native American
Education -
Income -
Homeless +
For relationships between needing dental care and demographic variables, note that the relationships are reverse coded. Therefore a survey respondent was more likely to answer that he or she needed dental care and were unable to receive it if they were younger, of non-White ethnicity, of lower income, homeless and possessed less education.
Table 8.5.5 Frequencies for “Why weren’t you able to get dental care?” for Delta County
Note: n=167
71 24
7 12 9
2 5
0 10 20 30 40 50 60 70 80
I didn't have dental insurance I couldn't afford to pay my co-‐pay or Too long to wair for appointment I didn't have any way to get to the
The dentist refused to take my I didn't know how to Wind a dentist
Fear
Percentage of Respondents
Frequencies for “Why weren’t you able to get dental care?” for Delta
County

St. Francis Hospital Community Health-‐Needs Assessment
142
Table 8.5.6 Significant Correlations for “Why weren’t you able to get dental care?”
Gender Age Race
(White) Native
American Education Income Homeless
No Insurance - - +
Can't afford copay/deductible - - +
I didn't have any way to get to the dentist - - +
Refused my insurance/Medicaid - - I didn't know how to find a dentist Too long to wait for appointment +
Fear - +

St. Francis Hospital Community Health-‐Needs Assessment
143
8.6 Access to Counseling
Respondents were asked, “Was there a time when you needed counseling but were not able to get it?” 12% of respondents in Delta County agreed that when he or she needed counseling, he or she was unable to obtain it. The percentage for individuals living in poverty is nearly double (21%).
Logit regression results indicated that low income, younger people and homelessness were the most important predictors of no access to counseling, respectively.
Table 8.6.1 Frequencies for “Was there a time when you needed counseling but were not able to get it?” for Delta County and Individuals Living in Poverty
12 21
88 79
0 10 20 30 40 50 60 70 80 90 100
Delta County Poverty
Percentage of Respondents
Frequencies for “Was there a time when you needed counseling but were not able to get it?” for Delta County and Individuals
Living in Poverty
Yes
No

St. Francis Hospital Community Health-‐Needs Assessment
144
Table 8.6.2 Significant Correlations for “In the last year, was there a time when you needed counseling but could not get it?”
Age -
Education -
Income -
Homeless +
For relationships between needing counseling and demographic variables, note that the relationships are reverse coded. Therefore a survey respondent was more likely to answer that he or she needed counseling and was unable to receive it if they were homeless, possessed less education, lower income, and were younger.
The leading causes of why someone did not have access to counseling were no insurance (54%) and the inability to afford copayments or deductibles (25%). Embarrassment was the third leading cause at 18%. Subsequent analyses revealed that members of the Homeless population were highly correlated to fear, embarrassment, refusal of insurance, and inability to pay one’s deductible. Note that total percentages do not equal 100% as respondents could choose more than one answer.
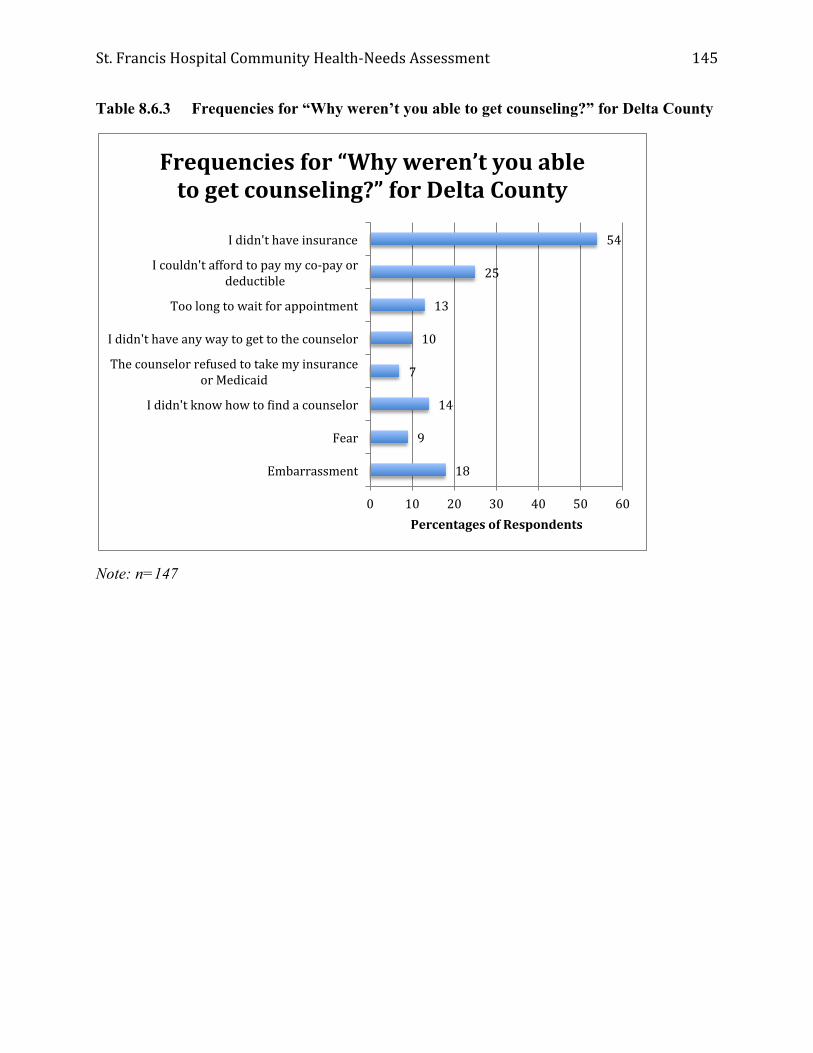
St. Francis Hospital Community Health-‐Needs Assessment
145
Table 8.6.3 Frequencies for “Why weren’t you able to get counseling?” for Delta County
Note: n=147
54
25
13
10
7
14
9
18
0 10 20 30 40 50 60
I didn't have insurance
I couldn't afford to pay my co-‐pay or deductible
Too long to wait for appointment
I didn't have any way to get to the counselor
The counselor refused to take my insurance or Medicaid
I didn't know how to Wind a counselor
Fear
Embarrassment
Percentages of Respondents
Frequencies for “Why weren’t you able to get counseling?” for Delta County

St. Francis Hospital Community Health-‐Needs Assessment
146
Table 8.6.4 Significant Correlations for Reasons Why Individuals Were Not Able to Obtain Counseling in the Past Year
Gender Age Race
(White) Native
American Education Income Homeless
No Insurance -
Can't afford copay/deductible - - +
I didn't have any way to get to the counselor
Refused my insurance/Medicaid - +
Too long to wait for appointment -
Fear - - - +
Embarrassment - - +
Note several significant relationships between demographic variables and the reasons why individuals were not able to obtain counseling in the past year:
No Insurance tends to be rated higher by younger people.
Can’t afford copay/deductible tends to be rated higher by individuals with lower income, less education and homeless individuals.
Refused my Medicaid/Insurance tends to be rated higher by younger people and homeless individuals.
Too long to wait for an appointment tends to be rated higher by younger people
I didn’t have any way to get to the counselor tends to be rated higher by younger people.
Embarrassment tends to be rated higher by younger individuals, individuals with lower income, and those who are homeless.
Fear tends to be rated higher by younger individuals, individuals with lower income, individuals with less education, and those who are homeless.

St. Francis Hospital Community Health-‐Needs Assessment
147
8.7 Access to Information
Respondents were asked, “Where do you get most of your medical information.” The vast majority of respondents obtained information from their doctor. While the Internet was the second most common choice, it was significantly lower than information from doctors. Note that for individuals living in poverty, friends/family were nearly as important to the Internet.
There were no statistically significant relationships between access to information and demographic factors.
Table 8.7.1 Frequencies for “Where do you get most of your medical information?” for Delta County and Individuals Living in Poverty
8.8 Personal physician
Respondents were asked if they had a personal physician. For Delta County, most respondents indicated that they had a personal physician.
Logit regression analyses reveal that people with higher incomes, women and older people positively impacted whether someone had a personal physician, and homelessness had a negative impact on whether someone had a personal physician.
57
14 19
3
55
17 18
4
0 10 20 30 40 50 60
Percentages of Respondents
Frequencies for “Where do you get most of your medical information?” for Delta County and Individuals
Living in Poverty
Delta County
Poverty

St. Francis Hospital Community Health-‐Needs Assessment
148
Table 8.8.1 Frequencies for “Do you have a personal physician?” for Delta County and Individuals Living in Poverty
Numerous significant relationships exist between access to a personal physician and demographic variables. Specifically, a survey respondent was more likely to answer that he or she did not have a personal physician if they were homeless and was more likely to answer that he or she did have a personal physician if he or she was a woman, older, more educated, and earn more income.
Table 8.8.2 Significant Correlations among Access to a Personal Physician and Demographic Variables
Gender Age Race
(White) Native
American Education Income Homeless
Do you have a personal physician? + + + + -
83 74
17 26
0
20
40
60
80
100
Delta County Poverty Percentage of Respondents
Frequencies for “Do you have a personal physician?” for Delta County and Individuals Living in
Poverty
Yes
No

St. Francis Hospital Community Health-‐Needs Assessment
149
8.9 Type of Insurance
Respondents were asked to identify the type of insurance that they had. In Delta County, the most prevalent type of insurance is private or commercial, however, those living in poverty are disproportionately more reliant on Medicaid. Also, for those living in poverty, 1/3 do not have any type of insurance at all.
Table 8.9.1 Frequencies for Insurance Coverage for Delta County and Individuals Living in Poverty
Access to Health Care: Strategic Implications
Approximately 80% of people living in deep poverty seek medical services at a clinic or doctor’s office. For this segment of the population, while 10.5% seek medical services from an emergency department, approximately 7% will not seek any medical services at all or “other” non-traditional sources of care. Those most likely to not seek any medical services when sick include younger individuals and individuals identifying with Native American ethnicity.
30% of the population living in deep poverty indicated there was a time in the last year when they were not able to get medical care when needed. According to regression results, this was more likely among homeless people and younger people and those with low incomes. The leading causes were lack of insurance and inability to afford a copayment or deductible. Similar results were found for access to prescription medication. Regression results indicated that homelessness, younger people, lower education and individuals with low incomes were less likely to have access to necessary prescription medication. Again the leading causes of the
26 21
17
35 40
14 17
30
0 5 10 15 20 25 30 35 40 45
Delta County Poverty
Percentages of Respondents
Frequencies for Insurance Coverage for Delta County and Individuals Living in Poverty
Medicare
Medicaid
Private/commercial
None
St. Francis Hospital Community Health-‐Needs Assessment
150
inability to have access to prescription medications were lack of insurance and inability to afford copayment or deductibles.
While significant research exists linking dental care to numerous diseases, including heart disease, 55% of Delta County residents had a checkup in the last year. Specifically, younger individuals, lower income and less educated people were less likely to visit a dentist. Moreover, note that almost half of people living in poverty (42%) indicated that they needed dental care in the last year, but were not able to get it. Lack of dental insurance and inability to afford copayments were the leading causes, however fear was significantly higher for seeing a dentist compared to seeing a doctor.
Approximately 25% of people living in deep poverty indicated they were not able to get counseling when they needed it over the last 12 months. Leading indicators are younger people and homelessness. While affordability and insurance were the leading reasons, embarrassment were also significant barriers to mental health services.
Across categories, residents of Delta County get most of their medical information from doctors and the next most prevalent is the Internet.
The most prevalent type of insurance is private or commercial, however, those living in poverty are disproportionately more reliant on Medicaid. Also for those living in poverty, 1/3 do not have any type of insurance at all.

St. Francis Hospital Community Health-‐Needs Assessment
151
CHAPTER 9. HEALTHY BEHAVIORS
In this chapter, healthy behaviors of the community are presented. Specifically, frequency of physical exercise, healthy eating habits and smoking are examined. Additionally, overall self-perceptions of health are presented.
9.1 Physical Exercise
Respondents were asked how frequently they engage in physical exercise. The majority of the population across all categories does not engage in sufficient exercise. Note that these findings are more consistent with state averages when compared to data reported by the Michigan Behavioral Risk Factor Surveillance System data. For physical exercise, ordinary-least-square regression results show that men, younger people and educated people are more likely to engage in physical exercise, while homeless residents are not.
Only one significant relationship existed between physical exercise and demographic variables. Specifically, men were more likely to answer that they exercised regularly.
Table 9.1.1 Frequencies for “In the last week, how many times did you exercise?” for Delta County and Individuals Living in Poverty
Table 9.1.2 Significant Correlations among “In the last week, how many times did you exercise?” and Demographic Variables
Gender -
34 34 32 34
21 19 13 13
0 5 10 15 20 25 30 35 40
Delta County Poverty Percentage of Respondents
Frequencies for “In the last week, how many times did you
exercise?” for Delta County and Individuals Living in Poverty
None
1-‐2 times
3-‐5 times
More than 5 times

St. Francis Hospital Community Health-‐Needs Assessment
152
9.2 Healthy Eating
For healthy eating habits, about 28% of the population consumes at least three servings of fruits/vegetables in a day. Moreover, only about 2% of the population consumes the minimal recommended daily amount of vegetables. Some recent research by the CDC states that for a typical person consuming 2,200 calories per day, they should have 7 servings of vegetables.
Note that while most data from the CHNA survey is relatively consistent with the Michigan Behavioral Risk Factor Surveillance System data, there is a large discrepancy between those consuming 5-or-more servings of fruits and vegetables per day. While secondary data found that approximately 74.7% of respondents met this criterion, the CHNA survey found that only 2% of respondents consumed 5-or-more servings of fruits and vegetables per day. This may be partially explained by our focus on the at-risk population, however, given the large discrepancy, other factors may lead to these differences.
Table 9.2.1 Frequencies for “On a typical day, how many servings of fruits and/or vegetables do you eat?” for Delta County and Individuals Living in Poverty
6 9
66 70
26 20
2 1 0 10 20 30 40 50 60 70 80
Delta County Poverty Percentage of Respondents
Frequencies for “On a typical day, how many servings of fruits and/or vegetables do you eat?” for Delta County and Individuals Living in
Poverty
None
1-‐2 servings
3-‐5 servings
More than 5 servings

St. Francis Hospital Community Health-‐Needs Assessment
153
Table 9.2.2 Significant Correlations among Number of Servings of Fruits and Vegetables Consumed Daily and Demographic Variables
Gender +
Age +
Income +
Education +
Numerous significant relationships exist between consumption of fruits and vegetables and demographic variables. Specifically, a survey respondent was more likely to answer that he or she consumed more fruits and vegetables each day if they were older in age, were female, earned a higher income, and had attained higher levels of education.
9.3 Smoking
Smoking is increasing in Delta County, as seen in the secondary research presented earlier in this report. Primary data suggests that individuals living in poverty are significantly more likely to smoke. Note that when comparing these data to the Michigan Behavioral Risk Factor Surveillance System data, the CHNA survey assesses the frequency of smoking compared to whether a respondent smoked or did not smoke.
Table 9.3.1 Frequencies for “On a typical day, how many cigarettes do you smoke?” for Delta County and Individuals Living in Poverty
0
20
40
60
80
Delta County Poverty
Percentage of Respondents
Number of Cigarettes
Frequencies for “On a typical day, how many cigarettes do you smoke?” for Delta County and Individuals
Living in Poverty
None
1-‐4
5-‐8
9-‐12
More than 12

St. Francis Hospital Community Health-‐Needs Assessment
154
Table 9.3.2 Significant Correlations among Number of Cigarettes Smoked Daily and Demographic Variables
Age -
Race (White) - Native American +
Education -
Income - Homeless +
Numerous significant relationships exist between cigarette smoking and demographic variables. Specifically, a survey respondent was more likely to answer that he or she smoked more cigarettes each day if they identified with Native American ethnicity, were younger or were homeless.

St. Francis Hospital Community Health-‐Needs Assessment
155
9.4 Overall Health
In terms of self-perceptions of physical and mental health, 95% of the population indicated that they were in average or good physical health. Similar results were found for residents’ self-perceptions of mental health.
Table 9.4.1 Frequencies for “Overall, my physical health is __” for Delta County and Individuals Living in Poverty
Numerous significant relationships exist between overall physical health and demographic variables. Specifically, a survey respondent was more likely to answer that he or she possessed better physical health if they were of White ethnicity, older, earned a higher income, and had attained higher levels of education. Conversely, a survey respondent was more likely to answer that he or she possessed poorer physical health if they were Native American or homeless.
5 10
39
51 56
39
0
10
20
30
40
50
60
Delta County Poverty
Percentage of Respondents
Frequencies for “Overall, my physical health is __” for Delta County and Individuals Living in
Poverty
Poor
Average
Good

St. Francis Hospital Community Health-‐Needs Assessment
156
Table 9.4.2 Significant Correlations among Overall Physical Health and Demographic Variables
Age +
White +
Native American - Education +
Income +
Homeless -
Table 9.4.3 Frequencies for “Overall, my mental health is __” Delta County and Individuals Living in Poverty
0
10
20
30
40
50
60
70
80
Delta County Poverty
Percentage of Respondents
Frequencies for “Overall, my mental health is __” Delta County and Individuals Living in Poverty
Poor
Average
Good

St. Francis Hospital Community Health-‐Needs Assessment
157
Numerous significant relationships exist between overall mental health and demographic variables. Specifically, a survey respondent was more likely to answer that he or she possessed better mental health if they were of White ethnicity, older, earned a higher income, and had attained higher levels of education. Conversely, a survey respondent was more likely to answer that he or she possessed poorer mental health if they were Native American or homeless.
Table 9.4.4 Significant Correlations among Overall Mental Health and Demographic Variables
Age +
White +
Native American - Education +
Income +
Homeless -
Healthy Behaviors: Strategic Implications
For healthy behaviors, men in Delta County are more likely to engage in physical exercise, although 34% of the population engages in exercise at least 3 times a week. Similarly for healthy eating habits, about 28% of the population consumes at least three servings of fruits/vegetables in a day. Those that are more likely to have healthy eating habits include women, people with higher educations and more income, and older people. Given the documented research showing the benefits of physical exercise and healthy eating, this is a concern for the community, as most primary and secondary diagnoses in the Delta County community can be mitigated, to some extent, by healthy lifestyle.
Data suggests smoking is a concern in Delta County, with individuals identifying as Native American and as homeless being more likely to smoke.

St. Francis Hospital Community Health-‐Needs Assessment
158
In terms of self-perceptions of physical and mental health, 95% of the population indicated that they were in average or good physical health. Similar results were found for residents’ self-perceptions of mental health.

St. Francis Hospital Community Health-‐Needs Assessment
159
PHASE III – PRIORITIZATION OF HEALTH-RELATED ISSUES
The identification and prioritization of the most important health-related issues in Delta County are identified in Phase III. To accomplish this, a summary of Phase I and Phase II were performed to provide a foundation for the prioritization process. After summarizing all of the issues in the Community Health Needs Assessment, a comprehensive assessment of existing community resources was performed to identify the efficacy to which health-related issues were being addressed. Finally a collaborative team of leaders in the healthcare community used an importance/urgency methodology to identify the most critical issues in the area. Results are included in Chapter 10.
CHAPTER 10. PRIORITIZATION OF HEALTH-RELATED ISSUES
In this chapter, we identify the most critical health-related needs in the community. To accomplish this, first we identified the most important areas of concern. Next we completed a comprehensive inventory of community resources, and finally we identified the most important health concerns in the community.
Specific criteria used to identify these issues included: (1) magnitude to the community; (2) strategic importance to the community; (3) existing community resources; (4) potential for impact; and (5) trends and future forecasts.
10.1 Summary of Community Health Issues
Based on findings from the previous analyses, a chapter-by-chapter summary of key takeaways was necessary to provide a foundation to identify the most important health-related issues in the community. Considerations for identifying key takeaways included prevalence of the issues, importance to the community, impact, trends and projected growth.
Demographics (Chapter 1) – Three factors were identified as the most important areas of concern from the demographic analyses: increasing elderly population, mental health rates and poverty.
Insurance (Chapter 2) – Lack of insurance contributes to decreased accessibility to health care, including both medical and dental insurance.
Symptoms and Predictors (Chapter 3) – Based on prevalence and growth rates, factors were identified as having significant impact on the community. These include, obesity, hypertension and risky behaviors, including drug and alcohol abuse and smoking.
Diseases/Morbidity (Chapter 4) – By evaluating magnitude of morbidities and growth rates of morbidities, two specific issues were identified. These included asthma and diabetes (specifically Type II diabetes).

St. Francis Hospital Community Health-‐Needs Assessment
160
Mortality (Chapter 5) – The two leading causes of mortality were heart disease and cancer. While there were other categories for mortality, heart disease and cancer were significantly more prevalent than all other categories.
Community Misperceptions (Chapter 7) – Based on results from the survey, respondents to the survey incorrectly perceived “heart disease” and “diabetes” “dental health” as being relatively unimportant health concerns in the community.
Access to Health Services (Chapter 8) – Results from survey respondents defined as living in deep poverty indicated that access to healthcare services is limited. This includes medical, prescription, dental and mental healthcare.
Health-Related Behaviors (Chapter 9) – Results from survey respondents defined as living in deep poverty indicated that there are limited efforts at proactively managing one’s own health. This includes limited exercise, poor eating habits and increased incidence of smoking
In order to provide parsimony in the prioritization of key community health-related issues, the findings were aggregated into 11 key categories, based on similarities and duplication. The 11 areas were:
o Obesity o Risky Behaviors -Substance Abuse o Mental Health o Healthy Behaviors o Access to Health Services o Respiratory Issues o Heart Disease o Cancer o Diabetes o Community Health Misperceptions o Dental Issues

St. Francis Hospital Community Health-‐Needs Assessment
161
10.2 Community Resources After summarizing issues in the Community Health Needs Assessment, a comprehensive analysis of existing community resources was performed to identify the efficacy to which these 10 health-related issues were being addressed.
There are numerous forms of resources in the community. They are categorized as
recreational facilities, county health departments, community agencies and area hospitals/clinics. 10.2.1 Recreational Facilities (3) City of Escanaba Parks and Facilities Obesity, Healthy Behaviors, Heart Disease The City of Escanaba offers a variety of programs for infants, toddlers, early childhood, youth, adults, and seniors at the Catherine Bonifas Civic Center. Gladstone Fitness Center Obesity Gladstone Fitness Center offers a weight loss program and weight training with registered dietician consultants.
Northern Lights YMCA Healthy Behaviors, Obesity, Addiction, Access to Health Services The Northern Lights YMCA is a community based service organization dedicated to building the mind, body and spirit for members of the Delta County community. By offering value-based programs emphasizing education, health and recreation for individuals regardless of sex, race or socio-economic status the YMCA is increasing the quality of life in Delta County. 10.2.2 Health Departments (1) Public Health, Delta and Menominee Counties Obesity, Addiction, Healthy Behaviors, Access to Health Services, Heart Disease, Cancer, Diabetes The goal of the Delta-Menominee County Health Department is to protect and promote health and prevent disease, illness and injury. Public health interventions range from preventing diseases to promoting healthy lifestyles and from providing sanitary conditions to ensuring safe food and water. Specific programs of interest include the Wisewoman Program (Diabetes, Addiction, Healthy Behaviors).

St. Francis Hospital Community Health-‐Needs Assessment
162
10.2.3 Community Agencies/Private Practices (23) Tri-County Safe Harbor (formerly Alliance Against Violence and Abuse) Mental Health The Alliance Against Violence and Abuse offers services for all people who are abused. Services include a 24 hour crisis line, an emergency shelter, support groups, individual counseling, therapy, court advocacy, and referrals for legal, medical, financial, and housing. Alcoholics Anonymous Addiction Alcoholics Anonymous is a fellowship of men and women who share their experience, strength and hope with each other that they may solve their common problem and help others recover from alcoholism. American Red Cross, Superior U.P. Chapter Healthy Behaviors The American Red Cross is a humanitarian organization led by volunteers and guided by its Congressional Charter and the Fundamental Principles of the International Red Cross Movement that provides relief to victims of disaster and helps people prevent, prepare for, and respond to emergencies. Bay Cliff Health Camp Healthy Behaviors Bay Cliff is a year-round, nonprofit therapy and wellness center for children and adults with physical disabilities. Bay Cliff partners with non-profit organizations and schools interested in conducting programs at camp. These guest programs include health and wellness retreats, youth development camps, science and outdoor recreation programs, or volunteer and leadership trainings for people with & without disabilities. Bishop Noa Home for Senior Citizens Respiratory Issues, Heart Disease, Cancer, Diabetes The Bishop Noa Home for Senior Citizens provides a safe, healthy environment that promotes physical, emotional and spiritual well-being to residents, families and employees. Care Free Dental Clinic Dental Issues The Care Free Dental Clinic provides free dental care for Delta Country residents on a first come/first serve basis. The clinic specifically serves individuals who do not have any dental or medical insurance coverage. Catholic Social Services of the Upper Peninsula Addiction Catholic Social Services has a large mental health and substance abuse outpatient-counseling ministry. Last year it served over 2,000 UP residents with 12,000 appointments. Counseling offices are in Marquette, Escanaba, and Iron Mountain. The agency has recently taken over the Keenagers Home in Wakefield. This home is on the site of the former Divine Infant Hospital
St. Francis Hospital Community Health-‐Needs Assessment
163
and is home to 42 residents in either adult foster care, assisted living, or independent living. Catholic Social Services offers a general assessment for substance abuse and assesses the risk factors for the person's involvement in substance abuse, and will make treatment recommendations and/or refer individuals to the inpatient, outpatient or residential treatment services they need. Child and Family Services of the Upper Peninsula Mental Health Child and Family Services is a private, non-profit, non-sectarian agency dedicated to strengthening children and families by providing high-quality programs structured around five major themes: counseling services, child welfare services, home-based services, homeless prevention services, and community-based services. Community Action Agency and Human Resource Authority Obesity, Access to Health Services The Community Action Agency provides programs to negate the causes and symptoms of poverty. Specific programs of interest include the Senior Nutrition Services (Obesity), and RSVP (Access to Health Services). Delta County Department of Human Services Access to Health Services DCDHS provides health care coverage to individuals who meet certain eligibility requirements. All programs have an income test and some look at assets, these tests vary with each program. Some may have a medical spend down amount, where the individual will be required to pay a set amount per month towards medical expenses before the coverage will be available. Delta County Cancer Alliance Access to Health Services, Cancer DCCA provides wheelchairs, commodes, canes, lift chairs, hospital beds and various other equipment and supplies that are available to cancer patients free of charge. Delta Schoolcraft I.S.D. Career Tech Center Mental Health, Healthy Behaviors, Access to Health Services, Community Health Misperceptions DSISD provides career technical education courses designed to develop basic skills required for specific vocations, specifically Health Occupations. Family Nutrition and Food Safety Program Obesity The Family Nutrition and Food Safety program, offered through the Michigan State University Extension provides information concerning the basic principles of healthy eating, food handling, food preparation and shopping skills.

St. Francis Hospital Community Health-‐Needs Assessment
164
Great Lakes Recovery Centers – Escanaba Outpatient Services Addictions GLRC offers comprehensive outpatient drug abuse treatment services to families and individuals of all ages recovering from substance abuse. These services may include but are not limited to assessment, group therapy and relapse prevention. Pathways Community Mental Health Mental Health Pathways Community Mental Health primarily addresses mental health care. Pathways provides integrated substance abuse services for those individuals with a primary mental health, development disability, or severe emotional disturbance who also have a secondary substance use disorder. Case management services are provided to eligible consumers who need assistance in gaining access to health and dental services, financial assistance, housing, employment, education, social services, and other services and natural supports. United Way of Delta County Access to Health Services, Healthy Behaviors, Addiction, Mental Health The United Way of Delta County brings together people from business, labor, government, health and human services to address community's needs. Money raised through the United Way of Delta County campaign stays in community funding programs and services in Delta County. Lutheran Social Services of Wisconsin and Upper Michigan Mental Health Lutheran Social Services provides behavioral health services (counseling, substance abuse, mental health and developmental disabilities), children's community services (adoption, foster care, pregnancy counseling, residential services and Head Start), nursing and community services (long-term care and rehabilitation, home care services, adult day services, respite services for caregivers and retirement communities), prisoner and family ministry (support for children of incarcerated parents and their caregivers, re-entry programs, on-site prison programs, and justice education), and senior housing services (affordable housing for low-income seniors and people with disabilities). Medical Access Coalition Access to Health Services, Diabetes, Dental Issues MAC provides two county-wide administered programs that coordinate donated physician services and pharmacy services to uninsured adults who meet eligibility requirements. Offers information and assistance to access affordable healthcare services, assistance applying for free or discounted medications and offers a drug card for limited generic medications. Menominee-Delta-Schoolcraft Early Childhood Program Access to Health Care, Healthy Behaviors, Dental Issues MDS CAA ECP offers comprehensive preschool services for children ages 3-5 as well as infant/toddler services for pregnant moms and children up to age 3. All services are free of chard. Transportation is provided to classrooms whenever possible.

St. Francis Hospital Community Health-‐Needs Assessment
165
Salvation Army – Escanaba Mental Health The Salvation Army provides individual and family trauma counseling and emotional support. Society of St. Vincent de Paul Mental Health, Healthy Behaviors, Access to Services, Community Health Misperceptions The Society of St. Vincent de Paul offers tangible assistance to those in need on a person-to-person basis. It is this personalized involvement that makes the work of the Society unique. This aid may take the form of intervention, consultation, or often through direct dollar or in-kind service. Teaching Family Homes of Upper Michigan Addictions, Mental Health, Healthy Behaviors Teaching Family Homes offer programs for children and youth including residential care, group homes, foster care and adoption, supervised independent living, private school, crisis intervention, mental health assessment, homeless services, in-home counseling and family preservation.
Upper Peninsula Commission for Area Progress
Healthy Behaviors, Diabetes, Access to Health Services
The UPCAP is responsible for development, coordination, and provision of human, social, and community resources within the 15 counties of the Upper Peninsula of Michigan. Specific programs of interest include the 2-1-1 Information and Resource Center (Access to Health Services) and UP Diabetes Outreach Network (Diabetes).
Welcome Newborns Program Addiction, Healthy Behaviors The Welcome Newborn program, offered through the Michigan State University Extension, provides every family with a newborn a tote bag full of information on the development of their baby, the need for immunizations, parenting, the importance of reading to your baby, the affects of second hand smoke on children, and available community resources for the family in Delta County.
10.2.4 Hospitals/Clinics (2) Marquette General Hospital Obesity, Addiction, Mental Health, Healthy Behaviors, Access to Health Services, Asthma, Heart Disease, Cancer, Diabetes Marquette General Hospital is a 315-bed specialty care hospital that provides care in 65

St. Francis Hospital Community Health-‐Needs Assessment
166
specialties and subspecialties. With a medical staff of more than 200 doctors, the hospital cares for approximately 12,000 inpatients and more than 350,000 outpatients a year. OSF Saint Francis Hospital and Medical Group Obesity, Addiction, Mental Health, Healthy Behaviors, Access to Health Services, Asthma, Heart Disease, Cancer, Diabetes With a medical staff of more than 100 physician and 700 employees, OSF St. Francis Hospital and Medical Group is a fully-integrated health delivery system offering hospital-based, home care, and physician clinical services. Specific centers of interest include the Diabetes and Nutrition Education Center (Diabetes) and Cardiac Diagnostic Services (Heart Disease).
Table 10.2 illustrates the relationships between the community resources and the 11
summary areas identified in section 10.1. Assessment of these relationships was performed to identify potential gaps in coverage as the collaborative team prioritized health-related issues in the community. Table 10.2 Relationship between Community Resources and Community Needs

St. Francis Hospital Community Health-‐Needs Assessment
167
10.3 Prioritization of Community Health-Related Issues
In order to prioritize the previously identified dimensions, the collaborative team considered health needs based on: (1) short-term urgency – issues that need immediate attention; and (2) long-term strategic importance – issues that will have the most significant impact on the future health of the community. Additional considerations included the magnitude of the issues (e.g., what percentage of the population was impacted by the issue), growth rate or projected trend of the issue, magnitude to the community, existing community resources, and the potential to make a significant impact to the community. Using these criteria, the collaborative team prioritized the previously identified health issues. Results can be seen in Figure 10.3.
Figure 10.3 Importance/Urgency Matrix for Community Health Needs
High
Strategic Importance
Low High Urgency
Access to Health
Respiratory Issues
Obesity
Heart Disease
Cancer
Mental Health
Risky Behaviors -‐Substance Abuse
Healthy Behaviors
Diabetes
Community Misperceptions
Dental

St. Francis Hospital Community Health-‐Needs Assessment
168
In conclusion, the collaborative identified the five most critical health-related issues in Delta County as:
OBESITY
Research strongly suggests that obesity is a significant problem facing youth and adults nationally, as it has been linked to numerous morbidities (e.g., type II diabetes, hypertension, cardiovascular disease, cancer, etc). In Delta County, the rate of obesity has increased from 26.1% to 29.6% in a three-year period. During the same time frame, the percentage of the population that is defined as overweight has risen from 38.6% to 41%. Note that this is almost 6% higher than State of Michigan averages.
RISKY BEHAVIORS-SUBSTANCE ABUSE
In Delta County, 25% of respondents engage in binge drinking versus 18% in the State of Michigan. Both figures exceed the US national 90th percentile benchmark of 8%. There has also been a 4.5% increase for those identifying themselves as smokers in Delta County between 2005-2007 and 2008-2010. In contrast, there was a decrease for those identifying themselves as smokers for the State of Michigan during same time frame. Thus, Delta County is currently 8.5% higher than State of Michigan averages. Additionally, according to survey respondents, for both Delta County’s aggregate population and those living in poverty, drug and alcohol abuse were perceived as the two most important unhealthy behaviors in the community.
MENTAL HEALTH
While there was a slight decrease in average number of mentally unhealthy days indicated by Delta County residents between 2010 and 2012 from 4 to 3.5 days in the last month, it is 30% higher when compared to the U.S. 90th percentile. Moreover, among people living in poverty, mental health was rated as the most important health concern. COMMUNITY MISPERCEPTIONS
Based on results from the survey, respondents incorrectly perceived “diabetes,” “heart disease,” and “dental” as being relatively less important health concerns to the community. These results conflict with morbidity data that suggests diabetes rates in Delta County are higher than rates across the State of Michigan, mortality data that indicates heart disease is the leading cause of death in Delta County, and dental data illustrates Delta County residents have undergone annual dental checkups at a lower rate (62.8%) than rates for the State of Michigan (73.8) and have higher rates of lost teeth due to tooth decay or gum disease (19.9%) versus rates for the State of Michigan (13.8%). Moreover, for those respondents living in poverty, misperceptions of programs such as Medicaid and charity programs is evident given that respondents do not seek necessary medical care because they believe they cannot afford to pay. Finally, there are misperceptions with respondents’ self perceptions of their own health, as 94% felt that they are either average or above average in terms of their overall health.

St. Francis Hospital Community Health-‐Needs Assessment
169
DIABETES
It is estimated that 90-95% of individuals with diabetes have Type II diabetes (previously known as adult-onset diabetes). Diabetes is the leading cause of kidney failure, adult blindness and amputations and is a leading contributor to strokes and heart attacks. Data from the Michigan BRFSS indicate that nearly 10% of Delta County BRFSS Region residents have diabetes. Compared to data from the State of Michigan (9.5%), the prevalence of diabetes now exceeds the state average.
Note that while other factors, such as healthy behaviors, heart disease, access to health, dental, respiratory issues and cancer are all important attributes, in terms of importance and urgency, the collaborative team rated the other five categories as more important. As a validity check, note that the findings from this study are similar with the health assessments completed by the County Health Department.

St. Francis Hospital Community Health-‐Needs Assessment
170
APPENDIX 1. Sample Survey

St. Francis Hospital Community Health-‐Needs Assessment
171

St. Francis Hospital Community Health-‐Needs Assessment
172

St. Francis Hospital Community Health-‐Needs Assessment
173