subsistence and small commercial farmer ...sapa subsistence and small commercial farmer report...
TRANSCRIPT

SAPA Subsistence and Small Commercial Farmer Report 4Q2018
- 1 -
The South African Poultry Association
SUBSISTENCE AND SMALL COMMERCIAL FARMER REPORT FOR THE FOURTH QUARTER OF 2018 (4Q2018)
INTRODUCTION NOTE: Unless otherwise stated, all prices exclude VAT. We thank you for your continued contribution and participation in the subsistence and small commercial farmer survey. The stats reported here are dependent on each producer’s contribution, no matter how big or small, as the accuracy of the stats improve with each new participant. The information reported is three months in arrears to ensure that we comply with regulations set by the Competition Commission. It must be stated that SAPA is a representative association and is not in a position to assist any producers financially. SAPA’s contribution to the producers is making this valuable information available to you to assist with benchmarking your business against others and planning for the future. Many local and international organisations, banks, government departments, research organisations and investment houses make use of our statistics to make strategic decisions about funding and research priorities based on the information that we supply. Collection of statistics: The data presented in this report is obtained from the analysis of the small-scale farmer survey results from October to December 2018. These farmers are largely former DPFO members who have been absorbed into the Egg and Broiler Organisations, following the restructuring at SAPA. SAPA’s membership representation and size definitions are as follows:
Subsistence Farmers Small Commercial Farmers Large Commercial Farmers
Broilers Less than 1 500 per cycle 1 500 - 40 000 per cycle More than 40 000 per cycle
Eggs 1 - 499 hens 500 - 50 000 hens More than 50 000 hens
Any and all information, data, know-how, documentation, materials and other communications, written or oral, which
are disclosed or provided to SAPA, or its designees, by a SAPA member shall be regarded as confidential information
belonging to that member and will not be disclosed to any other member.
NOTE: There is an increase in the number of scam artists posing as suppliers to the industry (suppliers of hatchery equipment and point-of-lay pullets), please be aware of fraudulent companies posing as South African poultry
producers/suppliers on the internet. The fact that these websites are using the SAPA logo does not mean they are legitimate.
Should you wish to verify whether a company advertising on the internet is legitimate, please email the South African
Poultry Association at [email protected], or alternatively you can call us on 011-795-9920.

SAPA Subsistence and Small Commercial Farmer Report 4Q2018
- 2 -
The South African Poultry Association
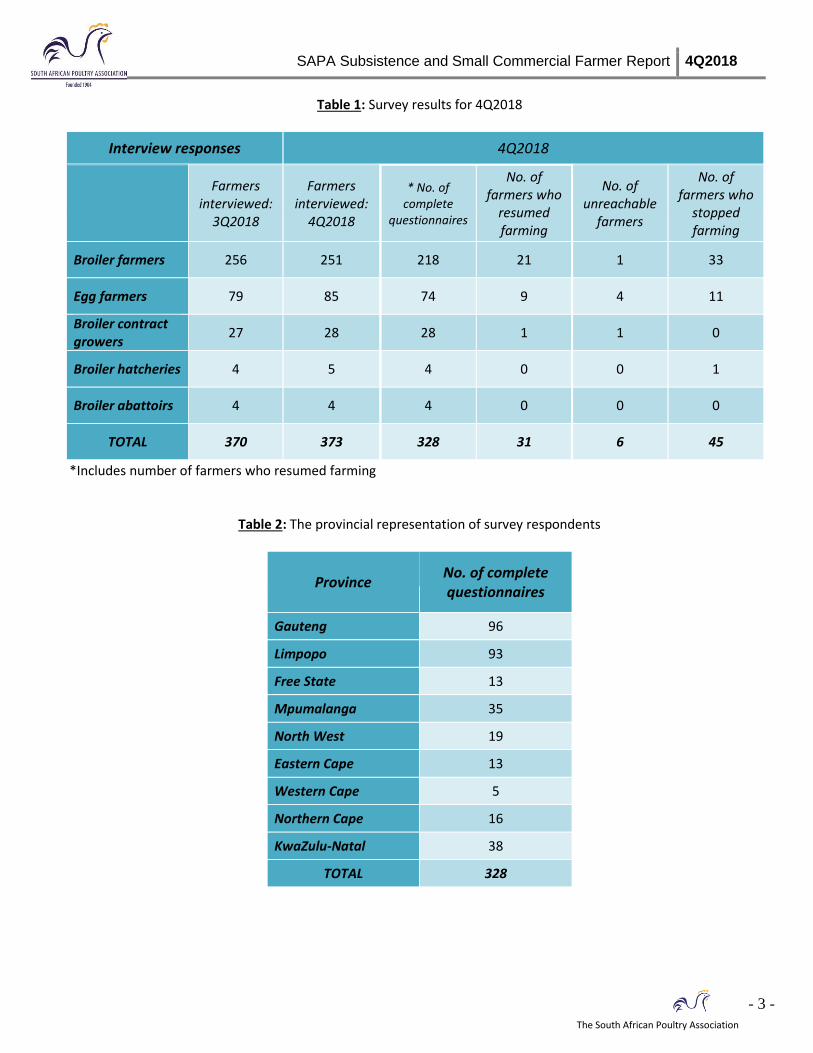
RECOMMENDATIONS FOR 4Q2018 As a producer it is important to be aware of the general value of your product in the market, both locally and remotely. The value of day-old pullets showed a noticeable increase in 4Q with the weighted average price per day-old pullet increasing by 32.4% from the previous quarter. This increased value was seen extended to the egg producers who paid 9.6% more for a point-of-lay pullet than they did in 3Q. It will be interesting to see if this trend continues in 1Q2019, if so, the hatcheries hatching day-old pullets, and pullet rearers, should try to maximise on this increased demand and increase their production. Similarly to 3Q, it is concerning to see the low value at which some egg producers are selling their product. There is a large difference between the weighted average egg price, and the average egg price per dozen in 4Q2018. This can be explained by the low average egg price of R11.67/doz achieved by egg producers selling more than 5 000 dozen eggs per week. These producers have priced their product far too low despite selling much larger quantities than their competitors. While it is acknowledged that there is a surplus of eggs in the country that may be driving prices down, and producers are very much at the mercy of their market due to selling a perishable product with a limited shelf life, the commercial retail price for the quarter was R28.34/doz large, hence these farmers should have room to increase the cost of their product. Subject to these farmers having a good market in their area, it is advisable that they reassess their pricing or this could cause irreparable damage to their business. Another way in which to ensure the survival of your business, apart from pricing your product correctly as discussed above, is managing the costs in your business. In order to expand, sufficient profit needs to be made to finance that expansion. If the input costs in the business are not under tight management they run the risk of cutting into the valuable profit. One of the most critical inputs to manage is the feed which represents approximately 60% of the input costs for egg producers, especially given the increasing trend of the layer mash cost over the last four quarters illustrated in graph 2. The feed intake has been calculated in the egg producers’ section and is much higher than the average commercial recommended feed intake of between 110 to 120 grams per hen per day (g/hd). These producers may have a feed wastage or theft problem, or are simply not aware of how much their birds are consuming. Either way, it is imperative that the feed stock is kept under tight control to ensure that the business does not incur unnecessary costs, as well as using the daily intake as an effective means to monitor the health of the flock. For further suggestions and recommendations please see the conclusion at the bottom of this document. SUMMARY OF INTERVIEWS DONE Table 1 summarises the survey results. In total 373 farmers were interviewed, which includes those who reported to have resumed or stopped farming, and those who completed the questionnaire, but it excludes unreachable farmers. The number of farmers who have resumed farming is included in the number of complete questionnaires, as shown in the table below. This report has 3 interviews more (+0.8%) than the previous quarter. The percentage of farmers who stopped farming decreased by 15.1% compared to the third quarter, this is largely due to the return of the warmer weather which is favoured by the farmers. A lot of respondents were still battling to locate stock, or were waiting for it to arrive, or had temporarily stopped farming to renovate their structures or clean them out, while a few respondents had insufficient money available to continue farming. The surveys were conducted amongst producers from all provinces (Table 2), with the largest proportion concentrated in Gauteng (29.3%), Limpopo (28.4%) and KwaZulu-Natal (11.6%). Figure 1 is a map showing the distribution of layer and broiler survey respondents for the fourth quarter.
SAPA Subsistence and Small Commercial Farmer Report 4Q2018
- 3 -
The South African Poultry Association
Table 1: Survey results for 4Q2018
Interview responses 4Q2018
Farmers interviewed:
3Q2018
Farmers interviewed:
4Q2018
* No. of complete
questionnaires
No. of farmers who
resumed farming
No. of unreachable
farmers
No. of farmers who
stopped farming
Broiler farmers 256 251 218 21 1 33
Egg farmers 79 85 74 9 4 11
Broiler contract growers
27 28 28 1 1 0
Broiler hatcheries 4 5 4 0 0 1
Broiler abattoirs 4 4 4 0 0 0
TOTAL 370 373 328 31 6 45
*Includes number of farmers who resumed farming
Table 2: The provincial representation of survey respondents
Province No. of complete questionnaires
Gauteng 96
Limpopo 93
Free State 13
Mpumalanga 35
North West 19
Eastern Cape 13
Western Cape 5
Northern Cape 16
KwaZulu-Natal 38
TOTAL 328

SAPA Subsistence and Small Commercial Farmer Report 4Q2018
- 4 -
The South African Poultry Association
Figure 1: Distribution of layer and broiler survey respondents in 4Q2018 in South Africa
1. Hatcheries
There were four hatchery respondents in 4Q, two additional respondents than in 3Q, while one respondent suspended their operation from 3Q due to being unable to source parent stock as they produce their own fertile eggs. Three hatcheries were owned or managed by men, and one by a woman. Two hatcheries were located in KwaZulu-Natal, one in Mpumalanga and one in North West, as shown in Figure 2.
One hatchery produced day-old broiler chicks and three hatched day-old pullets. Unfortunately there were insufficient respondents to report on the broiler chick data separately. All three of the pullet hatcheries produced their own fertile hatching eggs from breeding stock. In total, 68 600 fertile eggs were produced for incubation in the quarter, i.e. an average of 22 900 per respondent; however, there was a range in number of eggs produced per respondent.

SAPA Subsistence and Small Commercial Farmer Report 4Q2018
- 5 -
The South African Poultry Association
One operation kept 12 000 day-old pullets for their own farm for the quarter. The total number of day-old pullets sold for the quarter was 51 400 at a weighted average selling price of R11.60 per pullet. The total value of the day-old pullet sales for the quarter was R596 200, these being sold to emerging farmers. One of the hatchery owners commented on their struggle with an unreliable electricity supply.
Figure 2: Location of hatcheries surveyed
BROILER FARMERS
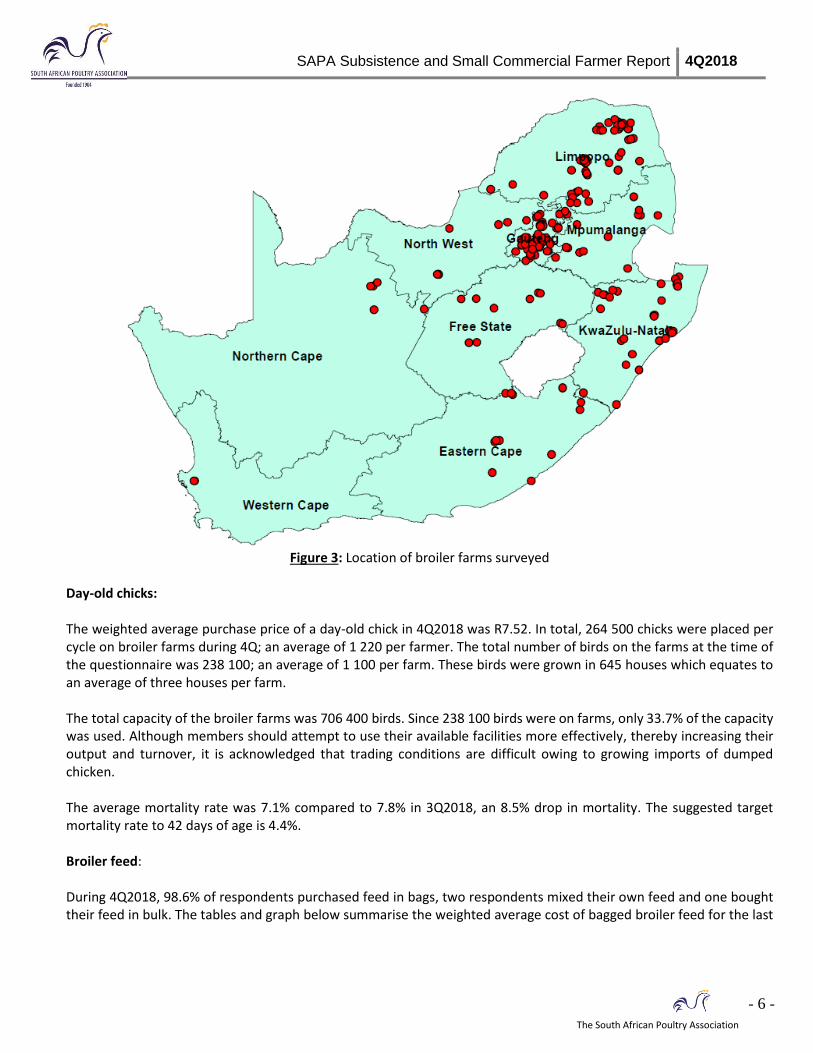
2. Broiler Producers Of the 218 broiler farm owners, 142 were women and 76 were men. There was 1 more respondent this quarter compared to last quarter. There were however 33 respondents interviewed that stopped farming, 33.3% of these farmers were battling to source day-old chicks, or awaiting delivery, and 12.1% of the respondents were either cleaning or renovating their structures. Other reasons given were personal problems, insufficient knowledge on how to raise broilers so were requiring further training, awaiting test results as they experienced a high flock mortality, insufficient funds to resume farming, converting from broilers to layers, structures damaged by wind and a disease problem. The broiler farms were located in Limpopo (68), Gauteng (55), KwaZulu-Natal (36), Mpumalanga (20), Eastern Cape (13), Free State (11), North West (8), Northern Cape (5) and Western Cape (2), as shown in Figure 3.
SAPA Subsistence and Small Commercial Farmer Report 4Q2018
- 6 -
The South African Poultry Association
Figure 3: Location of broiler farms surveyed
Day-old chicks: The weighted average purchase price of a day-old chick in 4Q2018 was R7.52. In total, 264 500 chicks were placed per cycle on broiler farms during 4Q; an average of 1 220 per farmer. The total number of birds on the farms at the time of the questionnaire was 238 100; an average of 1 100 per farm. These birds were grown in 645 houses which equates to an average of three houses per farm. The total capacity of the broiler farms was 706 400 birds. Since 238 100 birds were on farms, only 33.7% of the capacity was used. Although members should attempt to use their available facilities more effectively, thereby increasing their output and turnover, it is acknowledged that trading conditions are difficult owing to growing imports of dumped chicken. The average mortality rate was 7.1% compared to 7.8% in 3Q2018, an 8.5% drop in mortality. The suggested target mortality rate to 42 days of age is 4.4%. Broiler feed: During 4Q2018, 98.6% of respondents purchased feed in bags, two respondents mixed their own feed and one bought their feed in bulk. The tables and graph below summarise the weighted average cost of bagged broiler feed for the last
SAPA Subsistence and Small Commercial Farmer Report 4Q2018
- 7 -
The South African Poultry Association
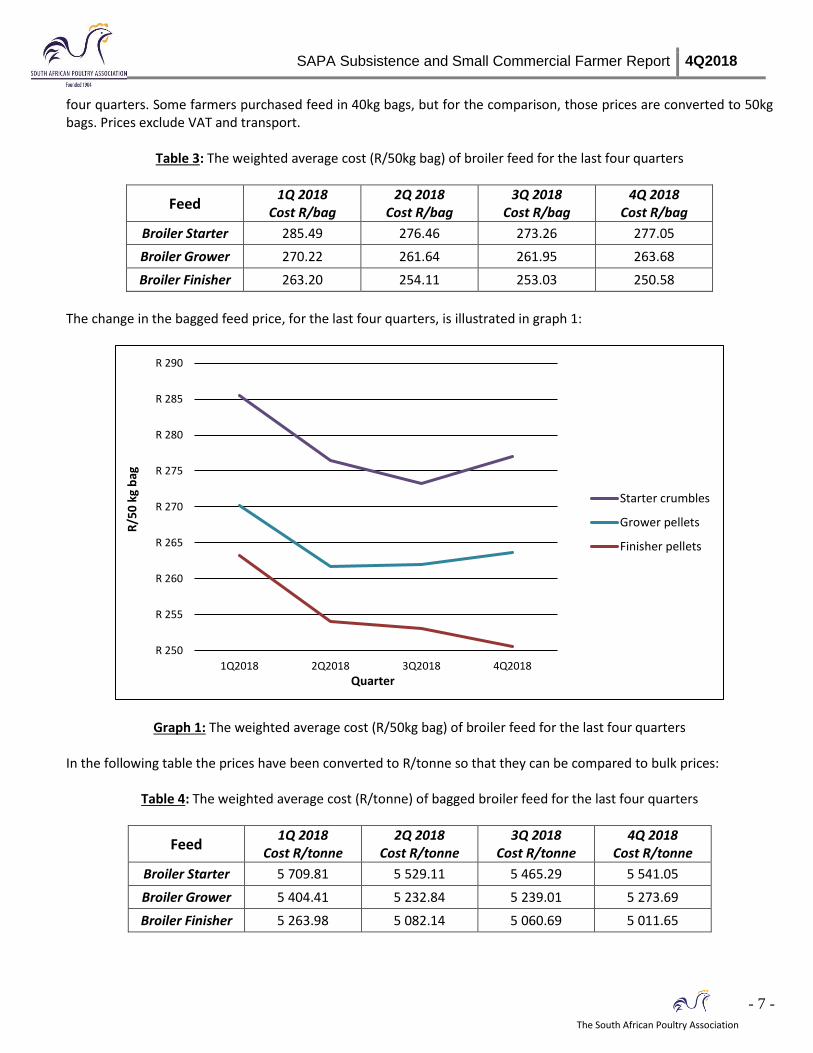
four quarters. Some farmers purchased feed in 40kg bags, but for the comparison, those prices are converted to 50kg bags. Prices exclude VAT and transport.
Table 3: The weighted average cost (R/50kg bag) of broiler feed for the last four quarters
Feed 1Q 2018
Cost R/bag 2Q 2018
Cost R/bag 3Q 2018
Cost R/bag 4Q 2018
Cost R/bag
Broiler Starter 285.49 276.46 273.26 277.05
Broiler Grower 270.22 261.64 261.95 263.68
Broiler Finisher 263.20 254.11 253.03 250.58
The change in the bagged feed price, for the last four quarters, is illustrated in graph 1:
Graph 1: The weighted average cost (R/50kg bag) of broiler feed for the last four quarters In the following table the prices have been converted to R/tonne so that they can be compared to bulk prices:
Table 4: The weighted average cost (R/tonne) of bagged broiler feed for the last four quarters
Feed 1Q 2018
Cost R/tonne 2Q 2018
Cost R/tonne 3Q 2018
Cost R/tonne 4Q 2018
Cost R/tonne
Broiler Starter 5 709.81 5 529.11 5 465.29 5 541.05
Broiler Grower 5 404.41 5 232.84 5 239.01 5 273.69
Broiler Finisher 5 263.98 5 082.14 5 060.69 5 011.65
R 250
R 255
R 260
R 265
R 270
R 275
R 280
R 285
R 290
1Q2018 2Q2018 3Q2018 4Q2018
R/5
0 k
g b
ag
Quarter
Starter crumbles
Grower pellets
Finisher pellets

SAPA Subsistence and Small Commercial Farmer Report 4Q2018
- 8 -
The South African Poultry Association
During 4Q2018, 548.0 tonnes of bagged broiler feed was purchased per month, which equates to an average of 51 bags per farmer, at a total value of R2.356 million per month. The feed price increased on average by 0.4% from 3Q2018 to 4Q2018. The bulk broiler feed data could not be reported due to an insufficient number of respondents buying in bulk. The average bulk broiler feed price for commercial farmers for 4Q2018 was R5 365/tonne; 1.7% more than the bagged feed price for small-scale farmers. Broiler sales: The average cycle length (from placement to placement) was 11 weeks. This was not necessarily for one flock of birds. The average age at which the live broilers were sold was 6.0 weeks or 42 days. The modern broiler has the potential to reach slaughter weight at 33-35 days of age, depending on the management practices such as type of housing, stocking density, ventilation, biosecurity and feeding. Customers who buy live birds do however prefer to have slightly older, heavier broilers. The sales figures are summarised in table 5.
Table 5: Summary of broiler sales figures for 4Q2018
Marketing channel No. producers* Quantity Weighted avg. price Total value
Live birds 209 286 800 R55.08/bird R15 800 100
Abattoir 58 43 700 R33.30/kg
R68.18/bird R2 704 200
* 49 producers sold both live and processed birds The average price per live bird was R65.80 versus the weighted average of R55.08/bird shown in the table above. This discrepancy is explained by the fact that farmers selling large quantities of birds did so at a reduced price. The birds were sold direct to the community, or to street vendors, hawkers, pensioners, teachers, supermarkets, restaurants, a butchery and hotels, or at informal markets or settlements, government departments, clinics, pay points, a stokvel, taxi ranks, shopping centres, schools and crèches. 86.8% of the broilers were sold live and 13.2% were slaughtered at abattoirs. The weighted average slaughter fee charged by abattoirs was R5.95 per bird. The average dressed weight was 1.9kg. Comments: The most common complaints of respondents for the quarter was the high feed cost; their unstable or poor market; the poor condition of their facilities, causing greater problems in the wet season; inability to locate an abattoir nearby; excessive mortality caused by a high disease rate or the change in weather and wet season. Further difficulties experienced, or general comments, are given below:
Require funding to build a new structure or renovate the existing one;
Too many competitors in the area;
Difficulty sourcing day-old chicks;
A large number of farmers were giving birds on credit (sometimes due to the poor market) which invariably resulted in non or late payment of accounts by clients causing cash flow problems;

SAPA Subsistence and Small Commercial Farmer Report 4Q2018
- 9 -
The South African Poultry Association
The poor market conditions sometimes resulted in the respondents keeping the birds longer than normal which lead to an inflated feed bill and reduced profit;
Ongoing problem with crime in the area resulting in theft of stock;
One respondent was experiencing a high demand for their product;
Insufficient equipment to raise the birds;
Experiencing a problem with late delivery of chicks;
One respondent was battling with a shortage of feed from their supplier;
Battling to find land for their expansion;
One respondent owed the poor market to the high rate of unemployment in their area;
Struggling with electricity supply;
High cost of electricity, chicks, medication, transport and abattoir slaughter fees;
One respondent was resorting to mixing their own feed due to the high cost of purchasing complete feed, and another subsistence farmer was wanting to invest in a feed mill to manufacture his own feed;
High mortality or poor growth rate due to hatchery supplying poor quality chicks;
Struggling to find somewhere nearby to buy chicks, medication, feed and sawdust; and
Poor supply of water or no access to water at all.
3. Contract Growers Day-old chicks and broiler production: There were a total of 28 contract growers interviewed in 4Q2018. The gender split for contract growers was 21 males and seven females. The farms were located in Mpumalanga (11), Limpopo (7), North West (7) and Gauteng (3) provinces (Figure 4). Day-old chicks were obtained from the principal company’s hatcheries. The 28 respondents placed a total of 3.974 million chicks per cycle during 4Q2018; an average of 141 900 per farmer. The total capacity of the broiler farms was 4.064 million birds; at the time of the questionnaire the farms were stocked to 94.5% of their capacity. The average mortality rate on the contract growers’ farms was 4.0%. No information was collected on sales volumes or prices. The average feed consumed per bird placed was 2.65 kg/bird. The average age at slaughter was 4.8 weeks (33.6 days) and the contract growers on average stood empty for 12 days. Comments: Issues and comments raised by the contract growers for 4Q2018 are listed below:
The changing weather pattern was making management of the flock very difficult;
Struggling with poor water and electricity supply, one respondent was having to spend a lot of money on buying water externally;
One respondent expressed a desire to expand; and
Two respondents complained of the poor quality chicks that they received.

SAPA Subsistence and Small Commercial Farmer Report 4Q2018
- 10 -
The South African Poultry Association
Figure 4: Location of contract growers surveyed
4. Abattoirs Four abattoirs were interviewed, two were located in the Northern Cape, and one each in the provinces of Gauteng and Western Cape. These abattoirs were owned by two females and two males. Two of the businesses produced their own broilers as well as providing a slaughtering service to outsiders, while the remaining two operated as an abattoir only.
The total number of birds slaughtered per day was 3 050, with an average of 760 per abattoir. The abattoirs operated for an average of four days per week in Q4. The weighted average slaughter fee was R5.27 per bird. The weighted average selling price for dressed birds was R37.62/kg. One abattoir owner mentioned that an employee was requiring training. The location of the abattoirs is shown in Figure 5.

SAPA Subsistence and Small Commercial Farmer Report 4Q2018
- 11 -
The South African Poultry Association
Figure 5: Location of abattoirs surveyed
EGG FARMERS
1. Pullet Rearers Day-old pullets: A total of nine pullet rearers from four different provinces responded to the 4Q2018 survey. Despite having the same number of participants as 3Q2018, four of the respondents from 3Q stopped farming pullets. Two of the respondents were in the process of changing over to broilers, the reason cited was difficulty raising pullets, another respondent was facing a personal matter, while the fourth respondent was busy with her laying hens that she had raised from day-old in 3Q. The farms of the pullet rearer respondents were located in Gauteng (5), Limpopo (2) and Free State and North West (1 each). The businesses were owned by seven males and two females. Five of the pullet rearers kept point-of-lay pullets for their own egg production units. Two of the respondents had their own hatchery which is their source of day-old pullets. The seven remaining pullet rearers purchased a total of 31 600 day-old pullets from recognised commercial layer hatcheries and traders. The weighted average price per day-old pullet was R11.01, a 32.4% increase from the previous quarter.

SAPA Subsistence and Small Commercial Farmer Report 4Q2018
- 12 -
The South African Poultry Association
At the time of the questionnaire, a total of 58 600 pullets were being reared. The average number per farmer was 6 500 pullets, although there was a big range between the respondents. The capacity of the rearing facilities was 90 900 pullets, which means that 64.5% of the capacity was used. Figure 6 shows the distribution of egg farmers (both pullet rearers and egg producers).
Figure 6: Location of egg farmers surveyed
Pullet feed: All respondents bought their feed in bags. The weighted average price paid per 50kg bag for starter mash was R231.90 and R224.31 for grower mash; insufficient respondents reported on the developer mash price. The total quantity of bag feed purchased per month during 4Q2018 by pullet rearers was 68.0 tonnes, i.e. an average of 151 bags per farmer per month. The total value of the feed purchases was R309 800 per month. Point-of-lay sales: Four of the respondents sold point-of-lay pullets to outside customers. Total sales amounted to 52 500 birds for the quarter. The weighted average selling price was R82.22 per bird, an 11.0% increase from 3Q.
SAPA Subsistence and Small Commercial Farmer Report 4Q2018
- 13 -
The South African Poultry Association
Comments: Challenges experienced by the pullet rearers in 4Q2018 are listed below:
High flock disease rate;
High price of feed;
Poor water supply;
Battling with the poor condition of the poultry houses; and
The weather of the season is causing a big challenge.
2. Egg Producers A total of 65 egg producers took part in the 4Q2018 survey, a 14.0% increase from Q3. Despite this increase, seven respondents from Q3 stopped farming; the reasons given for them stopping farming was a delay from placing order to point-of-lays arriving on their farm, three respondents were busy renovating their poultry houses and one was busy cleaning. The gender count was 36 males and 29 females. The farms were located in Gauteng (30), Limpopo (16), Northern Cape (9), Free State and Mpumalanga (3 each), and North West and Western Cape (2 each). Point-of-lay hens: Fifty-seven of the egg producers interviewed bought point-of-lays from recognised pullet rearers as well as smaller independent rearers and traders. There was a marked increase in the number of respondents that received birds through the Department of Agriculture in 4Q, of the respondents that declared this information, the total came to 19.3%. Eight of the egg producers reared their own pullets. Hens were kept in battery cages on 50 farms, there were 13 free-range farms and two that had both of these housing types. A total of 163 700 point-of-lays were purchased, with an average of 2 870 per farmer, although there was a large variation between respondents. The weighted average purchase price was R80.59 per point-of-lay pullet, a 9.6% increase from 3Q. The flock size for the 65 respondents was 152 300 hens which were kept in an average of three houses per farmer. The laying facilities could hold 348 900 hens, which means that they were stocked at 43.6% of their capacity during 4Q2018. Layer feed: Fifty-eight of the respondents bought their feed in 40kg or 50kg bags. In total, 284.8 tonnes of bagged layer feed was purchased per month; approximately 98 bags per farmer with an average feed intake (higher than expected) of 143.6 g/hd. This excessive feed intake value may indicate either a feed wastage or theft problem, and should be addressed by the respondents immediately given the high cost of feed. The weighted average price for laying mash, excluding VAT and transport, was R252.09/50kg bag, a 6.8% increase from 3Q, continuing the trend of escalating bag prices seen since 1Q2018. In order to convert from a R/50kg bag price to a R/tonne price, the bag price is multiplied by 20 (1 tonne = 1000kg = 20 x 50kg bags): R252.09 x 20 bags = R5 042/tonne. Seven of the survey respondents bought in bulk, purchasing 467 tonnes per month at a weighted average price of R3 740/tonne, an 8.5% increase from 3Q. This equates to an average feed intake (higher than expected) of 180.7 g/hd. The total value of the layer feed purchases was R2.720 million per month, i.e. R8.161 million per quarter.

SAPA Subsistence and Small Commercial Farmer Report 4Q2018
- 14 -
The South African Poultry Association
The SAPA reported layer feed price for 4Q2018 was R3 515/tonne. This would be for egg producers who are buying large quantities in bulk. Small farmers buying in bulk paid 6.4% more than large producers for their feed. Although the bag and bulk price cannot be directly compared, due to bagging costs, small-scale farmers buying in bags, possibly from a co-op, paid 34.8% more than small-scale farmers buying in bulk, and 43.4% more than commercial farmers buying in bulk. This shows the advantage of buying feed in bulk directly from the supplier. The change in the layer feed price for the last four quarters for small-scale farmers buying in bags and bulk, and commercial farmers buying in bulk, is illustrated in graph 2. Bag prices have been converted to R/tonne.
Graph 2: The weighted average cost (R/tonne) of layer mash for the last four quarters for small-scale farmers buying in
bags and bulk, and commercial farmers buying in bulk Egg sales: Eggs were sold to the community, supermarkets, hawkers, street vendors, bakeries, government officials, a co-op, restaurants, guest houses and a game reserve, and at farms, schools, taxi ranks, clinics, informal markets, tuck shops and local spaza shops. The weighted average egg price during 4Q2018 was R14.73/doz, a 14.1% decrease from 3Q. The average egg price during 4Q2018 was R16.85/doz. This reduced weighted average egg price, when compared to the average egg price, can be explained by the low average egg price of R11.67/doz achieved by egg producers selling more than 5 000 dozen eggs per week. The commercial farmers’ producer price was R15.20/dozen, they also saw a reduction (-11.7%) from 3Q. The difference between the small-scale farmers’ selling price and the commercial farmers’ egg realisation was –R0.47/doz (-3.1%). Producers selling direct to end users should however be able to realise a higher price than commercial farmers, given that the retail price for 4Q2018 was R28.34/doz large.
R 3 000
R 3 500
R 4 000
R 4 500
R 5 000
1Q2018 2Q2018 3Q2018 4Q2018
R/t
on
ne
Quarter
Small-scale bags
Small-scale bulk
Commercial bulk

SAPA Subsistence and Small Commercial Farmer Report 4Q2018
- 15 -
The South African Poultry Association
Total sales amounted to 66 400 dozen per week, i.e. 866 200 dozen per quarter. The average rate of lay for the 152 300 hens was 73.7%. The layer farmers should be aiming for 80-85%. The total value of the eggs sold for 4Q2018 was R12.755 million. Cull hen sales: Old hens continue to be sold live to the community, street vendors and hawkers, and also at informal markets. In total, 101 100 culls were sold for the quarter (17 producers had not yet reached the stage of culling birds) at a weighted average selling price of R41.56/hen, a 6.6% reduction from 3Q. The weighted average cull price obtained by commercial farmers during 4Q2018 was R23.93, a 15.3% drop from 3Q. Small farmers got 73.7% more for their culls than larger producers. Comments: Challenges and general comments from 4Q2018 are detailed below:
The high cost of feed was a common challenge;
Unstable market;
One respondent commented on the difficult market conditions due to imports;
Another common challenge was a difficulty sourcing point-of-lay pullets;
High cost of electricity;
High cost of transport, required for transporting feed and point-of-lay pullets due to their remote location;
High cost of, and limited access to water;
Limited equipment to farm effectively;
Non-payment of accounts by clients;
A few respondents were experiencing a big problem with theft of their stock, one respondent said that they were unable to afford fencing for their farm which made them an easy target;
One respondent was intending to switch to broilers as there is more of a demand for broiler meat than eggs from local clientele;
Insufficient infrastructure required for adequate biosecurity on the farm;
Problems caused by hot weather of the quarter;
Another respondent commented on the high demand for eggs in their area;
Struggling to find reliable transport;
Two respondents expressed their desire to expand;
Reduced production due to seasonal change;
Looking for land as the respondent is currently renting land to farm; and
Disease and high mortality was frequently mentioned.

SAPA Subsistence and Small Commercial Farmer Report 4Q2018
- 16 -
The South African Poultry Association
CONCLUSION Silverpath is making huge strides in improving the data collection procedures to ensure the results are meaningful. Thank you to all small commercial producers who take part in the quarterly surveys. Your comments have been passed on to the SAPA Chairman for discussion at the committee meetings. The call centre staff members who interview the farmers speak nine official languages. Please expect a call from Ireen Lekabe or Olga Leshabane. The cell numbers dedicated to emerging farmers are 079 591 6454 / 079 618 2609, and staff can be contacted from Monday to Friday during office hours; from 08:30 to 16:00. Their email addresses are [email protected] and [email protected]. Ms Cynthia Ncube heads up Silverpath and can be contacted for assistance at [email protected]. SAPA has the following recommendations for emerging farmers:
Before investing in any equipment, the local market must be researched to determine whether there is indeed a demand for the product you are planning to sell.
If there is a demand for your proposed product, determine what price it is currently being sold for in your area. Try to request assistance from a fellow producer or extension officer in your area to find out where the nearest place is to buy your day-old chicks for example, medication and feed. If you are in a very remote location you need to factor in the extra transport costs, with feed being the greatest input cost. It is best to try and calculate a per bird or per hen cost to see whether your costs become greater than the price you can sell your product at.
If possible, join other producers in your area to buy feed and birds in bulk to try and negotiate a better rate and split the high transport cost.
It is important that you work closely with the extension officers in your area, they have been trained to support emerging farmers. If you are unsure of which extension officer is operating in your area, contact SAPA and we will give you the relevant contact details.
Record keeping is one of the most important farm practices. You can never improve unless you know how your farm is performing. A good place to start is by recording all the information that our staff members request from you quarterly. These are the variables that need to be monitored on your farm. If you are requiring funds for expansion, financial institutions will be unwilling to finance you unless you can prove how your farm is performing, another reason it is crucial to keep up to date with your records.
Contact SAPA on 011 795 9920 to find out what the benefits are to becoming a SAPA member, for further information on poultry equipment or medication, and availability of day-old chicks. Contact your local Department of Agriculture or extension officer for veterinary services or Letsema and Farmers Support.

SAPA Subsistence and Small Commercial Farmer Report 4Q2018
- 17 -
The South African Poultry Association
APPENDIX A Statistical Terms and examples Statistical methods can be used to summarise or describe a collection of data; this is called descriptive statistics. In our case the collection of data is the stats that we collect from emerging broiler, egg, chick producer farmers, hatcheries and abattoirs. Below please find an example of calculating a weighted average: A farmer sells 50 chickens live at R55 per chicken to a hawker. His neighbour sells 10 chickens live at R65 per chicken to the same hawker. The average price that the chickens were sold at was: (R55+R65)/2 = R120/2 = R60 per chicken The weighted average price that the chickens were sold at was: (R55*50) + (R65*10) divided by 50+10 = R2750 + R650 divided by 60 =R3400/60 =R56.67 This means in effect that the price of the 50 birds carries more weight than the 10 birds when determining the average price.
Disclaimer: The views expressed in SAPA STATS reports reflect those of SAPA in collaboration with its independent consultants and do not constitute any specific advice as to decisions or actions that should be taken. While every care has been taken in preparing documents no representation nor warranty or any expressed or implied undertaking is given and no responsibility or liability is accepted by SAPA as to the accuracy or completeness of the information contained herein whether as electronic data or as a finished report. SAPA or its independent consultants do not accept responsibility or liability for any damages of whatsoever nature which any person may suffer as a result of any decision or action taken on the basis of the information contained herein. All opinions and estimates contained in the reports may be changed after publication without notice. All forecasts of future production, prices, trade or feed and feed ingredient trends are based on the opinion of independent consultants contracted to SAPA. These forecasts are for guideline purposes only and SAPA does not, in any way, warrant that these predictions will be realised. SAPA therefore cautions any user of this information to treat it in an appropriate manner. These statistical reports and/or electronic data are placed in the public domain and may be used by other parties conditional to the source of the data/ report being attributed to SAPA.