subregional report on animal genetic resources: … · contents introduction 5 part 1 subregional...
TRANSCRIPT

Subregional Report on Animal Genetic Resources:
East Africa

AcknowledgementsThe Subregional Factsheet was prepared by Marion De Vries. Subregional Priorities were compiled by Milan Zjalic.
Citation: FAO. 2007. Subregional report on animal genetic resources: East Africa. Annex to The State of the World’s Animal Genetic Resources for Food and Agriculture. Rome.
The designations employed and the presentation of material in this informationproduct do not imply the expression of any opinion whatsoever on the partof the Food and Agriculture Organization of the United Nations concerning thelegal or development status of any country, territory, city or area or of its authorities,or concerning the delimitation of its frontiers or boundaries. The mention of specificcompanies or products of manufacturers, whether or not these have been patented, doesnot imply that these have been endorsed or recommended by the Food and AgricultureOrganization of the United Nations in preference to others of a similar nature that arenot mentioned.The views expressed in this publication are those of the author(s) and do not necessarilyreflect the views of the Food and Agriculture Organization of the United Nations.
All rights reserved. Reproduction and dissemination of material in this informationproduct for educational or other non-commercial purposes are authorized withoutany prior written permission from the copyright holders provided the source is fullyacknowledged. Reproduction of material in this information product for resale or othercommercial purposes is prohibited without written permission of the copyright holders.Applications for such permission should be addressed to:ChiefElectronic Publishing Policy and Support BranchCommunication DivisionFAOViale delle Terme di Caracalla, 00153 Rome, Italyor by e-mail to:[email protected]© FAO 2007

Contents
�
Introduction 5
Part 1 Subregional factsheet: East Africa 7
1 Importance of livestock to the subregion’s economy and food security 71.1 Poverty 81.2 Production and consumption 91.� Imports and exports 111.4 Projected demand for livestock products 14
2 Livestock production systems 142.1 Overview 142.2 Roles and functions of livestock in East Africa 192.� Projected changes in production systems 202.4 Impacts of production system trends on animal genetic resources 21
3 Animal genetic resources 21�.1 Status 21�.2 Threats to animal genetic resources in East Africa 27�.� Unique resources highlighted 28
References 29Annex 31
Part 2 Subregional priorities: East Africa 33
1 Inventory and characterization 332 Sustainable utilization 343 Conservation 364 Policy, institution and human capacity building 36
4
TABLES
1. Land area and population 7 2. GDP and economic contribution of agriculture 8 3. Land use 8 4. Poverty rate by country 9 5. Food supply situation by country 10 6. Annual growth rates: livestock numbers, meat and milk production for East Africa 13 7. Resource base, production and productivity data by production system in East Africa 16 8. Classification of traditional ruminant production systems in sub-Saharan Africa 19 9. Total population size and number of breeds of the major livestock species
in East Africa and their share of the world total 2210. Transboundary mammalian and avian breeds in East Africa 23
FIGURES
1. Total production of meat, milk and eggs in East Africa, 1995–2005 10 2. Total imports and exports of live animals and primary livestock products
in East Africa, 1994–2004 11 3. Total exports of live animals and primary livestock products in East Africa, 1994–2004 12 4. Total imports of live animals and primary livestock products in East Africa, 1994–2004 13 5. Total meat and milk production in East Africa, past and projected 14 6. Distribution of production systems in Africa 15 7. Tsetse fly distribution – predicted areas of suitability in Africa 18 8. Risk status of mammalian breeds recorded in East Africa up to December 2005:
absolute (table) and relative (chart) figures 24 9. Risk status of avian breeds recorded in East Africa up to December 2005:
absolute (table) and relative (chart) figures 2510. Population data status and index for mammalian breeds recorded by the countries
of East Africa up to December 2005 2611. Population data status and index for avian breeds recorded by the countries
of East Africa up to December 2005 27

�
This document is one of a set of subregional and regional reports prepared as part of the Annex to The State of the World’s Animal Genetic Resources for Food and Agriculture. It consists of two sections:
• a factsheet; and • a synthesis of priorities.
The factsheet is a compilation of background material on the significance of livestock to the subregion’s economy and food security; the characteristics, distribution, and relative significance of the various livestock production systems; and the characteristics of animal genetic resources.
The priorities presented in this report are based on the outcome of consultations held at the subregional level to review a draft report on strategic priorities for action, which had been prepared by FAO as a global-level synthesis of priorities identified in the Country Reports submitted as part of State of the World process. The consultations, which were held during the final quarter of 2005, took the form of e-mail conferences and/or physical meetings, and provided an opportunity for country representatives, from both technical and policy backgrounds, to identify priorities and to further strategies for cooperation.
Introduction

�
7
Defined for the purposes of this report, the countries of the East Africa subregion include Burundi, Djibouti, Eritrea, Ethiopia, Kenya, Rwanda, Somalia, the United Republic of Tanzania and Uganda. The subregion is located between latitudes 18° north and 11° south and longitudes 29° to 51° east and includes 3.5 million km2 of land area. It is home to nearly 200 million people, equal to 3 percent of the world’s total human population. Climates in the region range from arid to tropical monsoon. A summary of general information for this subregion can be found in Tables 1 to 3. Ethiopia, with over one-third of the total, has the largest population in the subregion, followed by the United Republic of Tanzania, Kenya and Uganda. The number of inhabitants in the subregion grew substantially during recent decades. Between 1993 and 2003 the population increased by 32 percent. Ethiopia, Kenya, Somalia and the United Republic of Tanzania are the largest countries in East Africa, covering nearly 90 percent of the subregion. The larger countries have low population densities compared to the smaller. However, population densities in these countries are much higher than for Africa as a whole (which accommodates the world’s largest desert, the Sahara, in the north). Somalia, principally consisting of desert and with only 2 percent arable land, is an exception, and has the lowest population density in the subregion, as well as the lowest population growth rate. Rwanda, in contrast, has 60 percent arable land and shows the highest population density and population growth rate. Burundi and Uganda also have relatively high population densities (FAOSTAT).
1 Importance of livestock to the subregion’s economy and food security
Agriculture plays a key role as a source of income for almost 150 million people in the subregion, and is a leading sector in most countries. Among the countries of the subregion, the agricultural population varies from about 71 percent in Somalia to approximately 90 percent in Burundi and Rwanda (FAOSTAT). However, the economic output of agriculture differs substantially across the subregion. The economic share of agriculture in the gross domestic product (GDP) ranges from only 4 percent in Djibouti up to 49 percent in Burundi (World Bank Data).
Subregional factsheet: East Africa
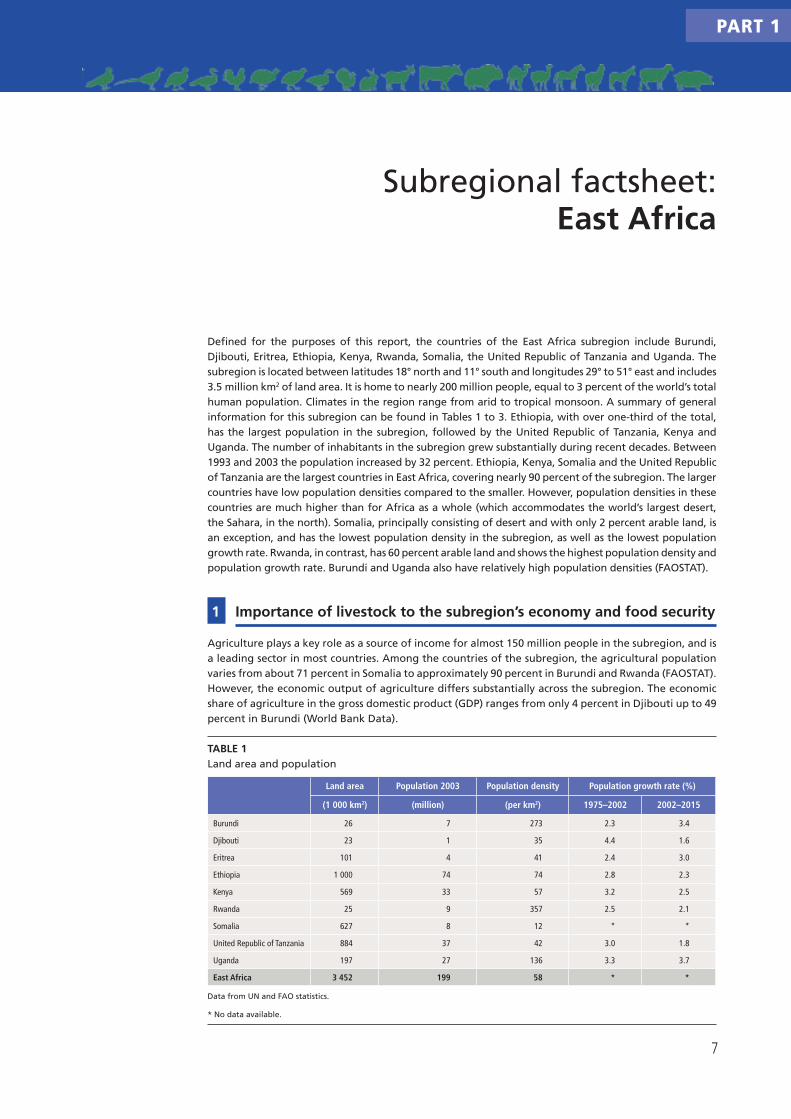
TABLE 1Land area and population
Land area Population 2003 Population density Population growth rate (%)
(1 000 km2) (million) (per km2) 1975–2002 2002–2015
Burundi 26 7 273 2.3 3.4
Djibouti 23 1 35 4.4 1.6
Eritrea 101 4 41 2.4 3.0
Ethiopia 1 000 74 74 2.8 2.3
Kenya 569 33 57 3.2 2.5
Rwanda 25 9 357 2.5 2.1
Somalia 627 8 12 * *
United Republic of Tanzania 884 37 42 3.0 1.8
Uganda 197 27 136 3.3 3.7
East Africa 3 452 199 58 * *
Data from UN and FAO statistics.
* No data available.
PART 1

THE STATE OF THE WORLD'S ANIMAL GENETIC RESOURCES FOR FOOD AND AGRICULTURE
8
EAST AFRICA
Like the contribution of agriculture, the contribution of livestock to the economy varies considerably among countries of the subregion. For example, in Somalia raising livestock is the backbone of the economy, contributing approximately 40 percent of the GDP. Conversely, in Burundi livestock accounts for only 4 percent of the GDP (WTO, 2003). The livestock sector in the subregion in general shows low productivity, and the availability of food of animal origin for human consumption is also low. Projections for the livestock sector in East Africa show a large increase in demand for livestock products, resulting from population growth. The East African population is expected to grow by approximately 150 percent within the next 45 years (UNFPA, 2005).
1.1 PovertyPoverty rates can be quantified on the basis of a poverty line, which provides a threshold in income or consumption below which a household can be classified as poor. Some poverty lines aim to be internationally comparable – adjusting for the purchasing power of local currencies in local markets to indicate similar levels of consumption of goods and services in all the countries compared – and, thus, are
TABLE 2GDP and economic contribution of agriculture
GDP1 2003(US$billions)
GDP1 per capita 2003 (PPP US$)
Value added in agriculture2 2003 (%
of GDP)
Agricultural population1 2000 (%)
Burundi 0.6 648 49.0 90
Djibouti 0.6 2 086 * 79
Eritrea 0.8 849 13.9 78
Ethiopia 6.7 711 41.8 82
Kenya 14.4 1 037 15.8 75
Rwanda 1.6 1 268 41.6 91
Somalia * * * 71
United Republic of Tanzania 10.3 621 45.0 78
Uganda 6.3 1 457 32.4 79
East Africa * * * 80
1 Data from UN and FAO statistics.
2 Data from World Bank statistics and Country Reports.
* No data available.
TABLE 3Land use
Arable (%) Permanent pasture (%) Forest/woodland (%)
1992 2002 1992 2002 1992 2002
Burundi 36 38 33 39 13 *
Djibouti 0 0 59 73 1 *
Eritrea * 6 * 69 * *
Ethiopia * 10 * 20 * *
Kenya 7 8 37 37 30 *
Rwanda 36 45 26 19 10 *
Somalia 2 2 69 69 26 *
United Republic of Tanzania
4 5 49 49 38 *
Uganda 26 26 26 26 32 *
East Africa * 8 * 41 * *
Data from UN and FAO statistics.
*No data available.

9
PART 1
SUB-REGIONAL REPORT ON ANIMAL GENETIC RESOURCES– EAST AFRICA
useful for producing continental and global totals. Widely cited examples are US$1 day-1 and US$2 day-1 international lines published by the World Bank. Numerous practical difficulties, however, remain with respect to ensuring that the measures reflect a consistent level of deprivation across countries, and the statistics must be treated with some caution (World Bank, 2001). National poverty lines reflect intercountry differences in economic and social status and are used to assess progress on a national scale.
The figures presented in Table 4 utilize three different poverty lines: the international US$1 day- 1 and US$2 day-1 lines, and national poverty lines based on Technical Advisory Committee (TAC) of the Consultative Group on International Agricultural Research (CGIAR) data. Table 4 indicates that the proportion of the population living below the US$1 day-1 poverty line varies from 18 to 59 percent among East African countries. Somalia, Eritrea and Burundi are among the poorest countries in the subregion, with more than 45 percent of the population living below the US$1 day-1 poverty line. Somalia has experienced severe drought conditions in recent years, leading to low crop production, large livestock losses and high levels of indebtedness, with the situation in the southern part of the country further aggravated by hostilities (FAO, 2005). Similarly, Eritrea has been affected by consecutive poor harvests and the lingering effects of war. About 2 million people are facing varying degrees of food shortages. Continuing civil strife, internally displaced people and drought cause severe food shortages in Burundi (ibid.).
The unemployment rate in sub-Saharan Africa is 10.9 percent (UNECA, 2005). Working poverty is also very high, with 56 percent of people employed in sub-Saharan Africa not earning enough to provide for their families’ basic needs. Variations in regional and country unemployment rates are large. Even within a single country there are disparities, with the rural–urban split often the most visible. About 70 percent of poor Africans live in rural areas. In these areas, 90 percent of the population rely for their main source of income on agriculture, where productivity and earnings are low (all figures from UNECA, 2005). Increasing agricultural production is vital to ensuring food security, including that of the urban populations (ibid.). In many instances, poverty is inversely related to landholding size and the poorer people are, the more they rely on livestock as a means of supporting their livelihoods. For the landless, livestock are often the only income generating option available (Thornton et al., 2002).
1.2 Production and consumptionIn most countries in the East Africa subregion livestock plays an important role as a source of income. However, production and consumption figures vary considerably among the countries of the subregion. Among other factors, civil strife, displacement of inhabitants and climatic conditions contribute to the low levels of food production and food availability.
1.2.1ProductionFigure 1 shows the total production of meat, milk and eggs in the East Africa subregion. Production is far below average world levels. Meat, milk and eggs produced in the subregion contribute only 0.7, 1.0 and 0.3 percent respectively to total world production. Ethiopia, Kenya, the United Republic of Tanzania and Uganda show the highest absolute production of livestock products in the subregion.
TABLE 4Poverty rate by country
Country TAC Less than 1US$/day Less than 2US$/day
Burundi 84 44 73
Djibouti * 29 49
Eritrea * 45 74
Ethiopia 60 27 65
Kenya 52 24 56
Rwanda 85 31 74
Somalia * 59 99
United Republic of Tanzania 58 18 53
Uganda * 30 63
Sources: FAO (1997) and World Bank (2001) as presented by Thornton et al. (2002).
* Data unavailable.

THE STATE OF THE WORLD'S ANIMAL GENETIC RESOURCES FOR FOOD AND AGRICULTURE
10
EAST AFRICA
Ethiopia has the highest meat production (followed by Kenya and the United Republic of Tanzania). Kenya has the highest milk and egg production in the subregion. With regard to average production per capita, Kenya has the highest meat, egg and, especially, milk production in the subregion. Egg production is relatively insignificant; most are produced in Kenya, Ethiopia and the United Republic of Tanzania, (FAOSTAT).
Approximately 1 841 million kg of meat is produced per annum in East Africa. Most of the meat produced in the subregion is beef and veal (58 percent), of which Ethiopia, Kenya and the United Republic of Tanzania are the main producers. Sheep and goat meat contributes 13 percent to the subregional total meat production, and chicken meat contributes 11 percent. Other types of meat (pork, game meat etc.) contribute up to six percent to the total subregional production, with substantial variation between countries. Kenya, for example, produces most of the camel meat (78 percent of the total production) in the subregion, while Uganda accounts for more than half of total pork production. Besides meat, the East African subregion produces approximately 6 438 million kg of milk. The share of East African milk production is approximately one percent of total world milk production. Most milk produced in the subregion comes from cows (93.8 percent), but some goat, sheep and camel milk is also produced. Kenya produces significantly more milk than the other countries in the subregion, accounting for almost half of total subregional production. With annual production topping three billion litres, Kenya is one of the largest milk producers in Africa; milk production is estimated to contribute about four percent of the country’s GDP. Total milk production in the East Africa subregion increased substantially during recent decades. With an annual growth rate of 3.3 percent in the last decade, milk production increased faster than did total world milk production (FAOSTAT).
FIGURE 1 Total production of meat, milk and eggs in East Africa, 1995–2005
Source: FAOSTAT.
TABLE 5Food supply situation by country
Nature of food insecurity Country Main reasons
Overall food shortages Burundi Civil strife, IDPs and returnees
Eritrea Drought, IDPs, returnees, high food prices
Ethiopia Drought, IDPs, high food prices
Somalia Civil strife, drought in parts
Severe localized food insecurity Kenya Drought in parts
United Republic of Tanzania Drought in parts
Uganda Civil strife, IDPs
Source: FAO (2005).
*IDP = Internally Displaced People.
0
2 000
4 000
6 000
8 000
Eggs Primary
Meat, Total
Milk,Total
1995 1996 1997 1998 1999 2000 2001 2002 2003 2004 2005
million kg
11
PART 1
SUB-REGIONAL REPORT ON ANIMAL GENETIC RESOURCES– EAST AFRICA
1.2.2ConsumptionFood shortages and food insecurity are continuously present in several countries in the subregion, arising from the effects of war, displacement and droughts. Overall, food shortages are found in Burundi, Eritrea, Ethiopia and Somalia resulting from recent severe droughts coupled with the effects of past and ongoing conflicts. They are particularly grave in Somalia where about two million people need humanitarian assistance. Inhabitants of Somalia have the lowest food supply in the subregion, at only 1 554 calories per capita per day. In 1999, countries in the East African subregion accounted for one-third of the total number of developing countries where food consumption was less than 2 200 kcal per capita per day (FAO, 2003a). Uganda has the highest calorie supply (2 185 calories), but still is far below the average level for all developing countries (2 681 calories per capita per day). Kenya, the United Republic of Tanzania and Uganda experience localized food insecurity as a result of droughts and civil strife (Table 5).
Food shortages and insecurity are also reflected in the figures for per capita supplies of livestock products. For each person in the subregion, egg supply2 is only 0.7 kg/year, meat 9.6 kg/year and milk
29.9 kg/year – 9 percent, 25 percent and 68 percent, respectively, of the average world food supply per capita for these products (FAOSTAT). In East African countries, pork and poultry meat account for a relatively small share of consumption compared to bovine meat. Religious sensitivities mean that consumption of pigs is low in parts of the subregion, especially in Djibouti, Eritrea and Somalia. In contrast, in the United Republic of Tanzania, pork makes up a significant share of the meat consumed. In Djibouti and Kenya, more meat is available for human consumption as compared to the other countries of the subregion. Both Djibouti and Kenya have remarkably high levels of milk supply, even exceeding the average world milk supply per capita (FAOSTAT). Per capita beef and milk supply are highest in regions with smallholder dairy systems (FAO, 2002).
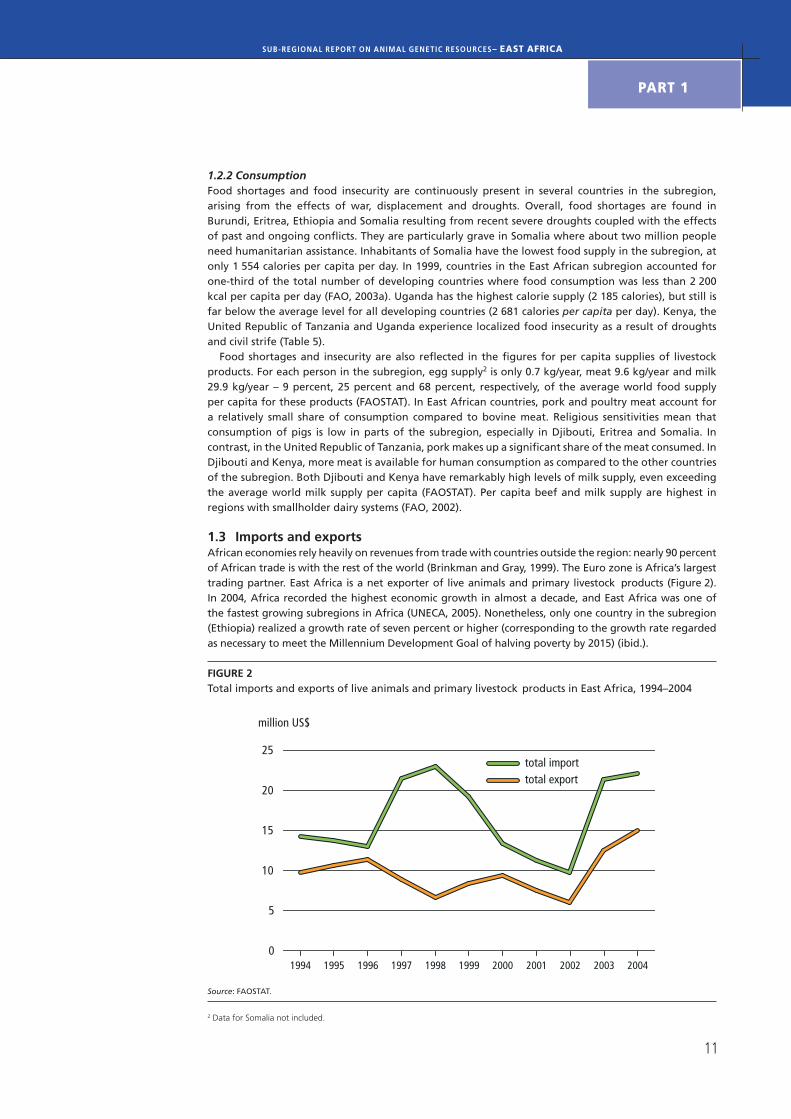
1.3 Imports and exportsAfrican economies rely heavily on revenues from trade with countries outside the region: nearly 90 percent of African trade is with the rest of the world (Brinkman and Gray, 1999). The Euro zone is Africa’s largest trading partner. East Africa is a net exporter of live animals and primary livestock products (Figure 2). In 2004, Africa recorded the highest economic growth in almost a decade, and East Africa was one of the fastest growing subregions in Africa (UNECA, 2005). Nonetheless, only one country in the subregion (Ethiopia) realized a growth rate of seven percent or higher (corresponding to the growth rate regarded as necessary to meet the Millennium Development Goal of halving poverty by 2015) (ibid.).
FIGURE 2Total imports and exports of live animals and primary livestock products in East Africa, 1994–2004
Source: FAOSTAT.
0
5
10
15
20
25
million US$
total importtotal export
1994 1995 1996 1997 1998 1999 2000 2001 2002 2003 2004
2 Data for Somalia not included.

THE STATE OF THE WORLD'S ANIMAL GENETIC RESOURCES FOR FOOD AND AGRICULTURE
12
EAST AFRICA
1.3.1 ExportsAs Figure 3 indicates, exports of animal products from the subregion have shown considerable fluctuation in recent years. The Asian financial crisis had some impact, contributing to shrinking export volumes and lower export prices in 1998. In that year, total export revenues for live animals and animal products in the countries of the East Africa subregion fell by 17 percent, mainly as a result of falling prices. In several countries, agricultural output fell because of adverse weather, civil strife and cross-border conflicts. At the same time, inflation rates and food imports rose in these economies (Brinkman and Gray, 1999).
Exports of live animals and meat contribute the most to total exports of livestock products in the subregion (Figure 3). Cattle from Djibouti form the largest share in the total exports of live animals (73 percent). Goat meat from Ethiopia and pork from Kenya contribute 55 percent and 26 percent, respectively, to the exports of meat products (although Kenya’s pork production is still only four percent of its total meat production). In the last decade, however, goat meat, mutton and lamb have been the main exported meat products. High export figures for goat meat, mutton and lamb in Ethiopia boosted East Africa’s exports of animal products in 2003. Aside from animals and meat, exports of hides and skins are important in several of the countries of the subregion, and in Ethiopia, beeswax is a significant export product (FAOSTAT).
FIGURE 3Total exports of live animals and primary livestock products in East Africa, 1994–2004
Source: FAOSTAT.
1.3.2ImportsLive animals and meat are the main import products for East Africa, although the subregion is a net exporter for these items. In 2004, the total value of imports in East Africa was US$7.5 million for live animals and US$4.1 million for meat. Eritrea, the United Republic of Tanzania and Uganda are the main importers of live animals in the subregion. The live animals most imported are chickens, sheep and cattle. Import of live animals increased significantly in 2003 (Figure 4) due to sheep imports in Eritrea (FAOSTAT). In the last few years, the import of live chickens steadily has grown as a result of imports in Ethiopia and the United Republic of Tanzania. Meat imports in the subregion are made up of 60 percent chicken meat and nearly 30 percent pork. Seventy-five percent of all meat products are imported by Djibouti, also mainly chicken meat and pork – chicken meat having, over the last decade, replaced beef and veal as the most important import product in Djibouti. Figures for 2004 show a substantial rise in the import of meat products in the subregion. For example, imports of chicken meat and pork in Djibouti increased by US$1.5 million and US$0.5 million, respectively.
Export live animals and animal products East Africa
0
2
4
6
8
10
12
million US$
live animalsmeathides and skinsbeeswaxother
1994 1995 1996 1997 1998 1999 2000 2001 2002 2003 2004

1�
PART 1
SUB-REGIONAL REPORT ON ANIMAL GENETIC RESOURCES– EAST AFRICA
FIGURE 4Total imports of live animals and primary livestock products in East Africa, 1994–2004
Source: FAOSTAT.
1.4 Projected demand for livestock productsIt is predicted that there will be substantial progress in raising food consumption levels and improving nutrition (FAO, 2003a). Empirical evidence suggests that in the countries with high dependence on agriculture, assigning priority to the development of food production holds the promise of overcoming constraints to better nutrition represented by unfavourable overall economic growth prospects (ibid.). At 2.9 percent per year, the projected growth rate for sub-Saharan Africa in the period to 2030 for consumption of crops and livestock products is the highest in the world (ibid.). However, as food consumption per capita was already low, the predicted growth is very little in absolute terms. Up to 2030, demand for meat will increase faster than for milk (3.7 versus 2.7 percent/year, respectively) in sub-Saharan Africa. Again, however, in absolute terms these are only very modest gains. To compare: the projected food consumption of meat in 2030 is 13.4 kg per capita in sub-Saharan Africa, while in the same year the projected food consumption of meat in industrial countries is 100.1 kg per capita (ibid.).
Low productivity of the livestock sector is one of the major reasons why the availability of food of animal origin for human consumption in East Africa is low. Considering the projected human population growth, the output of livestock products will have to increase substantially in the coming decades. The projected annual growth rate for the population in the East African subregion is 2.55 percent per year for the next decade (UNFPA, 2005), while the expected growth rate for livestock numbers is only 1.41 percent per year (Table 6). This suggests that expansion of the livestock population is insufficient to keep pace with human population growth, and that increases in animal productivity are, therefore, necessary (FAO, 2002).
Figure 5 shows total milk and meat production for East Africa in the past, and projections for the future. Total meat production in East Africa will increase at an annual growth rate of 2.84 percent in the next decade (Table 6). The highest increase is seen in the poultry meat sector (4.66 percent/year),
Import live animals and animal products East Africa
0
1
2
3
4
5
6
7
8
million US$
live animalsmeatmilkeggsother
1994 1995 1996 1997 1998 1999 2000 2001 2002 2003 2004
TABLE 6. Annual growth rates: livestock numbers, meat and milk production for East Africa
Annual growth rate (%)1990–2000 2000–2015
Total livestock numbers 1.54 1.41
Total meat production (kg) 2.17 2.84
Total milk production (kg) 1.01 2.95
Source: FAO, (2003b).
Data unavailable for Burundi, Djibouti, Eritrea and Ethiopia.

THE STATE OF THE WORLD'S ANIMAL GENETIC RESOURCES FOR FOOD AND AGRICULTURE
14
EAST AFRICA
which will see a larger population of birds and higher offtake rates. Pork production will decrease in the next decade. Milk production shows the fastest predicted increase of all animal products. Total milk production will increase 2.95 percent/year, boosted mostly by the production of sheep and goat milk (6.20 percent/year). The predicted increase in sheep and goat milk production is expected mainly in Somalia. The number of milking sheep and goats in Somalia is expected to double in the next decade.
FIGURE 5Total meat and milk production in East Africa, past and projected3
Source: FAO (2003b).
3 Excludes Burundi, Djibouti, Eritrea and Ethiopia, for which data are not available.
2. Livestock production systems
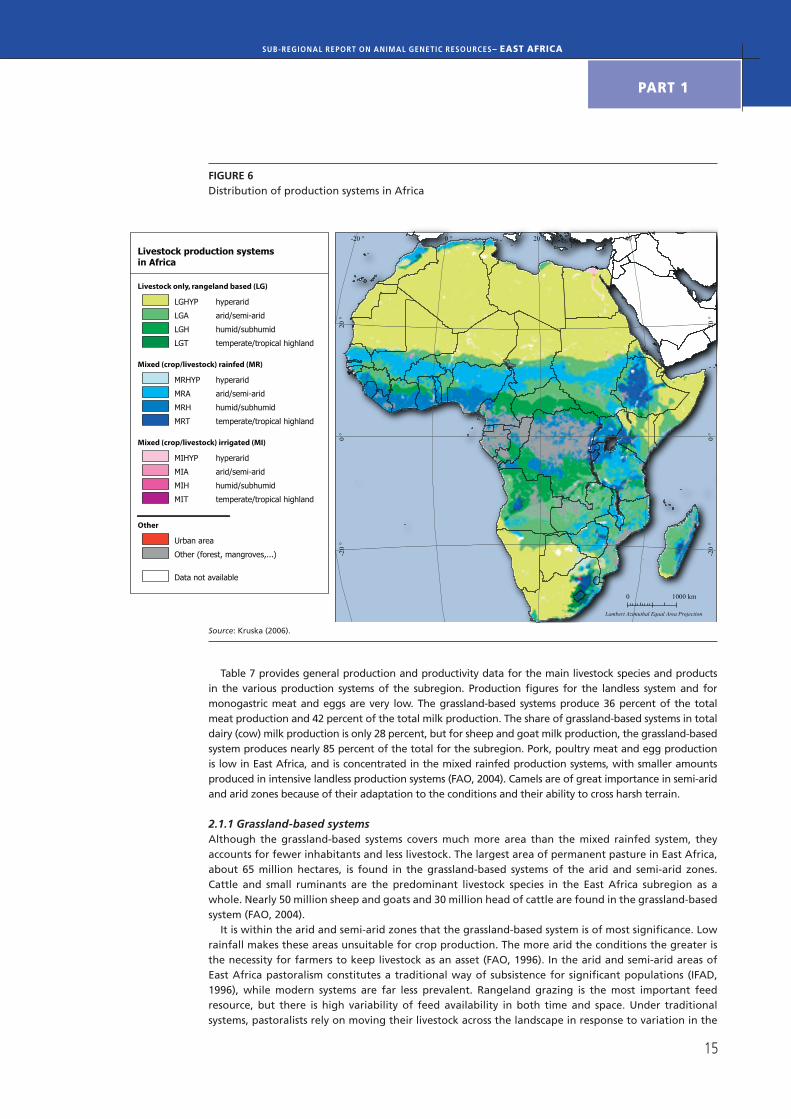
2.1 OverviewIn this report, livestock production systems are described according to the classification proposed by Seré and Steinfeld (FAO, 1996) in the FAO Report on World Livestock Production Systems. The statistics presented are based on updated data from 2004. The classification distinguishes grassland-based systems (including pastoralism and ranching), mixed rainfed systems, mixed irrigated systems, and landless systems. A description of the classification system can be found in the annex to this factsheet. The East Africa subregion includes only grassland-based, mixed rainfed and landless production systems. Irrigation is present only to a limited extent, and therefore the classification system does not register any mixed irrigated production systems in this subregion. Nonetheless, small-scale irrigated mixed farming systems are growing rapidly in the central part of the United Republic of Tanzania (FAO, 2002). Figure 6 shows the production systems present in Africa. Note that because of the method used to allocate data, the statistics presented below in Table 7 do not correspond exactly to the production system distribution shown in Figure 6.
In addition to the above-described classification, livestock systems are often classified according to whether they are “modern” or “traditional” systems. This classification overlaps the FAO (1996) classification. “Modern” systems have large capital requirements and employ substantial amounts of hired labour, while traditional systems mainly rely on family labour and the extensive use of land (FAO, 1991). “Traditional” livestock systems are far more prevalent in sub-Saharan Africa than modern systems.
Total meat and milk production East Africa,past and projected
0
1
2
3
4
5
1989–1991 1999–2001 2015 2030
meat production milk production
total meat production
total milk production
0
5
10
15
20
1�
PART 1
SUB-REGIONAL REPORT ON ANIMAL GENETIC RESOURCES– EAST AFRICA
FIGURE 6Distribution of production systems in Africa
Source: Kruska (2006).
Table 7 provides general production and productivity data for the main livestock species and products in the various production systems of the subregion. Production figures for the landless system and for monogastric meat and eggs are very low. The grassland-based systems produce 36 percent of the total meat production and 42 percent of the total milk production. The share of grassland-based systems in total dairy (cow) milk production is only 28 percent, but for sheep and goat milk production, the grassland-based system produces nearly 85 percent of the total for the subregion. Pork, poultry meat and egg production is low in East Africa, and is concentrated in the mixed rainfed production systems, with smaller amounts produced in intensive landless production systems (FAO, 2004). Camels are of great importance in semi-arid and arid zones because of their adaptation to the conditions and their ability to cross harsh terrain.
2.1.1Grassland-basedsystemsAlthough the grassland-based systems covers much more area than the mixed rainfed system, they accounts for fewer inhabitants and less livestock. The largest area of permanent pasture in East Africa, about 65 million hectares, is found in the grassland-based systems of the arid and semi-arid zones. Cattle and small ruminants are the predominant livestock species in the East Africa subregion as a whole. Nearly 50 million sheep and goats and 30 million head of cattle are found in the grassland-based system (FAO, 2004).
It is within the arid and semi-arid zones that the grassland-based system is of most significance. Low rainfall makes these areas unsuitable for crop production. The more arid the conditions the greater is the necessity for farmers to keep livestock as an asset (FAO, 1996). In the arid and semi-arid areas of East Africa pastoralism constitutes a traditional way of subsistence for significant populations (IFAD, 1996), while modern systems are far less prevalent. Rangeland grazing is the most important feed resource, but there is high variability of feed availability in both time and space. Under traditional systems, pastoralists rely on moving their livestock across the landscape in response to variation in the
40 °20 °0 °-20 °
40 °20 °0 °-20 °
20 °
0 °
-20
°
20 °
0 °
-20
°
0 1000 km
Lambert Azimuthal Equal Area Projection
Livestock production systemsin Africa
Livestock only, rangeland based (LG)
LGHYP hyperarid
LGA arid/semi-arid
LGH humid/subhumid
LGT temperate/tropical highland
Mixed (crop/livestock) rainfed (MR)
MRHYP hyperarid
MRA arid/semi-arid
MRH humid/subhumid
MRT temperate/tropical highland
Mixed (crop/livestock) irrigated (MI)
MIHYP hyperarid
MIA arid/semi-arid
MIH humid/subhumid
MIT temperate/tropical highland
Other
Urban area
Other (forest, mangroves,...)
Data not available

THE STATE OF THE WORLD'S ANIMAL GENETIC RESOURCES FOR FOOD AND AGRICULTURE
1�
EAST AFRICA
availability of forage and water (FAO, 2002). The self-sufficiency of these areas is high with respect to milk and ruminant meat, because of the relatively high livestock number per inhabitant.
Grassland-based systems, face a number of pressures. Multi-year droughts can lower livestock populations (single-year droughts do not have a great impact in terms of livestock mortality (IFAD, 1996)). Moreover, rising human populations and changes to land tenure and land use have often combined to confine pastoral livestock and disrupt traditional mobile management strategies. Adaptation strategies under these circumstances include diversifying livelihood activities (e.g. to include crop production and wage labour).
TABLE 7Resource base, production and productivity data by production system in East Africa
Grassland-based Mixed rainfed Landless
Temperate/Highlands
Humid/Sub-humid
Arid/Semi-arid
Temperate/Highlands
Humid/Sub-humid
Arid/Semi-arid
TOTAL
Parameters:
Human population (millions)
8 13 41 80 20 24 186
a) Resource base
a1. Grazing land (million ha)
7.4 13.1 65.6 33.3 4.5 10.2 134
a2. Arable land (million ha)
0.8 1.6 5.1 12.2 4.5 3.3 27
a3. Irrigated land (million ha)
0.1 0.0 0.3 0.2 0.0 0.1 1
a4. Livestock numbers
cattle (million head) 3.7 6.8 21.0 34.0 5.4 8.4 79
dairy cows (million head)
1.0 1.9 5.1 8.1 1.6 2.1 20
buffalo (million head)
sheep and goats (million head)
3.4 6.0 39.2 29.8 7.0 11.0 96
b) Major outputs (million kg)
beef and veal meat 51 91 247 436 92 147 1 064
buffalo meat
sheep and goat meat 9 16 142 95 27 36 325
pig meat 2 4 5 15 63 20 10 119
poultry meat 7 11 17 63 43 36 40 217
eggs 5 8 12 57 21 31 31 165
dairy milk 175 331 1 238 2 899 561 1 091 6 295
other milk 21 36 1 735 191 9 64 2 056
milk production total 196 367 2 973 3 090 570 1 155 8 351
c) Productivity indicators
beef and buffalo meat kg/head
14 13 12 13 17 18 13
sheep and goat meat kg/head
3 3 4 3 4 3 3
milk yield kg/cow 174 177 244 357 350 518 318
d) Self-sufficiency of systems
ruminant meat kg/inhabitant
7 8 10 7 6 8 7
monogastric meat kg/inhabitant
1 1 1 1 5 2 2
milk yield kg/cow 24 27 73 38 29 48 45
eggs kg/inhabitant 1 1 0 1 1 1 0.9
Sources: FAO (2004); FAO (1996).

17
PART 1
SUB-REGIONAL REPORT ON ANIMAL GENETIC RESOURCES– EAST AFRICA
The relative spatial distribution of cattle, sheep and goats can generally be determined by the comparative advantages of each species within the systems in question (FAO, 2002). Africa’s pastoralists prefer to keep a mixture of species (cattle, sheep, goats, camels) and to maximize herd size as a means of adapting to the harsh environment and averting risks. Small ruminants, with their higher reproductive rate, play a key role in rebuilding livestock populations after destocking caused by the periodic droughts which affect the system. In East African pastoral systems, cattle have the highest economic and social value. However, in some locations, small ruminants are more important (ibid.). Camels are another important pastoral species and are kept in Somalia, northeastern Kenya and southeastern Ethiopia (ibid.). In East Africa, the most abundant species in the arid and semi-arid areas of the grassland-based system are sheep and goats (40 million head), followed by cattle (20 million head). These areas also account for the highest total output of sheep and goat meat (142 million kg/year) in East Africa.
Although pastoralists make relatively efficient use of the rangeland resources, production parameters in the traditional livestock systems are generally poor. In particular, beef and milk offtake per animal are extremely low when compared with “non-traditional” systems (FAO, 2002). The productivity of milking cows in the arid and semi-arid areas is 244 kg per cow, which is low compared to the mixed rainfed systems, but rather high compared to other the grassland-based systems of other agro-ecological zones. However, the average milk yield per dairy cow in the subregion as a whole is only 320 kg per year. Over half of the total milk output in the grassland-based systems of arid and semi-arid areas is produced by sheep and goats – a total of 3 million kg per year.
The grasslands of the humid and subhumid zones also have potential for livestock production, but have disease constraints (primarily the predominance of trypanosomiasis) and are, therefore, less utilized for livestock keeping. East Africa’s highland zones have relatively limited diseases and parasite problems and have high productive potential. However, as the environment is favourable for crop production the highlands are dominated by mixed rainfed production systems, and grassland-based systems are restricted. The grassland-based systems of the temperate, humid and subhumid areas have fewer than 10 million small ruminants in total and a similar number of cattle. Livestock numbers, production figures and productivity indicators in these systems are relatively low (FAO, 2004).
2.1.2MixedrainfedsystemOverall, the mixed rainfed system in East Africa covers nearly 50 million ha of permanent pasture and another 20 million ha of arable land. Again, cattle and small ruminants are the predominant livestock species, but, in contrast to the grassland-based system, the livestock numbers for both species are nearly equal (both 30 million). Although within grassland-based systems the production figures for arid and semi-arid areas are relatively high, within mixed rainfed systems most of the production is located in the highland zones. The climate, the relatively few disease and pest problems, and the high productive potential, have led to high human population densities, and provide a favourable environment for crop and livestock production (FAO, 2002). Approximately 75 percent of the sub-Saharan highland zone lies in East Africa, mainly in Ethiopia and Kenya. Of the total population of 125 million inhabitants in the mixed rainfed system, 65 percent live in the highlands. Here, the human and cattle population densities are the highest to be found anywhere in sub-Saharan Africa.
In the tropical highlands, livestock are kept mainly in smallholder crop-livestock farms (FAO, 2002). Livestock tend to be of secondary importance vis-à-vis crops, with animals providing a range of services. In the highland zones, ecological conditions are relatively suitable for intensification of livestock production through the introduction of breeds from temperate zones. The system includes a wide range of intensity levels, which are largely related to the feed resource utilized. In East Africa, the mixed production systems of the highlands are the most important source of animal products, providing 41 percent of the beef and veal meat, 46 percent of the dairy (cow) milk and 37 percent of the total milk production of the subregion (FAO, 2004). In the Kenyan highlands non-traditional smallholder dairy farms integrate livestock production with the growing of subsistence crops, such as maize, beans and potatoes, and of cash crops. More than 90 percent of specialist dairy enterprises are found in the highlands (FAO, 2002). Overall, however, the highest productivity figures for beef and veal meat (18 kg meat per head) and for milk yield per cow (520 kg/cow/year) are found in the arid/semi-arid areas of the mixed rainfed systems.
Mixed production systems are less widespread in the arid and semi-arid zones because the high variability of rainfall makes it unsuitable for crop production. Some crop production, however, occurs even in arid areas receiving between 300 and 500 mm annual rainfall. The mixed rainfed systems in the humid and subhumid zones cover approximately 10 million hectares of grazing and arable land in East

THE STATE OF THE WORLD'S ANIMAL GENETIC RESOURCES FOR FOOD AND AGRICULTURE
18
EAST AFRICA
Africa. Like in the highland zones, livestock is often multifunctional and only of secondary importance to the farmer’s objectives (FAO, 1996). Livestock keeping in this production system is restricted by the presence of animal African trypanosomiasis (“Nagana”), which is present throughout the area marked in Figure 7 (though within this area the situation is far from uniform). The disease causes serious detriment to farming in the affected areas. In East Africa, the distribution of livestock is more or less inversely related to the distribution of the tsetse fly, the vector of the disease. Tsetse flies are absent in grassland-based systems and in the arid, semi-arid and highland areas, but act as an increasing constraint to cattle rearing as one moves from the semi-arid to the humid zone.
FIGURE 7Tsetse fly distribution – predicted areas of suitability in Africa
13
Regional and
Sub-Regional RepoRtS
– east africa
tHe State oF tHe WoRld'S aniMal genetiC ReSouRCeS FoR Food and agRiCultuRe
FiguRe 7.Tsetse fly distribution – predicted areas of suitability in Africa
This map shows the predicted areas of suitability for tsetse flies. It was produced for FAO – Animal Health and Production Division and DFID – Animal Health Programme by Environmental Research Group Oxford (ERGO Ltd) in collaboration with the Trypanosomosis and Land Use in Africa (TALA) research group at the Department of Zoology, University of Oxford in November 1999. The modelling process relies on logistic regression of fly presence against a wide range of predictors. The predictor variables include remotely sensed (satellite image) surrogates of climate: vegitation, tempreture, moisture. Demographic, topographic and agroecological predictors are also used. The prediction was created at 5 kilometres resolution for the whole sub-Saharan Africa.
19
PART 1
SUB-REGIONAL REPORT ON ANIMAL GENETIC RESOURCES– EAST AFRICA
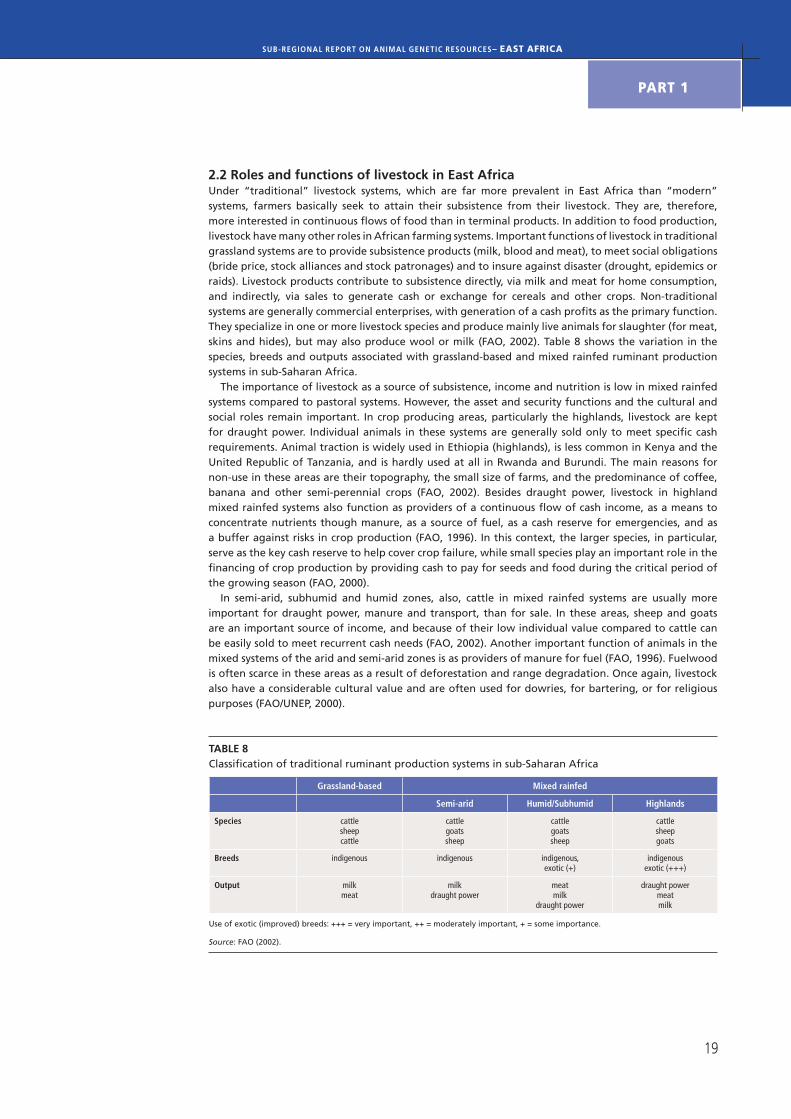
2.2 Roles and functions of livestock in East AfricaUnder “traditional” livestock systems, which are far more prevalent in East Africa than “modern” systems, farmers basically seek to attain their subsistence from their livestock. They are, therefore, more interested in continuous flows of food than in terminal products. In addition to food production, livestock have many other roles in African farming systems. Important functions of livestock in traditional grassland systems are to provide subsistence products (milk, blood and meat), to meet social obligations (bride price, stock alliances and stock patronages) and to insure against disaster (drought, epidemics or raids). Livestock products contribute to subsistence directly, via milk and meat for home consumption, and indirectly, via sales to generate cash or exchange for cereals and other crops. Non-traditional systems are generally commercial enterprises, with generation of a cash profits as the primary function. They specialize in one or more livestock species and produce mainly live animals for slaughter (for meat, skins and hides), but may also produce wool or milk (FAO, 2002). Table 8 shows the variation in the species, breeds and outputs associated with grassland-based and mixed rainfed ruminant production systems in sub-Saharan Africa.
The importance of livestock as a source of subsistence, income and nutrition is low in mixed rainfed systems compared to pastoral systems. However, the asset and security functions and the cultural and social roles remain important. In crop producing areas, particularly the highlands, livestock are kept for draught power. Individual animals in these systems are generally sold only to meet specific cash requirements. Animal traction is widely used in Ethiopia (highlands), is less common in Kenya and the United Republic of Tanzania, and is hardly used at all in Rwanda and Burundi. The main reasons for non-use in these areas are their topography, the small size of farms, and the predominance of coffee, banana and other semi-perennial crops (FAO, 2002). Besides draught power, livestock in highland mixed rainfed systems also function as providers of a continuous flow of cash income, as a means to concentrate nutrients though manure, as a source of fuel, as a cash reserve for emergencies, and as a buffer against risks in crop production (FAO, 1996). In this context, the larger species, in particular, serve as the key cash reserve to help cover crop failure, while small species play an important role in the financing of crop production by providing cash to pay for seeds and food during the critical period of the growing season (FAO, 2000).
In semi-arid, subhumid and humid zones, also, cattle in mixed rainfed systems are usually more important for draught power, manure and transport, than for sale. In these areas, sheep and goats are an important source of income, and because of their low individual value compared to cattle can be easily sold to meet recurrent cash needs (FAO, 2002). Another important function of animals in the mixed systems of the arid and semi-arid zones is as providers of manure for fuel (FAO, 1996). Fuelwood is often scarce in these areas as a result of deforestation and range degradation. Once again, livestock also have a considerable cultural value and are often used for dowries, for bartering, or for religious purposes (FAO/UNEP, 2000).
TABLE 8 Classification of traditional ruminant production systems in sub-Saharan Africa
Grassland-based Mixed rainfed
Semi-arid Humid/Subhumid Highlands
Species cattlesheepcattle
cattle goatssheep
cattlegoatssheep
cattlesheepgoats
Breeds indigenous indigenous indigenous, exotic (+)
indigenousexotic (+++)
Output milk meat
milkdraught power
meat milk
draught power
draught power meatmilk
Use of exotic (improved) breeds: +++ = very important, ++ = moderately important, + = some importance.
Source: FAO (2002).

THE STATE OF THE WORLD'S ANIMAL GENETIC RESOURCES FOR FOOD AND AGRICULTURE
20
EAST AFRICA
2.3 Projected changes in production systemsEnvironmental and population changes are important factors influencing the development of livestock production systems. According to Thornton et al. (2002) impacts of climate change in East Africa to the middle of the twenty-first century will be highly varied. Parts of East Africa will become drier, (notably Uganda and some areas of Ethiopia), with considerable reduction in the length of the growing season. Other areas, including southern Kenya and northern parts of the United Republic of Tanzania, may become wetter, with increases in the length of the growing season (ibid.). Such changes are certain to make fundamental changes to ecosystem structure and function. This, in turn, will affect land use and livestock-based livelihoods, and has the potential to make livestock keeping populations, especially pastoralists, more vulnerable (FAO/UNEP, 2000; Galvin et al., 2003).
Water availability is a key vulnerability for agriculture in Africa. Given that several models predict a decrease in mean annual precipitation in the order of 10 to 20 percent in the main semi-arid zones of Africa, there is a real possibility of a serious negative impact on pastoral livelihoods. The combination of continued population increases and the effects of global warming is also likely to accentuate water scarcity in subhumid regions of Africa (McCarthy et al., 2001). Another noteworthy expected change in the period to 2050 is the disappearance of large parts of the East African mixed highland systems as a result of climate change (Thornton et al., 2002). Simulations also indicate that global warming may cause changes in the distribution of tsetse flies, and may decrease the range of tick species in East Africa. Livestock distribution and productivity could be indirectly influenced via these changes (Hulme, 1996).
The East African population is expected to grow by approximately 150 percent within the next 45 years (UNFPA, 2005). Given this population growth, the output of livestock products will have to increase substantially in the coming decades (FAO/UNEP, 2000). Increased output of animal protein and cash income per hectare from livestock production may be generated by shifting from grassland-based systems to integrated crop–livestock mixed systems or by shifting from such mixed systems to intensive landless production (Otte and Upton, 2005). The mixed rainfed system is under pressure to specialize in meat or dairy production, and in the case of pigs and poultry there has been some development of large-scale landless systems.
However, the movement from extensive systems to intensive (zero-grazing) systems has always been slow in arid and semi-arid areas, while the supply of natural feed resources in these areas has remained static or increased very slowly (IFAD, 1996). Substantial increases in output in the grassland-based system are improbable (FAO, 1996). Arid and semi-arid rangelands are subject to heavier grazing pressure causing overgrazing and range degradation (Otte and Upton, 2005). The degradation is caused by increasing stock numbers, but also by crop production being expanded into increasingly marginal lands. According to the estimates provided by FAO (2002) the livestock populations in pastoral systems in sub-Saharan Africa are growing at a slower rate than in any other traditional system. Also, disease epidemics and livestock starvation associated with recurring drought have meant that livestock populations in East African pastoralist systems have tended to be stable rather than to expand (Galvin et al., 2003).
In the grassland-based systems in humid and subhumid zones feed quality limits output per animal. The prospects for pasture improvements are limited and there is little scope for horizontal expansion (FAO, 1996). In general, the importance of grassland-based systems in the humid and subhumid zones is expected to decline as mixed farming systems expand. Modelling has indicated that over the next half century, sub-Saharan Africa will undergo substantial transition from grassland-based to mixed livestock systems – notably in parts of Kenya, the United Republic of Tanzania and Ethiopia (Thornton et al., 2002).
In the mixed rainfed systems of the semi-arid zones, agricultural intensification is restricted by the resource base and the financial risks involved in increasing the use of inputs (FAO, 1996). In the mixed rainfed production systems of the humid and subhumid zones, the main challenge is to find ways to increase the productivity of the system, in which “biological potentials ... will be the key to productivity increases, and the expectation is that purchased feed inputs will be replaced by enhanced knowledge about the system, in particular, nutrient cycled within the system” (ibid.).
In the highland zones, grassland-based systems account for only small numbers of human inhabitants and livestock, and are unlikely to make a major contribution to output and wider economic development. Nonetheless, livestock production is vital to the livelihoods of sections of the local population. In contrast, the mixed rainfed system of the highland zones has large human and animal populations and the high production figures.

21
PART 1
SUB-REGIONAL REPORT ON ANIMAL GENETIC RESOURCES– EAST AFRICA
2.4 Impact of production system trends on animal genetic resourcesThe East Africa subregion faces a growing demand for livestock products in the context of serious climatic and environmental constraints to livestock production. To meet increasing demand, the use of straight-bred or cross-bred exotic breeds has often been regarded as a solution. However, tropical environments are challenging, and the majority of farmers are unable to achieve the high levels of inputs and investments required for utilization of exotic breeds. In this perspective, local breeds, which are better suited to the prevailing environment and may be resistant to various diseases, are a resource which should not be undervalued.
Impacts of the above-mentioned trends differ by production system.• In the mixed rainfed system and grassland-based system of arid and semi-arid areas, the ceiling
to intensification imposed by the resource-base and production conditions, and the multiple purposes of livestock, mean that the introduction of exotic breeds is quite limited (ibid.). However, a range of constraints (including climate change, population pressure and changes to land use) threaten the sustainability of pastoral production systems and the associated animal genetic resources.
• Adaptation of highly productive temperate breeds to the high temperatures and high humidity of the humid and subhumid areas has been notably poor, and in the smallholder systems local breeds are still widely used (FAO, 1996). In extremely hot areas, even Bos indicus breeds are beyond their thermal optimum. Under these conditions, meat and milk production declines and there is limited potential for alleviating the problem through breeding (McCarthy et al., 2001).
• In the tropical highland zones, the climate is more suitable for intensification of livestock production through the introduction of breeds from temperate zones. Nonetheless, providing the necessary inputs (e.g. feed and animal health provision) to support the keeping of exotic breeds remains a challenge, particularly for poorer livestock keepers. In the grassland-based systems of these zones, the future role of livestock production is seen more as a means of securing the livelihoods of the local livestock keepers than in making a major contribution to output, and the genetic resources utilized have to be adapted to these purposes and the relevant production conditions.
• Landless systems for monogastric species tend to involve the utilization of high-output breeds (Hoffmann and Scherf, 2005). However, the relative significance of the landless systems in the subregion is low compared to OECD and Asian countries.
3 Animal genetic resources
3.1 StatusTable 9 illustrates the number of animals of each major species in the East Africa subregion, and also gives an estimate of the number of breeds. The importance of asses and also of dromedaries in the subregion is reflected by its relatively large share of the world population for these species. The subregion also has a large number of dromedary breeds, accounting for 18 percent of the total number of breeds in the world. Except for asses and dromedaries, population sizes are low and the variety of breeds is low compared to other subregions of Africa. The cattle, pig, horse, chicken and duck populations, in particular, show low numbers of breeds. Table 10 shows the transboundary mammalian and avian breeds present in East Africa.
Figures 8 and 9 illustrate the structure of the data recorded in the Global Databank for Farm Animal Genetic Resources, showing the risk status of the mammalian and avian breeds recorded for each species in the East Africa subregion up to 2005. Less than 5 percent (12 out of 286) of extant mammalian and avian breeds in East Africa are categorized as at risk. However, this is probably an underestimate of the actual situation, primarily because of a lack of information. In Africa, population data is available for only 64 percent of mammalian and avian breeds, and those that are most at risk of extinction are usually those for which it is most difficult to obtain accurate census information (FAO/UNEP, 2000).

THE STATE OF THE WORLD'S ANIMAL GENETIC RESOURCES FOR FOOD AND AGRICULTURE
22
EAST AFRICA
TABLE 9Total population size and number of breeds of the major livestock species in East Africa and their share of the world total
Share of world total
Population size (1 000) Number of national breed populations
Population (%) Number of breed populations (%)
Buffalo 0 1 0 1
Cattle 77 976 130 6 5
Goat 46 178 80 6 7
Sheep 34 931 80 3 4
Pig 2616 19 0 2
Ass 4 009 15 10 8
Horse 1 502 5 3 0
Dromedary 1 444 17 8 18
Chicken 135 670 37 1 2
Duck1 1 320 1 0 0
Turkey 0 2 0 1
Goose (domestic) 0 2 0 1
Source: FAOSTAT (estimates of 2004 live animal populations).
1 Domestic duck and Muscovy duck.
No data available for Somalia.

2�
PART 1
SUB-REGIONAL REPORT ON ANIMAL GENETIC RESOURCES– EAST AFRICA
TABLE 10Transboundary mammalian and avian breeds in East Africa
Mammalian breeds Avian breeds
Ass Goat Rabbit Chicken
Dongolawi Adal Angora Fayoumi
Masai Alpine Black Satin Rhode Island Red
Somali Anglo-Nubian California Sussex
Somali Wild Ass Angora Carolina White Warren
Boer Chinchilla
Bactrian Camel Boran Flemish Giant Chicken commercial strains
Mongolian Bactrian British Alpine Géant des Flandres broiler, Arbor Acres AA broiler breeders
Kamori Kenya White Derco
Buffalo Kigezi New Zealand Hubbard
Egyptian Masai New Zealand White layer, Babcock
Norwegian Landrace layer, Babolna Harco
Cattle Oberhasli Sheep layer, Cobb 500
Aberdeen-Angus Saanen Adali layer, Hendrix Bovan Brown
Brown Swiss Sahelian Akele Guzai layer, ISA Brown
Ankole Shukria Arrit layer, Leghorn
Arado Small East African Awassi layer, Lohmann Brown
Ayrshire Somali Baraka layer, Shaver
Bahima Sudanese Desert Blackhead Persian
Bambawa Syrian Mountain Bleu Du Maine Turkey
Barka Toggenburg Corriedale Broad Breasted Bronze
Belgian Blue Dorper
Bonsmara Pig East African Blackheaded
Boran Berkshire East African long tailed
Brahman Hampshire Hampshire Down
Charolais Landrace Karakul
Danakil Large Black Limousin
Dexter Large White Masai
Ethiopian Boran Middle White Merino
Galloway Pietrain Rashaidi
Guernsey Saddleback Romney
Hereford Wessex Saddleback Somali
Holstein (black & white) South Down
Jersey Horse Sudan Desert
Jiddu Dongola Suffolk
Lugware Sussex
Masai
Montbéliarde
Red Bororo
Red Poll
Sahiwal
Santa Gertrudis
Simmental
Watusi

THE STATE OF THE WORLD'S ANIMAL GENETIC RESOURCES FOR FOOD AND AGRICULTURE
24
EAST AFRICA
FIGURE 8 Risk status of mammalian breeds recorded in East Africa* up to December 2005: absolute (table) and relative (chart) figures
0
10
20
30
40
50
60
70
80
90
100
Ass Buffalo Cattle Dromedary Goat Guinea Pig Horse Pig Rabbit Sheep Total RISK STATUS
critical 0 0 1 1 0 0 1 1 0 0 4
endangered 1 0 2 0 1 0 2 1 0 0 7
extinct 1 0 4 0 0 0 0 0 0 0 5
not at risk 0 1 47 4 19 0 1 7 3 25 107
unknown 8 0 41 12 35 2 1 2 8 28 137
Total 10 1 95 17 55 2 5 11 11 53 260
*Breeds that are also recorded in countries outside Africa are excluded from the analysis.

2�
PART 1
SUB-REGIONAL REPORT ON ANIMAL GENETIC RESOURCES– EAST AFRICA
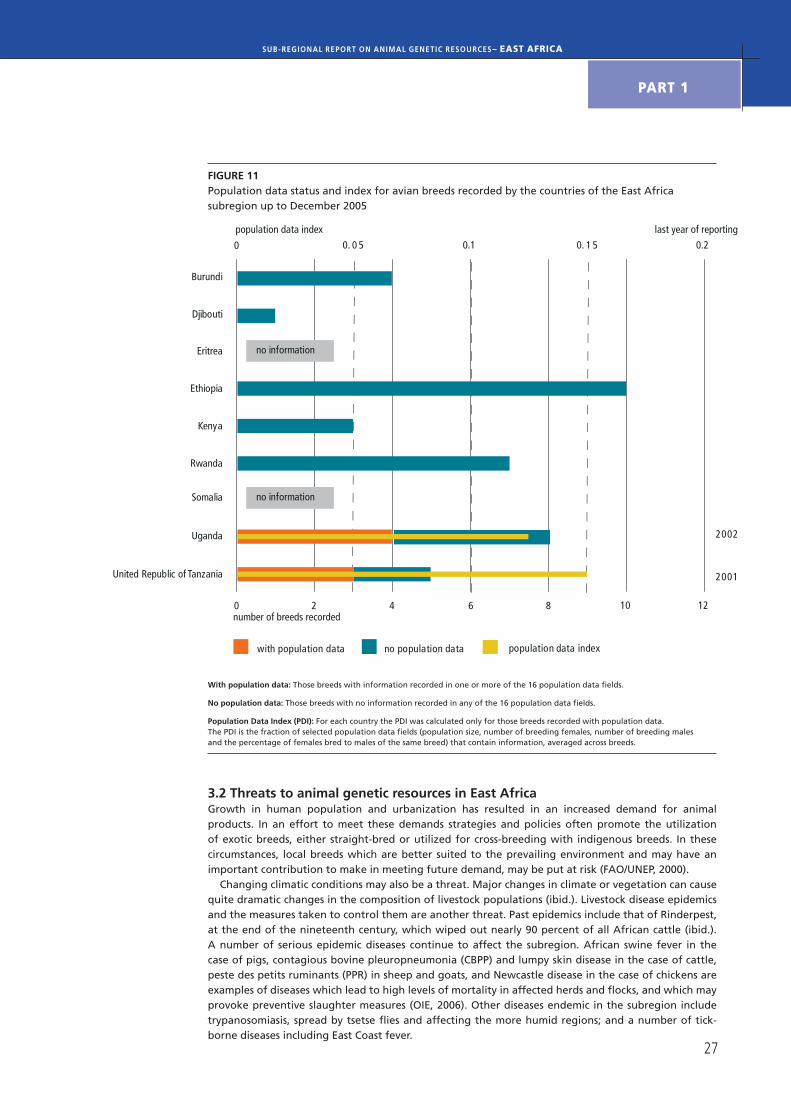
Figures 10 and 11 provide general overviews of the quantity and quality of the population data provided by each country for their animal genetic resources. The total number of breeds recorded by each country is shown. For all countries, breeds are split into those with population data and those with no population data (risk status unknown). When one or more fields in the Global Databank for Farm Animal Genetic Resources are completed, then the breed is identified as having population data. For those breeds recorded as having population data, a population data index (PDI) is calculated, which provides an indication of the completeness of the data provided by the country. Selected basic population data fields, regarded as being the most important and used in the calculation of risk status, are considered: population size (absolute or range), number of breeding females, number of breeding males and the percentage of females bred to males of the same breed (FAO/UNEP, 2000).
FIGURE 9Risk status of avian breeds recorded in East Africa* up to December 2005: absolute (table) and relative (chart) figures
0
10
20
30
40
50
60
70
80
90
100
Chicken Duck Goose Guinea fowl Turkey Total
0 0 0 0 1 1
8 1 2 0 1 12
17 0 0 1 0 18
Total 25 1 2 1 2 31
unknown
endangered
RISK STATUS
not at risk
*Breeds that are also recorded in countries outside Africa are excluded from the analysis.

THE STATE OF THE WORLD'S ANIMAL GENETIC RESOURCES FOR FOOD AND AGRICULTURE
2�
EAST AFRICA
FIGURE 10Population data status and index for mammalian breeds recorded by the countries of East Africa subregion up to December 2005
With population data: Those breeds with information recorded in one or more of the 16 population data fields.
No population data: Those breeds with no information recorded in any of the 16 population data fields.
Population Data Index (PDI): For each country the PDI was calculated only for those breeds recorded with population data. The PDI is the fraction of selected population data fields (population size, number of breeding females, number of breeding males and the percentage of females bred to males of the same breed) that contain information, averaged across breeds.
Uganda
Somalia
Rwanda
Kenya
Ethiopia
Eritrea
Djibouti
Burundi
United Republic of Tanzania
0 20 40 60 80 100number of breeds recorded
0 0.05 0.1 0.15 0.2population data index
with population data no population data population data index
1992
1994
2005
1994
1994
2002
2004
last year of reporting
27
PART 1
SUB-REGIONAL REPORT ON ANIMAL GENETIC RESOURCES– EAST AFRICA
FIGURE 11Population data status and index for avian breeds recorded by the countries of the East Africa subregion up to December 2005
With population data: Those breeds with information recorded in one or more of the 16 population data fields.
No population data: Those breeds with no information recorded in any of the 16 population data fields.
Population Data Index (PDI): For each country the PDI was calculated only for those breeds recorded with population data. The PDI is the fraction of selected population data fields (population size, number of breeding females, number of breeding males and the percentage of females bred to males of the same breed) that contain information, averaged across breeds.
3.2 Threats to animal genetic resources in East Africa Growth in human population and urbanization has resulted in an increased demand for animal products. In an effort to meet these demands strategies and policies often promote the utilization of exotic breeds, either straight-bred or utilized for cross-breeding with indigenous breeds. In these circumstances, local breeds which are better suited to the prevailing environment and may have an important contribution to make in meeting future demand, may be put at risk (FAO/UNEP, 2000).
Changing climatic conditions may also be a threat. Major changes in climate or vegetation can cause quite dramatic changes in the composition of livestock populations (ibid.). Livestock disease epidemics and the measures taken to control them are another threat. Past epidemics include that of Rinderpest, at the end of the nineteenth century, which wiped out nearly 90 percent of all African cattle (ibid.). A number of serious epidemic diseases continue to affect the subregion. African swine fever in the case of pigs, contagious bovine pleuropneumonia (CBPP) and lumpy skin disease in the case of cattle, peste des petits ruminants (PPR) in sheep and goats, and Newcastle disease in the case of chickens are examples of diseases which lead to high levels of mortality in affected herds and flocks, and which may provoke preventive slaughter measures (OIE, 2006). Other diseases endemic in the subregion include trypanosomiasis, spread by tsetse flies and affecting the more humid regions; and a number of tick-borne diseases including East Coast fever.
Uganda
Somalia
Rwanda
Kenya
Ethiopia
Eritrea
Djibouti
Burundi
United Republic of Tanzania
number of breeds recorded
population data index
with population data no population data population data index
0 2 4 6 8 10 12
0 0. 0 5 0.1 0. 1 5 0.2
no information
no information
2002
2001
last year of reporting

THE STATE OF THE WORLD'S ANIMAL GENETIC RESOURCES FOR FOOD AND AGRICULTURE
28
EAST AFRICA
3.3 Unique resources highlightedSeveral breeds present in the subregion are noted for their resistance to or tolerance of various diseases. For example, certain breeds are tolerant of trypanosomiasis, the major disease limiting introduction of non-native livestock to humid and subhumid areas (Rege, 1999). Trypanotolerance among East African breeds has been largely ignored, with more attention being paid to the West African N’Dama breed. However, natural selection for resistance occurred among the indigenous Zebu cattle of East Africa, for example, in the Orma Boran breed. Orma Boran cattle have been shown to be superior to other Bos indicus cattle under tsetse challenge (Dolan, 1997). Other examples from the subregion include the Red Masaai sheep and the Small East African goat which show high levels of resistance to gastrointestinal nematodes (Baker, 1998).
Many breeds have also adapted to the climatic conditions and vegetation of a particular agro-ecological zone. Many long-established species and breeds, including dromedaries and Zebu cattle have evolved the necessary physiology to cope with hot climates. The Zebu breeds are abundant in the subregion and exhibit a high level of resistance to harsh environmental conditions, making them the only type of cattle that can survive over a large part of Africa. The highest concentration of the Zebu population is in Eastern Africa and neighbouring countries in South and Central Africa. The Tanzanian Mpwapwa, for example, is a dual-purpose breed of a high production potential under semi-arid conditions. As well as the ability to survive and produce under challenging conditions, some local livestock breeds are also valued for their sociocultural roles. In Uganda, for example, Ankole and Zebu cattle play a role in traditional obligations associated with marriage (CR Uganda, 2003).
The special characteristics of African breeds have attracted international attention. Several African breeds have been identified by scientists as carriers of specific genetic traits that confer resistance against diseases and may, therefore, have the potential to be of benefit to livestock production around the world. Research is intensifying on several potentially useful livestock breeds such as the Red Masaai sheep. International demand has developed for breeds such as Boran cattle. Breeding societies in Africa and in other continents have sprung up making intensive use of these breeds (LPP/ITDG, undated).

29
PART 1
SUB-REGIONAL REPORT ON ANIMAL GENETIC RESOURCES– EAST AFRICA
References
Baker, R.L. 1998. Genetic resistance to endoparasites in sheep and goats. A review of genetic resistance to
gastrointestinal nematode parasites in sheep and goats in the tropics and evidence for resistance in some sheep
and goat breeds in sub-humid coastal Kenya. Animal Genetic Resources Information, 24: 1�–�0.
Brinkman, H-J. & Gray, C. 1999. Africa’s growth slowed in 1998. Africa Recovery, 12(4): 1�. (also available at
http://www.un.org/ecosocdev/geninfo/afrec/vol12no4/1998.htm).
CR (Country name). year. Country report on the state of animal genetic resources. (available in DAD-IS library at
www.fao.org/dad-is/).
Dolan, R.B. 1997. The Orma Boran: a trypanotolerant East African breed. World Animal Review 89: �4–��.
FAO. 1991. Small ruminant production and the small ruminant genetic resource in tropical Africa, by R.T. Wilson.
Animal Production and Health Paper No. 88. Rome.
FAO. 199�. World livestock production systems. Current status, issues and trends, by C. Seré, H. Steinfeld &
J. Groenewold. FAO Animal Production and Health Paper No. 127. Rome.
FAO. 1997. Technical Advisory Committee database for quantitative analysis of CGIAR priorities and strategies, by
G. Gryseels, J.P. Groenewold & A. Kassam. TAC Secretariat. Rome.
FAO. 2002. Cattle and small ruminant production systems in sub-Saharan Africa. A systematic review, by M.J. Otte and
P. Chilonda. Rome.
FAO. 200�a. World Agriculture: towards 2015/2030, an FAO perspective. Rome.
FAO. 200�b. World Agriculture: towards 2015/2030, an FAO perspective, AT201�/�0 data base. Rome.
FAO. 2004. Classification and characterization of world livestock production systems. Update of the 1994 livestock
production systems dataset with recent data, by J. Groenewold. Unpublished report. Rome.
FAO. 200�. Food supply situation and crop prospects in sub-Saharan Africa. FAO/GIEWS: Africa Report no. �,
December 200�, Rome. (also available at http://www.fao.org/giews/english/af/index.htm).
FAOSTAT. (available at http://faostat.fao.org).
FAO/UNEP. 2000. World watch list for domestic animal diversity, �rd edition, edited by B. Scherf. Rome.
Galvin, K.A., Thornton, P.K., Boone, R.B. & Sunderland, J. 200�. Climate variability and impacts on East African
livestock herders. Fort Collins, USA. Colorado State University.
Hoffmann, I. & Scherf, B. 200�. Management of farm animal genetic diversity: opportunities and challenges.
In A. Rosati, A. Tewolde and C. Mosconi, eds. Animal production and animal science worldwide, WAAP book of
the year 200�, pp. 221-279. Wageningen, the Netherlands, Wageningen Academic Publishers.
Hulme, M. 199�. Climate change in Southern Africa: an exploration of some potential impacts and implications in
the SADC Region. Norwich, United Kingdom. University of East Anglia.
IFAD. 199�. The rangelands of arid and semi-arid areas: challenges and hopes for the 2000s. Technical Advisory
Division Staff Working Paper No. 29. Rome. International Fund for Agricultural Development.
Kruska, R. 200�. Mapped Seré and Steinfeld livestock production systems for Africa, version 3. CD-ROM. Nairobi.
International Livestock Research Institute (ILRI).
LPP/ITDG. undated. Farm animal genetic resources: the African case. League for Pastoral Peoples/Intermediate
Technology Development Group. (available at http://www.iucn.org/themes/ceesp/WAMIP/Farm%20Animal%20G
enetic%20Res.pdf).
McCarthy, J.J., Canziani, O.S., Leary, N.A., Dokken, D.J. & White, K.S. 2001. Climate change 2001: impacts,
adaptation, and vulnerability. Contribution of Working Group II to the Third Assessment Report of the
Intergovernmental Panel on Climate Change. Cambridge, UK. Cambridge University Press.
OIE. 200�. Handistatus II. (available at www.oie.int).

THE STATE OF THE WORLD'S ANIMAL GENETIC RESOURCES FOR FOOD AND AGRICULTURE
�0
EAST AFRICA
Otte, M.J. & Upton, M. 200�. Poverty and livestock agriculture. In A. Rosati, A. Tewolde and C. Mosconi, eds.
Animal production and animal science worldwide, WAAP book of the year 2005. pp. 281–29�. Wageningen,
the Netherlands. Wageningen Academic Publishers.
Rege, J.E.O. 1999. The state of the African cattle genetic resources 1. Classification framework and identification of
threatened and extinct breeds. Addis Ababa, International Livestock Research Institute.
Thornton, P.K., Kruska, R.L., Henninger, N., Kristjanson, P.M., Reid, R.S., Atieno, F., Odero, A.N. & Ndegwa, T. 2002. Mapping poverty and livestock in the developing world. Nairobi, International Livestock Research Institute.
(also available at http://www.ilri.cgiar.org/InfoServ/Webpub/fulldocs/mappingPLDW/index.htm).
UNECA. 200�. Economic report on Africa, 2005. Meeting the challenges of unemployment and poverty in Africa.
Addis Ababa. United Nations Economic Commission for Africa. (also available at http://www.uneca.org/era200�).
UNFPA. 200�. State of world population 2005. The promise of equality, gender equity, reproductive health and
the millennium development goals. New York, USA. United Nations Population Fund.
World Bank Data & Statistics. (available at http://www.worldbank.org/data/countrydata/countrydata.html).
World Bank. 2001. World development report 2000/2001: attacking poverty. New York, USA. Oxford University Press.
WTO. 2003. Trade policy review Burundi, Report by the Secretariat. Geneva. World Trade Organization.

�1
PART 1
SUB-REGIONAL REPORT ON ANIMAL GENETIC RESOURCES– EAST AFRICA
Annex
Classification of livestock production systems:FAO (1996)4 used the agro-ecological zones (AEZ) described by the Technical Advisory Committee (TAC, 1994)5 and provided a comprehensive description of global livestock production systems using quantitative statistical methods. In this system the distinction is based upon grassland-based systems (LG), mixed-rainfed systems (MR), mixed irrigated systems (MI) and landless systems (LL). The landless livestock production systems are not linked to agro-ecological zones.
• Grassland-based systems (LG) are livestock systems in which more than 90 percent of dry matter fed to animals comes from rangelands, pastures, annual forages and purchased feeds and less than 10 percent of the total value of production comes from non-livestock farming activities. Annual stocking rates are less than 10 livestock units per hectare of agricultural land. A further distinction is made between Temperate Zones and Tropical Highlands (LGT), Humid and Subhumid Tropics and Subtropics (LGH) and Arid and Semi-arid Tropics and Subtropics (LGA).
• Mixed-rainfed systems (MR) are defined as rainfed systems in which more than 10 percent of the dry matter fed to livestock comes from crop by-products and/or stubble or more than 10 percent of the value of production comes from non-livestock farming activities. A further distinction is made between Temperate Zones and Tropical Highlands (MRT), Humid and Subhumid Tropics and Subtropics (MRH) and Arid and Semi-arid Tropics and Subtropics (MRA).
• Mixed-irrigated systems (MI) are defined as irrigated systems in which more than 10 percent of the dry matter fed to livestock comes from crop by-products and/or stubble or more than 10 percent of the value of production comes from non-livestock farming activities. A further distinction is made between Temperate Zones and Tropical Highlands (MIT), Humid and Subhumid Tropics and Subtropics (MIH) and Arid and Semi-arid Tropics and Sub-tropics (MIA).
• Landless systems are defined as those where less than 10 percent of the dry matter consumed is produced on the farm where the livestock are located, and where annual average stocking rates are above 10 livestock units (1 LU = 1 cattle or buffalo or 8 sheep or goats) per hectare of agricultural land. Furthermore, landless monogastric (LLM) and landless ruminant systems (LLR) are distinguished. The former are mainly industrial, intensive and vertically-integrated pig and poultry enterprises whose economic outputs are higher than those of ruminant enterprises. In landless ruminant systems, the value of production of the ruminant enterprises is lower than that of the pig and poultry enterprises.
4 FAO. 199�. World livestock production systems. Current status, issues and trends, by C. Seré, H. Steinfeld & J. Groenewold. FAO Animal Production and Health Paper No. 127. Rome.
� TAC. 1994. Animal agriculture in developing countries: technology dimensions. Development Studies Paper Series. Morrilton, Arkansas. Winrock International.


��
SUB-REGIONAL REPORT ON ANIMAL GENETIC RESOURCES– EAST AFRICA
Representatives of governmental and academic institutions from Burundi, Djibouti, Ethiopia, Kenya, the United Republic of Tanzania and Uganda who participated in the electronic consultation organized by FAO in 2005, agreed on strategic priority actions to be undertaken in the subregion.
1 Inventory and characterization
Policy, legal and institutional frameworks are lacking in some of the countries of the subregion. Scarcity of resources (human and financial) has not permitted complete inventory and characterization of animal genetic resources (AnGR) in the subregion. The technical, human and financial resources required for these activities are inadequate, while the technologies available are not adapted to the prevailing environment and production systems. Information on AnGR is scanty in many countries of the subregion, and, in most cases, incomplete.
Although most countries in the subregion share transboundary breeds/populations, there is no harmonized policy and legislation to facilitate joint management of these resources. Consequently, mechanisms for joint exploitation of opportunities such as investment, disease control, marketing and conservation are lacking. There are no “centres of excellence” to provide leadership in specialized areas such as human-resource capacity building, genetic characterization, policy and legislation.
Priority actions at national levela) Conduct comprehensive inventories and characterization throughout the subregion.b) Create awareness among policy-makers and farmers of the importance of AnGR, particularly of
the need to pay special attention to indigenous breeds.c) Conduct capacity building in human resources with emphasis on specialized areas like genetic
characterization and development of breeding plans.d) Establish and strengthen a national institution to coordinate management of AnGR.e) Plan and cost comprehensive and focused inventories and characterization of AnGR, and arrange
for funding.
Subregional levela) Establish a subregional centre similar to the up-coming Regional Focal Point (RFP) to coordinate
development of AnGR, networking and general cooperation in AnGR-related activities.b) Identify and develop subregional centres of excellence.c) Build partnerships with other organizations such as:- Association for Strengthening Agricultural Research in East and Central Africa (ASARECA);- International Livestock Research Institute (ILRI);- Inter-governmental Authority on Development (IGAD);- International Union for the Conservation of Nature (IUCN);- International Atomic Energy Agency (IAEA); and - national institutions, notably universities, research institutes and other institutions concerned with biodiversity, including government ministries and departments.d) IGAD, ASARECA, COMESA (Common Market for Eastern and Southern Africa) and EAC (East
African Community) and international organizations, including AU/IBAR (The African Union/Interafrican Bureau for Animal Resources), NEPAD (New Partnership for Africa’s Development), FAO, ILRI, UNDP (United Nations Development Programme) and ICRAF (International Centre for
Subregional Priorities: East Africa
PART 2
THE STATE OF THE WORLD'S ANIMAL GENETIC RESOURCES FOR FOOD AND AGRICULTURE
�4
EAST AFRICA
Research in Forestry) to provide platforms and support for joint subregional projects. Resources from these organizations are more likely to be secured for subregional than individual-country projects.
The following were suggested as the areas in which FAO could facilitate the implementation of national breed inventories, monitoring and characterization:
a) support human capacity building by training nationals in breed inventory, monitoring and characterization;
b) develop standardized methodologies for carrying out breed inventory, monitoring and characterization;
c) contract experts (from unspecified sources, but hopefully from within the subregion) to conduct inventories, monitoring and characterization of some identified species and breeds;
d) encourage national governments, NGOs and the private sector to contribute to the cost of conducting breed inventories, monitoring and characterization of the subregion’s AnGR; and
e) provide material and expertise as may be necessary, including institutional restructuring.
2 Sustainable utilization
a) Enhance awareness of the contribution of livestock to national economies:- Hold regular national and subregional workshops/seminars to create awareness among various
stakeholders of the importance of AnGR and the need to develop strategic actions for their sustainable utilization. Such workshops should cover specific themes such as the role of AnGR in wealth creation and poverty reduction, and conservation of AnGR as an element of national heritage.
- Develop brochures and leaflets on the importance of AnGR and the contribution of local breeds to food security, for distribution to educational institutions at all levels, particularly agricultural institutions.
- FAO to assist in raising awareness among high-level leadership, including the president and the cabinet, particularly the minister responsible for AnGR, on their role in the development of the AnGR.
- Conduct publicity through the media (radio, television and press).b) Conduct detailed studies to generate information on national AnGR, their unique adaptive
characteristics in relation to potential future roles, their uses and contribution to food security.c) Promote breeds that are known to have some unique economic/adaptive value. For example,
beef from the Ankole breed is valued globally for its low fat content, and goat skin is valued for its high quality.
d) Examine existing livestock marketing structure and facilities to establish whether they are adequate, create markets for indigenous breeds and their products, and support farmers to find niche markets for organically-produced indigenous breeds.
e) Advertise the breeds and their products on the basis of the philosophy that the resources are a global heritage.
f) Integrate innovative advanced production techniques to complement indigenous knowledge and practices by communities that keep local breeds.
g) Therapy and ethno-veterinary practices to control common diseases like foot-and-mouth disease, East Coast fever and bovine and caprine pleuropneumonia through locally-developed and patented vaccines.
h) Develop realistic recording systems and breeding plans for indigenous breeds, and nucleus breeding plans with simplified recording schemes for monitoring.
i) Use biotechnology in vaccine production and genetic improvement, especially for indigenous breeds.- Intensify use of artificial insemination in local breeds to increase production and also control
breeding diseases. Apply breeding schemes that would promote wide use of semen of good males.
- In traditional production systems, introduce simple techniques for breeding management such as rotation of breeding males and castration. This should be combined with simplified animal recording to assist in selection of genetically good animals.

��
SUB-REGIONAL REPORT ON ANIMAL GENETIC RESOURCES– EAST AFRICA
- In areas where land is limiting, intensify production, for example, forage production and conservation. In arid and semi-arid areas, plan for forage conservation in the wet season when there is surplus production.
At the subregional level:a) Train experts to be aware of and understand the protocols of research and development
programmes. b) Promote use and exchange of genetic materials that will increase food production and food
security in the subregion.c) Establish effective linkages to databases such as DAD-IS and DAGRIS.d) Set up and streamline information systems and initiate exchange of information and experiences
with other RFPs.e) Establish subregional centres of excellence:Subregional centres would be located in those countries with the required infrastructure and facilities
for AnGR activities, for the benefit all countries. Stakeholders within the subregion should collectively determine the location of the centres. They would operate as central points for AnGR activities in the subregion (training, databank, information, fund mobilization, seminars and conferences, planning etc.). Centres of excellence for various species/breeds would be established on the basis of contributions from the countries they will serve and other stakeholders such as the private sector.
Supporttobreedingassociationsa) NFPs to prepare training manuals which can be shared within the subregion. For example,
Kenya’s experiences in livestock registration through breed societies could be turned into a case study for training other countries.
b) Hold subregional workshops to sensitize stock owners in the subregion about the importance of breeders’ associations.
c) Draw upon information, skills and technologies from any of the countries of the subregion to support these developments.
d) Increase the area available for in situ conservation of the livestock species/breeds in question.
Developmentofstandardizedregistrationsystemsa) Hold subregional workshops on registration systems and the need to standardize them in the
subregion.b) Establish protocols for sharing experiences and developing standardized registration systems.c) Publish and distribute information on standardized registration systems and the role of
breeders’ associations for distribution to public and private institutions, community development institutions and libraries in the subregion.
Effectsustainableprogrammesofgeneticimprovementforlocalandexoticbreedsa) Document genetic improvement programmes of indigenous and exotic breeds in a standard
format.b) Indigenous livestock keepers should be consulted for their management skills and indigenous
knowledge of the genetic improvement of those breeds.c) Inventory of human resources with experience on genetic improvement of indigenous breeds.
Increasethecontributionofanimalproductiontonationaleconomiesa) Hold subregional planning meetings that would involve and sensitize policy-makers, national
animal scientists and other stakeholders.b) Take stock of relevant experiences and formulate strategies to increase the contribution of
livestock production to national economies.c) Document and distribute relevant experiences through national institutions.
PART 2

THE STATE OF THE WORLD'S ANIMAL GENETIC RESOURCES FOR FOOD AND AGRICULTURE
��
EAST AFRICA
3 Conservation
a) Conduct country surveys to determine the risk levels of breeds/populations, and secure funds for immediate conservation of those that are endangered.
b) Depending on the risk level, cryo conservation and other special forms of in situ and ex situ conservation should be introduced as a priority.
c) Governments should make use of institutional farms such as state farms, research institutes and farmers’ training centres for in situ conservation needs.
d) Establish mechanisms to ensure that owners of indigenous breeds get an equitable share of the benefits arising from these resources.
e) Integrate indigenous breeds in the national research agenda and programmes.f) Apply ex situ conservation in a way that it will not replace in situ conservation. For example, use
it only in cases where a breed is threatened with extinction because of a catastrophe.g) Explore the feasibility of establishing a subregional genebank.
Other measures in support of conservation:a) Ensure availability of sufficient pasture and water throughout the year. It is important to develop
sustainable pasture improvement programmes to achieve regular supply.b) Establish joint management of diseases and pests, especially along borders. This will require
subregional collaboration and commitment.c) Establish strict sanitary standards for products and services provided to unique breeds at risk of
extinctiond) Acknowledge the value of local breeds and their production systems.
4 Policy, institution and human capacity building
At national level:a) Establish national coordinating committees, comprising members with different backgrounds:
authorities responsible for livestock, experts, farmers, livestock development associations and other stakeholders such as NGOs. The committees’ work should be funded by the ministries responsible for livestock development in the respective countries.
b) Poor funding of staff training may translate into inadequacies in the integrated subregional coordinating structures. Therefore, it would be important for the national governments to jointly contribute towards the budget for the development of the structures and their operation. In addition, donor agencies should be approached for support.
At regional levela) Establish a Regional Focal Point (RFP) to coordinate AnGR activities in the region. The member
countries should proportionately contribute to the resources (financial and human) that will be required for the operation of the focal point.
At the subregional level, similar structures could be established with country representation.The national coordination structures in the subregion could be integrated through mutual agreement
of the respective governments. A legal framework would then be instituted specifying protocol for the integration, and showing each country’s contribution and share of the benefits.
Activities of the integrated subregional coordinating structures should include:• joint formulating policies on management;• joint development of joint subregional management strategies for transboundary resources;• joint monitoring of breeds/population, especially those that are endangered;• advising on breeding activities and livestock movements;• establishment and promotion of networking and exchange of visits; and• joint formulation and management of joint projects.Financial resources would be secured from various sources, including governments, donor agencies,
the private sector, NGOs and revenue from the sale of services and products.FAO’s role in developing national policies and institutions and capacity building would be:a) Support countries in the subregion to integrate AnGR activities into their project-development

�7
SUB-REGIONAL REPORT ON ANIMAL GENETIC RESOURCES– EAST AFRICA
agenda. Such agenda should first be discussed at the technical level then submitted to the government for approval.
b) Support training on inventorying, characterization, and documentation and information dissemination.
c) Lobby for financial support to indigenous organizations dealing with AnGR, to enable them to supplement government efforts to conduct complete inventories, characterization and monitoring.
d) Develop skills and experience in the management of AnGR databases.e) Provide relevant literature on electronic media to educational and other training institutions in
the subregion.f) Lobby developed countries and biotechnology companies to recognize the rights of indigenous
people over their AnGR which they have conserved over the years through their own indigenous knowledge and systems.
g) Hold a subregional workshop, coordinated by ASARECA, to compare country inventories of available technologies and structures for training technicians in the subregion.
h) Develop electronic training modules such as CD-ROMs and manuals for distribution to strategic stakeholders.
i) Use ILRI and national facilities (laboratories, libraries, training modules, Articifical Insemination (AI) centres) for training technicians in the use and conservation of AnGR.
Individual countries to contribute funds to fill gaps in technologies and structures through upgrading to meet specific training needs for technicians in the use and management of AnGR.
PART 2