submitted for the award of degree
TRANSCRIPT

DESIGN, FABRICATION & EXPERIMENTAL ANALYSIS OF
AUTOMATIC SOLAR TRACKING SYSTEM FOR PARABOLIC
TROUGH COLLECTOR FOR HOT WATER GENERATION
A Thesis
Submitted for the award of degree
Master of Engineering
in
CAD/CAM & Robotics
Submitted by
PARDEEP SINGH
ROLL NO: 801181022
Under the guidance of
Mr. DEVENDER KUMAR
Assistant Professor
Mechanical Engineering Department
MECHANICAL ENGINEERING DEPARTMENT
THAPAR UNIVERSITY PATIALA-147004, INDIA
(Established under section of UGC Act 1956 vide notification # F-12/84-U.3 of Government of india)
JULY-2013

i

ii

iii
INDEX
TITLE PAGE No.
Certificate i
Acknowledgement ii
Index iii
Abstract vii
List of figures viii
List of tables xii
Nomenclature and abbreviations xiv
CHAPTER-1: INTRODUCTION 1-16
1.1 Solar Energy 1
1.2 Energy Scenario 1
1.3 Solar Power in India 3
1.4 Solar Radiation on the Earth Surface 3
1.5 Solar Tracker 4
1.5.1 Flat panel Photovoltaic application 4
1.5.2 Concentrated Solar Thermal application 5
1.6 Need for Solar Tracker 5
1.7 Type of Sun Tracker 6
1.7.1 Passive Tracking System 7
1.7.2 Active Tracking System 8
1.7.3 Single axis Tracker 8
1.7.3.1 Horizontal Single axis Tracker 9
1.7.3.2 Vertical Single axis Tracker 10
1.7.4 Double Axis Solar Tracker 10

iv
1.8 Sensors used for Automatic Solar Tracking 11
1.8.1 Light Dependent Resistor 11
1.8.2 Photodiode 12
1.9 Motors 13
1.9.1 Stepper Motor 13
1.9.2 DC Motor 13
1.9.3 Servo Motor 14
1.10 Power Supply 15
CHAPTER-2: LITERATURE REVIEW 17-35
2.1 Performance 17-24
2.2 Design, Material and Economics 24-28
2.3 Application 28-31
2.4 Literature Summary and Gap Analysis 31-34
2.5 Gap Finding 34
CHAPTER-3: METHODOLOGY OF THE WORK 36-37
3.1 Introduction 36
CHAPTER-4: DESIGN AND FABRICATION 38-54
4.1 Design of a prototype parabolic trough concentrator 38
4.1.1 Design parameters 38
4.1.2 Design of prototype PTC using Parabola Calculator 2.0 38
4.2 Fabrication of prototype parabolic trough concentrator 40
4.2.1 Parabolic trough reflective material 41
4.2.2 Glass mirror as concentrator 41
4.2.3 Absorber tube 42
4.2.4 Storage tank 42
v
4.2.5 Insulations 43
4.2.6 Support structure 44
4.3 Manual tracking system 44
4.4 Automatic tracking mechanism 45
4.4.1 Automatic vertical tracking mechanism 45
4.4.2 Automatic horizontal tracking mechanism 46
4.5 Automatic Tracking System 47
4.5.1 Components of automatic tracking system 47
4.5.1.1 Sensor Casing 47
4.5.1.2 Lenses 48
4.5.1.3 Light dependent resistor 48
4.5.1.4 Transistor 2N2222 49
4.5.1.5 Variable resistance 49
4.5.1.6 Relay 50
4.5.2 Circuit diagram of automatic tracking system 50
4.5.3 Assembled view of the electronics components 51
4.5.4 Working principle of automatic parabolic trough concentrator 52
4.6 Temperature and solar intensity measuring instruments 52
4.6.1 Lux meter 53
4.6.2 Thermometer 53
CHAPTER-5: EXPERIMENTAL ANALYSIS 55-86
5.1 General 55
5.2 Design analysis 56
5.3 Optical analysis 57
5.4 Thermal analysis 57

vi
5.5 Calculation for performance analysis in automatic tracking system 58
5.6 Experimental study of glass mirror with bare copper tube by using manual
tracking mechanism
63
5.7 Experimental study of glass mirror with glazed copper tube by using manual
tracking mechanism
67
5.8 Experimental study of glass mirror with bare copper tube when the parabola
is standing at fixed position
71
5.9 Experimental study of glass mirror with glazed copper tube when the
parabola is standing at fixed position
75
5.10 Experimental study of glass mirror with bare copper tube by using
automatic tracking mechanism
79
5.11 Experimental study if glass mirror with glazed copper tube by using
automatic tracking mechanism
83
CHAPTER-6: RESULTS AND DISCUSSION 87-97
6.1 General 87
CHAPTER-7: CONCLUSION 98-99
CHAPTER-8: FUTURE SCOPE 100
REFERENCES 101-103
vii
ABSTRACT
In this world, everyone needs energy for day to day living cycle. Sources of energy are depleting
at a very fast rate. There is need to explore renewable energy sources which are more efficient
and give low operating cost. Sun is a source of renewable energy. Solar energy is a basic need of
living plants and human being on the earth. It is intermittent in nature, eco-friendly and non-
polluting energy. It is freely available throughout the world. Solar energy can be used for hot
water generation and direct conversion into electricity and into thermal energy.
A parabolic trough solar collector uses the glass mirror as reflecting material in the shape of
parabola to reflect and concentrate the sun radiation towards a receiver tube located at the focus
of the parabola. Various solar tracking systems have been developed by various researchers in
past decades. A tracking system is still required which can track the sun on real time basis
without any geographical data. In the present work an automatic sun tracking system for
parabolic trough collector is designed fabricated and experimental analysis is carried out for its
feasibility in hot water generation. After experimental work it is found that the automatic sun
tracking system gives more efficiency as compare to manual and fixed collectors. In the present
work two axis of motion (horizontal and vertical axis) are controlled by using different light
detector, DC motors, and gear mechanism. A black painted copper tube is used as an absorber
tube and a glazing (glass cover tube of bigger diameter) is provided to minimize the conduction,
convection and radiation losses. Water is used as a heat carrying fluid in absorber tube. The
concentration ratio of the PTC is 9.66 with aperture area 1.1163 m2 (without glazing) and 1.035
m2
with glazing. The maximum temperature of heating water obtained is 85 while the average
temperature of heating water was produced is 68 . The improvement in efficiency using
automatic sun tracking system as compare to manual and fixed position tracking system is 20 to
40%. The results obtained shows that the production of heating water using sun flux is a viable
undertaking using automatic solar tracking system. Reduced mass flow rate or with different
mass flow rate the efficiency of PTC can further be increased.

viii
LIST OF FIGURES
Figure No. Title Page No.
1.1 Solar Radiation on the Earth Surface 3
1.2 Type of Sun Tracker 5
1.3 Passive Tracking System 7
1.4 Active Tracking System 8
1.5 Horizontal Single Axis Tracking System 9
1.6 Double axis Solar Tracker 10
1.7 Light Dependant resistor 11
1.8 Different Type of Photodiode 12
1.9 Stepper motor 13
1.10 DC Motor 14
1.11 Servo Motor 15
2.1 Variation of Collector Water Temperature Tf0 with Time 17
2.2 Variation of Useful Heat Gain with Intensity 18
2.3 Solar Geometry 24
3.1 Flow diagram of Methodology 37
4.1 Pictorial view of Parabola Calculator Version 2.0 39
4.2 Pictorial view of PTC with Glass Mirror 41
4.3 Pictorial view of PTC with Absorber Tube 42
4.4 Storage tank in PTC 43
4.5 Different insulations arrangement in PTC 43
4.6 Support structure in PTC 44
4.7 Manual Tracking systems for PTC 45
4.8 Automatic vertical Tracking Mechanism for PTC 46
ix
4.9 Automatic horizontal Tracking Mechanism for PTC 47
4.10 Circular pipe 47
4.11 Lenses 48
4.12 Light dependent resistor 48
4.13 Transistor 2N2222 49
4.14 Variable resistance 49
4.15 Relay 50
4.16 Circuit diagram 50
4.17 Assembly of all parts 51
4.18 Automatic parabolic trough concentrator 52
4.19 Lux Meter for Solar intensity measuring instrument 53
4.11 Thermometer for temperature measuring instrument 53
5.1 Line diagram of PTC with thermometer 55
PERFORMANCE COMPARSION CHARTS
Manual study of glass mirror with bare copper tube:
5.2 Variation of collector water temperature with intensity 64
5.3 Variation of useful heat gain with intensity 65
5.4 Variation of thermal efficiency with intensity 66
Manual study of glass mirror with glazed copper tube:
5.5 Variation of collector water temperature with intensity 68
5.6 Variation of useful heat gain with intensity 69
5.7 Variation of thermal efficiency with intensity 70
Study of glass mirror with bare copper tube when the
parabola is standing at fixed position
5.8 Variation of collector water temperature with intensity 72
5.9 Variation of useful heat gain with intensity 73

x
5.10 Variation of thermal efficiency with intensity 74
Study of glass mirror with glazed copper tube when the
parabola is standing at fixed position
5.11 Variation of collector water temperature with intensity 76
5.12 Variation of useful heat gain with intensity 77
5.13 Variation of thermal efficiency with intensity 78
Automatic study of glass mirror with bare copper tube
5.14 Variation of collector water temperature with intensity 81
5.15 Variation of useful heat gain with intensity 81
5.16 Variation of thermal efficiency with intensity 82
Automatic reading of glass mirror with glazed copper
tube
5.17 Variation of collector water temperature with intensity 85
5.18 Variation of useful heat gain with intensity 85
5.19 Variation of thermal efficiency with intensity 86
Manual vs Fixed Position vs Automatic
6.1 Variation of temperature with time by using different
Tracking system in bare copper tube
89
6.2 Variation of temperature with time by using different
Tracking system in glazed copper tube
89
6.3 Variation of useful heat gain with time by using different
Tracking system in bare copper tube
91
6.4 Variation of useful heat gain with time by using different
Tracking system in glazed copper tube
91
6.5 Variation of instantaneous efficiency with time by using
different Tracking system in bare copper tube
93
6.6 Variation of instantaneous efficiency with time by using
different Tracking system in glazed copper tube
93

xi
6.7 Variation of thermal efficiency with time by using different
Tracking system in bare copper tube
95
6.8 Variation of thermal efficiency with time by using different
Tracking system in glazed copper tube
95

xii
LIST OF TABLE
Table No. Title Page No.
1.1 Direct Power loss due to Misalignment 5
1.2 Comparison of Batteries 16
2.1 Literature Summary 31
4.1 Design parameters for prototype parabolic trough collector 39
4.2 X and Y values for prototype parabolic trough collector 40
4.3 Parabolic trough collector specification after fabrication 54
5.1 Values of design parameters of automatic concentrator 58
5.2 Temperature variation in glass mirror with bare copper tube
(manual performance)
63
5.3 Manual performance data in glass mirror concentrator
(bare tube)
64
5.4 Temperature variation in glass mirror with glazed copper tube
(manual performance)
67
5.5 Manual performance data in glass mirror concentrator
(glazed tube)
68
5.6 Temperature variation in glass mirror with bare copper tube
when the parabola is standing at fixed position
71
5.7 Performance data in glass mirror concentrator(bare tube)
when the parabola is standing at fixed position
72
5.8 Temperature variation in glass mirror with glazed copper tube
when the parabola is standing at fixed position
75
5.9 Performance data in glass mirror concentrator(glazed tube)
when the parabola is standing at fixed position
76
5.10 Temperature variation in glass mirror with bare copper tube
(automatic performance) Dated 20 June, 2013
79
5.11 Temperature variation in glass mirror with bare copper tube
(automatic performance) Dated 21 June, 2013
79

xiii
5.12 Automatic performance data in glass mirror concentrator
(Bare tube) Dated 20 June, 2013
80
5.13
Temperature variation in glass mirror with glazed copper tube
(automatic performance) Dated 22 June, 2013
83
5.14
Temperature variation in glass mirror with glazed copper tube
(automatic performance) Dated 24 June, 2013
83
5.15 Automatic performance data in glass mirror concentrator
(Glazed tube) 24 June, 2013
84
6.1 Values of different performance parameters 87
6.2 Comparison of maximum Temperature by different tracking
mechanism
88
6.3 Comparison of Useful Heat Gain by different tracking
mechanism
90
6.4 Comparison of Instantaneous Efficiency by different tracking
mechanism
92
6.5 Comparison of Thermal Efficiency by different tracking
mechanism
94
6.6 Comparison of Overall System Efficiency by different
tracking mechanism
96

xiv
NOMENCLATURE AND ABBREVIATION
Symbol Description
A Collector aperture area, [m
2]
W Collector width, [m]
Diameter of absorber tube with glazing, [m]
L Length of collector, [m]
C Concentration ratio
Specific heat capacity of water, [J/kgK]
Heat removal factor
Beam or direct radiation, [W/m²]
Rim angle factor
Specular reflectivity of the concentrator
τ Glass cover transitivity for solar radiation
Rate of useful heat received from the collector, [W]
Ambient temperature, [ ]
Collector water inlet temperature, [ ]
Collector water outlet temperature, [ ]
Storage tank water temperature, [ ]
Initial storage tank water temperature, [ ]
Outlet temperature of water, [ ]
Dt Time interval, [h]
Overall heat loss co-efficient, [W/m2 K]
V Volume, [m3]
Heat loss factor
m Mass flow rate, [kg/s]
Instantaneous Efficiency
Thermal Efficiency
System Overall Efficiency
Optical efficiency

xv
PTC Parabolic Trough Collector
FPC Flat Plate Collector
CPC Compound parabolic trough collector

1
CHAPTER -1
INTRODUCTION
1.1 Solar energy
Solar energy is a high-temperature, high heating power radiant energy source, which has
many advantages over other unconventional energy sources. It is a domestic, reliable,
strong renewable resource with large not fully formed potential, and it emits essentially
none of the atmospheric pollution that are of emergent concern. Solar energy is a very
large, unlimited source of energy. The power which is coming on the earth from the sun
is approximately 1.8 x 10¹¹
MW [Garg, H P & Parkash, J 1997] and it is larger of times
higher than that of other commercial energy sources. Thus, in belief, solar energy can
fulfill all the energy requirement of the earth in a regular way. This makes it one of the
most talented of the alternative energy sources.
Sun is a source of renewable energy. It is a big sphere of very hot gases, the heat being
produced by various kinds of fusion reactions process. The diameter of the sun is 1.39 x
106 km, which is very large while that of the diameter of the earth is 1.27 x 10
4 km. The
mean distance of the sun from the earth is 1.496 x 10⁸ km. Although the size of the sun is
big, it makes an angle of only 32 minutes (0.530) at the surface of the earth. This is
because the distance of the sun from the earth is very large. Thus, the beam radiation
coming from the sun on the earth is almost inline. The brightness of the sun varies from
its center to its edge, depends on the weather. However, from engineering calculations, it
is exceptional to assume that the brightness all over the solar disc is same. [Garg, H P &
Parkash, J 1997]
1.2 Energy scenario
It is nearly 35 years since the first oil astonish in 1973. Since then the words ‘energy
suspense’ continue to dominate the news. By taking these worries now are the matter of
climate change. In spite of efforts, renewable sources of energy and other new sources,
fossil fuels (coal, oil & natural gas) were developed. While the need for alternative

2
sources of energy is recognized, no set of alternatives has emerged which can take over
the role played by fossil fuels.
In India the energy problem is a very serious matter. After discovery of oil and gases the
import of crude oil creates a great problem, because lots of money is invested. Every year
the country will spend more than Rs 5000 crores for the import of oil and gases. This
amount of money forms a major part of India’s import bill. The need for producing
energy alternatives is very necessary and many researcher and developer work is already
in progress in that direction.
One of the better options is to make more widely use of renewable sources of energy
coming from the sun. Solar energy can be used both directly and indirectly. It can be used
directly in many thermal applications like drying, heating water of air, distillation,
refrigeration, and electricity generation. A second way in which solar energy can be used
indirectly is the photovoltaic effect in which solar energy is converted into electrical
energy. Thus the energy obtained from the sun is free of cost, and it can be easily
converted to any other form of energy.
Thus today, every country completes his energy requirement by various sources. These
sources of energy are commercial and non commercial. Fossil fuels (coal, oil & natural
gas), hydroelectric power, nuclear power and wind power are come under commercial
sources of energy, while wood, animal wastes and agricultural wastes are come under
non commercial energy sources. In an industrialized country like USA, energy
requirements are fulfilled by using commercial sources of energy, while in less developed
country like India, commercial and noncommercial sources are equally used.
In the past few years, it has become obvious that the use of fossil fuel resources are very
fast and that the fossil fuels are coming to an end stage. This is because a great use of oil
and natural gas. Every person is completely dependent on the commercial sources of
energy for living a better life. But it creates large quantity of problems. Perhaps the most
serious of these is a dangerous effect on the environment. The combustion of fossil fuels
has caused the environment pollution in many areas; because of many industries release

3
harmful gases in the atmosphere. It is also the main contributor phenomenon of global
warming which is now a great issue of concern. [Garg, H P & Parkash, J 1997]
1.3 Solar Power in India
In currently, the capacity of electricity installed in India’s is 135 401.63MW. There is a
peak power lack of about 10 % and overall power lack of 7.5 %. The 11th plan aim is to
add 100 000 MW by 2012 and MNRE has set up aim to add 14500 MW by 2012 from
new and renewable energy resources out of which 50 MW would be coming from solar
power. The included Energy Policy of India envisages electricity generation installed
capacity of 800 000 MW by 2030 and a substantial role would be from renewable energy.
This indicates that India’s energy requirement in future is very high and solar energy is
the best way to fulfill these energy requirements. (Making solar thermal power generation
in India a reality – Overview of technologies, and challenges Shirish Garud, Fellow and
Ishan Purohit, Research correlate, The Energy and Resources Institute (TERI), India).
[Garg, H P & Parkash, J 1997]
1.4 Solar radiation on the earth surface
Figure 1.1 [Garg, H P & Parkash, J 1997]

4
Solar radiation which comes on the earth is received in an attenuation form because it
passes to the mechanism of absorption and scattering while received on the earth.
Beam radiation
The radiation which is directly come from the sun on the earth is called beam radiation.
These radiations are in line with the sun.
Diffuse radiation
The radiation which is received at the earth surface from all part of the sky’s hemisphere
(after being subjected to scattering in the atmosphere) is called diffuse radiation.
Total radiation
The sum of the beam and diffuse radiation is called as total or global radiation.
1.5 Solar tracker
A solar tracker is a device that orients various payloads toward the sun. Payloads
can be photovoltaic reflectors, panels, lenses or other optical devices.
Thus the primary advantage of a tracking system is to collect solar energy for a
long time of the day and with the most accurate alignment as the Sun's position
shifts with the seasons, as it track the sun in all directions. [Cheema, S S 2012]
1.5.1 Flat-panel photovoltaic (PV) applications
In flat panel photovoltaic applications trackers are used to minimize the angle of
incidence between the incoming light and a photovoltaic panel. It increases the
amount of energy produced from a fixed amount of installed power generating
capacity within standard photovoltaic applications, it is used to judge that trackers
are used in at least 85% of commercial installations greater than 1MW from 2009
to 2012. [Cheema, S S 2012]

5
1.5.2 Concentrated photovoltaic (CPV) and concentrated solar thermal
(CSP) applications
In concentrated photovoltaic (CPV) and concentrated solar thermal (CSP)
applications trackers are used to enable the optical components in the CPV and
CSP systems. The optics accepts the direct component of sunlight in concentrated
solar application and therefore must be oriented appropriately to collect power.
Tracking systems do not produce energy unless oriented closely toward the sun so
that it found in all tracking applications. [Cheema, S S 2012]
1.6 Need for solar tracker
The energy contributed by the direct beam drops off with the cosine of the angle between
the incoming light and the panel. The table no. 1.1 shows theDirect power lost (%) due to
misalignment (angle i).
Table 1.1 Direct power lost (%) due to misalignment (angle i)
Misalignment angle (i) Direct power lost (%)=1-cos(i)
00 0
10
0.015
30
0.14
80
1
23.40
8.3
300
13.4
450
30
600
>50
750
>75
The sun movement is from east-west through 360° around a day, but the visible portion is
180 degrees during a ½ day period because of perspective of any fixed location. Local
horizon effects making the effective motion about 150 degrees by reducing the
perspective of any fixed location. A solar panel in a fixed direction between the dawn and

6
sun set extremes will see a motion of 75 degrees on either side, and thus, on the basis of
the table above, will lose 75% of the energy in the morning and evening. The panels are
rotated from east and west can help recapture these losses. A tracker which is rotating in
the east-west direction is known as a single-axis tracker.
The sun also moves from north-south all over the period of a year at angles of 46 degrees.
The same panels set is fixed at the midpoint between the two local extremes will thus see
the sun move 23 degrees on either side, causing losses of 8.3% A tracker that accounts
for both the daily and seasonal motions is known as a dual axis tracker. [Cheema, S S
2012].
1.7 Type of sun trackers
Figure 1.2 [Mousazadeh, H 2009]

7
1.7.1 Passive Tracking System
The passive tracking system realizes the movement of the system by utilizing low boiling
point water. This water is vaporized by the added heat of the sun and the center of mass is
shifted leading to that the system finds the new equilibrium position.
Passive solar trackers are based on thermal expansion of a matter (usually Freon).
Generally this kind of tracker composed of a couple of actuators working against each
other which are the equal illumination of light. The unbalanced forces are used for
orientation of the apparatus in that direction, where equal illumination of actuators and
balance of forces is restored.
Passive solar trackers as compared to active solar trackers are less complex but work in
small efficiency and at small temperatures they stop working. After testing, it has been
shown that passive trackers are comparable to electrically based systems in terms of
performance. Even though passive trackers are often less costly, yet they have not been
widely accepted by consumers.
Figure 1.3 A passive solar tracker using two identical cylindrical tubes filled with a fluid under
partial pressure [Mousazadeh, H 2009]
8
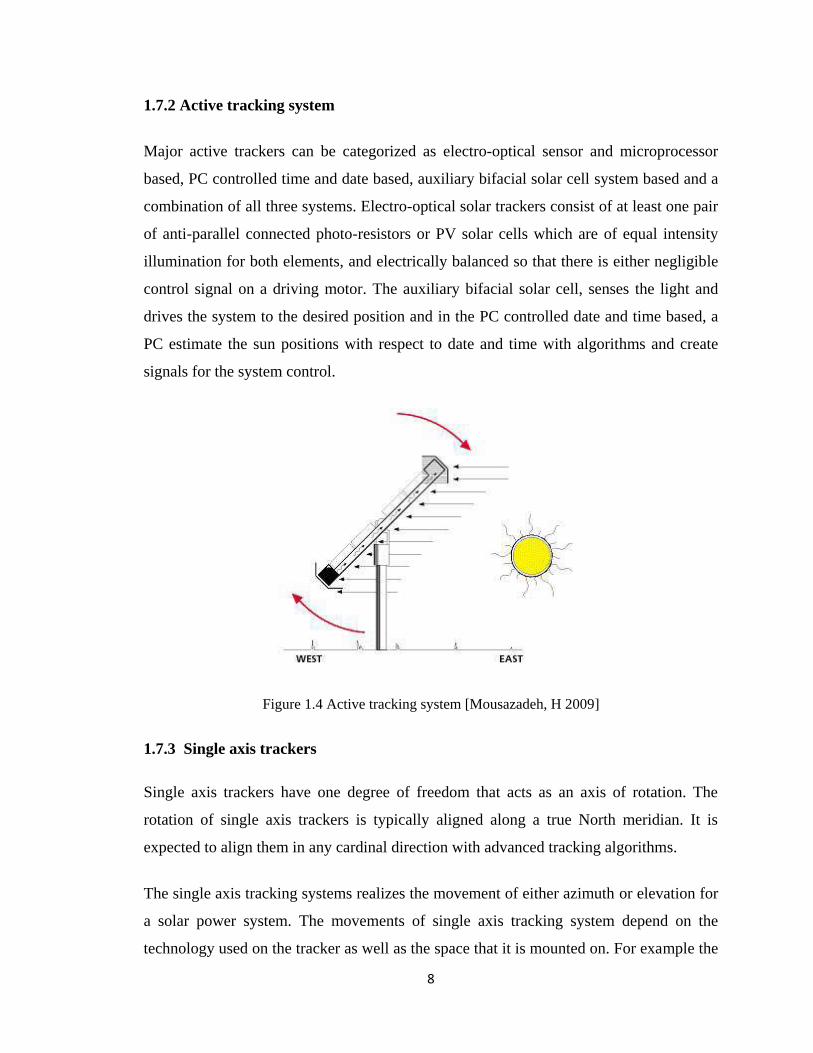
1.7.2 Active tracking system
Major active trackers can be categorized as electro-optical sensor and microprocessor
based, PC controlled time and date based, auxiliary bifacial solar cell system based and a
combination of all three systems. Electro-optical solar trackers consist of at least one pair
of anti-parallel connected photo-resistors or PV solar cells which are of equal intensity
illumination for both elements, and electrically balanced so that there is either negligible
control signal on a driving motor. The auxiliary bifacial solar cell, senses the light and
drives the system to the desired position and in the PC controlled date and time based, a
PC estimate the sun positions with respect to date and time with algorithms and create
signals for the system control.
Figure 1.4 Active tracking system [Mousazadeh, H 2009]
1.7.3 Single axis trackers
Single axis trackers have one degree of freedom that acts as an axis of rotation. The
rotation of single axis trackers is typically aligned along a true North meridian. It is
expected to align them in any cardinal direction with advanced tracking algorithms.
The single axis tracking systems realizes the movement of either azimuth or elevation for
a solar power system. The movements of single axis tracking system depend on the
technology used on the tracker as well as the space that it is mounted on. For example the

9
parabolic through systems utilize the azimuthally tracking whereas the many rooftop PV-
systems utilize elevation tracking because of the lack of space. A single-axis tracker can
only revolve in one plane – either horizontally or vertically. This makes it less complex
and generally cheaper than a two-axis tracker, but it is less effective at harvesting the
total solar energy available at a site. Trackers use motors and gear trains to direct the
tracker as commanded by a controller responding to the solar direction. The motors
consume all energy, so one wants to use them only as necessary. [Cheema, S S 2012]
1.7.3.1 Horizontal single axis tracker (HSAT)
The axis of rotation for horizontal single axis tracker is horizontal with respect to the
earth. The posts at any end of the axis of rotation of a horizontal single axis tracker can
be shared between trackers to lower the installation cost.
Field layouts with horizontal single axis trackers are very flexible. The simple geometry
of the tracker means that keeping the entire axis of rotation parallel to one another that is
required for appropriately positioning the trackers with respect to each other.
Figure 1.5 A single axis horizontal tracking system [Cheema, S S 2012]
In single axis horizontal trackers, a long horizontal tube is supported with the frame. The
axis of the tube is on a north-south line and it rotates on its axis. Panels are fitted on the
tube, and the tube will rotate on its axis to track the apparent motion of the sun through
the day.

10
1.7.3.2 Vertical single axis tracker (VSAT)
The axis of rotation for vertical single axis trackers is vertical with respect to the earth.
These trackers revolve from East to West over the course of the day. Such trackers are
more efficient at high latitudes than are horizontal axis trackers.
Vertical single axis trackers typically have the face of the module oriented at an angle
with respect to the axis of rotation. It sweeps a cone that is rotationally symmetric around
the axis of vertical rotation as a module tracks. [Cheema, S S 2012]
1.7.4 Double axis solar trackers
Double axis solar trackers have both a horizontal and a vertical axle and so can track the
Sun's apparent motion exactly anywhere in the World. Figure 1.6 shows a Solar Tracker
using horizontal and vertical axle.
Figure 1.6 Double axis solar tracker [Cheema, S S 2012]
Double axis solar tracking system can trace the Sun at any location with the help of
geographical data of that location.
This type of tracking system is used to manage astronomical telescopes, and so there is
various software’s available to automatically predict and track the motion of the sun
across the sky. The efficiency of the solar panels can be increased by 30-40% by tracking

11
the sun. The dual axis tracking system is also used for concentrating a solar reflector
toward the concentrator on heliostat systems.
Dual axis trackers as shown in the figure have two degrees of freedom that act as axes of
rotation, as the name suggest, it can rotate simultaneously in horizontal and vertical
directions, and are capable to trace the sun at all times in any location.
There is need of highly capable processing system as well as geographical data of every
location. It also need to be calibrated for 365 day of a year, as time of Sun rise, Sun set
and elevation changes every day, everywhere in the world.
To overcome this limitation, there is need of simpler and easy to maintain cost effective
way to track the Sun for the whole day and for every season throughout the year.
1.8 Sensors used for Automatic Solar Tracking
A sensor is a mechanism that measures a physical quantity and converts it into a signal
which can be read by an observer or by an instrument.
1.8.1 Light Dependent Resistor
Figure 1.7 Light Dependent Resistor (LDR) [Siew, H W 2008]
Light Dependent Resistor (LDR) is made of a high-resistance semiconductor. It can also
be known as photoconductor. If the light fall on the device is of the high frequency,
photons are absorbed by the semiconductor give bound electrons enough energy to jump
into the conduction band. The resulting free electron (and its hole partner) conduct
12
electricity, thus lowering resistance. Hence, Light Dependent Resistors (LDR) is very
useful in light sensor circuits. LDR is very high-resistive power, sometimes as high as
1000 000Ω, when the resistance is drops dramatically by illumination of light.
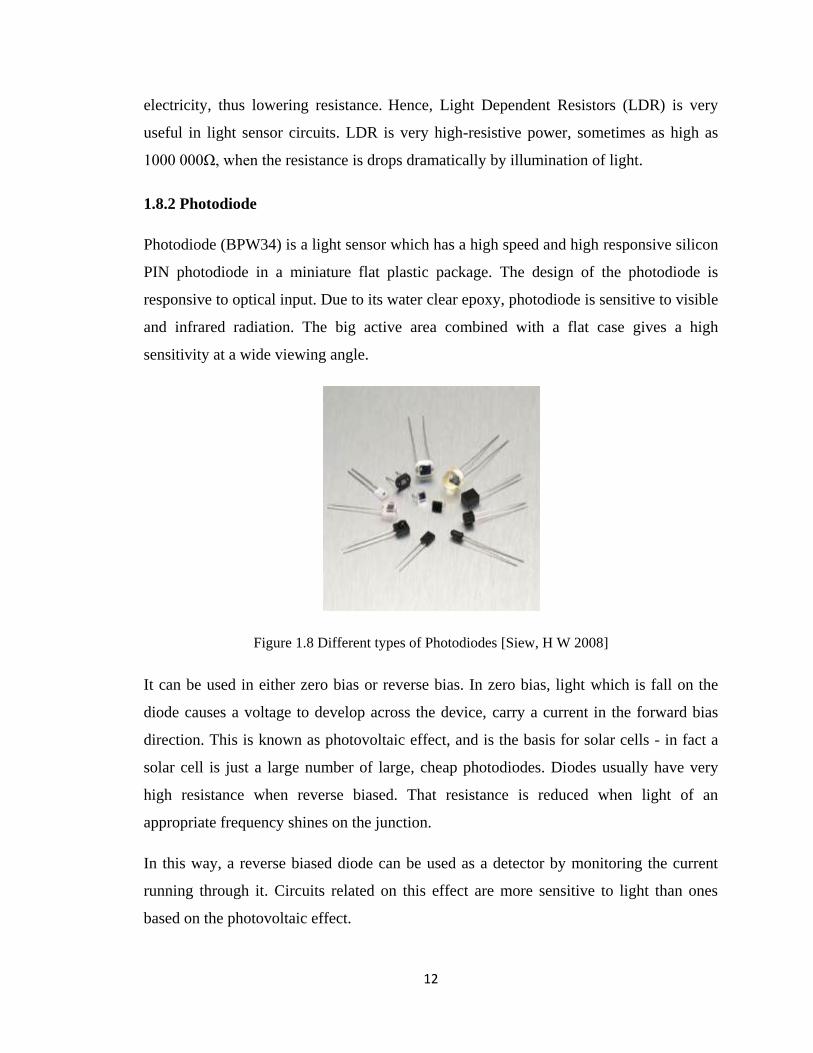
1.8.2 Photodiode
Photodiode (BPW34) is a light sensor which has a high speed and high responsive silicon
PIN photodiode in a miniature flat plastic package. The design of the photodiode is
responsive to optical input. Due to its water clear epoxy, photodiode is sensitive to visible
and infrared radiation. The big active area combined with a flat case gives a high
sensitivity at a wide viewing angle.
Figure 1.8 Different types of Photodiodes [Siew, H W 2008]
It can be used in either zero bias or reverse bias. In zero bias, light which is fall on the
diode causes a voltage to develop across the device, carry a current in the forward bias
direction. This is known as photovoltaic effect, and is the basis for solar cells - in fact a
solar cell is just a large number of large, cheap photodiodes. Diodes usually have very
high resistance when reverse biased. That resistance is reduced when light of an
appropriate frequency shines on the junction.
In this way, a reverse biased diode can be used as a detector by monitoring the current
running through it. Circuits related on this effect are more sensitive to light than ones
based on the photovoltaic effect.

13
1.9 Motors
Motor are used to drive the tracking system with the movement of the sun. Some of the
motor which are available in the market are explain below.
1.9.1 Stepper Motors
Stepper motor has relatively limited power which means that wheel spin will not be a
problem. It has not fast movement but yet it will work. In this, two signals are used to
operate the driver chips. One signal is used to determines the direction of rotation of the
motor, plus for forward and minus for backwards. The other is used to moves the stepper
by one step each time it goes from minus to plus.
Figure 1.9 Stepper motor [Siew, H W 2008]
Stepper motors move in steps, 200 or 400 steps per revolution to be precise. To move
them, the stepper driver has a smooth pulse. If the pulse timing is out condition, the
motor would just stop and not move. They can also produce precise and accurate motor
rotation if the correct motor driver firmware signals are obtained.
Due to slow movement, it has a high tendency for Sun tracing, and it gives a very precise
step by step movement. But the cost of this motor is very high.
1.9.2 DC Motors
DC motors are cheaper to buy, and simple to drive but they need feed-back sensors to
control of the speed.

14
Figure 1.10 DC Motor [Siew, H W 2008]
It is essential to detect the rotation of the wheels, usually by means of sensors are
controlled better by pulling the motor supply that uses less battery power than the
analogue methods. It has a low inertia and fast speed, but cost is added for controlling of
the motor movement.
The advantages of the DC motor are the torque and their speed is easier to control. The
disadvantage of DC motors is that they consumed large amounts of power. They would
spent the battery power in a short time and power saving techniques must be employed to
ensure the mouse do not stop halfway while navigating. It is also prone to dust and harder
to maintain.
1.9.3 Servo Motors
Servos motor contain a small DC motor, a gearbox assembly and some control circuit,
and feed on the voltage of 5 volts at about 100mA maximum, and on 10-20mA when it is
idle. They have a three-wire connector, one common wire (0 volt, usually black), one +5v
wire (usually red), and one signal wire. In normally use they are controlled by pulses of
about 1 to 2 milli-seconds at a repetition rate of about 50 per second.
A short pulse drive the servo to one end of the travel, a long pulse makes the servo to
drive at the other end, and a medium pulse puts it somewhere proportionally between
these two pulse. Some servos have gear mechanism that allows the servo to rotate
continuously. This type of method needs the servo to have a feedback potentiometer used
by internal circuits to measure the position of the output shaft.

15
Figure 1.11 Servo Motor [Siew, H W 2008]
If it is disconnected and the wires carried to an external pre-set potentiometer, the servo
will move continuously in one direction if fed with short pulses and vice-versa.
If there are no pulses, the servo motor will stop. It is uses to move the Solar Tracker
Eastward and Westward. The pulses has its at normal TTL levels. The speed is not
greatly affected by the pulse repetition rate, as long as it is over about 30 per second.
These pulses can easily be provides by an output port of just about any computer, for
occurrence the data or control lines of a printer port or a serial port, or a easy addressed
latch added to the memory circuits.
1.10 Power Supply
The power supply of the solar tracker is also a considered when designing. They would
have to supply the power to the motor, sensor and the interface card. Although there are
some other electric power sources available, batteries is the best source for the Solar
Tracker.
To make sure the proper operation of all circuitry and their components, a voltage
regulation scheme must be employed for providing power.
The table 1.2 shows the comparison of the different type of batteries available.

16
Table 1.2 Comparisons of Batteries [Siew, H W 2008]
Battery Advantage Disadvantage
Alkaline
Alkaline batteries are popular for small
electronic devices. These batteries have
a high energy density. They are usually
quite inexpensive.
Alkaline batteries have high
internal resistance and it is
not possible to release
energy at a fast rate.
Alkaline batteries output
voltage continues to drop
linearly as the battery
discharges with a linear
slope.
Nickel
Cadmium
Nickel cadmium batteries represent the
majority of rechargeable batteries. The
internal resistance of nickel cadmium
batteries is small, making these
batteries efficient at fast discharging.
The capacity of the NiCd
batteries is recharged
without first completely
being discharged. NiCd
batteries also have a
relatively low energy-
density.
Nickel Metal
Hydride
Nickel Metal Hydride batteries have
twice the energy-density of NiCd
batteries. For the same size and same
mass, a NiMH battery stores twice the
amount of energy.
NiMH batteries lose their
charge faster than other
types of batteries. The also
cannot be stored for more
than days at a time.
Lithium-ion
Lithium-ion batteries are used in many
high end cordless and rechargeable
devices.
Although Li-ion batteries
seem very suitable for
robotics,Li-ion batteries are
not designed for continuous
high drain rate.

17
CHAPTER- 2
LITERATURE REVIEW
The literature review is categorized on the basis of
2.1 Performance
2.2 Design, Materials and economics
2.3 Application
2.1 Performance
Arasu, A V et al.(2006) concluded the performance of a new parabolic trough collector
hot water generation system with a well mixed hot water storage tank is investigated. The
storage tank water temperature is increased from 35 °C at 9.30 am to 73.84 °C at 4.00 pm
when no heat loss is occur from the storage tank. During the collection period the average
beam radiation is 699 W/m2. The useful heat gain, the collector instantaneous efficiency,
the energy absorb by the storage tank water and the efficiency of the system are varied
with respect to the beam radiation.
Figure 2.1 Variation of collector water temperature, Tfo ,with time

18
Figure 2.2 Variation of Useful Heat gain with intensity
Khlaichom, P et al.(2007) concluded the high-concentration solar requires the sun to be
tracked with great precision for maximum output voltage. This paper trend in solar
concentrator tracking system is to use an open-loop local controller that computes the
direction of the solar vector based on geographical location and time. But it is not
sufficient accuracy because it has error from computing the sun’s position, mechanical,
controller systems and installation. The genetic algorithms (GA) are one technique for
solving these problems. In this research, Genetic algorithm increases the accuracy of
solar tracking system by using wolf’s theory that receives maximum solar radiation, so
the system becomes on-line. The system will manage machine to positions of each
answer population from an initial set of accidental solutions and estimate by measure
voltage from sensor, then produce the next generation by using intersect operator,
mutation operator and selection. In the experimental, statistical method has a great for
finding the best parameters of GA. The experiment result shows that the performance
increases about 7.084% by using genetic algorithm.
Lorenzo, E et al.(2002) presented that Solar tracking is used in large grid-connected
photovoltaic plants to increase solar radiation collection for reducing the cost of delivered
electricity. Single vertical axis tracking, also called azimuth tracking has a capacity for
energy gains up to 40%, as compare with optimally tilted fully static arrays. This paper
examined the theoretical aspects associated with the design process of azimuth tracking,
by taking into account of shadowing between different trackers and back-tracking

19
features. Single, horizontal, North–South-oriented axis tracking system is associated with
flat-plate modules represent by far the most extended tracking solution in current PV
plants. Because of their intrinsic lack of shadowing in the North–South direction, single
tracking devices can be drive large surfaces and due to the horizontal axis position, wind
loads tend to be relatively low. It involves a particularly simple and strong mechanical
construction, which is a great advantage of this type of tracking.
Helwa, N H et al.(2007) has concluded that the output energy from any solar energy
system depends on the solar energy input to that system. Solar energy input depends on
the type of tracker, because every tracking system has distinct capacity of gaining the
solar radiation. A practical study was carried out on different solar tracking systems. The
layout of these systems consist of a fixed system facing south and tilted 400 a vertical-
axis tracker, a 60
tilted-axis tracker, and a two-axis tracker. All the trackers depend on the
microprocessor based controlled systems, and every system has photovoltaic arrays for
electric energy generation. The performance of the different systems is based on a
complete year input of solar radiation and the electric power output from them. The study
also consists of the effect of some operating parameters on the tracking operation. This
study showed that the collected solar energy as well as the electrical output energy of the
tracking solar systems is more than that of the stationary system. These gains of solar
radiations are higher in the case of the two-axis tracker and decrease gradually from the
vertical-axis tracker to the tilted-axis tracker. Some of the important and concluded lines
are given below:
The vertical axis tracker receives 18% more annual solar radiation as compare
with the fixed-tilt system and generates 21% more output power in 9 months.
Solar system tracking around a tilted-axis increases its annual solar radiation by
11% as compare with the fixed-tilt system, while the combination of the tilted-
axis tracker and the vertical axis tracker receives 57% more annual solar radiation
input and produces 31% more output than the fixed-tilt system.
Solar system movement around two perpendicular axes increases its radiation
received capacity by 30% over the fixed-tilt system.

20
The microprocessor solar trackers follow the sun in large range and show small
pointing error, but they require more care in installation of the reference position
sensors.
The system output is influenced by the effect of the tracking error. It depends on
several parameters, such as type of application (flat plate or concentrated), tilt
angle of the system plane, season, and time of day.
The tracking accuracy is directly proportional to the electrical power consumed
by the solar system.
Chicco, G et al.(2008) presented the performance of grid connected photovoltaic (PV)
systems with parallel-connected converters. This paper concentrates the two paths for
energy production. The first part concerns the evaluation of the energy production in
Sun-tracking configurations, comparing their performance according to fixed PV
systems. The second part is related to the harmonic characteristics of a number of
converters in PV plants of various sizes. The PV plants of different types (in fixed or
Sun-tracking configurations) are increasing diffusion and sizes (from a few kW to
several MW) with inverter connection to the grid are requiring detailed analyses
concerning their aggregation and the assessment of their performance. The Sun-tracking
configurations are capable to provide significant increase in the energy production over
fixed systems of equivalent characteristics, provided that the availability of the moving
parts can be guaranteed and that mutual shading conditions are avoided. The harmonic
and inter harmonic summation ratios have been used to represent the effect of harmonics
and inter harmonics of different orders to the assessment of the total current of the PV
aggregation. The use of a semi empirical approach for harmonic summation seems more
suitable than other statistical techniques in order to create a reference model for
evaluating the total current.
Stern, M et al.(2010) The overall goal of this PVMAT Phase 4A1 work effort by Utility
Power Group ("UPG") was to substantially reduce the total installed cost of utility-scale
grid connected photovoltaic ("PV") power systems. PV power systems generate
electricity via the direct conversion of sunlight into electrical energy and can serve as an
environmentally benign and domestically secure source of electricity for utility grid

21
connected peak or intermediate load applications. Considering that almost 700,000 mega
watts (MW) of electricity generating capacity exists in the United States alone, PV power
systems have only negligibly penetrated the electricity generation market. The dominant
factor limiting the use of PV power systems in grid-connected applications, today is the
capital cost of the total installed system with respect to the annual kilowatt-hours of
energy generated. The focus of UPG's work effort was on BOS component
manufacturing technology, which essentially involved all PV power system engineering,
manufacturing, assembly and construction tasks from the receipt of a PV module to the
delivery of grid-connected electricity. Working with Siemens Solar Industries
(Camarillo, California) to optimize the design of PV modules for power systems
applications, UPG's goal was to obtain and demonstrate significant cost reductions in the
installed cost of PV power systems. Single-axis solar tracking, which provides over 20%
more energy in a typical year than a fixed-axis PV system, was selected as the optimum
array configuration upon which the overall design was based.
Naidoo, P et al.(2002) conclude that tracking is particularly important in solar energy
collection systems that operate under concentrated sunlight. The aim of this research
paper is to test the solar-to-thermal energy efficiency of a tracking line-focus parabolic
trough solar collector (PTSC). This is determined by measuring the temperature rise of
water as it flows through the receiver of the collector when it is properly focused with the
sun. The thermal efficiency is a function of intercept factor in case of PTSC, which in
turn depends on the accuracy with which the collector follows the sun. Accurate control
of the collector is therefore crucial to the maximizing of a PTSC’s thermal efficiency.
Given the varying demands of different operating regimes required for proper operation
of the solar collector, different modes of control will form an integral part of the project
to optimize tracking accuracy and thereby thermal efficiency as well. In the fixed rate
control mode the variable speed drive is programmed to rotate the trough at a constant
rate based on the movement of the sun. In the PSA control mode an algorithm is defined
by means of mathematical formulae, generating a variable data signal to the drive based
on the position of the sun on the X, Y, Z axis. In both these modes position feedback is
not necessary but will be used for reference purposes and not necessarily for actual

22
control. However, in the fuzzy control mode the position detection, wind speed and the
fluid circulation temperature will be essential to determine the position of the trough.
Duarte, F et al.(2010) presented that there are actually several solutions for two axis
solar tracking systems using electromechanical devices, in which a controller detects the
Sun apparent position, and controls the position of the body supporting the panels toward
the sun by enabling the engines motion. This work, related to the solution of two axis
solar tracking system based on solar maps, which can find out the exact apparent position
of the Sun, by the latitude's place, thereby avoiding the need to use sensors or guidance
systems. To accomplish this, it is used a low-power microcontroller, with programming,
to control two electric motors to ensure that the panels supporting structure is always
oriented towards the sun. A two axis solar tracker system can increase the energy
conversion by 40%, being a suitable solution to increase the electrical energy output. It
seems that a major obstacle to its use is the cost, basically due to the price of the sensors
applied to detect the Sun apparent position, and to the control system (mainly with
PLCs). Studies concerning the Sun apparent movement concluded that it is possible to
predict the relative position of the Earth with accuracy and the place, day and every hour.
This position is described in solar maps, for each location (defined by the location's
latitude). Microcontrollers can be used in order to control the electric motors. Using the
microcontrollers with programmed solar maps for each location (latitude), and defining
the date and hour, it is possible to control the angular position of the electric motors drive
shafts. The aim of this work consists on the development of a two-axis electromechanical
system for sun tracking (detect Sun apparent position), based on solar maps data, with a
low energy consumption and lower final cost than the systems available on market.
Lee, C Y et al.(2009) The output power produced by high-concentration solar thermal
and photovoltaic systems is directly related to the amount of solar energy gained by the
system, and it is very necessary to track the sun’s position with a high degree of accuracy.
A lot of systems have been proposed to facilitate this task over the past 20 years. This
paper examine by providing a high level overview of the sun tracking system field and
then describes some of the more significant proposals for closed-loop and open-loop
types of sun tracking systems. Such systems are based on the design of the solar collector

23
to collect the sun’s energy and to convert it into either electrical power or thermal energy.
The paper contains many studies regarding the use of solar collectors to implement such
applications as light fixtures, window covering systems, cookers. In general, the power
developed in such applications depends fundamentally upon the amount of solar energy
captured by the collector, and thus the problem arises of developing tracking system
capable of following the trajectory of the sun throughout the course of the day on a year-
round basis has received significant coverage in the literature.
Alkilani, M M et al.(2011) designed a multi dimensional solar tracking system and
fabricated, The designed tracking system is very beneficial because the component used
in the system is nearby available with low cost. Moreover, it is not any requirement for
connection to the transmission and distribution lines and minimal need for maintenance
and monitoring. This paper is reported that the sun tracker (two dimensional) has
increased the overall efficiency of the solar installation by over 40%. Designed
simplicity, Low cost and material availability will make the designed tracking system
more effective and acceptable in the market. This tracking system is simple and easier
than any other tracking system with minimum cost because only simple sensor (LDR)
and driver circuit (OA) is used which is available with low in cost. This device does not
need auxiliary power and may adjust automatically depending on the direction of the sun.
With the designed sun tracker, it is possible to get substantially more power from each
PV panel on collector and this increase in power results with lower cost per watt.
Konar et al.(2011) A microprocessor-based automatic position control scheme has been
designed for controlling the azimuth angle of an optimally tilted photovoltaic flat type
solar panel or a cylindrical parabolic reflector to get the illuminating surface
appropriately positioned for the collection of maximum solar irradiance. The idea
presented results in considerable saving in power and is independent of the geographical
location of the site of erection or temporal variations in environmental parameters.
Efficient collection of maximum solar irradiance (MSI) on a flat plate type photovoltaic
solar panel [i] or a cylindrical parabolic solar reflector requires adjustments of two
parameters of the energy collecting surface namely the angle of azimuth, (Ψ) and the
angle of tilt( a) of the surface to be illuminated as shown in Fig. 2.3. As the elevation

24
angle of the sun remains almost invariant in a month and varies little (latitude 100) in a
year, there is no need for automatic adjustment of the tilt angle. A single axis position
control scheme is sufficient for the collection of MSI on a solar energy collector.
Figure 2.3 Solar geometry
Roth, P et al.(2003) concluded an electromechanical system to follow the position of the
sun was designed. It allows the automatic measurement of direct solar radiation with a
pyranometer. This operates automatically, guided by a closed loop servo system. The
position of the sun is sense with the help of photo detector and two small DC motors
move the instrument platform keeping the sun’s image at the center of the four-quadrant
photo detectors. In the cloudy season when the sun is not appear, the position of the sun
is calculate by a computing program and takes control of the movement, either the
detector can sense the sun again.
2.2 Design, materials and economics
Thomas, A et al.(1992) studied that design parameters of a PTC can be geometric and
functional. The geometric parameters of a PTC can be its aperture width and length, rim
angle, focal length, diameter of receiver etc. The functional parameter can be its
instantaneous efficiency, optical efficiency and overall thermal efficiency. These
parameters are mainly affected by properties of material and optical errors associated
with system. The instantaneous efficiency of a PTC can be calculated from an energy

25
balance on the receiver tube. The instantaneous efficiency of the system is defined as the
rate at which useful energy is delivered to the working fluid per unit aperture area divided
by the beam solar flux at the collector aperture plane.
Zeroual, A et al.(2007) presents an electronic sun-tracker system which uses electro-
optical sensors for sun finding and a microprocessor controller unit for data processing
and for control of the mechanical drive system. The system allows solar energy collectors
to follow the sun position for optimum efficiency. It has a modular type structure which
facilitates its application to different systems without great modifications. The electro sun
tracking system has been applied to control a water heating parabolic solar system for
domestic uses. A lot of parameters have been controlled for system security such as
pressure, temperature and wind velocity. The system has been experienced for a long
period in variable illumination. The results are shown that it operates satisfactorily with
high accuracy. All the limitations mentioned in both electro-optical and microprocessor
controllers have been corrected. This system combines the best characteristics of the two
previous trackers. As soon as the system is switched on, it automatically finds the
position of the sun and aligns itself with its control unit. It has the capability of adjusting
the position of the collector from end-of-day position to that for operation early the next
day; adjusting for intermittent clouds, and adjusting to a position where the collector can
best withstand very high winds without damages. It also enables system performance to
be analyzed.
Anderson, T N et al.(2008) presented the concern growing over the environment and
resource use has been greater emphasis placed on sustainability, particularly in the
growing environment. One of the important key points of sustainable urban environments
is the need for an increase in the densification of the population. It would have been
probable to have a photovoltaic array and solar water heater side-by-side for a free-
standing house hold, this may not be attainable in a high-density living situation. As a
counter point to this matter, the design of a novel combined photovoltaic for building
integration (BIPVT) solar collector is analyzed and discussed. The panel has a greater
efficiency per unit area, as compare to an array of photovoltaic panels in combination
with solar thermal panels. In addition of this panel can be used for integrating water

26
heating, electricity generation and facade elements it is possible to reduce the complexity
associated with traditional solar installations while also achieving an architecturally
responsive appearance. As such the BIPVT is preferably suited to environments where
frontage space with suitable solar access is limited, or where many numbers of people
share a single building.
Arasu, A V et al.(2007) described the design and manufacture of a smooth 90 rim angle
fiberglass reinforced parabolic trough for parabolic trough collector hot water generation
system by hand lay out method in this paper. The paper concluded the following points.
The design and manufacture of a smooth 90 rim angle fiber glass reinforced parabolic
trough for parabolic solar collector is presented. The cost of the fiber glass reinforced
parabolic trough is 48US$ per square meter of aperture area and the cost of the wooden
mould is 67US$.
Bakos, G C et al.(2000) observed that parabolic trough are the preferred type of a
collector used for steam generation due to their ability to work at high temperatures with
high efficiencies. The results formed from a simulation program, shows the variation of
collector’s efficiency as a function of the heat transfer fluid flux, pipe diameter and solar
radiation intensity and active area of the PTC, are presented. This paper concluded the
following points
1. When the flux of the heat transfer fluid is increasing, the efficiency is improving. Also
the efficiency drops as the pipe length is increased.
2. The efficiency increases as the pipe diameter is reduced. This result was expected
because the smaller diameter led to a greater solar radiation density on the active area of
the pipe.
3. The efficiency increases with the increase of the mirror’s active diameter and the
intensity of solar radiation respectively.
Almanza, R & Correa, G et al.(2000) with the aim of developing a parabolic trough
concentrator with first surface solar mirrors made over coated soda-lime glasses with
concave shape type geometry. In order to cover all the surface of the concentrator, whose

27
size measurement were 2.37m of aperture and this product works up to 8003C with a
minimum deformation when it has been set and hardened. In order to sag the coated
glasses, they were introduced in a furnace up to 6003C for about 2 h. Mirrors were made
by using sputtering technique with planar magnetron. The specular reflectance of the
mirrors was around 86%. The field test of focusing such a concentrator gave a size focus
of about 5.08 cm, where over 90% of reflected beam solar irradiance arrived on a
simulated pipe receiver with this diameter 1.14m long, 16 mirrors were built with sizes of
0.3 to 0.6m and they were put together like a mosaic set.
Saxena, A K et al.(2010) A microprocessor based solar Cracking controller is designed
and fabricated in addition to tracking the controller is capable acquiring photovoltaic and
meteorological data rrom a photovoltaic system and controlling battery / load. These
features are extremely useful in autonomous PV system installed in remote areas for
system control and monitoring. Solar tracking can be built in closed loop and open loop
modes and the controller can provide either 6 PWM data signals for 3 phase electricity,
50 Hz AC motor or 4 step signals for a stepper motor. The change in sun position is
monitored and the convertor is maintained normal to the incident radiation for optimum
performance.
Inspira, A et al.(2009) presents a novel sun tracking strategy for photovoltaic
concentrators. This can be integrated in the so called hybrid strategies, which built around
a calculated sun ephemeris core, add different types of error correcting routines to
compensate on the one hand for timing drifts, and on the other for self characterization
errors due to a faulty installation, assembly, or manufacturing, or in the time evolving
side those caused by stress bending or landslides, which ultimately blur the “picture” the
tracking control has of its tracker. Hybrid sun tracking strategies intend to combine the
best of both open-loop ephemeris computing, and closed loop sun pointing sensor based
controllers, while avoiding their problems. By using an open-loop sun primary
acquisition phase, hybrid controllers wake and stow at specified positions and times and
their effectiveness is immune to sunshine conditions or drifts in sensor calibration, thus
avoiding the problems in acquiring and locking onto the sun that occur with closed-loop
systems. By using a closed-loop error correction phase, hybrid controllers avoid the open-
28
loop controller problems of needing accurate alignment, assembly, and time information.
These error correction routines usually take as feedback signal the array’s power output
thus relying on the obvious equivalence between precise sun pointing and maximum
generation.
Comsit, M et al.(2007) presented the development of the solar radiation conversion
systems is focused mainly on aspects related to materials development and solar energy
conversion processes. In the design procedure of the solar trackers the input data is the
direct solar radiation that may be converted in thermal energy (by using solar collectors)
or electrical energy (by use of the photovoltaic panels). The competitiveness of the solar
energy conversion system on the market deals with their efficiency and an alternative
solution for improving their efficiency is the use of the tracking systems so called “solar
trackers”. According to the scientific literature of the system, by raising the incident
radiation rate with solar trackers, in order to maximize the direct degree of solar radiation
collection, the efficiency of the solar radiation system may be increased up to 50%.
2.3 Application
Kalogirou, S A et al.(2004) presented a survey of the various types of solar thermal
collectors and applications. Initially, an analysis of the environmental problems related to
the use of conventional sources of energy is presented and the benefits offered by
renewable energy systems are explained. The historical is based of the various types of
collectors including flat-plate, evacuated tube, compound parabolic, parabolic trough,
Fresnel lens based, parabolic dish type and heliostat field collectors. It is followed by an
optical, thermal and thermodynamic examination of the collectors and an explanation of
the methods used to evaluate their performance. The applications of the various types of
collectors are accessible in order to show the reader of extent in order of their
applicability. These contain solar water heating, which comprise thermo syphon,
integrated collector storage, air systems, direct and indirect systems, space heating and
cooling, which include, space heating, air and water systems and service hot water, and
heat pumps, refrigeration, industrial process heat, which include air and water systems
and steam generation systems, thermal power systems, which comprise the parabolic

29
trough, power tower type and dish systems based, solar furnaces, and chemistry
applications. It can be seen solar energy systems can be used for a wide range of
applications and provide significant benefits, therefore, they can be used whenever
possible.
Rubio, F R et al.(2007) The application of high concentration solar cells technology
allows a very significant increase in the quantity of energy collected by solar arrays per
unit area. Though, to make it possible, more severe specifications on the sun pointing
error are required. In fact, the presentation of solar cells with concentrators decreases
drastically if this error is greater than a small value. These provisions are not fulfilled by
simple tracking systems due to different sources of errors (e.g. small misalignments of
the structure with respect to geographical north) that appear in practice in small cost,
domestic applications. This paper presents a control application of a sun tracker that is
able to follow the sun with high accuracy without the necessity of either a precise
procedure of installation or recalibration. A hybrid type of tracking system that consists
of a combination of open loop tracking strategies based on solar movement models and
closed loop strategies using a dynamic feedback controller is presented. Energy saving
factors is taken into account, which implies among other factors, the sun is not tracked
with the same precision, to prevent energy overconsumption by the motors. Simulation
and experimental outcome with a low cost two axes solar tracker are exposed, included a
comparison between a classical open loop tracking strategy and the proposed hybrid one.
Scrivani, A et al.(2007) examined the concept of utilizing trough type solar
concentration plants for water production, remediation and waste water treatment. This
presented study is intended to find applications of the solar trough concentration
technology beyond heat and refrigeration. A number of possibilities have been identified
are related to clean water production by processes such as solar distillation, and waste
processing. The fresh water thus obtained can be used for human consumption, but the
free heat produced by trough plants makes for an easy way to obtain irrigation water from
waste, refuse and landfills. The possibility of obtaining refrigeration without the use of
electrical power opens up further possibilities for obtaining water, even from thin air. The
possibility of utilizing this water for irrigation is a concrete step in the favour of

30
agriculture in Mediterranean countries. The system is a low cost, no pollution, and
alternative to incineration.
Qiblawey, H M et al.(2007) describes several desalination technologies in commercial
and pilot stages of growth. The prime focus is on those technologies suitable for use in
remote areas, which could be integrated into solar thermal energy systems The use of
solar energy in thermal desalination processes is one of the most promising applications
of the renewable energies. Solar desalination can directly used solar energy to produce
distillate directly in the solar collector, or indirectly; combine conventional desalination
techniques, such as multistage flash desalination (MSF), vapor compression (VC),
reverse osmosis (RO), membrane distillation (MD) and electro-dialysis, for heat
generation. Direct solar desalination system compared with the indirect technologies
requires large land areas and has a relatively low productivity. It is though competitive to
the indirect desalination plants in small-scale production due to its relatively low cost and
simplicity.
Blake, D M & Kearney, D et al.(2002) established the development of a thermal storage
option and increasing the operating temperature for parabolic trough electric systems
could significantly reduce the level of electricity cost (LEC) as compared to the current
state of the art. Both improvements need a new heat transfer fluid if a direct storage
system is to be used. The properties of a fluid that can be used for both heat collection
and storage require a very low vapor pressure at the hot side operating temperature. This
requirement can almost certainly only be met by an ionic fluid. Further, the piping layout
of trough plants dictates that the fluid not be allowed to freeze which requires extensive
insulation and heat tracing unless the fluid has a freezing point <25°C. A recent study by
Kearney and associates under subcontract to Sun lab has explored the potential for use of
inorganic nitrate salts that freeze at about 120°C and documented the advantages of
storage and higher operating temperature. As part of that study, the LEC achievable if an
“ideal” fluid having the above properties was documented. It seems likely (but not
certain) at present that this ideal fluid will have to be found among organic rather than
inorganic salts. This paper summarizes the results of the first year of searching for heat

31
transfer and storage fluids in this new domain and identifies the key issues that must be
addressed in the development of a new fluid.
2.4 Literature summary and gap analysis
Table 2.1: Literature summary
Sr
No.
Author Area of research Contributions and applications of
research
1 Arasu, A V et
al.(2007)
Theoretical analysis of
PTC with hot water
generation
The modeling of a parabolic trough
collector with hot water
generation system with a well
mixed type storage tank using a
computer simulation program PV
power systems generate electricity
via the direct conversion of sunlight
into electrical energy and can serve
as an environment
2 Khlaichom, P
et al.(2007)
Optimization of Solar
Tracking System
based on genetic
algorithm
The current trend in solar
concentrator tracking system is to
use an open-loop local controller
that computes the direction of the
solar vector based on geographical
location and time. But it is not
enough accuracy because it has
error from computing the sun’s
position, mechanical, controller
systems and installation
3 Lorenzo, E et
al.(2002)
Design of Tracking
Photovoltaic Systems
with a Single Vertical
This paper examines the theoretical
aspects associated with the design
of azimuth type of tracking, taking

32
Axis into account shadowing between
different trackers and back-tracking
features. The practical design of this
trackers installed at the 1.4 MW
Tudela PV plant is accessible
4 Helwa, N H et
al.(2007)
Maximum Collectable
Solar Energy by
Different Solar
Tracking Systems
A practical study was carried out on
different solar tracking systems.
The layout of these systems are
facing south and tilted 400 a
vertical-axis tracker a 60
tilted-axis
tracker, and a double-axis tracker.
All the trackers are microprocessor
based and have photovoltaic arrays
for electric energy production
5 Chicco, G et
al.(2008)
Performance of Grid-
Connected Photo
voltaic Systems in
Fixed and Sun-
Tracking
Configurations
The focus of the paper is twofold.
The first one part concerns the
assessment of the energy
production and of the operational
characteristics of multiple
photovoltaic systems in Sun-
tracking configurations by
comparing their performance to the
one of the corresponding fixed PV
systems. The second part consisting
the harmonic characteristics of the
integration of several converters in
PV plants of various size
6 Stern, M et
al.(2010)
Development of a low
cost integrated 20 Kw
AC solar tracking sub-
array
PV power systems generate
electricity via the direct conversion
of sunlight into electrical energy
and can serve as an environmentally

33
benign and domestically secure
source of electricity for utility grid
connected peak or intermediate load
applications
7 Naidoo, P et
al.(2002)
Intelligent control &
tracking of a parabolic
trough solar collector
The aim of this research paper is to
test the solar-to-thermal energy
efficiency of a tracking line-focus
parabolic trough solar collector
8 Duarte, F et
al.(2010)
Two axis solar tracker
based on solar maps,
controlled by a low-
power Micro
controller
This work studies the solution of
two axis solar tracking system
based on solar maps, which can
forecast the exact apparent position
of the Sun, by the latitude's
location, thereby neglecting the
need to use sensors or guidance
systems
9 Lee, C Y et
al.(2009)
Thermal analysis of
PTSC
The monthly average collector
output at Darwin is almost steady
during the year. The collector
thermal loss when using synthetic
oil as the working fluid was found
to be higher than in the DSG
collector
10 Alkilani, M M
et al.(2009)
Performance of PTSC
Effects of glass cover, vacuum,
pressure drop, incident angle, flow
rate, and wind speed are calculated
11 Brogren, M et
al.(2007 )
Properties of
aluminum-polymer
laminated steel
reflector
The optical properties, durability,
and reflector performance is
calculated and most importantly the
cost-effectiveness of the reflector
12 Bartl, J et al. Effect of emissivity on Worked on the emissivity of Alloys

34
(2010)
the Surface
temperature of the
collector
of aluminium with magnesium and
silicon and found that they are
tough, have high electrical
conductivity, high emissivity, but
are still lower in comparison to
other metals
13
Gee, R et
al.(2007)
Reflector specularity
Studied the Impact of reflector
specularity on the optical
performance of parabolic trough
solar collectors. It is observed that
the Metalized polymer reflectors are
less specular than glass mirrors
14 Kalogirou, S
et al.( 2007)
Performance
prediction
by simulation
Experimental verification of the
PTC model and analysis of the
experimental results for hot water
production.
15 Scrivani, A
et al.(2009)
Parabolic Trough use
in different
applications
Waste water treatment, solar
distillation, refrigeration without
electrical power
2.5 Gap Finding
The work in the field of solar tracking system has been reported by various researcher for
increasing the heating temperature for a particular period and increasing the efficiency of
solar collector. But no work has been reported for the development of automatic solar
tracking of Design and analysis of automatic solar tracking system for parabolic trough
collector for hot water generation and improving its efficiency.

35
Objectives
To design and manufacturing of automatic solar tracking system for parabolic
trough collector for hot water generation.
To study the effect of solar tracking on the temperature gain and efficiency of the
automatic solar tracking system for parabolic trough collector for hot water
generation.

36
CHAPTER-3
METHODOLOGY OF THE WORK
3.1 Introduction
The present study aims at Design, Fabrication, Characterization, and Experimental
analysis of Automatic tracking system of prototype parabolic trough concentrator using
Glass Mirror as the reflective material. In the past work Glass Mirror has a high
reflectivity as compare to other materials like Stainless Steel, Aluminium Foil[Sanjay
2012]. So Glass Mirror is used as the reflective material in the purposed work. Different
observation has been carried out to obtain best suitable result of Parabolic Trough
Collector in terms of its improved efficiency. Generally the efficiency of a PTC is given
by
[Garg, H P & Prakash, J 1997]
(4.1)
Where FR = Heat removal factor
ɳ 0 = Optical efficiency
UL = Heat loss coefficient
CR = Concentration ratio
It can be realized that the efficiency of a PTC depends on the optical efficiency (ɳ 0) of
the reflective material. Glass mirror has a high optical efficiency as compare to other
material In the present work glass mirror is used for improving the optical efficiency of
the concentrator. In equation (4.1), FR, UC and ɳ 0 can be identified as the three major
design parameters which can be used to construct a three-parameter collector model for
the preliminary design of PTC.

37
In present study we are using Copper tube (bare and glazed) as an absorber tube with
Glass Mirror as an reflective material and different testing are carried out. By these
observations, we analyze the results obtained by experimental data and compared the
Manual, Automatic and Fixed Position sun tracking system in terms of their enhanced
efficiency for present prototype PTC. Best tracking system is that which gives the high
efficiency of prototype parabolic trough concentrator and is used for further practical
application like air heating, domestic water heating, steam generation etc.
Collection of experimental data for existing collector
Analysis of result with reflective material
Analysis of result with various parameter which effect its
efficiency
Design and selection of solar tracking system
Fabrication of solar tracking system
Experimental analysis for increase in efficiency and comparsion
of result
Refinement of result and corrective measures

38
Figure 3.1
CHAPTER-4
DESIGN AND FEBRICATION
4.1 Design of prototype parabolic trough concentrator
Parabolic trough collectors are structurally simpler than other types of collectors although
some form of tracking (we have used automatic tracking) must be employed and the
parabolic surface must be precise, to ensure efficiency. In order to be cost effective the
parabola of the PTC must be produced in such a way so as to be low priced and perfect
and in the construction of parabolic trough, we have no need of so much labour, its
construction are simple and or a mass production manufacturing process.
4.1.1 Design Parameters
The design parameter of a parabolic trough collector can be classified as geometric and
functional. The geometric parameters of a PTC consist of aperture width and length, focal
length, rim angle, diameter of the receiver, and diameter of the glass envelope.
The functional parameters of a PTC consist of its optical efficiency, instantaneous
efficiency and all day thermal efficiency and receiver thermal losses. These parameters
are largely affected by the absorptivity of the absorber. The errors are caused due to the
defects in reflective material, support structure, location of the PTC.
4.1.2. Design of prototype PTC using PARABOLA CALCULATOR 2.0
Initial specification for design of Parabolic Trough Concentrator is obtained by
considering parabolic equation: X2 =4aY
Where

39
Y=distance along vertical axis.
a=focal length.
X=distance along horizontal axis.
A parabola is obtained by using a parabola equation. By putting different Y values in the
equation, it gives different X values. In this way, different X,Y points are obtained and
finally get a parabolic shape at different x, y points. Another method for drawing the
parabola is the software named as “PARABOLA CALCULATOR 2.0” Which is easily
available on the internet. PARABOLA CALCULATOR 2.0 is shown below and data
obtained is given in Table 4.1 and 4.2. All dimensions are in feet (ft) as unit.
Figure 4.1 PARABOLA CALCULATOR 2.0
Table 4.1: Design parameters for prototype parabolic trough collector
PARAMERER DESIGN VALUE
Linear Diameter 04.59 ft
Diameter 04.00 ft
Depth 01.00 ft
Focal Length 01.00 ft
Volume 06.28 ft

40
Flength/Diam. 0.25 ft
Area 12.57 ft
Table 4.2: X and Y values for prototype parabolic trough collector
X–HORIZONTAL AXIS Y-VERTICAL AXIS
-2.00 1.00
-1.75 0.77
-1.50 0.56
-1.25 0.39
-1.00 0.25
-0.75 0.14
-0.50 0.06
-0.25 0.02
0.00 0.00
0.25 0.02
0.50 0.06
0.75 0.14
1.00 0.25
1.25 0.39
1.50 0.56
1.75 0.77
2.00 1.00
4.2 Fabrication of Prototype Parabolic Trough Concentrator
In present thesis work consideration of cost is essential because we have considered cost
analysis for best design and feasibility of proposed parabolic trough concentrator. Since
trough should be capable of withstanding different loads like wind load, stress loads etc,

41
so it should be rigid body in design. In present work, mild steel is used as material to
form a parabolic shape in prototype.
In the present work, a mild steel sheet is bent into parabola with a focus at 0.305m. The
sheet has linear diameter is 4.57 ft. and width of the sheet is 3 ft. ‘Parabolic calculator
2.0’ is very helpful for drawing the parabola. ‘Parabolic calculator 2.0’ requires the
diameter, depth, focal length, linear diameter. By filling these required columns, a
parabolic structure is generated. An automatic tracking system is fabricated at the axis of
the absorber tube. The receivers are a cylindrical copper pipe painted black with
appropriate black paint. The paint coat is kept as thin as possible so that there is
minimum resistance of flow of heat through the coat through the pipe and to the heat
transfer fluid. The collector is covered with a 2 mm thick glass cover.
To have a firm foundation we prepared a mild steel base as shown in following photos of
prototype PTC. Different Components of Prototype PTC are shown in given pictures
below:
4.2.1 Parabolic Trough reflective material
In the past work it may be found that glass mirror has a high reflectivity as compare to
stainless steel and aluminum foil[Sanjay 2012]. So in the present work glass mirror is
used as the reflective material.
4.2.2 Glass Mirror as concentrator

42
Figure 4.2 PTC with Glass Mirror
Glass mirror are pasted on the parabolic sheet with the help of silicon and double tape.
Glass mirrors are 25 in number with dimensions (5mm x 3ft). These mirror strips does
not affect the parabolic curve shape. The mirror stripes are used because they have a very
high reflectivity of 93%. The reflector made up of mirror stripes pasted on a metal sheet
is shown in figure 4.2.
4.2.3 Absorber Tube
A black painted copper tube is used as an absorber tube. Copper tube is covered by a
glass tube to reduce the conductive, convective and radiation losses. A copper tube has
4ft length and with inside and outside diameter of 27 & 28 mm is used and glass tube has
length 3 ft with inside and outside diameter is 64 & 66 mm.
Figure 4.3 Absorber tube
4.2.4 Storage Tank
A Storage Tank is a 15ltr capacity filled with water, and it is made up of steel. Water is
circulated through the storage tank from the copper tube with the help of a pump of
power 24W. When water is comes inside the copper tube from the storage tank. It takes
heat, and after that it supplies heat to the water inside the storage tank. The inlet and
A black painted copper tube
covered by a glass tube

43
outlet of the copper tube is from the storage tank. The storage tank is insulated with the
help of glass wool, and it is placed inside the box. Figure 4.4 shows the picture of storage
tank placed inside the card-board box.
Figure 4.4 Storage Tank insulated with Glass wool and packed in Box
4.2.5 Insulations
Glass wool insulation is on the storage tank which is inside the card-board box. Glass
wool insulation reduces the heat loss from the storage tank. Soflon insulation is covered
on the pipes. Which minimize the heat loss, when water is flowing through the pipes
from the inlet to the outlet via storage tank. These both insulation are easily available in
the air conditioner and refrigerator spare part shop. Figure 4.5 shows the picture of the
insulations on the storage tank and the pipes.
Glass Wool Insulation
inside the card-board
box box
Soflon Insulations on the
pipes

44
Figure 4.5 Insulation on the Storage tank and the Pipes
4.2.6 Support Structure
The support structure for the parabolic trough solar collector is made of mild steel. The
selection of mild steel as a material for the support structure because it fulfill the
drawback of wood which is used in the past work [Sanjay 2012]. The mild steel is cheap,
easy to maintain, and great rigidity, hardness and more flexible. All the parts of the base
are joined by welding. The support structure which is made up of mild steel is green
painted. The support structure is made in such a way that it can hold all type of load like
wind loads, stress loads etc. It is also designed so that it could not affect the shape of the
parabola and also to minimize the alignment error. The tracking system was joined on the
support structure.
Figure 4.6 Support Structure
4.3 Manual Tracking System
In the manual tracking system the parabolic trough is oriented in an east to west direction,
because sun is also moved from east to west direction. In this the parabola is rotated by
10 degrees after every 1 hour. In this an angular chart is made on the card-board. This
card-board is fixed to that edge which is in line with the focus of the parabola. The
Cast iron based
support structure

45
parabola is rotated with the help of a DC motor and a battery system. When the shadow
of the copper tube is at the centre of the parabola means it is on the focusing medium and
all mirror reflection fall on the copper tube, after that check the angle on the angular
chart, when the parabola is on the focusing medium.
Figure 4.7 Manual Tracking System
4.4 Automatic Tracking Mechanism
In the automatic tracking mechanism, we used two type of tracking system
1) Vertical tracking system
2) Horizontal tracking system
4.4.1 Automatic Vertical Tracking Mechanism
For getting the maximum solar intensity, a tracking system is used which track the sun in
all direction is known as tracking mechanism. Tracking system is either manually or
automatic. In present work automatic sun tracking system is used so that parabolic
concentrator automatically tracks the sun in all direction. In this DC motor (1500 rpm),
Sprocket type gear, and lead screw is used. The parabolic concentrator is hold by a rod
which helps the parabola to move easily in east-west directions. In the automation of the
parabola, one end of the lead screw is attached at the one side of the parabola, and the
other end of the lead screw is fixed with the motor shaft. The motor is enclosed inside the
metal box and a thrust bearing is fixed at the top of the metal box inside the motor shaft

46
to reduce the whole parabola weight on the motor. The base of the motor is fixed with the
U-clamp joint, this U-clamp joint is helpful for the motor to take any up and down
direction when the parabola is in the working condition. When the lead screw is tight
with the help of motor the parabola take the downward direction and when the lead screw
is loose, the parabola takes the upward direction. In this way it track the up and down
movement of the sun.
Figure 4.8 Automatic Vertical Tracking Mechanism
4.4.2 Automatic Horizontal Tracking Mechanism
In the horizontal tracking system whole body is rotated in the horizontal direction around
a shaft which is fixed to the ground with the help of the base plate. The whole structure is
rotated 360° around the shaft, and the four wheels are mounted to the base of the
structure. These four wheels drives the whole structure around a centre shaft when the
motor is in the working condition. In this a shaft of 42 mm diameter and 185 mm length
is used. By machining a UC bearing of size 35 mm is fitted inside the shaft. The upper
edge of the UC bearing is fixed to the sprocket, which has 1.5 ft diameter and 110 teeth
are cut. This big sprocket is fixed to the frame with the help of nut and bolt. A DC Motor
(1500 rpm) is fixed to the mechanism which is welded at the base plate. A small sprocket
Lead Screw
A DC motor enclosed in
the metal box
U clamp Joint
Input from motor
Change in angle of
trough as output
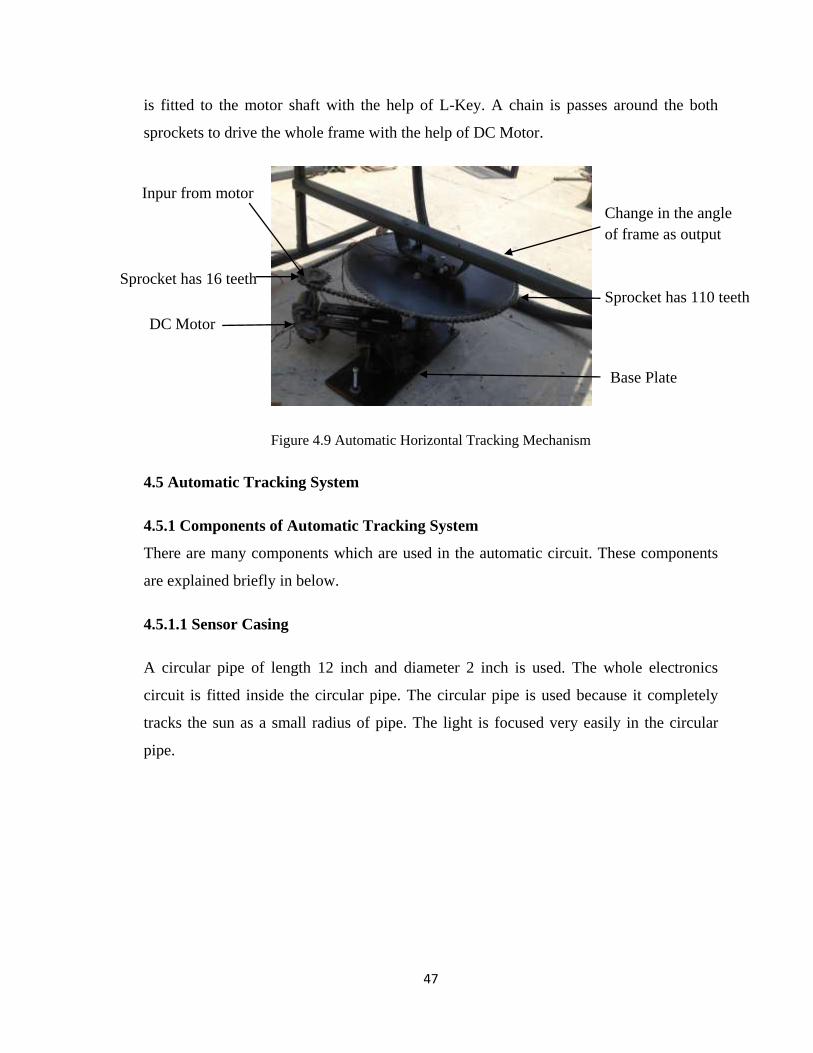
47
is fitted to the motor shaft with the help of L-Key. A chain is passes around the both
sprockets to drive the whole frame with the help of DC Motor.
Figure 4.9 Automatic Horizontal Tracking Mechanism
4.5 Automatic Tracking System
4.5.1 Components of Automatic Tracking System
There are many components which are used in the automatic circuit. These components
are explained briefly in below.
4.5.1.1 Sensor Casing
A circular pipe of length 12 inch and diameter 2 inch is used. The whole electronics
circuit is fitted inside the circular pipe. The circular pipe is used because it completely
tracks the sun as a small radius of pipe. The light is focused very easily in the circular
pipe.
DC Motor
Base Plate
Sprocket has 110 teeth
Sprocket has 16 teeth
Change in the angle
of frame as output
Inpur from motor

48
Figure 4.10 Circular Pipe
4.5.1.2 Lenses
Two convex lenses which have 2 inch circular diameter and 6 inch focal length are used.
When solar light passes through the slits, it falls on the convex lenses. The convex lenses
focus the light on the LDR.
Figure 4.11 Convex Lens
4.5.1.3 Light Dependent Resistors (LDR)
A Light dependent resistor is a light sensing device which is used in the electronics
circuit to detect basic changes in light level. It is also called as photo resistor.
When light falls on the light dependent resistor, the resistance value changes depending
on the amount of light falling on it, and the whole circuit is in the working condition,
Circular pipe
Convex
Lens

49
Figure 4.12 Light Dependent Resistors (LDR)
4.5.1.4 Transistor 2N2222
The Transistor 2N2222 is one of good and commonly used transistor, which has
numerous switching applications in electronics circuit. The main advantage of this
transistor is that it manages a high magnitude of currents as compare to other small signal
type of transistor. Its capacity to switch 800 mA of current through it. It will be activated
when sun light falls on the LDR.
Figure 4.13 Transistor 2N2222
4.5.1.5 Variable Resistance
It is used to change the resistance from 0 to 100K. The value of voltage can be adjusted
with the help of variable resistance as per requirement.
Light Dependent
Resistor
Transistor 2N2222

50
Figure 4.14 Variable Resistance
4.5.1.6 Relay
Relay is a electric switch used to change the direction of the current. When relay switch
is ON, the current passes through it and the motor moves in one direction and when relay
switch is OFF, it restrict to flow of the current, and the motor is in the stop position.
Figure 4.15 Relay
4.5.2 Circuit diagram of Automatic Tracking System
Variable Resistance
Relay

51
Figure 4.16 Circuit diagram
When light falls on the light dependent resistor (LDR) the resistance value changes
depending on the amount of light falling on it.
When the resistance value approaches ‘0’ the transistor 2N2222 is activated and it
switches ON the relay.
Depending on which light dependent resistor (LDR) is switches ON, the corresponding
relay is switched ON.
Due to the connection of the relay the voltage to the motor gets reversed and the motor
will turn in either direction.
4.5.3 Assembled view of the Electronics components

52
Figure 4.17 Assembly of all parts
All the components of the electronics circuit are assembled as shown in the figure 4.17.
The electronics component is assembled on the printed circuit board (PCB). In the
assembly, lens are fitted at the centre of the pipe, and the electronics circuit are fitted in
such a way that when light passes through the slit and strike on the lens, the focus of the
lens is on the light dependent resistor (LDR). A small gap is provided in the pipe to check
the focus of the lens, and after the assembly of all parts pipes are fitted with each other.
4.5.4 Working principle of Automatic Parabolic Trough Concentrator

53
Figure 4.18 Automatic Parabolic Trough Concentrator
The electronics circuits are fitted with the parabolic trough as shown in the Figure 4.18.
Two electronics circuit are used which is fitted in the circular pipe. One circuit is used to
control the base movement of the concentrator, and other is used to control the movement
of the parabola. The slit are cut in such a way that the light after passing into the lens
falling on the LDR. In the control of the horizontal movement, the slit are cut vertically
and in the control of the vertical movement the slit are cut horizontally. When light
passes through the vertical slit, it strikes on the lens and focus of the lens is in between
the two LDR. At that stage motor is in the stop condition, and parabola is in the focusing
medium. When sun changes his direction, the focusing of the light in between the two
LDR is disturbed, and the focusing light is going in the direction of any one LDR. The
motor starts working when the focusing light is any one of the LDR, and it takes the
sunlight in other direction that means in between the two LDR. So in this way both
movement of the parabolic trough concentrators are controlled.
4.6 Temperature and Solar Intensity Measuring Instruments
There are some instruments which are used to measure the temperature of working fluid
and the solar intensity. These are:
4.6.1 Lux Meter
A lux meter is used to measure the solar radiation coming from the sun. In the lux meter
it has a small display which shows the amount of solar radiation, and one sensing part,
which sense the solar radiation and shows on the display. A lux meter which is used in
the experiment is shown in the figure 4.10.

54
Figure 4.19 Lux Meter
4.5.2 Thermometer
Figure 4.20 Thermometer
A Thermometer is used to measure the temperature of hot water inside the storage tank.
The range of thermometer is -10 to 110 . A red line tells the temperature of water.
When the thermometer is put inside the water, the red line raises and stop to that scale
point which the water attain the temperature. The picture of thermometer is shown in the
figure 4.11.
Table 4.3: Parabolic trough Collector specification
ITEMS VALUE
Collector Length 1.20 m
Thermometer

55
Collector breath 0.91 m
Aperture area 1.098
Rim angle 90°
Receiver inside diameter 0.027 m
Glass envelope inside diameter 0.064 m
Receiver outside diameter 0.028 m
Glass envelope outside diameter 0.066 m
Concentration ratio 11.30
Focal distance 0.30 m
Water flow rate 0.083 kg/s
Storage tank capacity 15 lt
Tank material Stainless steel
Tank insulation material Glass wool
Water pump 25 W
Insulation on the pipes Soflon
CHAPTER-5
EXPERIMENTAL ANALYSIS
5.1 General

56
The performance of parabolic trough collector depends on the system efficiency,
instantaneous efficiency and overall thermal efficiency. These efficiencies are obtained
by different collections of the storage tank water temperature ( ), ambient temperature
( ) and collector water outlet temperature ( ). The values of different temperature are
recorded by a thermometer as shown in the figure 5.1.
Fig. 5.1 Line diagram of PTC with thermometer
The useful energy collected per unit time in a solar collector system employing solar
concentrators may be written as:
[Garg, H P & Prakash, J 1997] (5.1)
It may also be written as
[Garg, H P & Prakash, J 1997]
(5.2)
The heat removel factor may be written as
[Garg, H P & Prakash, J 1997]
(5.3)

57
By subtracting equation (1) to (3),
(5.4)
By solving it gives
(5.5)
5.2 Design analysis
The design analysis of parabolic trough collector depends on the instantaneous efficiency.
And the instantaneous efficiency is calculated from an energy balance on the receiver
tube. The instantaneous efficiency is defined as the rate at which useful energy is
delivered to the working fluid per unit aperture area ( divided by the beam solar flux
( at the collector aperture plane.
= [Garg, H P & Prakash, J 1997] (5.6)
In equation (5.6) , and are the three major design parameters which can be
used to construct a three-parameter design model for the design of parabolic trough
collector.
The optical analysis of the collector can be linked from the thermal analysis, if we
assumed that the optical properties of the materials are temperature independent. Hence
the optical efficiency can be made and analyzed independently without knowledge of
the thermal design and vice versa.
5.3 Optical analysis

58
The optical efficiency can be written as
[Garg, H P & Prakash, J 1997] (5.7)
Where
= average specular reflectance of the reflective surface
= effective transmittance-absorptance factor
= angle of the incidence of the sun’s rays on the collector aperture measured
from the normal to the collector
= instantaneous intercept factor which may defined as the fraction of the rays
incident on the aperture that reach the receiver for a given incidence ( )
In the equation (5.7) the optical efficiency varies with the incoming radiation and the
angle of incidence between the aperture surfaces normal. The optical efficiency decreases
with increasing incidence angle and intercept factor also decreases with incidence angle.
Many factors besides play a great role for decreasing the optical efficiency. These
factors include the incident angular dependence of glazing transmittance and absorber
absorptance.
5.4 Thermal analysis
The primary function of the absorber tube for a parabolic trough collector is to absorb the
energy and then transfer this energy to the fluid which passes among the tube. In this
process, the absorber will be heated when its temperature is higher than that of the
atmosphere temperature. For example, depending on the temperature requirements of the
application, operating temperature as high as 300 can be attained at the absorbing
surface of the receiver during operation. So there is a temperature difference between the
absorbing surface and the surrounding will result some of the collected energy is
transferred to the surroundings. The information of the heat loss from the receiver is
important for find out the performance of parabolic trough collector and hence designing

59
Heat is transferred in the following steps:
(1) First heat is transfer from the glass mirror to the absorber tube.
(2) After that heat is transfer from the absorber tube to the working fluid.
(3) Heat exchange between the glass jacket and the surrounding.
5.5 Calculation for performance analysis in Automatic Tracking System
A prototype parabolic trough collector is placed in Thapar University Patiala. Tracking
mode is such that it can track in all directions (Automatic Tracking) for hot water
generation. The concentrator has aperture area of 1.035 m2, and length is 1.20 m, and the
absorber tube has inner diameter is 27 mm, and outer diameter is 28 mm. and the glass
tube which is covered on the copper tube has inner diameter is 64 mm and outer diameter
is 66 mm. The other design parameter values is given in table 5.1.
TABLE 5.1 Values of other design parameter of concentrators
Specular reflectivity of the concentrated surface 0.93
Absorptivity of the absorber tube( ) 0.90
Glass cover transmitivity for solar radiation 0.88
Intercept factor( ) 0.95
Date 24 June, 2013
Time 12-01pm
906
Ambient temperature 35
Mass flow rate of water 0.083
Outlet temperature 85
(1) The absorbed flux(S) is given by
S= (5.8)

60
S=878.[.95*.93*.90*.88]
614.36W/m2
(2) Convective heat transfer coefficient
Properties will be taken at a mean fluid temperature of 64.5 .
Thus = 1000
= 4.2KJ/kg
ν = 0.439
k = 0.654W/m-K
Average Velocity V = = = 0.026m/s
Reynolds number = = = 3790.43
Prandt’l number = = = 2.81
Nusselt number = 0.023
= 0.023 (where n=0.4 for heating)
= 25.36
Therefore =
= 24.60 = 259.14W/m2K
(3) Collector heat removal factor and overall loss coefficient

61
Assume = 13.28W/m2K, so the collection efficiency factor
F’ =
=
= 0.94
So = = 105.5
Therefore heat removal factor
=105.5
=105.10
(4) Concentration ratio
C = =
(
=
=
= 9.66

62
(5) Optical efficiency
= where
=
= 0.93
= 0.706 or 70.6%
(6) The useful heat gain rate
= 113.75W
(7) Instantaneous efficiency
(rb = 1) (5.9)
= 7.27%
(8) Thermal Efficiency of system(per hour)
Taking,
Mass of water (
Specific heat of water ( 4.2KJ/kg-K
Efficiency ( ) = (5.10)
=

63
= 12.51%
(9) Overall thermal efficiency (average)
Taking,
Mass of water (
Specific heat of water ( 4.2KJ/kg-K
Time duration (t)=4 hours(9am-12pm)
Aperture area ( )=1.387m2
Efficiency( ) = (5.11)
=
= 27.45%
5.6 Experimental study of Glass Mirror with bare copper tube by using Manual
tracking Mechanism
Reflective material = Glass Mirror
Reflectivity of Glass = 0.93
Absorber Tube = Copper Tube

64
Diameter of Copper Tube = 28 mm
Area = 1.1163 m2
Table 5.2: Temperature variation of Glass Mirror by taking Intensity (Bare Tube)
TIME
(Hour)
INTENSITY
Ib (W/m2)
TEMP. OUT
°C
TEMP. IN
°C
ANGLE
(degree)
09-10 520 47 34 140-130
10-11 728 56.5 47 130-120
11-12 918 63 56.5 120-110
12-01 896 68.5 63 110-100
01-02 775 68 68.5 100-90
02-03 650 67 68 90-80
03-04 512 65.5 67 80-70
04-05 436 62.5 65.5 60-50
05-06 320 59.0 62.5 40-30
The above reading has been taken on 18 May, 2013, day is normal at morning, noon and
evening.
The above table shows the variation of solar intensity and the collector water outlet
temperature. The collector water outlet temperature varies with respect to solar intensity.
The water is recirculated from the storage tank and it passes through the copper tube and
acquires the heat, and then this heat is transferred to the storage tank and thus the
temperature of the storage tank rises. At that day 18 May, the ambient temp of water is
34 at 9.00am and it reaches his maximum level of 68.5 at 1.00pm and after 1.00pm
the water temperature start dicreases. And no energy is retreat during the collection
period. During this process the flow rate of water through the collector is 0.083 kgps. At
any moment, the collector water temperature has been greater than that of storage tank
water temperature.
Table 5.3: Performance data in glass mirror concentrator (Bare tube) by using Manual
Tracking Mechanism

65
Useful heat gain
(W)
Instantaneous
efficiency/ )
System efficiency
Overall thermal
efficiency
227.5 22.10 40.69
166.25 12.27 20.45
113.75 6.95 11.10
96.25 5.34 9.62 17.66
Figure 5.2 Variation of collector water temperature outlet temperature, , and beam radiation I
with time
Figure 5.2 shows the variation of collector water outlet temperature, , and beam
radiation I with time on one day, viz. 18 May, 2013. The collector water outlet
temperature increases progressively with time, which varies from 9.00 am to 6.00 pm,
and the solar intensity also varies with time.
0 100 200 300 400 500 600 700 800 900 1000
0
10
20
30
40
50
60
70
80
9 10 11 12 1 2 3 4 5
INTE
NSI
TY(W
/m²)
TEM
PER
ATU
RE
TIME(HOUR)
TEMPERATURE INTENSITY

66
Figure 5.3 Variation of useful heat gain, , and beam radiation, I, with time
The variation of useful heat gain, , and beam radiation, I, with time is shown in the
figure 5.3. It is seen that a smooth variation of beam radiation, and attain maximum
temperature (918) around noon. The useful heat gain first increases from morning, and
reach a peak value, and after then start decreases. This is due to the fact that the useful
heat gain is strongly influenced by the solar radiation and follows its path, mean all
variation dependants on solar radiation.
The collector instantaneous efficiency is calculated by using equation (5.9). it will be
found that the general pattern of variation of efficiency over a day is same as that of the
useful heat gain because the value of efficiency depends on both the incident beam
radiation and the useful heat gain.
Figure 5.4 shows the variation of the thermal efficiency, and intensity with respect to
time. The Thermal efficiency decreases with time and solar intensity increases. The
hourly system efficiency (thermal efficiency) decreases per hour as useful heat gain
decreases continuously.
0 100 200 300 400 500 600 700 800 900 1000
0
50
100
150
200
250
10 11 12 1
INTE
NSI
TY
USE
FUL
HEA
T G
AIN
(W)
TIME(HOUR)
USEFUL HEAT GAIN INTENSITY

67
Figure 5.4 Variation of Thermal Efficiency and intensity with time
0
200
400
600
800
1000
0
10
20
30
40
50
10 11 12 1
INT
ENSI
TY(W
/m²)
THER
MA
L EF
FIC
IEN
CY
TIME(HOUR)
THERMAL EFFICIENCY INTENSITY

68
5.7 Experimental study of Glass Mirror with Glazed copper tube by using Manual
tracking system
Reflective material = Glass Mirror
Reflectivity of Glass = 0.93
Absorber Tube = Copper Tube
Diameter of Copper Tube = 28 mm
Glazing material = Glass tube
Glass tube diameter = 66mm
Area = 1.035 m2
Table 5.4: Temperature variation of Glass Mirror by taking Intensity (Glazed Tube)
TIME
(Hour)
INTENSITY
Ib (W/m2)
TEMP. OUT
°C
TEMP. IN
°C
ANGLE
(degree)
09-10 523 48.5 34 140-130
10-11 740 59.5 48.5 130-120
11-12 925 69 59.5 120-110
12-01 890 75 69 110-100
01-02 780 74.5 75 100-90
02-03 675 73 74.5 90-80
03-04 525 71.5 73 80-70
04-05 410 69 71.5 60-50
05-06 290 66 69 40-30
The above reading has been taken on 19 May, 2013, day is normal at morning, noon and
evening.
Glazed means a glass tube is fitted around the copper tube to prevent the conduction
convection and radiation losses. The above table shows the variation of solar intensity
and the collector water outlet temperature. The collector water outlet temperature varies
with respect to solar intensity. The water is recirculated from the storage tank and it
passes through the copper tube and acquires the heat, and then this heat is transferred to

69
the storage tank and thus the temperature of the storage tank rises. At that day 19 May,
the ambient temp of water is 34 at 9.00am and it reaches his maximum level of 75 at
1.00pm and after 1.00pm the water temperature start decreases. And no energy is retreat
during the collection period. During this process the flow rate of water through the
collector is 0.083kgps. At any moment, the collector water temperature has been greater
than that of storage tank water temperature.
Table 5.5: Performance data in glass mirror concentrator (Glazed tube) by using Manual
Tracking Mechanism
Useful heat gain
(W)
Instantaneous
efficiency/ )
System efficiency
Overall thermal
efficiency
253.75 24.41 46.87
192.5 13.37 25.13
166.25 7.59 17.36
105.00 6.09 11.39 22.52
Figure 5.5 Variation of collector water temperature outlet temperature, , and beam radiation I
with time
0 100 200 300 400 500 600 700 800 900 1000
0
10
20
30
40
50
60
70
80
9 10 11 12 1 2 3 4 5
INTE
NSI
TY(W
/m²)
TEM
PER
ATU
RE
TIME(HOUR)
TEMPERATURE INTENSITY

70
Figure 5.5 shows the variation of collector water outlet temperature, , and beam
radiation I with time on one day, viz. 19 May, 2013. The collector water outlet
temperature increases progressively with time, which varies from 9.00 am to 6.00 pm,
and the solar intensity also varies with time.
Figure 5.6 Variation of useful heat gain, , and beam radiation, I, with time
The variation of useful heat gain, , and beam radiation, I, with time is shown in the
figure 5.6. It is seen that a smooth variation of beam radiation, and attain maximum
temperature (925) around noon. The useful heat gain first increase from morning, and
reach a peak value, and after then start decreases. This is due to the fact that the useful
heat gain is strongly influenced by the solar radiation and follows its path, mean all
variation dependants on solar radiation.
The collector instantaneous efficiency is calculated by using equation (5.9). it will be
found that the general pattern of variation of efficiency over a day is same as that of the
useful heat gain because the value of efficiency depends on both the incident beam
radiation and the useful heat gain.
Figure 5.7 shows the variation of the thermal efficiency, and intensity with respect to
time. The Thermal efficiency decreases with time and solar intensity increases. The
hourly system efficiency (thermal efficiency) decreases per hour as useful heat gain
decreases continuously.
0
200
400
600
800
1000
0
50
100
150
200
250
300
10 11 12 1
INTE
NSI
TY(W
/m²)
USE
FUL
HEA
T G
AIN
TIME(HOUR)
USEFUL HEAT GAIN INTENSITY

71
Figure 5.7 Variation of Thermal Efficiency and intensity with time
Concluded Points
1) The maximum temperature rise in bare tube is 68.5 and glazed tube is 75 So
Glazed tube gives more temperature rise in comparison to bare tube.
2) Useful heat gain per hour is more in glazed tube as compare to bare tube. The
maximum useful heat gain per hour in glazed tube is 253.75 at morning time.
3) Glazed tube gives more instantaneous efficiency as fewer losses are encountered.
The maximum instantaneous efficiency in glazed tube is 24.41%.
4) The maximum thermal efficiency in bare tube is 40.69% and glazed tube is
46.87% as shown in the graph.
5) Overall system efficiency of glazed tube is 4.86% more as compare to bare tube.
0
200
400
600
800
1000
0
10
20
30
40
50
10 11 12 1
INTE
NSI
TY(W
/m²)
THER
MA
L EF
FIC
IEN
CY
TIME(HOUR)
THERMAL EFFICIENCY INTENSITY

72
5.8 Experimental study of Glass Mirror with bare copper tube when the parabola is
standing at fixed position
In this experimental reading, Parabola is standing at that position when the sun gives
more radiation. During performing manual reading it was found that the sun gives more
radiation in between 11 am to 12 am at an angle 120-110.
Reflective material = Glass Mirror
Reflectivity of Glass = 0.93
Absorber Tube = Copper Tube
Diameter of Copper Tube = 28 mm
Area = 1.1163 m2
Table 5.6: Temperature variation of Glass Mirror by taking Intensity (bare Tube)
TIME
(Hour)
INTENSITY
Ib (W/m2)
TEMP. OUT
°C
TEMP. IN
°C
ANGLE
(degree)
09-10 510 37.5 34.0 120-110
10-11 685 40.5 37.5 120-110
11-12 790 46.5 40.5 120-110
12-01 703 50.5 46.5 120-110
01-02 675 50.0 50.5 120-110
02-03 605 49.0 50.0 120-110
03-04 525 47.5 49.0 120-110
04-05 460 45.5 47.5 120-110
05-06 320 42.5 45.5 120-110
The above reading has been taken on 23 May, 2013, day is normal at morning, noon and
evening.
The above table shows the variation of solar intensity and the collector water outlet
temperature. The collector water outlet temperature varies with respect to solar intensity.
The water is recirculated from the storage tank and it passes through the copper tube and

73
acquires the heat, and then this heat is transferred to the storage tank and thus the
temperature of the storage tank rises. At that day 23 May, the ambient temp of water is
34 at 9.00am and it reaches his maximum level of 50.5 at 1.00pm and after 1.00pm
the water temperature start dcreases. And no energy is retreat during the collection
period. During this process the flow rate of water through the collector is 0.083kgps. At
any moment, the collector water temperature has been greater than that of storage tank
water temperature.
Table 5.7: Performance data in glass mirror concentrator (Bare tube) by using Fixed
Position Tracking Mechanism
Useful heat gain
(W)
Instantaneous
efficiency/ )
System efficiency
Overall thermal
efficiency
61.25 7.51 10.75
52.50 4.66 6.86
105.00 8.08 11.90
70.00 6.81 8.92 9.62
Figure 5.8 Variation of collector water temperature outlet temperature, , and beam radiation I
with time
Figure 5.8 shows the variation of collector water outlet temperature, , and beam
radiation I with time on one day, viz. 23 May, 2013. The collector water outlet
0
200
400
600
800
1000
0
10
20
30
40
50
60
9 10 11 12 1 2 3 4 5
INTE
NSI
TY(W
/m²)
TEM
PER
ATU
RE
TIME(HOUR)
TEMPERATURE INTENSITY

74
temperature increases progressively with time, which varies from 9.00 am to 6.00 pm,
and the solar intensity also varies with time.
Figure 5.9 Variation of useful heat gain, , and beam radiation, I, with time
The variation of useful heat gain, , and beam radiation, I, with time is shown in the
figure 5.9. It is seen that a smooth variation of beam radiation, and attain maximum
temperature (790) around noon. The useful heat gain first increases from morning, and
reach a peak value, and after then start decreases. It also start increases around 11 am to
12 am, when the parabola is at focusing medium. This is due to the fact that the useful
heat gain is strongly influenced by the solar radiation and follows its path, mean all
variation dependants on solar radiation.
The collector instantaneous efficiency is calculated by using equation (5.9). it will be
found that the general pattern of variation of efficiency over a day is same as that of the
useful heat gain because the value of efficiency depends on both the incident beam
radiation and the useful heat gain.
Figure 5.10 shows the variation of the thermal efficiency, and intensity with respect to
time. The Thermal efficiency first increases from morning, and reach a peak value, and
after then start decreases. It also starts increases around 11 am to 12 am, when the
parabola is at focusing medium. The hourly system efficiency (thermal efficiency)
decreases per hour as useful heat gain decreases continuously.
0 100 200 300 400 500 600 700 800 900
0
20
40
60
80
100
120
10 11 12 1
INTE
NSI
TY(W
/m²)
USE
FUL
HEA
T G
AIN
TIME(HOUR)
USEFUL HEAT GAIN INTENSITY

75
Figure 5.10 Variation of Thermal Efficiency and intensity with time
0 100 200 300 400 500 600 700 800 900
0
2
4
6
8
10
12
14
10 11 12 1
INTE
NSI
TY(W
/m²)
THER
MA
L EF
FIC
IEN
CY
TIME(HOUR)
THERMAL EFFICIENCY INTENSITY

76
5.9 Experimental study of Glass Mirror with Glazed copper tube when the parabola
is standing at fixed position
In this experimental reading, Parabola is standing at that position when the sun gives
more radiation. During performing manual reading it was found that the sun gives more
radiation in between 11 am to 12 am at an angle 120-110.
Reflective material = Glass Mirror
Reflectivity of Glass = 0.93
Absorber Tube = Copper Tube
Diameter of Copper Tube = 28 mm
Glazing material = Glass tube
Glass tube diameter = 66mm
Area = 1.035 m2
Table 5.8: Temperature variation of Glass Mirror by taking Intensity (Glazed Tube)
TIME
(Hour)
INTENSITY
Ib (W/m2)
TEMP. OUT
°C
TEMP. IN
°C
ANGLE
(degree)
09-10 525 39.0 34.0 120-110
10-11 706 42.5 39.0 120-110
11-12 810 50.5 42.5 120-110
12-01 776 56.0 50.5 120-110
01-02 683 55.5 56.0 120-110
02-03 602 54.0 55.5 120-110
03-04 523 52.5 54.0 120-110
04-05 472 50.5 52.5 120-110
05-06 332 47.0 50.5 120-110
The above reading has been taken on 24 May, 2013, day is normal at morning, noon and
evening.

77
Glazed means a glass tube is fitted around the copper tube to prevent the conduction
convection and radiation losses. The above table shows the variation of solar intensity
and the collector water outlet temperature. The collector water outlet temperature varies
with respect to solar intensity. The water is recirculated from the storage tank and it
passes through the copper tube and acquires the heat, and then this heat is transferred to
the storage tank and thus the temperature of the storage tank rises. At that day 24 May,
the ambient temp of water is 34 at 9.00am and it reaches his maximum level of 56 at
1.00pm and after 1.00pm the water temperature start decreases. And no energy is retreat
during the collection period. During this process the flow rate of water through the
collector is 0.083 kgps.
Table 5.9: Performance data in glass mirror concentrator(Glazed tube) by using Fixed
Position Tracking Mechanism
Useful heat gain
(W)
Instantaneous
efficiency/ )
System efficiency
Overall thermal
efficiency
87.50 9.12 16.10
61.25 4.97 8.38
140.0 8.67 16.69
96.25 7.40 11.98 13.20
Figure 5.11 Variation of collector water temperature outlet temperature, , and beam radiation
I with time
0
200
400
600
800
1000
0 10 20 30 40 50 60
9 10 11 12 1 2 3 4 5
INTE
NSI
TY(W
/m²)
TEM
PER
ATU
RE
TIME(HOUR)
TEMPERATURE INTENSITY

78
Figure 5.11 shows the variation of collector water outlet temperature, , and beam
radiation I with time on one day, viz. 24 May, 2013. The collector water outlet
temperature increases progressively with time, which varies from 9.00 am to 6.00 pm,
and the solar intensity also varies with time.
Figure 5.12 Variation of useful heat gain, , and beam radiation, I, with time
The variation of useful heat gain, , and beam radiation, I, with time is shown in the
figure 5.12. It is seen that a smooth variation of beam radiation, and attain maximum
temperature (776) around noon. The useful heat gain first increases from morning, and
reach a peak value, and after then start decreases. It also start increases around 11 am to
12 am, when the parabola is at focusing medium. This is due to the fact that the useful
heat gain is strongly influenced by the solar radiation and follows its path, mean all
variation dependants on solar radiation.
The collector instantaneous efficiency is calculated by using equation (5.9). it will be
found that the general pattern of variation of efficiency over a day is same as that of the
useful heat gain because the value of efficiency depends on both the incident beam
radiation and the useful heat gain.
Figure 5.13 shows the variation of the thermal efficiency, and intensity with respect to
time. The Thermal efficiency first increases from morning, and reach a peak value, and
after then start decreases. It also starts increases around 11 am to 12 am, when the
0 100 200 300 400 500 600 700 800 900
0 20 40 60 80
100 120 140 160
10 11 12 1
INTE
NSI
TY(W
/m²)
USE
FUL
HEA
T G
AIN
TIME(HOUR)
USEFUL HEAT GAIN INTENSITY

79
parabola is at focusing medium. The hourly system efficiency (thermal efficiency)
decreases per hour as useful heat gain decreases continuously.
Figure 5.13 Variation of Thermal Efficiency and intensity with time
Concluded Points:
1) The maximum temperature rise in bare tube is 50.5 and glazed tube is 56 So
Glazed tube gives more temperature rise in comparison to bare tube.
2) Useful heat gain per hour is more in glazed tube as compare to bare tube. The
maximum useful heat gain per hour in glazed tube is 140 at morning time.
3) Glazed tube gives more instantaneous efficiency as less looses are encountered.
The maximum instantaneous efficiency in glazed tube is 9.12%.
4) The maximum thermal efficiency in bare tube is 11.90% and glazed tube is
16.69% as shown in the graph.
5) Overall system efficiency of glazed tube is 3.58% more as compare to bare tube.
0 100 200 300 400 500 600 700 800 900
0 2 4 6 8
10 12 14 16 18
10 11 12 1
INTE
NSI
TY(W
/m²)
THER
MA
L EF
FIC
IEN
CY
TIME(HOUR)
THERMAL EFFICIENCY INTENSITY
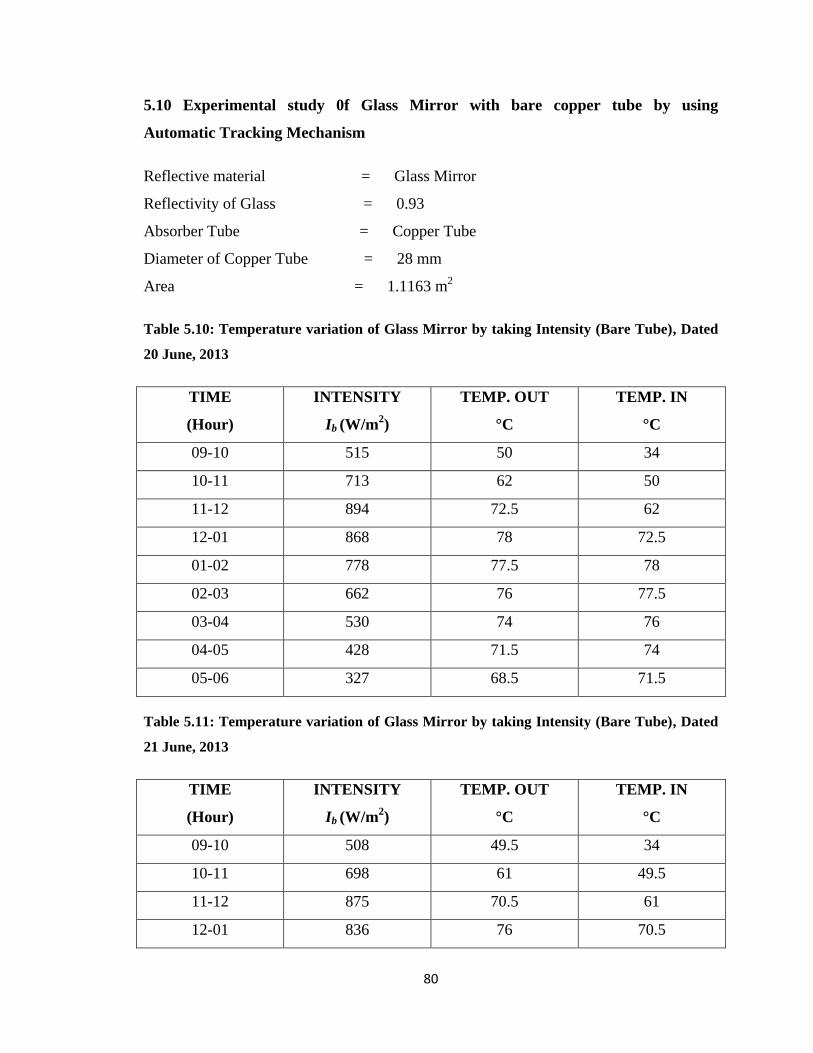
80
5.10 Experimental study 0f Glass Mirror with bare copper tube by using
Automatic Tracking Mechanism
Reflective material = Glass Mirror
Reflectivity of Glass = 0.93
Absorber Tube = Copper Tube
Diameter of Copper Tube = 28 mm
Area = 1.1163 m2
Table 5.10: Temperature variation of Glass Mirror by taking Intensity (Bare Tube), Dated
20 June, 2013
TIME
(Hour)
INTENSITY
Ib (W/m2)
TEMP. OUT
°C
TEMP. IN
°C
09-10 515 50 34
10-11 713 62 50
11-12 894 72.5 62
12-01 868 78 72.5
01-02 778 77.5 78
02-03 662 76 77.5
03-04 530 74 76
04-05 428 71.5 74
05-06 327 68.5 71.5
Table 5.11: Temperature variation of Glass Mirror by taking Intensity (Bare Tube), Dated
21 June, 2013
TIME
(Hour)
INTENSITY
Ib (W/m2)
TEMP. OUT
°C
TEMP. IN
°C
09-10 508 49.5 34
10-11 698 61 49.5
11-12 875 70.5 61
12-01 836 76 70.5

81
01-02 775 75.5 76
02-03 670 74 75.5
03-04 537 72.5 74
04-05 410 70 72.5
05-06 336 67 70
The above reading has been taken on 20 June and 21 June, 2013, days is normal at
morning, noon and evening. In the above tables, 20 June reading gives the more
temperature output as compare to 21 June reading. So 20 June reading is used in the
calculation purpose.
The above tables show the variation of solar intensity and the collector water outlet
temperature. The collector water outlet temperature varies with respect to solar intensity.
The water is recirculated from the storage tank and it passes through the copper tube and
acquires the heat, and then this heat is transferred to the storage tank and thus the
temperature of the storage tank rises. At that day 20 June, the ambient temp of water is
34 at 9.00am and it reaches his maximum level of 78.0 at 1.00pm and after 1.00pm
the water temperature start decreases. And no energy is retreat during the collection
period. During this process the flow rate of water through the collector is 0.083kgps.
Table 5.12: Performance data in glass mirror concentrator (Bare tube) by using Automatic
Tracking Mechanism
Useful heat gain
(W)
Instantaneous
efficiency/ )
System efficiency
Overall thermal
efficiency
280 26.03 48.70
210 15.22 26.38
183.75 8.92 18.41
96.25 6.61 9.93 23.06
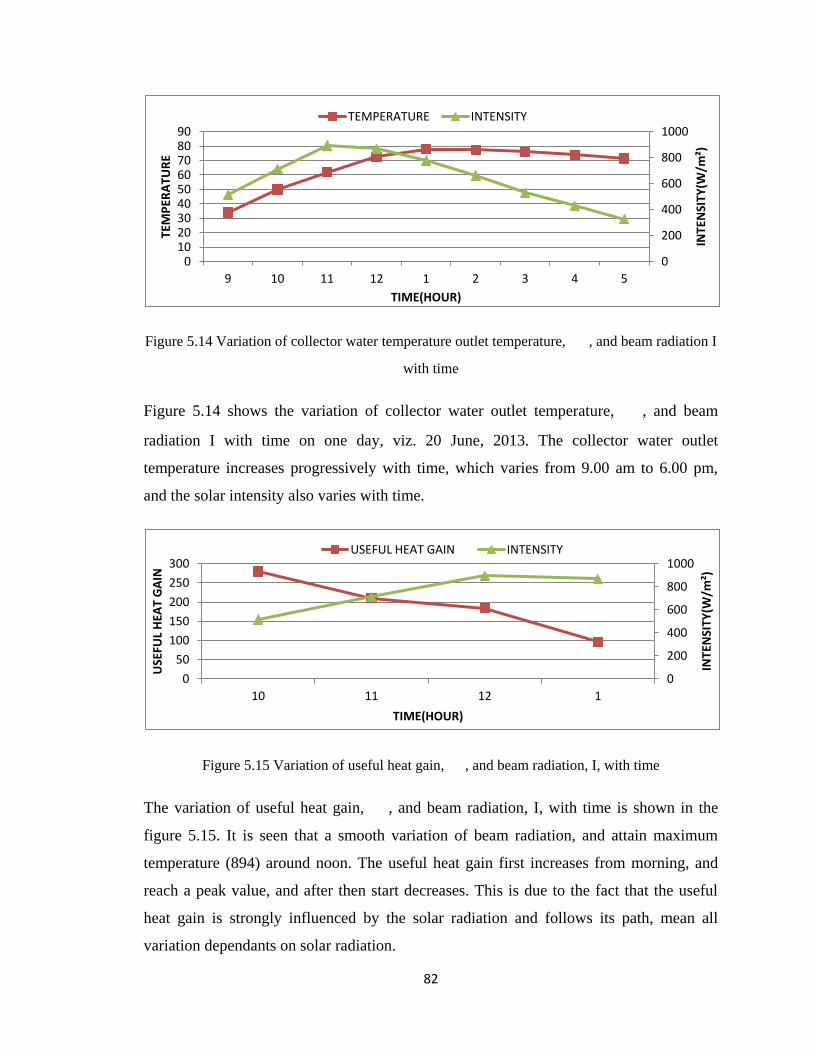
82
Figure 5.14 Variation of collector water temperature outlet temperature, , and beam radiation I
with time
Figure 5.14 shows the variation of collector water outlet temperature, , and beam
radiation I with time on one day, viz. 20 June, 2013. The collector water outlet
temperature increases progressively with time, which varies from 9.00 am to 6.00 pm,
and the solar intensity also varies with time.
Figure 5.15 Variation of useful heat gain, , and beam radiation, I, with time
The variation of useful heat gain, , and beam radiation, I, with time is shown in the
figure 5.15. It is seen that a smooth variation of beam radiation, and attain maximum
temperature (894) around noon. The useful heat gain first increases from morning, and
reach a peak value, and after then start decreases. This is due to the fact that the useful
heat gain is strongly influenced by the solar radiation and follows its path, mean all
variation dependants on solar radiation.
0
200
400
600
800
1000
0 10 20 30 40 50 60 70 80 90
9 10 11 12 1 2 3 4 5
INTE
NSI
TY(W
/m²)
TEM
PER
ATU
RE
TIME(HOUR)
TEMPERATURE INTENSITY
0
200
400
600
800
1000
0
50
100
150
200
250
300
10 11 12 1 IN
TEN
SITY
(W/m
²)
USE
FUL
HEA
T G
AIN
TIME(HOUR)
USEFUL HEAT GAIN INTENSITY

83
The collector instantaneous efficiency is calculated by using equation (5.9). it will be
found that the general pattern of variation of efficiency over a day is same as that of the
useful heat gain because the value of efficiency depends on both the incident beam
radiation and the useful heat gain.
Figure 5.16 Variation of Thermal Efficiency and intensity with time
Figure 5.16 shows the variation of the thermal efficiency, and intensity with respect to
time. The Thermal efficiency decreases with time and solar intensity increases. The
hourly system efficiency (thermal efficiency) decreases per hour as useful heat gain
decreases continuously.
0
200
400
600
800
1000
0
10
20
30
40
50
60
10 11 12 1
INTE
NSI
TY(W
/m²)
THER
MA
L EF
FIC
IEN
CY
TIME(HOUR)
THERMAL EFFICIENCY INTENSITY

84
5.11 Experimental study 0f Glass Mirror with glazed copper tube by using
Automatic Tracking Mechanism
Reflective material = Glass Mirror
Reflectivity of Glass = 0.93
Absorber Tube = Copper Tube
Diameter of Copper Tube = 28 mm
Glazing material = Glass tube
Glass tube diameter = 66mm
Area = 1.035 m2
Table 5.13: Temperature variation of Glass Mirror by taking Intensity (Glazed Tube),
Dated 22 June, 2013
TIME
(Hour)
INTENSITY
Ib (W/m2)
TEMP. OUT
°C
TEMP. IN
°C
09-10 515 51 33.5
10-11 690 64.5 51
11-12 892 75.5 64.5
12-01 863 82 75.5
01-02 780 81.5 82
02-03 667 80.5 81.5
03-04 546 78.5 80.5
04-05 442 76 78.5
05-06 328 72 76
Table 5.14: Temperature variation of Glass Mirror by taking Intensity (Glazed Tube),
Dated 24 June, 2013
TIME
(Hour)
INTENSITY
Ib (W/m2)
TEMP. OUT
°C
TEMP. IN
°C
09-10 536 54 35.5
10-11 728 68 54
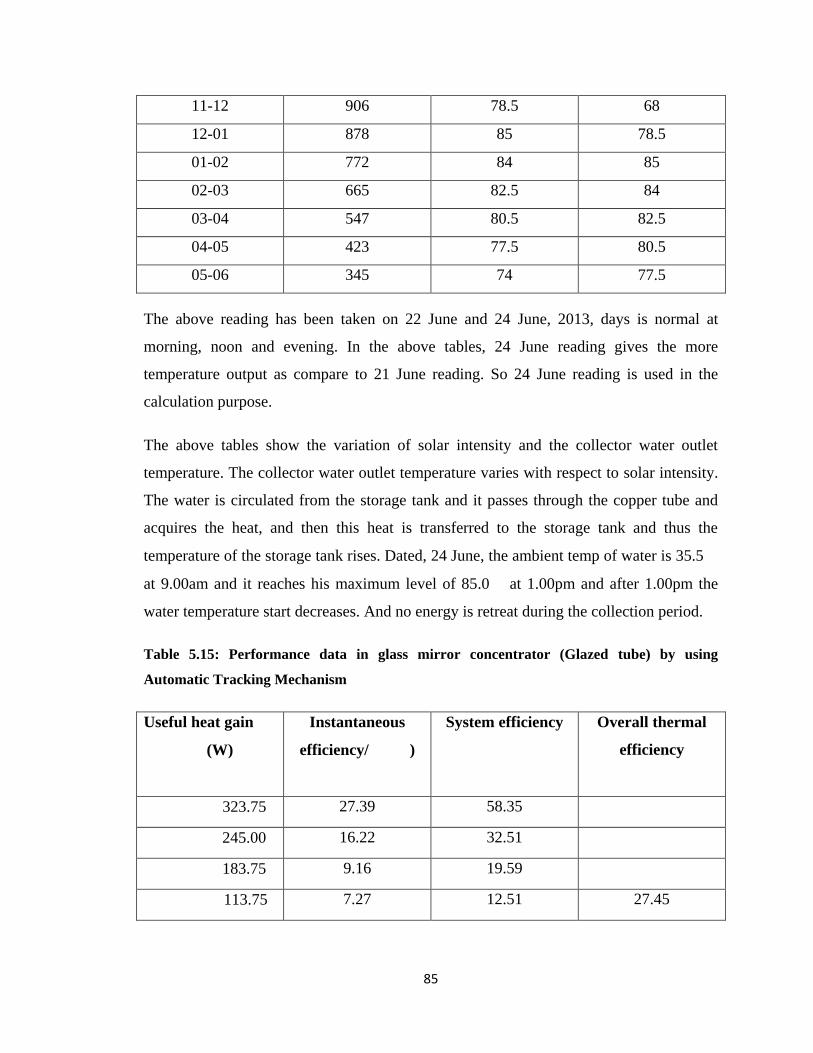
85
11-12 906 78.5 68
12-01 878 85 78.5
01-02 772 84 85
02-03 665 82.5 84
03-04 547 80.5 82.5
04-05 423 77.5 80.5
05-06 345 74 77.5
The above reading has been taken on 22 June and 24 June, 2013, days is normal at
morning, noon and evening. In the above tables, 24 June reading gives the more
temperature output as compare to 21 June reading. So 24 June reading is used in the
calculation purpose.
The above tables show the variation of solar intensity and the collector water outlet
temperature. The collector water outlet temperature varies with respect to solar intensity.
The water is circulated from the storage tank and it passes through the copper tube and
acquires the heat, and then this heat is transferred to the storage tank and thus the
temperature of the storage tank rises. Dated, 24 June, the ambient temp of water is 35.5
at 9.00am and it reaches his maximum level of 85.0 at 1.00pm and after 1.00pm the
water temperature start decreases. And no energy is retreat during the collection period.
Table 5.15: Performance data in glass mirror concentrator (Glazed tube) by using
Automatic Tracking Mechanism
Useful heat gain
(W)
Instantaneous
efficiency/ )
System efficiency
Overall thermal
efficiency
323.75 27.39 58.35
245.00 16.22 32.51
183.75 9.16 19.59
113.75 7.27 12.51 27.45

86
Figure 5.17 Variation of collector water temperature outlet temperature, , and beam radiation I
with time
Figure 5.17 shows the variation of collector water outlet temperature, , and beam
radiation I with time on one day, viz. 24 June, 2013. The collector water outlet
temperature increases progressively with time, which varies from 9.00 am to 6.00 pm,
and the solar intensity also varies with time.
Figure 5.18 Variation of useful heat gain, , and beam radiation, I, with time
The variation of useful heat gain, , and beam radiation, I, with time is shown in the
figure 5.18. It is seen that a smooth variation of beam radiation, and attain maximum
temperature (906) around noon. The useful heat gain first increases from morning, and
reach a peak value, and after then start decreases. This is due to the fact that the useful
heat gain is strongly influenced by the solar radiation and follows its path, mean all
variation dependants on solar radiation.
0
200
400
600
800
1000
0 10 20 30 40 50 60 70 80 90
9 10 11 12 1 2 3 4 5
INTE
NSI
TY(W
/m²)
TEM
PER
ATU
RE
TIME(HOUR)
TEMPERATURE INTENSITY
0
200
400
600
800
1000
0 50
100 150 200 250 300 350
10 11 12 1 IN
TEN
SITY
(W/m
²)
USE
FUL
HEA
T G
AIN
(W)
TIME(HOUR)
USEFUL HEAT GAIN INTENSITY

87
The collector instantaneous efficiency is calculated by using equation (5.9). it will be
found that the general pattern of variation of efficiency over a day is same as that of the
useful heat gain because the value of efficiency depends on both the incident beam
radiation and the useful heat gain.
Figure 5.19 Variation of Thermal Efficiency and intensity with time
Figure 5.19 shows the variation of the thermal efficiency, and intensity with respect to
time. The Thermal efficiency decreases with time and solar intensity increases. The
hourly system efficiency decreases per hour as useful heat gain decreases continuously.
Concluded Points
1) The maximum temperature rise in bare tube is 78 and glazed tube is 85 So
Glazed tube gives more temperature rise in comparison to bare tube.
2) Useful heat gain per hour is more in glazed tube as compare to bare tube. The
maximum useful heat gain per hour in glazed tube is 323.75 at morning time.
3) Glazed tube gives more instantaneous efficiency as less looses are encountered.
The maximum instantaneous efficiency in glazed tube is 27.39%.
4) The maximum thermal efficiency in bare tube is 48.70% and glazed tube is
58.35% as shown in the graph.
5) Overall system efficiency of glazed tube is 4.39% more as compare to bare tube.
0
200
400
600
800
1000
0 10 20 30 40 50 60 70
10 11 12 1
INTE
NSI
TY(W
/m²)
THER
MA
L EF
FIC
IEN
CY
TIME(HOUR)
THERMAL EFFICIENCY INTENSITY

88
CHAPTER-6
RESULTS AND DISCUSSION
6.1 General
Thermal performance tests of a Parabolic Trough Collector are normally used to calculate
its instantaneous efficiency at whole day. A common method of testing the efficiency of a
solar collector employs an oil circulating system in which the temperature rise across the
collector is measured under steady state conditions. Along with the inlet and outlet
collector fluid temperatures, the fluid mass flow rate and the instantaneous irradiance as
measured as well.
The above procedure in experimental analysis like maximum temperature rise, and
performance data like instantaneous efficiency, useful heat gain, thermal efficiency and
overall system efficiency of prototype parabolic trough collector are used.
Results are given in table 6.1 as shown below
Table 6.1: Values of different performance parameter
SR
NO.
TRACKING
MECHANISM
ABSORBER
TUBE
(MAX)
(MAX)
(MAX)
1. Manual
Tracking
(one axis)
BARE Cu TUBE 68.5 22.10 40.69 17.66
Cu TUBE WITH
GLAZING
75.0 24.41 46.87 22.52
2. Fixed Position BARE Cu TUBE 50.5 8.08 11.90 9.62
Cu TUBE WITH
GLAZING
56.0 9.12 16.69 13.20
3. Automatic
Tracking
(two axis)
BARE Cu TUBE 78.0 26.03 48.70 23.06
Cu TUBE WITH
GLAZING
85.0 27.39 58.35 27.45

89
Table 6.2: Comparison of maximum Temperature by different Tracking Mechanism
Sr.
No.
TRACKING
MECHANISM
ABSORBER TUBE TEMPERATURE
1. Manual Tracking
(one axis)
Bare Tube Maximum temperature
rise is 68.5 .
Glazed Tube Maximum temperature
rise is 75.0 .
2. Fixed Position Bare Tube Maximum temperature
rise is 50.5 .
Glazed Tube Maximum temperature
rise is 56.0 .
3. Automatic Tracking
(two axis)
Bare Tube Maximum temperature
rise is 78.0 .
Glazed Tube Maximum temperature
rise is 85.0 .
Table 6.2 shows the maximum temperature rise by different tracking mechanism namely
manual, fixed position and automatic with bare and glazed copper tube as an absorber
tube. The maximum temperature rise is 85.0 by automatic tracking mechanism in
glazed copper tube. Minimum temperature is obtained by fixed position tracking
mechanism. Figure 6.1 and 6.2 shows the variation of temperature by different tracking
mechanism with bare and glazed copper tube and with time.

90
Figure 6.1 Variation of temperature by using different tracking mechanism with bare copper tube
Figure 6.2 Variation of temperature by using different tracking mechanism with glazed copper
tube
0 10 20 30 40 50 60 70 80 90
9 10 11 12 1 2 3 4 5
TEM
PER
ATU
RE
TIME(HOUR)
MANUAL FIXED POSITION AUTOMATIC
0 10 20 30 40 50 60 70 80 90
9 10 11 12 1 2 3 4 5
TEM
PER
ATU
RE
TIME(HOUR)
MANUAL FIXED POSITION AUTOMATIC

91
Table 6.3: Comparison of maximum Useful Heat Gain by different Tracking Mechanism
Sr.
No.
TRACKING
MECHANISM
ABSORBER TUBE USEFUL HEAT GAIN
(W) per hour
1. Manual Tracking
(one axis)
Bare Tube Maximum Useful Heat Gain
is 227.5 W.
Glazed Tube Maximum Useful Heat Gain
is 253.75 W.
2. Fixed Position Bare Tube Maximum Useful Heat Gain
is 105 W.
Glazed Tube Maximum Useful Heat Gain
is 140 W.
3. Automatic Tracking
(two axis)
Bare Tube Maximum Useful Heat Gain
is 280 W.
Glazed Tube Maximum Useful Heat Gain
is 323.75 W.
Table 6.3 shows the maximum Useful Heat Gain (W) by different tracking mechanism
namely manual, fixed position and automatic with bare and glazed copper tube as an
absorber tube. The maximum Useful Heat Gain is 323.75 W per hour by automatic
tracking mechanism in glazed copper tube. Minimum Useful Heat Gain per hour is
obtained by fixed position tracking mechanism. Figure 6.3 and 6.4 shows the variation of
Useful Heat Gain by different tracking mechanism with bare and glazed copper tube and
with time.

92
Figure 6.3 Variation of Useful Heat Gain by using different tracking mechanism with bare copper
tube
Figure 6.4 Variation of Useful Heat Gain by using different tracking mechanism with glazed
copper tube
0
50
100
150
200
250
300
10 11 12 1
USE
FUL
HEA
T G
AIN
(W)
TIME(HOUR)
MANUAL FIXED POSITION AUTOMATIC
0
50
100
150
200
250
300
350
10 11 12 1
USE
FUL
HEA
T G
AIN
(W)
TIME(HOUR)
MANUAL FIXED POSITION AUTOMATIC
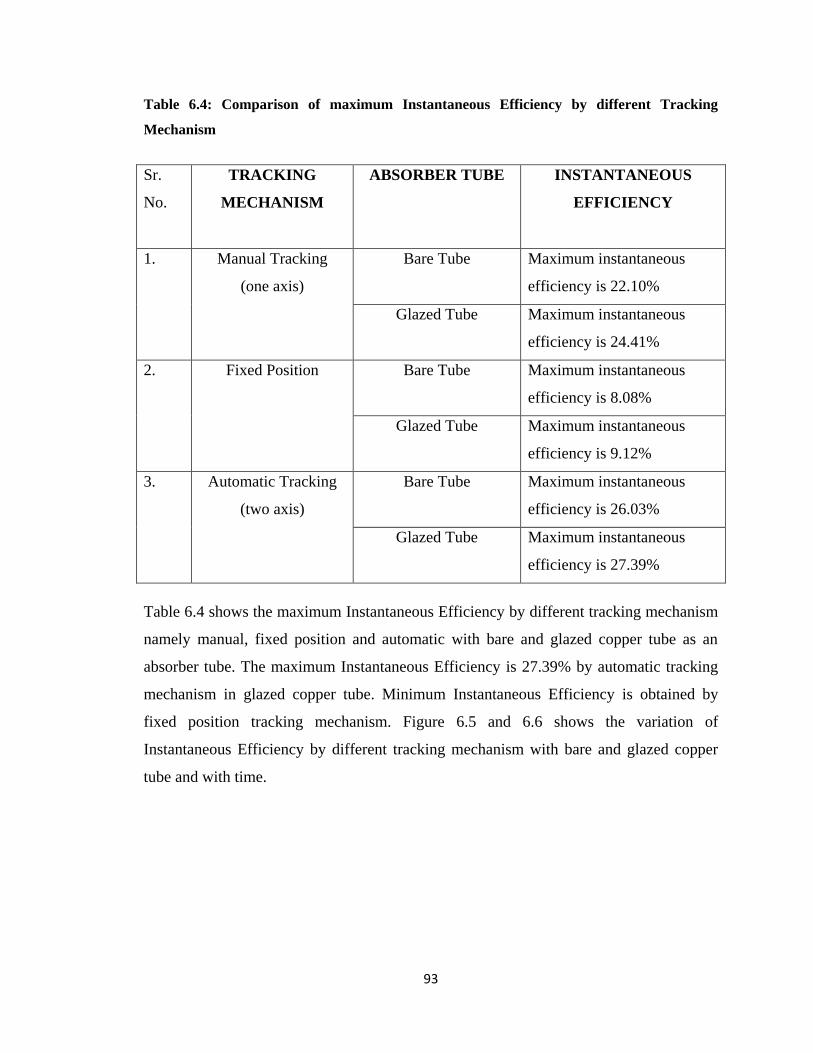
93
Table 6.4: Comparison of maximum Instantaneous Efficiency by different Tracking
Mechanism
Sr.
No.
TRACKING
MECHANISM
ABSORBER TUBE INSTANTANEOUS
EFFICIENCY
1. Manual Tracking
(one axis)
Bare Tube Maximum instantaneous
efficiency is 22.10%
Glazed Tube Maximum instantaneous
efficiency is 24.41%
2. Fixed Position Bare Tube Maximum instantaneous
efficiency is 8.08%
Glazed Tube Maximum instantaneous
efficiency is 9.12%
3. Automatic Tracking
(two axis)
Bare Tube Maximum instantaneous
efficiency is 26.03%
Glazed Tube Maximum instantaneous
efficiency is 27.39%
Table 6.4 shows the maximum Instantaneous Efficiency by different tracking mechanism
namely manual, fixed position and automatic with bare and glazed copper tube as an
absorber tube. The maximum Instantaneous Efficiency is 27.39% by automatic tracking
mechanism in glazed copper tube. Minimum Instantaneous Efficiency is obtained by
fixed position tracking mechanism. Figure 6.5 and 6.6 shows the variation of
Instantaneous Efficiency by different tracking mechanism with bare and glazed copper
tube and with time.

94
Figure 6.5 Variation of Instantaneous Efficiency by different tracking mechanism with bare
copper tube
Figure 6.6 Variation of Instantaneous Efficiency by different tracking mechanism with glazed
copper tube
0
5
10
15
20
25
30
10 11 12 1 INST
AN
TAN
EOU
S EF
FIC
IEN
CY
TIME(HOUR)
MANUAL FIXED POSITION AUTOMATIC
0
5
10
15
20
25
30
10 11 12 1 INST
AN
TAN
EOU
S EF
FIC
IEN
CY
TIME(HOUR)
MANUAL FIXED POSITION AUTOMATIC

95
Table 6.5: Comparison of maximum Thermal Efficiency by different Tracking Mechanism
Sr.
No.
TRACKING
MECHANISM
ABSORBER TUBE THERMAL EFFICIENCY
1. Manual Tracking
(one axis)
Bare Tube Maximum thermal efficiency
is 40.69%
Glazed Tube Maximum thermal efficiency
is 46.87%
2. Fixed Position Bare Tube Maximum thermal efficiency
is 11.90%
Glazed Tube Maximum thermal efficiency
is 16.69%
3. Automatic Tracking
(two axis)
Bare Tube Maximum thermal efficiency
is 48.70%
Glazed Tube Maximum thermal efficiency
is 58.35%
Table 6.5 shows the maximum Thermal Efficiency by different tracking mechanism
namely manual, fixed position and automatic with bare and glazed copper tube as an
absorber tube. The maximum Thermal Efficiency is 58.35% by automatic tracking
mechanism in glazed copper tube. Minimum Thermal Efficiency is obtained by fixed
position tracking mechanism. Figure 6.7 and 6.8 shows the variation of Instantaneous
Efficiency by different tracking mechanism with bare and glazed copper tube and with
time.

96
Figure 6.7 Variation of Thermal Efficiency by different tracking mechanism with bare copper
tube
Figure 6.8 Variation of Thermal Efficiency by different tracking mechanism with glazed copper
tube
0
10
20
30
40
50
60
10 11 12 1
THER
MA
L EF
FIC
IEN
CY
TIME(HOUR)
MANUAL FIXED POSITION AUTOMATIC
0
10
20
30
40
50
60
70
10 11 12 1
THER
MA
L EF
FIC
IEN
CY
TIME(HOUR)
MANUAL FIXED POSITION AUTOMATIC

97
Table 6.6: Comparison of Overall Thermal Efficiency by different Tracking Mechanism
Sr.
No.
TRACKING
MECHANISM
ABSORBER TUBE OVERALL THERMAL
EFFICIENCY
1. Manual Tracking
(one axis)
Bare Tube Maximum Overall thermal
efficiency is 17.66%
Glazed Tube Maximum Overall thermal
efficiency is 22.52%
2. Fixed Position Bare Tube Maximum Overall thermal
efficiency is 9.62%
Glazed Tube Maximum Overall thermal
efficiency is 13.20%
3. Automatic Tracking
(two axis)
Bare Tube Maximum Overall thermal
efficiency is 23.06%
Glazed Tube Maximum Overall thermal
efficiency is 40.69%
Table 6.6 shows the Overall Thermal Efficiency by different tracking mechanism namely
manual, fixed position and automatic with bare and glazed copper tube as an absorber
tube. The maximum Overall Thermal Efficiency is 30.01% by automatic tracking
mechanism in glazed copper tube. Minimum Overall Thermal Efficiency is 9.62% by
fixed position tracking mechanism in bare copper tube.

98
System Optical Efficiency is same for all the tracking mechanism namely manual, fixed
position and automatic. In the present work, glass mirror is used as an reflective material
for all the tracking mechanism. So optical efficiency is same for all the tracking
mechanism.
Optical Efficiency for Tracking Mechanism = 70.63%

99
CHAPTER-7
CONCLUSION
In the present work an experimental study is performed to investigate the effect
maximum temperature obtained for different tracking mechanism namely as manual,
fixed position and automatic on the parabolic trough collector. It includes design,
fabrication and characterization of different tracking mechanisms. Different results are
obtained by using bare copper tube and glazed copper tube as an absorber tube. The
points to be concluded after experimental work are given below:
Automatic tracking system gives the maximum temperature with glazed copper
tube as compare to manual and fixed position tracking system. Maximum
temperature obtained is 86 as compared to 75 in fixed and manual
tracking system, and minimum temperature obtained is 50.5 by fixed position
tracking system.
Instantaneous efficiency obtained by automatic tracking system is more as
compare to manual and fixed position tracking system. Automatic tracking system
shows an improvement of 5-50% as compare to fixed position tracking system,
and shows an improvement of 3-26% as compare to manual tracking system.
Considering thermal efficiency per hour, automatic tracking system shows an
improvement of 10-55% as compare to fixed position, and 5-20% improvement as
compare to manual tracking system.
Overall system efficiency is obtained using automatic tracking system is more as
compare to manual and fixed position tracking system. It shows an improvement
of 5-50% as compare to other tracking system.
Optical Efficiency of present parabolic trough collector is same for all tracking
system, because glass mirror is used as a reflective material. Optical Efficiency
for our experiment is 70.63%.

100
This type of solar tracking system can be placed anywhere in the world where
proper sunlight is available and can be operated without any geographical data.
There is further scope of improvement in present parabolic trough collector due to
high mass flow rate which restrict further improvement in its efficiency.
By improving condition the improvement of collector efficiency can be achieved
more than 65%

101
CHAPTER-8
FUTURE SCOPE
The future scope of prototype parabolic trough collector is very wide. India’s Power
scenario of solar energy as a renewable energy source is still under research. So, there is a
necessity of further theoretical as well as experimental work, investigations to enhance
the efficiency of solar collector and to obtain firm and authenticate results. In the present
dissertation work, feasibility of a prototype parabolic trough collector is tested for hot
water generation and further practical application like air heating, process heating and
further steam can be generated with more area and length.
Also improved automatic tracking system with stepper motor can also be used to track
the sun with more precise steps. Problems related to solar radiation discontinuity due to
clouds during automatic tracking can also be eliminated, using more advance electronics.

102
REFERENCES
Alkilani, M M 2009, ‘Output air temperature prediction in a solar air heater integrated
with phase change material’, Higher Technical Institute, Korea, vol. 27, no. 3, pp. 334-
341.
Almanza, R & Martmhnez I 2000, ‘Parabolic trough reflector manufactured with
aluminum first surface mirrors thermally sagged’, South Africa Journal of Educational
technology, vol. 64, no. 96, pp. 1-10.
Anderson, T N 2008, ‘Designing photovoltaic thermal solar collectors for building
integration’, Nova Science Publishers New Zealand, vol. 2, no. 978, pp. 403-426.
Arasu, A V 2007, ‘Theoretical analysis and experimental analysis of a parabolic trough
collector for hot Water Generation’, National Renewable Energy Laboratory, vol. 11,
no. 256, pp. 119-126.
Bakos, G C & Seftelis, I 2000, ‘Design optimization and conversion efficiency
determination of a line-focus parabolic trough solar collector’, An International Journal
of South Africa, vol. 25, no. 225, pp. 43-50.
Blake, D M & Moensa, L 2002, ‘New heat transfer and storage fluids for parabolic
trough solar thermal electric plants’, Renewable Energy Resources, vol. 2, no. 13, pp. 1-
15.
Cheema, S S 2012, ‘Simulation studies on dual axis solar photovoltaic panel tracking
system’, pp. 17-18
Chicco, G & Schlabbach, J 2010, ‘Performance of Grid Connected Photovoltaic Systems
in Fixed and Sun-Tracking Configurations’, Vittorio Alfieri Research Grant Italy, vol. 15,
no. 2, pp. 677-681.
103
Duarte, F 2010, ‘Two axis solar tracker based on solar maps controlled by a low-power
microcontroller’, International Conference on Renewable Energies and Power Quality,
vol. 10, pp. 1-9.
Garg, H P & Prakash, J 1997, Solar energy Fundamentals and Applications, Tata
Mcgraw Hill, West Patel Nagar, New Delhi.
Helwa, N H & Bahgat, A B G 2010, ‘Maximum collectable solar energy by different
solar tracking systems’, Solar Energy Department National Research Center Dokki,
Cairo, Egypt, vol. 25, no. 3, pp. 23-34.
http://www.parabolictrough.com.
Inspira, S L 2009, ‘A PI based hybrid sun tracking algorithm for photovoltaic
concentration’, Spain journal of Educational Technology, vol. 10, no. 28230, pp. 1 -4
Khlaichom, P & Sonthipermpoon, K 2008 ‘Optimization of Solar Tracking System based
on Genetic Algorithms’, Faculty of Engineering, Naresuan University
Phitsanulok,Thailand, vol. 6, pp. 23-25.
Konar 2011, ‘A microprocessor based automatic position control solar system’, Faculty
of Engineering and Architecture Cukurova University Turkey, vol. 10, no. 3, pp. 913-917.
Lee, C Y & Chou P C 2009, ‘Sun tracking systems: A Review’, Department of Materials
Engineering, National Pingtung University of Science and Technology, Taiwan, vol. 912,
no. ISSN 1424-8220, pp. 1-10.
Mousazadeh, H 2009, ‘A review of principle and sun-tracking methods for maximizing
solar systems output’, Agricultural Engineering Research Institute Karaj Iran, vol. 13,
no. 3, pp. 6-15.
Naidoo, P & Brooks, M 2002, ‘Intelligent control & tracking of a parabolic trough solar
collector’, Mangosuthu Technikon Faculty of Mechanical Engineering, Durban, South
Africa, vol. 20, pp. 1-6.

104
Qiblawey, H M & Banat, F 2008, ‘Solar thermal desalination technologies’,A Journal of
Educational Society Spain, vol. 32, no. 3, pp. 633–644.
Rai, G D 2010, ‘Non-Conventional energy sources’, vol. 81, no. 7409, pp. 463-472
Roth, P & Georgiev, A 2003, ‘Design and construction of a system for sun-tracking’,
Department of Mechanical Engineering, UTFSM, Brazil, vol. 29, no. 5, pp. 393-402.
Rubio, F R & Ortega M G 2006, ‘Application of new control strategy for sun tracking’,A
International Journal of Spain, vol. 48, no. 41092, pp. 2174-2184.
Sanjay, 2012, ‘Design, fabrication and experimental analysis of a parabolic trough
collector using different reflecting materials for hot water generation’, pp. 1-100.
Saxena A K 2010, ‘A versatile microprocessor based controller for solar tracking’,A
Journal of Centre for Energy Study New Delhi, vol. 160, pp. 1105-1115.
Scrivani, A & Asmar T E, ‘Solar trough concentration for fresh water production and
waste water treatment’,Australian Journal of Educational Technology, vol. 206, no. 5,
pp. 485-493.
Siew, H W 2008, ‘Solar racker’, ENG 499 Capstone Project, vol. 12, no. 2, pp. 24-34.
Soteris, A K 2004, ‘Solar thermal collectors and applications’, Higher Technical Institute
Nicosia, vol. 30, no. 20423, pp. 231-295.
Stern, M & Whalin, W 2011, ‘Development of a low cost integrated 20-kW AC Solar
Tracking subarray for grid connected PV Power system applications’, Department of
Energy Managed by Midwest Research Institute for the U.S, vol. 5, no. 14271, pp. 1-38.
Thomas, A & Guven, H M 1993, ‘Parabolic trough concentrator-design and evaluation’,
A Journal of Energy in United State, America, vol. 25, no. 2, pp. 401-416.
Zeroual, A & Raoufi, M 1997, ‘Design and construction of a closed loop Sun-Tracker
with microprocessor management’, International Journal of Solar Energy UK, vol. 19,
no.213, pp. 263-274.

105