submitted by - minnesota department of transportation · submitted to: minnesota department ......
TRANSCRIPT
ITS INNOVATIVE PROJECT ARTERIAL TRAVEL TIME MONITORING SYSTEM
USING BLUETOOTH TECHNOLOGY Final Concept of Operations
Submitted to:
Minnesota Department of Transportation (Mn/DOT)
February 2010
19-J09-1911
Submitted by:

Arterial Travel Time Monitoring System Using Bluetooth Technology Version 2
Page i Mn/DOT ITS Innovative Project
finalits innovative arterial bluetooth concept of operations report02222010.doc
DOCUMENT VERSION CONTROL
Document Name Submittal Date Version No. Version 1.0 February 8, 2010 1
Version 2.0 February 22, 2010 2

Arterial Travel Time Monitoring System Using Bluetooth Technology Version 2
Page ii Mn/DOT ITS Innovative Project
finalits innovative arterial bluetooth concept of operations report02222010.doc
TABLE OF CONTENTS
Document Version Control ..................................................................................................... i
Table of contents ................................................................................................................... ii
Appendices .......................................................................................................................... iii
LIst of Tables ........................................................................................................................ iii
List of Figures ....................................................................................................................... iii
1.0 Introduction ................................................................................................................ 1
1.1 DOCUMENT ORGANIZATION .................................................................................................... 1
1.2 PURPOSE OF THE ARTERIAL TRAVEL TIME MONITORING SYSTEM .................................................... 2
1.3 GOALS AND OBJECTIVES .......................................................................................................... 3
2.0 Project Scope .............................................................................................................. 4
2.1 PROJECT OVERVIEW ............................................................................................................... 4
2.2 PROJECT STAKEHOLDERS ......................................................................................................... 4
3.0 Referenced Documents ............................................................................................... 5
3.1 DOCUMENTS ........................................................................................................................ 5
4.0 Operational Description .............................................................................................. 6
4.1 PROJECT LIMITS .................................................................................................................... 6
4.2 OPERATIONAL CHARACTERISTICS .............................................................................................. 6
4.3 TRAFFIC MANAGEMENT INFRASTRUCTURE .................................................................................. 8
4.4 SYSTEM INTEGRATION WITH CURRENT AND PLANNED TRANSPORTATION NETWORKS .......................... 8
5.0 Operational Needs .................................................................................................... 10
5.1 SPOT SENSORS .................................................................................................................... 10
5.2 PROBE TECHNOLOGIES ......................................................................................................... 11
5.3 INFRASTRUCTURE-BASED PROBE TECHNOLOGIES ....................................................................... 11
5.4 PROBE TECHNOLOGIES NOT REQUIRING ROADSIDE INFRASTRUCTURE ............................................ 13
5.5 ADDITIONAL CONSIDERATIONS ............................................................................................... 14
6.0 System Overview and Concept .................................................................................. 15
6.1 BLUETOOTH TECHNOLOGY..................................................................................................... 15
6.2 PROPOSED HARDWARE, LOCATIONS AND INSTALLATION NEEDS .................................................... 16
6.3 POWER .............................................................................................................................. 18
6.4 COMMUNICATIONS .............................................................................................................. 18
6.5 DATA PROCESSING ............................................................................................................... 18
6.6 USER INTERFACE ................................................................................................................. 19
7.0 Operational Scenarios ............................................................................................... 20

Arterial Travel Time Monitoring System Using Bluetooth Technology Version 2
Page iii Mn/DOT ITS Innovative Project
finalits innovative arterial bluetooth concept of operations report02222010.doc
7.1 SCENARIOS .................................................................................................................................... 20 7.2 HIGH-LEVEL REQUIREMENTS ................................................................................................. 25
8.0 System Evaluation ..................................................................................................... 26
8.1 OVERVIEW OF EVALUATION PLAN ........................................................................................... 26
9.0 Next Steps ................................................................................................................. 28
APPENDICES
APPENDIX A: FIELD SURVEY RESULTS
APPENDIX B: TRAFFIC DATA CSAH 81
APPENDIX C: INRIX CONCEPT OF OPERATIONS
APPENDIX D: AIRSAGE INFORMATION MINNESOTA REGIONAL ITS ARCHITECTURE INFORMATION LINK CAN BE FOUND AT: http://www.dot.state.mn.us/guidestar2006_2010/ITS_Planning_and_Regional_Architecture.html
LIST OF TABLES
TABLE 1: SEGMENT-LEVEL AVERAGE DAILY TRAFFIC (ADT) ............................................................ 8
TABLE 2: PROPOSED DEPLOYMENT LOCATIONS .......................................................................... 17
TABLE 3: ARTERIAL BLUETOOTH SCENARIO APPLICATION SUMMARY ........................................ 24
LIST OF FIGURES
FIGURE 1 ITS SYSTEM ENGINEERING PROCESS ............................................................................... 1
FIGURE 2 PROJECT LIMITS ............................................................................................................... 7
FIGURE 3 SPOT SENSOR DATA ...................................................................................................... 10
FIGURE 4 PROBE DATA .................................................................................................................. 11
FIGURE 5 BLUETOOTH RANGE AND MEASUREMENT ERROR ....................................................... 16
FIGURE 6 SAMPLE USER INTERFACE DISPLAY ............................................................................... 19

Arterial Travel Time Monitoring System Using Bluetooth Technology Version 2
Page 1 Mn/DOT ITS Innovative Project
finalits innovative arterial bluetooth concept of operations report02222010.doc
1.0 INTRODUCTION
1.1 DOCUMENT ORGANIZATION
In the context of “systems engineering”, the Concept of Operations is a document that provides a user-oriented view of the arterial travel time monitoring system, the overall system approach, and the associated operations. The Concept of Operations lays out system concept, explains how things are expected to work once it is in operation, and identifies the responsibilities of the various stakeholders for making this happen. A Concept of Operations does not delve into technology or detailed requirements of the system; but it does address the “institutional” environment in which arterial travel time monitoring system must be deployed, operated, and maintained.
FIGURE 1 ITS SYSTEM ENGINEERING PROCESS
The content of this document is intended for all project stakeholders with relevant information for high-level managers and system operators at the Minnesota Department of Transportation and Hennepin County.

Arterial Travel Time Monitoring System Using Bluetooth Technology Version 2
Page 2 Mn/DOT ITS Innovative Project
finalits innovative arterial bluetooth concept of operations report02222010.doc
Attributes of Good Performance Measures
Reflect the goals and objectives of the system and the agency
A limited number of measures are better than numerous measures (e.g., a measure that is applicable to all modes).
Facilitate improvement, providing the ability to diagnose problems and to assess operational results.
Simple and understandable, including information and presentation of the data that can be easily understood by the public and can improve decision making.
Data required for performance measures should be accurate and easy to collect and analyze.
1.2 PURPOSE OF THE ARTERIAL TRAVEL TIME
MONITORING SYSTEM
Arterial travel time is an excellent performance measurement for agency planners and engineers. It satisfies nearly all of the attributes that define a good performance measure. Moreover, given that travel time is “mode neutral” (i.e., applicable to all modes of transportation), and that users of the surface transportation can readily understand and relate to the concept of “travel time”, it is considered one of the best performance measures for corridor management and regional multi-modal operations and planning.
Accurate measurements of travel time provided in “real time” – can also be very beneficial in the management and operation of an arterial network, by providing:
Tools to better monitor signal systems, including data necessary for traffic signal operators to make informed and timely operational decisions (e.g., development and selection of optimum timing plans);
Planning information to other stakeholders such as city and regional transportation planners, transportation boards or city councils;
Useful traveler information for dissemination to the public.
The performance measure attribute proven most troublesome for travel time along arterials has been phrased as “accurate and easy to collect”. While measuring travel time on freeways is a well-established and mature application, obtaining travel time data on an arterial network – including state, county and city roads – has proven challenging due to the significant variability of traffic flow and speeds. This variability is due to a number of reasons, including the presence of multiple signalized intersections along the arterial, differing distances between signals, signal phasing and timing (often changing throughout the day), “side friction” from driveways and curb parking, and the fact that, unlike limited access highways, vehicles can enter and leave the arterial at numerous locations almost at will. The presence of buses and bus stops, and pedestrian traffic crossing the arterial, can further impact the traffic flow and travel times. The purpose of the Arterial Travel Time Monitoring System along CSAH 81 in Hennepin County is to evaluate a relatively new technology for collecting travel times. The system will identify

Arterial Travel Time Monitoring System Using Bluetooth Technology Version 2
Page 3 Mn/DOT ITS Innovative Project
finalits innovative arterial bluetooth concept of operations report02222010.doc
and time-stamp wireless media access control (MAC) addresses of anonymous Bluetooth devices passing through six intersections along the corridor. The information gained from devices passing through Bluetooth-enabled intersections will be fed back to a central server location allowing a calculation of real-time travel times between reader locations.
1.3 GOALS AND OBJECTIVES
The goals of the Arterial Travel Time Monitoring System Using Bluetooth Technology project are:
To provide an operational test of an end-to-end solution that will result in accurate and reliable information on arterial travel times.
To evaluate the results with respect to actual travel times and other various parameters (e.g., sample size).
To demonstrate how the travel time information may be used as a performance measure for arterial traffic management and operations, and how it might be disseminated as traveler information (e.g., displayed on Google maps).
To derive practical deployment guidelines as well as a nucleus for subsequent expansion of the technology in Hennepin County, in Minnesota or in other states.

Arterial Travel Time Monitoring System Using Bluetooth Technology Version 2
Page 4 Mn/DOT ITS Innovative Project
finalits innovative arterial bluetooth concept of operations report02222010.doc
2.0 PROJECT SCOPE
2.1 PROJECT OVERVIEW
The Minnesota Department of Transportation (Mn/DOT) and other entities, including the Metropolitan Council and Hennepin County, have identified the need for coordinated traffic management along major freeways and arterial networks through the planning and deployment of a number of recent initiatives, including Integrated Corridor Management (ICM), Transit Signal Priority (TSP) and other innovative traffic management strategies. While other real-time traveler information projects have been deployed within the Twin Cities area previously, this particular project is the first field test and deployment of a wireless Bluetooth reader system that will collect anonymous data and evaluate it against other travel time information. Further, the information gained from the operational test along CSAH 81 will be analyzed to determine if it is possible for use in regional applications of real-time traveler information or as a standard for regional arterial performance measurement.
2.2 PROJECT STAKEHOLDERS
The following stakeholders were identified and interviewed in order to develop this concept of operations: Minnesota Department of Transportation
Freeway Operations
Planning
Regional Traffic Management Center (RTMC)
Hennepin County Public Works Department
Traffic Engineering
Signal Operations
Metropolitan Council Northwest Corridor Bus Rapid Transit

Arterial Travel Time Monitoring System Using Bluetooth Technology Version 2
Page 5 Mn/DOT ITS Innovative Project
finalits innovative arterial bluetooth concept of operations report02222010.doc
3.0 REFERENCED DOCUMENTS The concept of measuring arterial travel times has been reviewed as part of this Concept of Operations development. Brief summaries of each reference document are contained below.
3.1 DOCUMENTS
FHWA and Mn/DOT Integrated Corridor Management (ICM) I-394 and I-494 corridors on the west side of downtown Minneapolis is the study area for the first regional ICM project. The ICM project seeks to integrate freeways, arterial streets and transit systems to optimize system performance of each individual system and to integrate existing technologies and strategies to develop a fully-integrated and optimized travel corridor. A Concept of Operations and System Requirements document were published by Mn/DOT and project partners in March 2008. I-95 INRIX Evaluations/Con Ops This study documented the ground truth and performance measures to evaluate 92 miles of freeway through the four states of Maryland, Virginia, Delaware and New Jersey. The Concept of Operations for this project is included within the Appendix of this document. AirSage Traffic Data Quality Summaries Traffic verification tests on freeways and arterials in Detroit, New York and San Diego were completed by a third-party. This report summarizes the accuracy of cell phone probe-based technologies. Minnesota Statewide Regional ITS Architecture The project is consistent with the Minnesota Statewide Regional ITS Architecture, Version 2009. Elements of Volume 2, ATIS Marketing Packages and Volume 9, Implementation Plan, are consistent with this project’s design and deployment. The document can be found at http://www.dot.state.mn.us/guidestar2006_2010/ITS_Planning_and_Regional_Architecture.html.

Arterial Travel Time Monitoring System Using Bluetooth Technology Version 2
Page 6 Mn/DOT ITS Innovative Project
finalits innovative arterial bluetooth concept of operations report02222010.doc
4.0 OPERATIONAL DESCRIPTION
4.1 PROJECT LIMITS
The deployment of wireless field devices for the Arterial Travel Time Monitoring System project is limited geographically to the following six (6) intersections along CSAH 81 between Brooklyn Park on the north end of the project area and Robbinsdale on the south:
Green Haven Drive/CSAH 81
71st Avenue/CSAH 81
63rd Avenue/CSAH 81
Bass Lake Road/CSAH 81
42nd Street (Rockford Road)/CSAH 81
36th Street/CSAH 81
Figure 2 shows the CSAH 81 project corridor and affected intersections.
4.2 OPERATIONAL CHARACTERISTICS
The section of CSAH 81 that is applicable to the Arterial Travel Time Monitoring project was constructed as County Road 81 in the late 1940s into the early 1950s. Prior to the construction of Interstates 94 and 494, County Road 81 served as the principal transportation route between the City of Minneapolis and points northwest. In the late 1980s the State of Minnesota turned over management of the road to Hennepin County, and County Road 81 became County-State Aid Highway 81 at that time.
Corridor Characteristics The Arterial Travel Time Monitoring project area runs approximately 6.2 miles, bounded on the north end by Green Haven Drive in Brooklyn Park and on the south end by W. 36th Street in Robbinsdale. Portions of CSAH 81/Bottineau Boulevard on the south end of the corridor include pedestrian crosswalks and separated raised median with walking paths on either side of the road. This occurs primarily in the downtown Robbinsdale portion of the project area. As the corridor progresses north through communities of Crystal and Brooklyn Park, the raised median transitions into open ditch medians without pedestrian amenities.

Arterial Travel Time Monitoring System Using Bluetooth Technology Version 2
Page 7 Mn/DOT ITS Innovative Project
finalits innovative arterial bluetooth concept of operations report02222010.doc
FIGURE 2 PROJECT LIMITS

Arterial Travel Time Monitoring System Using Bluetooth Technology Version 2
Page 8 Mn/DOT ITS Innovative Project
finalits innovative arterial bluetooth concept of operations report02222010.doc
The study corridor has two through lanes in each direction at each signalized intersection plus right-turn and left-turn lanes. On the south end of the corridor the speed limit is 40 miles per hour, increasing to 45 mph just south of Bass Lake Road/CSAH 81. North of Bass Lake Road the posted speed limits increase to 55 mph through the remainder of the corridor.
Peak and 24-Hour Traffic Volumes Information received from Hennepin County provides the following 24-hour volumes at each of the six study intersections. Turning movements for each section are summarized and can be found in the Appendix.
TABLE 1: SEGMENT-LEVEL AVERAGE DAILY TRAFFIC (ADT)
Study Intersection 24-Hour ADT
Green Haven Dr/CSAH 81 21,800
71st Avenue/CSAH 81 21,200
63rd Avenue/CSAH 81 20,300
Bass Lake Rd/CSAH 81 24,700
42nd Street/CSAH 81 15,700
During field observations for the study performed in August 2009, no operational deficiencies were observed over a three-day period during both AM and PM peak hours other than typical peak period traffic congestion.
4.3 TRAFFIC MANAGEMENT INFRASTRUCTURE
The Bluetooth technology proposed for the Arterial Travel Time Monitoring study does not require integration with the traffic management infrastructure along CSAH 81.
4.4 SYSTEM INTEGRATION WITH CURRENT AND PLANNED TRANSPORTATION NETWORKS
Planned Roadway Reconstruction Hennepin County plans to tear down and reconstruct the railroad bridge located along CSAH 81 near Wilshire Blvd. sometime during Summer 2010. During this time a marked detour route will be provided along CSAH 81, and it is expected to divert southbound traffic off 81 for a span of several blocks before returning to 81 at another point along the corridor within the study area. Other construction activities are occurring north of Green Haven Drive during Fall 2009. This area is outside (north) of study limits. However, traffic volumes may be affected at points south of the construction area if activities are continued in Spring 2009, when Bluetooth system deployment is expected.

Arterial Travel Time Monitoring System Using Bluetooth Technology Version 2
Page 9 Mn/DOT ITS Innovative Project
finalits innovative arterial bluetooth concept of operations report02222010.doc
Northwest Corridor Bus Rapid Transit (BRT) CSAH 81 is also known as the Bottineau Boulevard, one of the Twin Cities’ planned expansion corridors for Bus Rapid Transit (BRT) by 2030. Planned reconstruction and redesign of the CSAH 81 corridor in the future includes provisions for BRT service – separate bus lanes, transit stations, park-and-ride lots and traffic signal priority at intersections to speed up bus operations. As funding is obtained and construction along the CSAH 81 corridor occurs, roadway and busway planning efforts are being closely coordinated to ensure two traffic lanes in each direction with the inclusion of a bus-only lane for future Northwest Corridor BRT service.
There are no expected operational issues associated with the planned BRT system as they will occur beyond the field operations testing period of the Arterial Travel Time System Using Bluetooth Technology project.

Arterial Travel Time Monitoring System Using Bluetooth Technology Version 2
Page 10
Mn/DOT ITS Innovative Project
finalits innovative arterial bluetooth concept of operations report02222010.doc
5.0 OPERATIONAL NEEDS There are two basic concepts for collecting speed and travel time information along an arterial link. The following sections identify current technologies that can be used to estimate arterial travel time along a corridor.
5.1 SPOT SENSORS
Spot sensors – for measuring volume and speed1- are typically located mid-block or a sufficient distance upstream of a signalized intersection such that queues do not reach the detection point. The average speed of vehicles across the detection point is used as the surrogate speed measurement for the entire link (from intersection A to intersection B, and from intersection B to intersection C, as shown in Figure 3). From these surrogate measurements of average speed, link travel times can be calculated – for example, the calculated average travel time along link AB is 60 seconds; 77 seconds for link BC).
The use of spot sensors to measure average speeds and calculate travel times for freeway links (e.g., between freeway interchanges) is a well-established and proven application. However, using this approach to obtain average speed and travel time information along an arterial has proven challenging due to the significant variability of traffic flow and speeds along arterial links. A number of reasons contribute to this variability, including the presence of signalized intersections at the link nodes and often along the link, signal phasing and timing, “side friction” from adjacent driveways, the presence of buses, bus stops, and pedestrians. It is noted that models are available that utilize upstream detector data, along with signal timing and phase information, to calculate queue length at the upstream intersection; and this
1 Depending on the technology and configuration of the detector, speed may be measured directly, or calculated
based on volume and occupancy measurements.
AVG. Speed = 30 MPH AVG. Speed = 35 MPH
½ mile ¾ mile
A B C
AVG. Speed = 30 MPH AVG. Speed = 35 MPH
½ mile ¾ mile
A B C
FIGURE 3 SPOT SENSOR DATA

Arterial Travel Time Monitoring System Using Bluetooth Technology Version 2
Page 11
Mn/DOT ITS Innovative Project
finalits innovative arterial bluetooth concept of operations report02222010.doc
information can be used in the models to provide estimates of average travel times along corridors. One example is the “SMART-Signal” system developed by the University of Minnesota. It uses signal phase information and upstream vehicle detection to calculate queue lengths at signalized intersections, identifying traffic state changes for queue forming and discharging during the respective last cycle. This information then is used to model the “average vehicle” along the arterial through a sequence of monitored intersections.
5.2 PROBE TECHNOLOGIES
Probe technologies use unique vehicle characteristics – a “signature” – to identify and track individual vehicles. As shown in Figure 4 (similar link configuration as Figure 3), a vehicle is identified at point A at time = T1, and then again at point B at time = T2, with T2-T1 representing the travel time for that vehicle along link AB. Tracking multiple vehicles as they traverse the link provides the average travel time and the space mean speed for the link. This direct measurement of travel times and space mean speeds for arterial links provides greater accuracy than the “average vehicle” spot sensor. All the potential variables that need to be captured from spot sensor data (located at discrete points along an arterial) are incorporated into the measurements provided by the probe technology.
Current solutions for defining the vehicle “signature” can be divided into two groups – those requiring some form of infrastructure, and those that don’t. Several factors must be considered when evaluating these various technologies; penetration/sample size of the vehicles whose signature will be identified and tracked, proven accuracy in measuring link travel times along arterials, privacy of the vehicle drivers (tracking could be used for other purposes), and cost. Some of these technologies and factors are briefly addressed below.
5.3 INFRASTRUCTURE-BASED PROBE TECHNOLOGIES
These approaches involve the installation of “readers” or “antennae” at intervals along the roadway (e.g., link nodes) to identify a device within the vehicle that provides a unique
Time = 0 sec
½ mile ¾ mile
A B C
Time = 75 sec Time = 165 secTime = 0 sec
½ mile ¾ mile
A B C
Time = 75 sec Time = 165 sec
FIGURE 4 PROBE DATA

Arterial Travel Time Monitoring System Using Bluetooth Technology Version 2
Page 12
Mn/DOT ITS Innovative Project
finalits innovative arterial bluetooth concept of operations report02222010.doc
identifier of that particular vehicle. Vehicles with such devices are identified at locations along the roadway along with time stamps, and a software algorithm matches the signatures/ timestamps collected at the different sites and provides travel time information.
Toll tag monitoring. This makes use of existing toll tags, with readers placed at intervals along the roadway to define the links. Several agencies (Colorado, Northeast U.S.) are using this technology (i.e., the TRANSMIT system) to collect travel time and average speed information as well as incident detection. There has been limited installation along arterials. Moreover, the use of this technology is highly dependent on the local toll tag penetration.
Automatic License Plate Readers (ALPR). This approach is a camera-based system that utilizes infrared illuminators and image-processing technology to identify vehicles via their license plates via Optical Character Recognition (OCR) technology. ALPR technology is widely used for toll and congestion pricing enforcement and (more recently) for Homeland Security applications. A Florida test of ALPR to measure travel times along a single arterial link showed that the travel time calculation was 99% accurate. As all vehicles have license plates, this technology would be expected to yield the highest capture rate (although the accuracy of ALPR for US plates is typically 75- 90%). The major concern with the ALPR approach is the cost. It generally has the greatest cost per device of the infrastructure-based technologies. Moreover, given its use for Homeland Security applications, individual privacy could become a significant issue in moving this approach forward.
Bluetooth technology. Bluetooth is a standard short range radio link intended to replace the cable connecting portable and/or fixed electronic devices. MAC addresses are unique 48-bit addresses that are assigned by manufacturers of consumer electronic wireless devices such as cell phones, hands-free headsets, and MP3 players. This approach involves the installation of Bluetooth receivers and antennae at various locations along an arterial to detect and identify these unique device MAC addresses (e.g., hands free cell phones) as they traverse the arterial. An important element of this type technology is the use of GPS to ensure accurate measurement of distances between successive collection points. Another important consideration is that of privacy – unlike toll tags and ALPR, there is no traceable relationship between the device’s MAC address and the owner/user of the device. Bluetooth receivers and central processing software are available from a number of vendors. Bluetooth based travel time measurements are being used as the baselines by the I-95 Corridor Coalition for the on-going evaluation of INRIX data along both freeways and arterials.

Arterial Travel Time Monitoring System Using Bluetooth Technology Version 2
Page 13
Mn/DOT ITS Innovative Project
finalits innovative arterial bluetooth concept of operations report02222010.doc
5.4 PROBE TECHNOLOGIES NOT REQUIRING ROADSIDE INFRASTRUCTURE
These technologies and concepts do not require any roadside infrastructure. This offers several advantages in terms of deployment time and not requiring permits or approvals for installing additional field hardware along the arterials. Another difference is that, unlike the concepts discussed above (i.e., with discrete points along the arterial where the signature is read), these technologies permit continuous tracking of vehicles.
Cellular Phone Probes. This technology, also called Wireless Location Technology (WLT), takes advantage of the fact that cell phones, once turned on, passively seek out the closest carrier towers to prepare for the possibility of a call. This passive signaling activity occurs in the background as long as the phone is turned on. As phones move down the road, they move across cell boundaries, still maintaining contact with other towers, creating additional useable signaling. Using the relative signal strength and time offset of a cell phone’s received radio signal at these multiple (closest) cellular towers (i.e., triangulation), coupled with GIS highway data, a phone’s latitude/longitude coordinate locations can be tracked2 to provide average travel time and average speed information along roadway segments. This technology does require agreements cell phone service providers to provide cell phone coordinates. The tracking of individual cell phones could become a privacy issue. Accuracy along an arterial may also be an issue as a system must be able to correctly distinguish between cell phones located in a vehicle and those that are used by pedestrians. An independent 3rd party testing firm performed an evaluation of AirSage, a provider of cell phone based travel data, using the floating car technique as the baseline. Both freeways and arterials were evaluated. The arterial tests were performed in Detroit and New York with the following published results:
o In Detroit, AirSage correctly detected congestion 84% of the time on arterials. Congestion was defined as speeds of less than 25mph on arterials. All of the arterial roads in Detroit had a posted speed limit of 50 mph.
o In New York, AirSage correctly detected congestion 92% of the time on arterials. Congestion was defined as speeds of less than 25 mph on arterials. 92% of the arterial segments tested had a posted speed limit of 35 mph.
Detecting “congestion” is only part of what an arterial travel time monitoring system requires – accurate information for multiple speed/travel time ranges is necessary. Nevertheless, these results are very encouraging.
GPS - Equipped Vehicle Fleets. This technology tracks vehicles equipped with GPS (Global Positioning System) receiver. This approach is the core domain of INRIX, a
2 Smart phones equipped with a GPS chip can provide the location information via GPS.

Arterial Travel Time Monitoring System Using Bluetooth Technology Version 2
Page 14
Mn/DOT ITS Innovative Project
finalits innovative arterial bluetooth concept of operations report02222010.doc
company that collects and aggregates real-time data from over one million commercial fleet, delivery and taxi vehicles (under agreements with these fleet owners). Inrix has deployed large scale travel time monitoring projects nationwide – the largest being for the I-95 Corridor Coalition (http://www.i95travelinfo.net/. Given the agreements with the fleet owners, privacy is not an issue. While INRIX has been providing accurate data along the limited access roadways within the I-95 corridor, this may be an issue for application along arterials due to the sample size and the fact that commercial vehicles do not behave as other vehicles in an arterial traffic stream. (The I-95 Travel Info website only shows freeway data). Results of the arterial validation have not yet been published.
5.5 ADDITIONAL CONSIDERATIONS
The issue of segmentation defines the spatial granularity of the system. All points along a specific link (e.g., from intersection A to intersection B) are assumed to have the same operational characteristics (e.g., display the same color indicating average speed/level of congestion on a graphical map display). With the infrastructure-based probe technologies, the link segmentation is determined by number of “readers” installed and where they are located. The commercial data providers (e.g., AirSage, INRIX) define their segments based on the industry-standard Traffic Location Tables developed for the Traffic Message Channel (TMC) – a standard used for navigational devices (i.e., Navtec and Teleatlas). These TMC-standard segments for arterials are typically several miles in length, and may not meet the needs of the operating agency.
This pilot deployment will provide the documentation to identify additional operational needs that support the deployment of an arterial travel time system.

Arterial Travel Time Monitoring System Using Bluetooth Technology Version 2
Page 15
Mn/DOT ITS Innovative Project
finalits innovative arterial bluetooth concept of operations report02222010.doc
6.0 SYSTEM OVERVIEW AND CONCEPT
The Concept of Operations is one of the first steps to the successful deployment of this project. As discussed in the introductory section, a Concept of Operations generally does not delve into technology. But given the nature of this project – demonstrating and evaluating innovative ideas and technologies – some of the technological concepts are discussed in this section. Additional details will be provided in subsequent project documents including the functional requirements and system design. The proposed arterial travel time monitoring system is an “infrastructure-based probe” concept utilizing Bluetooth technology. The unique identifier (i.e., “signature”) for each vehicle is the unique device MAC address for a Bluetooth device located within the vehicle (e.g., hands free communications for cell phones). The MAC addresses are read and time-stamped by Bluetooth antennae as the vehicles traverse the arterial. This information is transmitted to a central processor where a software algorithm matches the vehicle signatures and time stamps collected at the different locations along the arterial to calculate the link3 travel times for each vehicle identified by the system. For example, as shown in previous Figure 3, a vehicle is identified at point A at time = 0 seconds, and then again at point B at time = 75 second, with “75-0 = 75 seconds” representing the travel time for that vehicle along link AB. The individual link travel times of multiple vehicles are then combined to calculate the average travel time and average speed for each arterial link.
6.1 BLUETOOTH TECHNOLOGY
Bluetooth is a standard short range radio link intended to replace the cable connecting portable and/or fixed electronic devices. Bluetooth radio operates in the unlicensed ISM band (2.4 GHz spectrum) and uses frequency hopping spread spectrum technology. It accomplishes spectrum spreading by frequency hopping in 79 hops displaced by 1 MHz, starting at 2.402GHz and finishing at 2.480GHz. A guard band is used at the lower and upper band edge. Each Bluetooth device uses the unique MAC address to establish communication with a target device – in the case of the arterial travel time monitoring system, Bluetooth receivers installed along the arterial. Bluetooth uses ‘inquiry mode’ to establish a link between a pair of devices. These inquiries are made even when a Bluetooth device is ‘paired’ with another device (e.g., headset and a cell phone), thereby allowing a Bluetooth receiver to pick up the MAC address when the device passes by within the respective range. The Bluetooth receiver assemblies also include GPS capability to ensure accurate measurement of distances between successive collection points.
3 A link is defined as a one-way segment between successive antennae locations

Arterial Travel Time Monitoring System Using Bluetooth Technology Version 2
Page 16
Mn/DOT ITS Innovative Project
finalits innovative arterial bluetooth concept of operations report02222010.doc
A Bluetooth receiver has a nominal coverage of a 330 foot radius; although the actual effective range of a Bluetooth receiver is also dependant on the strength (measured in dB) of the Bluetooth devices. A Bluetooth device (i.e. a vehicle equipped with a Bluetooth device) may be detected immediately when it enters the zone, not until it leaves the zone, somewhere near the middle of the coverage zone, or multiple times. (Refer to Figure 5). This introduces a margin of error in the calculation of travel times. The measured time might be for a maximum distance of D+2R, or a minimum distance of D-2R, or anywhere in between (e.g., D). As the value of R is relatively fixed (at about 330 feet), the greater the distance D between successive receivers, the smaller the potential margin of error. Initial studies on the use of Bluetooth technology recommend spacing receivers at least at two-mile distance, which would result in a maximum measurement error based on the actual location of the detected device of 6%. The proposed configuration (refer to previous Figure 2) calls for spacing of 1.7 to 3 miles between readers along the arterial.
FIGURE 5 BLUETOOTH RANGE AND MEASUREMENT ERROR
6.2 PROPOSED HARDWARE, LOCATIONS AND INSTALLATION NEEDS
Another potential issue with Bluetooth technology and the nominal coverage area involves the ability to detect vehicles travelling in both directions along an arterial. Depending on the location of the Bluetooth receiver antenna, the width of the arterial, and the signal strength of the Bluetooth devices in the vehicles, it may not be possible to detect vehicles in both directions without two sets of receivers at each location – one on each side of the arterial. Given the nature of this project (i.e., demonstrate a new technological approach and its effectiveness), it was determined that this was not a viable approach. Accordingly, the system concept assumes that only one receiver will be installed at each location between the two end points of the monitored corridor, although they will be installed at alternating sides of the arterial. Moreover, two receivers will be installed at the end points of the arterial test area. This

Arterial Travel Time Monitoring System Using Bluetooth Technology Version 2
Page 17
Mn/DOT ITS Innovative Project
finalits innovative arterial bluetooth concept of operations report02222010.doc
approach will guarantee that at least three (3) subsequent travel time pairs will be measured in each direction (northbound and southbound). A field survey and analysis of the proposed locations was undertaken. Tests were performed using mobile Bluetooth data readers (using the StreetWave hardware provided by Savari), elevated to a likely position on the target pole (just above the horizontal mast arm) using a bucket truck. The primary purpose of the survey was to test signal strength from Bluetooth devices in both directions of traffic (i.e., near and far relative to the reader/antenna location), and check the existence of Wi-Fi networks at the implementation locations to rule out possible interference. The results validated the overall feasibility of using Bluetooth technology to detect and uniquely identify vehicles. The test population consisted of a manual count of 100 vehicles passing NB or SB, plus the added vehicles EB and WB at that location as applicable. In general, side directional traffic added 20 to 50 more vehicles. At each location, between 5% and 10% of a sampled vehicle population showed a Bluetooth registration while passing the test locations. Based on the results of other probe-based detection systems, this level of capture should be more than sufficient to obtain accurate travel time results. The location of the readers and expected main direction of captured traffic are summarized below:
TABLE 2: PROPOSED DEPLOYMENT LOCATIONS
Intersection Mounting Location Captured Traffic
81/Green Haven Dr. NE and SW corner NB and SB
81 / Broadway SW Corner
(Perhaps median as an alternative)
SB
NB and SB if located on median
81 / 63rd St NE corner NB
81 / Bass Lake Rd SW corner SB
81 / 42nd St NE corner NB
81 / 36th St NW and SE corner NB and SB
Field tests were also conducted regarding antenna positioning and selection. Tests were performed at four of the intersection using Omnidirectional and Microcell Hemi antennas. Yagi antennas were not recommended due to environmental risks (lightning). The comparison of results with Omni and Microcell Hemi antennas appear to indicate that in case of a positioning of the antenna in the median, an omnidirectional antenna may provide a slightly better

Arterial Travel Time Monitoring System Using Bluetooth Technology Version 2
Page 18
Mn/DOT ITS Innovative Project
finalits innovative arterial bluetooth concept of operations report02222010.doc
capture, whereas a Microcell Hemi antenna appears to provide better capture from the side of the road. However, the differences are relatively minor.
6.3 POWER
The proposed Bluetooth device will need to use 24 v dc. The current plan at each traffic signal pole is to provide a field hardened 120 v ac to 24 v dc converter to allow the traffic signal power supply to step down to the low voltage Bluetooth device.
6.4 COMMUNICATIONS
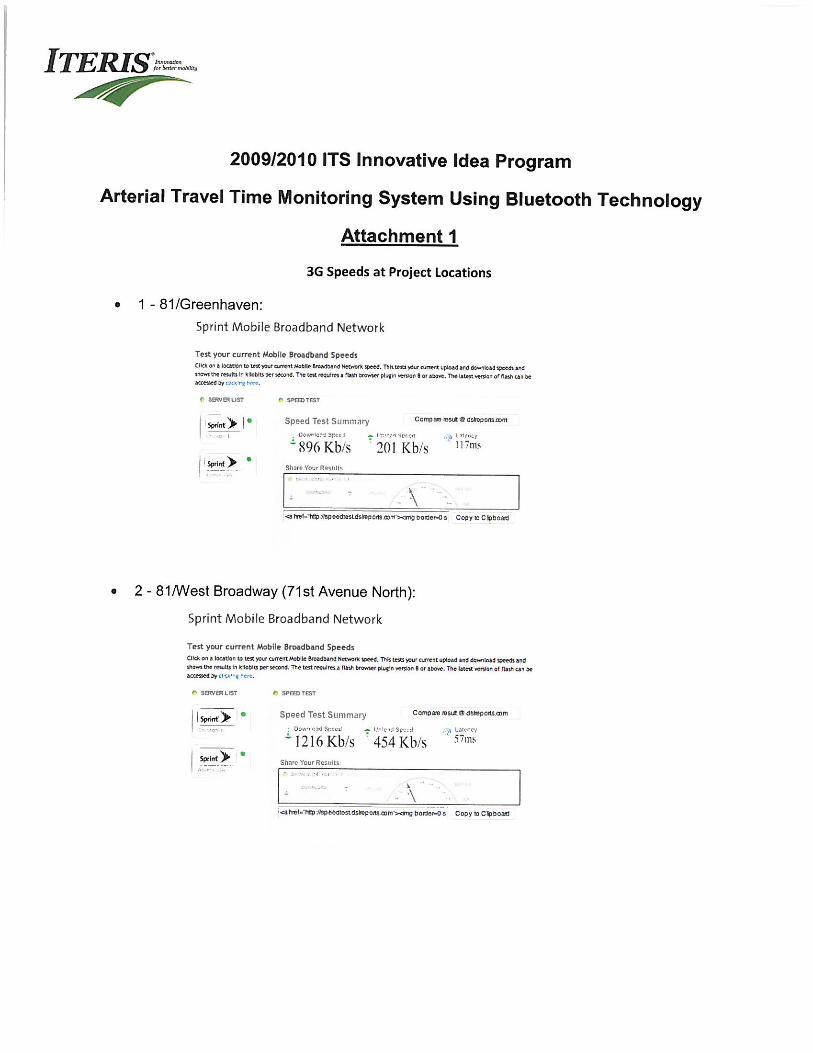
A wide array of communication alternatives can be used for transmitting the MAC addresses, time stamps, and location information to a central location for subsequent processing. As there is not an existing county–owned communications network along the arterial with spare bandwidth, and in the interest of minimizing costs and implementation schedule, the decision was made to use a 3G wireless provider, installing a 3G modem at each intersection where the Bluetooth readers are also installed. This approach – with each intersection communicating independently with central software – also ensures there is no single point of failure for communication. During the field surveys, tests were also conducted on the Sprint 3G network that is proposed for the system. The salient results of the test are noted below:
At all device locations, 3G download speeds ranged between 500kbps and 1.5Mbps. Upload speeds ranged from 200kbps to 550kbps. This is more than enough to satisfy the data communication requirements of the project.
Network latency at all sites was between 57ms and 117ms.
Wi-Fi interference was measured at the site locations. It is expected that the interference will not significantly affect the project execution.
6.5 DATA PROCESSING
Data collected at the intersection will be aggregated on a one-minute basis before being transmitted to a central server. As previously noted, the central software algorithm will match the MAC signatures and time stamps collected at the different sites to calculate the travel time for each captured vehicle for each link. The information will be aggregated together on a user-definable time period (e.g., 3 minutes, 5 minutes, 10 minutes, 15 minutes, 1 hour) to provide average link travel times and average link speeds. The central software algorithm will also include a data smoothing feature, such that outliers (e.g., those reads that are greater than x times the standard deviation from the mean and/or y percent of the lowest measured travel times) are removed from the data used in subsequent aggregation and displays. This is an important consideration along an arterial where some vehicle can be expected to make stops at businesses located along the links.
Arterial Travel Time Monitoring System Using Bluetooth Technology Version 2
Page 19
Mn/DOT ITS Innovative Project
finalits innovative arterial bluetooth concept of operations report02222010.doc
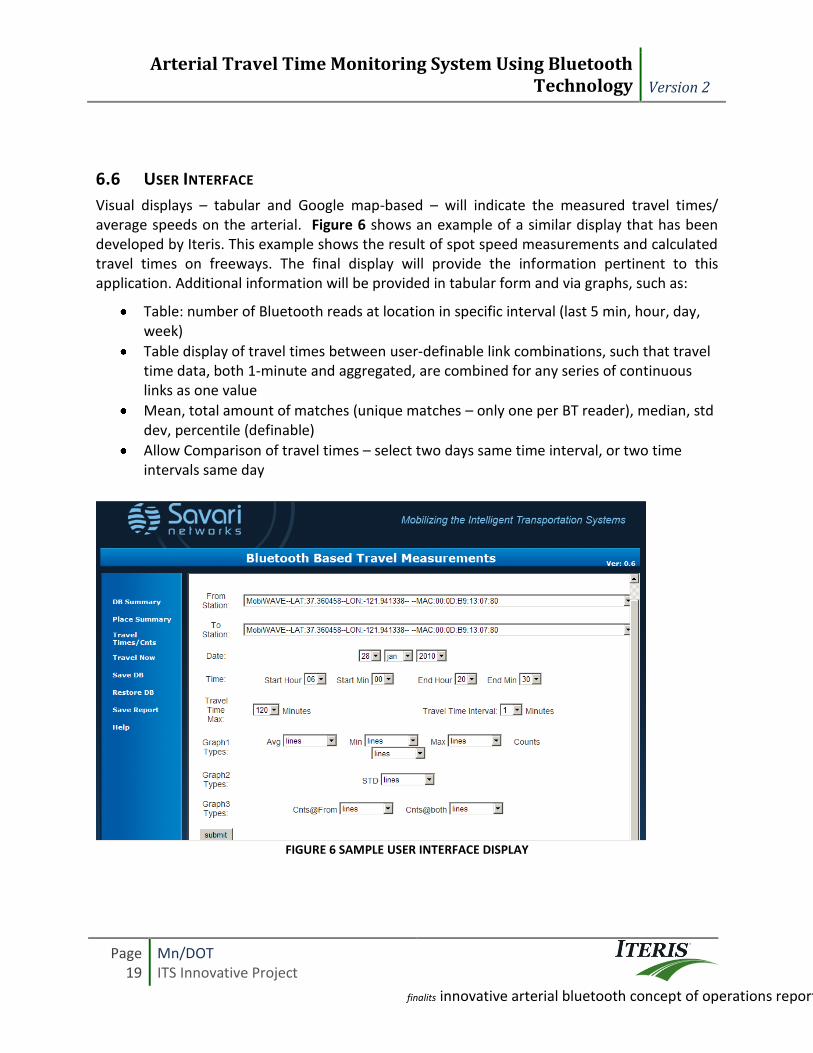
6.6 USER INTERFACE
Visual displays – tabular and Google map-based – will indicate the measured travel times/ average speeds on the arterial. Figure 6 shows an example of a similar display that has been developed by Iteris. This example shows the result of spot speed measurements and calculated travel times on freeways. The final display will provide the information pertinent to this application. Additional information will be provided in tabular form and via graphs, such as:
Table: number of Bluetooth reads at location in specific interval (last 5 min, hour, day, week)
Table display of travel times between user-definable link combinations, such that travel time data, both 1-minute and aggregated, are combined for any series of continuous links as one value
Mean, total amount of matches (unique matches – only one per BT reader), median, std dev, percentile (definable)
Allow Comparison of travel times – select two days same time interval, or two time intervals same day
FIGURE 6 SAMPLE USER INTERFACE DISPLAY

Arterial Travel Time Monitoring System Using Bluetooth Technology Version 2
Page 20
Mn/DOT ITS Innovative Project
finalits innovative arterial bluetooth concept of operations report02222010.doc
7.0 OPERATIONAL SCENARIOS
The development of a Concept of Operations that is performed through detailed discussions with project stakeholders is an important task. Through this discussion the systems engineering process can be consistently documented with expected events. The scenarios should encompass different users and stakeholders over a variety of circumstances. The following operational scenarios were discussed with the stakeholders of this project to better understand the potential interface with existing Hennepin County and Mn/DOT systems, and the expansion, potential limitations and accuracy of the Bluetooth Arterial system.
7.1 SCENARIOS
The first two scenarios will focus on elements of the current Bluetooth Arterial demonstration project. The remaining scenarios will focus on long-term operations, integration and maintenance of the project’s field devices and data. Scenario # 1 - Operator Access and Evaluation of Pilot Website During the pilot evaluation phase, Hennepin County and Mn/DOT log onto the website to review the project and identify future enhancements to the system or website. These enhancements will be documented in writing and discussed among agency representatives including the following groups:
Mn/DOT Metro Traffic
Mn/DOT RTMC Operations
Mn/DOT ITS-Office of Traffic, Safety, and Technology (OTST)
Mn/DOT Metro Planning
Mn/DOT Transportation Data Analysis
Hennepin County TMC Data will be summarized and reviewed off-line. The operators logging into the website will determine that the system is working properly by noting the presence of all devices and the presence of data being supplied by devices.
Scenario # 2 - System Maintenance of the Pilot Deployment During the pilot evaluation phase, a thunderstorm rolls through and a number of the Bluetooth readers stop reporting information. Hennepin County staff notices this problem. The system needs field maintenance and troubleshooting. To prepare for this scenario, both Hennepin County and Mn/DOT staff will receive training from Savari Networks on the maintenance of the system, including determining whether

Arterial Travel Time Monitoring System Using Bluetooth Technology Version 2
Page 21
Mn/DOT ITS Innovative Project
finalits innovative arterial bluetooth concept of operations report02222010.doc
components are functioning, how to configure replacement components (which will be stored at Hennepin County facilities), how to install replacement components, and how to confirm that normal operation has been restored. Any loss of operation would be documented by Hennepin County staff, who would then schedule field maintenance for the next work day or later, depending on County priorities. The system will not receive maintenance after hours or if overtime maintenance resources are required in order to do so. Hennepin County staff will check the system daily via remote computer software for proper operation. Scenario # 3 - User Scenario (FUTURE) A worker at North Memorial Medical Center is leaving work and wants to understand current traffic conditions along CSAH 81. Additionally, construction along the route has established a detour around a segment of the corridor. For this scenario, the stakeholders were not yet prepared to define the needs of ultimate ATIS users of the system. Yet some general activities may be affected by an arterial travel time service, including support for route-by-route alerts being planned for the 511 traveler information system, despite the fact that the current system does not support arterial travel times. Hennepin County prefers to own the data but provide it to Mn/DOT for dissemination to the public. Ultimately the collected data will be stored under the care of the county but supplied in real time to Mn/DOT for reporting to the public. The stakeholders have agreed to assemble a consortium for handling the management of the data. They will have to determine how long the data will be archived, and on what system it will be stored. Scenario # 4 Travel Time Application Areas (FUTURE) This scenario is actually a scenario describing end uses for the data as the basis for planned and prioritized growth of an arterial travel time system. The agencies have not yet formulated strategies for use of the data, and at present are primarily interested in understanding what is made possible by the technology and the accuracy of the technology. As a baseline for strategic growth of the system, this scenario should be viewed as speculative for future system connectivity and expansion.

Arterial Travel Time Monitoring System Using Bluetooth Technology Version 2
Page 22
Mn/DOT ITS Innovative Project
finalits innovative arterial bluetooth concept of operations report02222010.doc
ATIS Applications One key application for travel time information is in reporting link-based performance to the motoring public using any of a variety of delivery mechanisms. The 511 system and its associated web page are the most obvious potential delivery mechanisms, but others may emerge, including such uses as mobile applications, text messages to subscribers, displays on dynamic message signs, and a wide range of other possibilities. For all these, however, the emphasis is on empowering travelers to make good, personal decisions about route choice, departure time choice, and mode choice. In addition to travel time, the traveler may need to understand the reliability of travel time. While it is generally acknowledged that reliability is a key feature, research is still emerging to better understand how reliability should be assessed and characterized. Thus, this project cannot yet anticipate how reliability should be summarized and reported. In order to provide a measure of reliability, travel time data for the most recent five minutes must be able to be compared against similar periods from similar days. Also the stream of travel time data needs to be available for subsequent reliability analysis to be determined in the future. While this need is still unclear, it will lead to requirements for the storage of travel time data for long enough periods of time to allow daily, weekly, holiday and seasonal patterns to be considered, as well as long-term trends. A traveler may also assess reliability on the basis of incidents. It is not anticipated that incidents need to be identified by a travel time system, but the effects of incidents can be assessed during the incident life cycle. A linkage to incident data in a future system will make it possible to evaluate archived travel time information in response to incidents, which will support the ability to predict the impact of incidents as part of reporting reliability to travelers. Mn/DOT, as the primary disseminator of traveler information in support of route, departure time, and mode choice, has the highest need for the data in support of that application. Arterial Management Applications The operation of arterial streets is dominated by the effect of traffic signal operation. In the region, two different approaches to traffic signal operation are employed, including real-time adaptive control and fixed coordination patterns with local actuation. Both approaches require periodic evaluation to determine whether they need to be adjusted or even whether new timings should be developed. Determining whether signal operation has degraded over time requires evaluating long-term operational effects. Link-based travel times provide sufficient information to make these assessments. From link-based travel times, intersection delay can be

Arterial Travel Time Monitoring System Using Bluetooth Technology Version 2
Page 23
Mn/DOT ITS Innovative Project
finalits innovative arterial bluetooth concept of operations report02222010.doc
estimated as long as the travel times are representative of the whole travel stream with reasonable accuracy. This means that link-based travel times need to report the average travel time for all the vehicles on the approach, rather than for occasional individual vehicles. The operation of the signals will be assessed when these changes are made to ensure that they are performing as well as possible under the demand conditions presented to them. Evaluating signal timing usually requires understanding signal progression and where normal platoons of vehicles might be undesirably stopped. For this assessment, time/distance trajectories provide a means of evaluating where vehicles are forced to stop within each link, which provides the basis for determining breakdowns in signal progression, either as designed in a coordination plan or as achieved by real-time optimization in an adaptive system. Small samples of high-resolution trajectory data are preferred for this evaluation. Link-based travel times may not provide the trajectory resolution necessary for this application, and because of this, instrumented probe vehicles on an infrastructure-based trajectory reporting system will be needed. Onset of congestion determination is another possible objective for link-based travel times. To report the onset of congestion, a system needs to evaluate the presence of growing residual queues on an approach. Growing residual queues will be marked by a spike in link-based travel times for the link containing the queue. During congestion residual queues remain after the green period terminates, and the link travel time for vehicles in the residual queue increases by about the length of one signal cycle on average. A growing residual queue, therefore, requires several signal cycles to become visible. The system needs to be able to record spikes in link travel times over a period of several signal cycles, which suggests (as was the case for the previous scenario) about a five-minute measurement and reporting horizon. These potential applications apply to the agency responsible for operating and maintaining the traffic signals in the area. Hennepin County, as the traffic signal operator in the test system, will therefore represent the bulk of the needs described by these application scenarios. Planning Applications For long-term planning purposes, planning agencies generally use traffic flow in a vehicles per hour format as a basic measure of demand. It is not anticipated that a Bluetooth system that provides link-based travel times will be able to provide traffic volumes with sufficient resolution to support planning needs. Planning priorities, however, are often influenced by the need to relieve congestion. A link-based travel time system can support planning activities by providing a clear map of where and when congestion is occurring in the form of long residual queues and the associated long travel times and high delays. These congestion assessments affect not only the future design of local streets but also of through routes, freeway diversion routes for incidents, and general network demand modeling that has sufficient resolution to avoid or

Arterial Travel Time Monitoring System Using Bluetooth Technology Version 2
Page 24
Mn/DOT ITS Innovative Project
finalits innovative arterial bluetooth concept of operations report02222010.doc
minimize assigning demand to network links that are already congested. Planning horizons for which link travel time data will be useful include at least the support for the development of three-year transportation improvement programs, with the ability to assess conditions for the two years prior to that. Thus, Hennepin County, Mn/DOT and regional planning agencies have equal need in this application area. Scenario 4 Summary The following table summarizes these applications, the relevant stakeholder, the data needed, and the period for which the data needs to be kept.
TABLE 3: ARTERIAL BLUETOOTH SCENARIO APPLICATION SUMMARY
Future Application Area
Primary Stakeholder
Spatial Resolution
Time Measurement Resolution
Archive Period
Notes
ATIS Mn/DOT Link 5 Minutes 3 Years Linked to incident management system
Long-Term Signal Evaluation
Hennepin County
Link 5 Minutes 5 Years
Current Signal Operation Evaluation
Hennepin County
150 Feet 2 Second < 1 Year Unattainable with Bluetooth and other point-based technologies
Operational Congestion Assessment
Hennepin County
Link 5 Minutes
Planning Congestion Assessment
Mn/DOT, Hennepin Co., Planning Agencies
Link 5 Minutes 5 Years Daily data can be summed for archiving based on weekly and seasonal patterns.

Arterial Travel Time Monitoring System Using Bluetooth Technology Version 2
Page 25
Mn/DOT ITS Innovative Project
finalits innovative arterial bluetooth concept of operations report02222010.doc
7.2 HIGH-LEVEL REQUIREMENTS
Three primary high-level requirements were developed based on the stakeholder discussion of the scenarios. This pilot deployment will focus on knowledge transfer to Hennepin County and Mn/DOT regarding this relatively new technology. To accomplish this, the focus will be toward participation and demonstration of the system hardware, the communications and the system software. The system software will be used to evaluate the accuracy of travel time along the arterial when compared to field data collection of travel time during the same time periods. High-Level requirements are identified below and expanded in the appendix: System Hardware -- Bluetooth Receiver (Savari StreetWave)
Installation Training Maintenance Documentation
Communications -- Leased Field Test
Maintenance Documentation
System Software -- Bluetooth Interface
Access Recovery Data Storage Reporting

Arterial Travel Time Monitoring System Using Bluetooth Technology Version 2
Page 26
Mn/DOT ITS Innovative Project
finalits innovative arterial bluetooth concept of operations report02222010.doc
8.0 SYSTEM EVALUATION
8.1 OVERVIEW OF EVALUATION PLAN
Where the intent of the end-to-end system testing performed in Task 6 is to verify that the installed system satisfies all the functional requirements (e.g., data collected and analyzed, time frames for collection and analysis, information displays), the focus of the evaluation task is to determine the accuracy and potential value of the collected information. In other words, the purpose of the Task 8 evaluation effort is to determine whether or not the Arterial Travel Time Measurement System – and the concepts on which it is based – adequately address the “problem statement” posed at the beginning of the proposal, specifically: “obtain reliable and accurate travel time information along an arterial network in a cost-effective manner”. The approach and process for evaluating the system will be documented in an “Evaluation Plan”. The proposed approach includes the following activities:
Conduct “floating car” travel time runs along both directions of the arterial for three consecutive weekdays – a Tuesday, Wednesday, and Thursday – for a period of seven hours per day (i.e., two hours during the AM peak, three hours during the off-peak, and two hours during the PM peak).
Record the following information each travel time run:
o Starting point (intersection) and time (day: hour: minute: seconds)
o Time (day: hour: minute: seconds) the stop bar of each of the Bluetooth-equipped intersection is reached
o Any operational anomalies during the travel time run (e.g., signal failure/on flash, incident).
Input the collected information into a preferred database application for analysis, providing information on the travel time per link for each run, the average travel time for each link per period (including standard deviation), and the average travel time for each link per time period over the three day evaluation period (including standard deviation).
Aggregate the raw travel time data collected by the system, using the same format, links (by direction) times, periods, days, etc. as the travel time runs.
Collect tube counts (by direction) at three locations along the arterial during the same period that the travel time runs are made.
Compare and analyze the information collected by the system with the comparable information obtained from the travel time runs, identifying any differences between the two, the nature of the variations, any consistencies or inconsistencies of the results, etc.

Arterial Travel Time Monitoring System Using Bluetooth Technology Version 2
Page 27
Mn/DOT ITS Innovative Project
finalits innovative arterial bluetooth concept of operations report02222010.doc
Develop statistics regarding the capture rate and sample size (i.e., number of matched pairs of MAC addresses per link compared to the total volume), and correlate this information with the accuracy of the travel time information as appropriate.
Another component of the evaluation will be to identify the appropriate “data smoothing” parameters so as to minimize the differences between the information collected by the system and the travel time data. (Note – The proposed system includes a user-definable data smoothing feature, such that x-percent of the reads with the highest travel times, and y-percent of the lowest travel times, are removed from the data used in subsequent aggregation and displays). In addition to identifying the optimum parameters in this regard, the logic behind selecting these parameters will also be considered.
Arterial Travel Time Monitoring System Using Bluetooth Technology Version 2
Page 28
Mn/DOT ITS Innovative Project
finalits innovative arterial bluetooth concept of operations report02222010.doc
9.0 NEXT STEPS
The next steps for this project include the development of functional requirements, plan development and detailed design specifications for the six Bluetooth intersection installations. The Bluetooth devices will be installed in the field during Spring 2010.

Arterial Travel Time Monitoring System Using Bluetooth Technology Appendix A
Mn/DOT ITS Innovative Project
finalits innovative arterial bluetooth concept of operations report02222010.doc
APPENDIX A: FIELD SURVEY RESULTS


Arterial Travel Time Monitoring System Using Bluetooth Technology Appendix B
Mn/DOT ITS Innovative Project
finalits innovative arterial bluetooth concept of operations report02222010.doc
APPENDIX B: TRAFFIC DATA CSAH 81


Arterial Travel Time Monitoring System Using Bluetooth Technology Appendix C
Mn/DOT ITS Innovative Project
finalits innovative arterial bluetooth concept of operations report02222010.doc
APPENDIX C: INRIX CONCEPT OF OPERATIONS

BLUETOOTH TRAFFIC MONITORING---
CONCEPT OF OPERATION &DEPLOYMENT GUIDELINES
July 17, 2008
Introduction to Bluetooth Traffic Monitoring:
The University of Maryland has developed a probe technique to monitor the travel time on highways and arterials based on signals available from the point-to-point networking protocol commonly referred to as Bluetooth. The majority of consumer electronic devices produced today come equipped with Bluetooth wireless capability to communicate with other devices in close proximity. For example, many digital cameras use Bluetooth for downloading pictures to a laptop computer. It is also the primary means to enable hands free use of cell phones. Bluetooth enabled devices can communicate with other Bluetooth enabled devices anywhere from 1 meter to about 100 meters, depending on the power rating of the Bluetooth sub-systems in the devices.
The Bluetooth protocol uses an electronic identifier, or tag, in each device called a Machine Access Control address, or MAC address for short. The MAC address serves as an electronic nickname so that electronic devices can keep track of who’s who during data communications. It is these MAC addresses that are used as the basis for obtaining traffic information. The concept for deriving traffic information in this manner is illustrated in Figure 1.
2 miles
BluetoothDetectors
BluetoothSignal
Time = 8:04:26 AM
Time = 8:06:58 AM
Travel Time = 2:32 MinutesSpeed = 47.4 MPH
2 miles
BluetoothDetectors
BluetoothSignal
Time = 8:04:26 AM
Time = 8:06:58 AM
Travel Time = 2:32 MinutesSpeed = 47.4 MPH
Figure 1 Bluetooth traffic monitoring operation concept
Privacy Concerns
The anonymous nature of this technique is due to the use of MAC addresses as identifiers. MAC addresses are not directly associated with any specific user account (as is the case with cell phone geo-location techniques) or any specific vehicle (as is the case with deriving travel time from automated toll tags). The MAC address of a cell phone, camera, or other electronic devices, though unique, is not linked to a specific person through any type of central database, thus minimizing privacy concerns. Additionally, users concerned with privacy can set options in their device (referred to as ‘Discovery Mode’ or ‘Visibility’) so that the device will not be detectable.
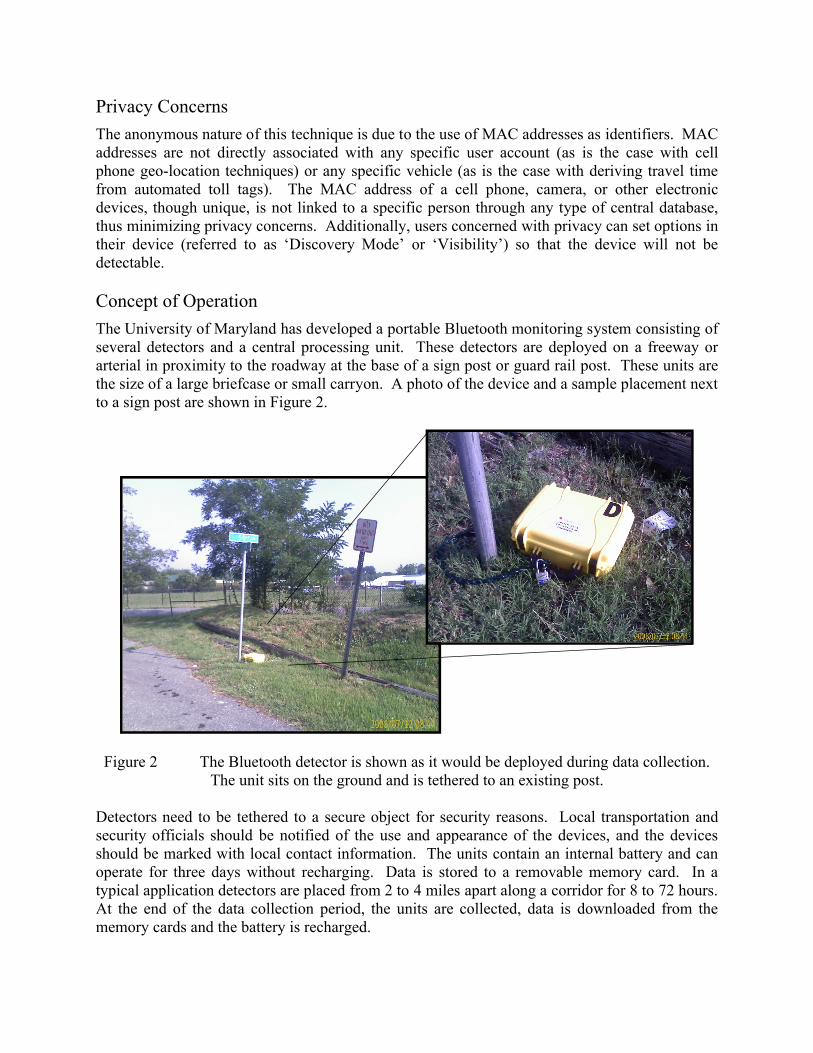
Concept of Operation
The University of Maryland has developed a portable Bluetooth monitoring system consisting of several detectors and a central processing unit. These detectors are deployed on a freeway or arterial in proximity to the roadway at the base of a sign post or guard rail post. These units are the size of a large briefcase or small carryon. A photo of the device and a sample placement next to a sign post are shown in Figure 2.
Figure 2 The Bluetooth detector is shown as it would be deployed during data collection. The unit sits on the ground and is tethered to an existing post.
Detectors need to be tethered to a secure object for security reasons. Local transportation and security officials should be notified of the use and appearance of the devices, and the devices should be marked with local contact information. The units contain an internal battery and can operate for three days without recharging. Data is stored to a removable memory card. In a typical application detectors are placed from 2 to 4 miles apart along a corridor for 8 to 72 hours. At the end of the data collection period, the units are collected, data is downloaded from the memory cards and the battery is recharged.

Sample Data
Studies have indicated that approximately 1 automobile in 20 contains some type of Bluetooth device that can be detected, this is referred to as the penetration rate. Not every Bluetooth device is detected at every station so the number of matched detections (a device detected at two consecutive detectors) is lower than the penetration rate. Even so, a majority of the detected devices are seen at multiple stations. These matched pairs can be used to develop a sample of travel time for that particular segment of the roadway. Figure 3 shows data from a segment of Interstate I-495 between Washington, DC and Baltimore, Maryland between 6:30 AM and 12:45 PM. Each data point represents the travel time from a matched detection at each end of the segment. Figure 3 depicts the impact on travel time as a result of an incident that began around 10 AM, was cleared at approximately 10:50 AM and traffic returned to normal flow around 11:15 AM.
6 7 8 9 10 11 12 130
5
10
15
20
25
30
35
40
Time of Day
Tra
vel
Tim
e -
Min
ute
s
One Car’s Data
6 7 8 9 10 11 12 130
5
10
15
20
25
30
35
40
Time of Day
Tra
vel
Tim
e -
Min
ute
s
One Car’s Data
Figure 3 Sample Bluetooth data taken along a segment of I-495 between Baltimore and Washington, DC
Conclusion
The Bluetooth Traffic Monitoring provides an opportunity to collect high quality, high densitytravel times by sampling a portion of actual travel times from the traffic stream. By matching MAC addresses at two different locations, not only is accurate travel time measured, privacy concerns typically associated with probe systems are minimized. On a cost per data point basis, Bluetooth traffic monitoring are 1000 times more economical than drive testing. Applications for the probes include validation of existing systems, corridor travel time studies, arterial signal

synchronization, congestion performance measures, construction zone monitoring, and before and after studies of capital improvements.

Arterial Travel Time Monitoring System Using Bluetooth Technology Appendix E
Mn/DOT ITS Innovative Project
finalits innovative arterial bluetooth concept of operations report02222010.doc
APPENDIX D: AIRSAGE INFORMATION

AirSage Traffic Data Quality
Final Report – Executive Summary
530 Means St, NW, Suite 310
Atlanta, Georgia
Contact: William Bachman
(404) 588-1004
www.geostats.com
April 17, 2009
Proprietary and Confidential
This document contains proprietary and confidential information of GeoStats.
No disclosure or use of this information is permitted without prior written consent.

GeoStats Traffic Quality Report Confidential and Proprietary | Copyright © 2009 Page 1 of 10
Table of Contents
Table of Contents
Table of Contents Page 1
Executive Summary Page 2
Methodology Page 3
GeoStats GPS Data Processing and Results Page 3
GeoStats GPS Data Processing Procedures Page 4
Detroit Results Page 5
New York Results Page 7
San Diego Results Page 9

GeoStats Traffic Quality Report Confidential and Proprietary | Copyright © 2009 Page 2 of 10
Executive Summary
In October 2008, GeoStats, an independent, 3rd party testing firm, conducted traffic verification tests on
highways and arterials in Detroit, New York and San Diego to measure the overall quality of AirSage's real-
time traffic data. This test was not paid for by AirSage but by another 3rd
party interested in AirSage’s data
quality. GeoStats measured AirSage's data accuracy (i.e. did the actual driving results correspond to the
cellular data). This document is an abstract of the full GeoStats findings.
Detroit Highlights
In Detroit, AirSage correctly detected congestion 88% of the time on highways and 84% of the time on
arterials. Congestion was defined on highways as speeds of less than 45mph and speeds of less than 25mph
on arterials. All of the arterial roads in Detroit had a posted speed limit of 50mph.
New York Highlights
In New York, AirSage correctly detected congestion 93% of the time on highways and 92% of the time on
arterials. Congestion was defined on highways as speeds of less than 45mph and speeds of less than 25mph
on arterials. 92% of the arterial segments tested had a posted speed limit of 35mph and this most likely had
a positive influence on arterial results.
San Diego Highlights
In San Diego, AirSage correctly detected congestion 85% of the time on highways. A majority of the arterials
tested had a posted speed limit of 30mph and therefore arterial results are not included in this summary.
Congestion was defined on highways as speeds of less than 45mph In San Diego.

GeoStats Traffic Quality Report Confidential and Proprietary | Copyright © 2009 Page 3 of 10
Methodology
GeoStats collected ground truth data using multiple GPS probe vehicles in Detroit, New York and San Diego
during the month of October 2008. Probe vehicle drivers were dispatched on the same route but have start
times that were staggered at 15 minute intervals. All drivers repeatedly followed their route throughout a
three hour time block; these time blocks were primarily in rush hour in order to test congestion accuracy.
The resulting data is comprehensive enough to evaluate congestion life cycles and segment level speeds (as
typically reported in real-time traffic data).
The GPS data collected was compared to AirSage provided traffic data that corresponded to the GPS
collection timeframes to assess traffic data accuracy. This data was also analyzed and categorized for
Highways and Arterials. A greater amount of highway testing was conducted as these roads represent a
larger volume of drivers.
GeoStats GPS Data Processing and Results
Raw GPS data was processed in TravTime 2.0, a GPS-processing software created and maintained by
GeoStats. All AirSage segments for the routes driven were imported into TravTime and used to mark the
beginning and ending point for each segment. GPS speeds were calculated using the time traveled across
the segment and the segment distance. Instantaneous GPS speed points were not used in the analysis.
All segment and route data elements were reviewed visually and statistically to ensure that drivers were
performing as directed and that all final records were valid samples for comparison. All segments showing
average speeds less than 10 mph were visually verified to ensure that drivers did not deviate from their
routes. In addition to the segments, GeoStats also processed the GPS data as entire routes. This data was
also reviewed visually and statistically.

GeoStats Traffic Quality Report Confidential and Proprietary | Copyright © 2009 Page 4 of 10
GeoStats GPS Data Collection Procedures The following instructions were provided to drivers:
Basic Procedures
1. Plug GeoLogger into vehicle before you leave for your assignment and verify that everything
is connected and working properly. You should see a flashing light on the white box of the
GeoLogger. After a few minutes, the flash should switch from a slow pulse to a quick pulse,
indicating that the GPS receiver has determined its location.
2. Drive to your starting location. Be sure to arrive at least 5-10 minutes prior to the assigned
start time.
3. At the assigned start time, you should be entering the start / begin point of the assigned
route. It is very important that you start each assignment within 1-2 minutes of the
assigned start time since the project contract requires exact start times for each driver.
Car Following Rules
You are trying to be an “average” vehicle driving along this route:
• On multi-lane roads, this means that you drive with the flow of vehicles and try to calmly
pass the same number of vehicles that pass you. So if one vehicle passes by you, you must
pass another slower vehicle.
• Stay in the center or right lane unless you need to pass.
• On single-lane roads, do not pass. If you are stuck behind a slow moving vehicle which all
other vehicles are passing, then you may pass.
• If you make a wrong turn, make a written note (what, where, when), return to the location
where the error occurred, and continue in the correct direction. Be sure to contact the
project coordinator with this information.
• Avoid lines of vehicles waiting or slowing down to turn off of the primary road unless the
turn is part of your route
Stopping for Gas, Food, or Rest Room
If / when you need to stop, try not to stop in the middle of a run. Finish the run first (ie, go to the
end / turnaround point), then find a place to stop, and then continue.
Note on safety
Your safety is the top priority. Do not drive in an unsafe manner. If you feel uncomfortable with the
driving conditions of your ‘run’, stop at a safe location and call Billy Bachman, the GeoStats’ Project
Director.
Notes on GPS GeoLogger
The GPS antenna must be positioned on the roof of the car and the unit must be plugged into a
working cigarette lighter. Plug the device into the cigarette lighter as soon as you get in your car
and leave it plugged in and powered until you stop to turn the device back in. It is critical that the
red light is flashing on the logger every time you are collecting data during the assigned time periods
– you should look at the logger occasionally to confirm that it is flashing during each assigned
period.

GeoStats Traffic Quality Report Confidential and Proprietary | Copyright © 2009 Page 5 of 10
Detroit
In Detroit, ground truth drivers experienced congestion 33.9% of the time they were driving. The statistical
performance of the dataset from AirSage was very good. Travel time charts showed very good overall
correlation with few major deviations. This is consistent with what was evident in the space-time charts.
The table below provides some summary statistics of the ground truth data collection effort for Detroit.
BASIC FIELD DATA COLLECTION FACTS
Number of Route Groups 7
Number of unique TMC Segments 112
Dates of Data Collection 10/8/2008 to 10/15/2008
Number of GPS points 283367
Miles of Valid Data 2812.80
Total Miles Driven 4162.01
Average Travel Speed 54.98 MPH
Heavy Congestion Segment Observations 151 (Average Speed of 19.0 MPH, 14.6% of Drive Time)
Moderate Congestion Segment Observations 327 (Average Speed of 34.7 MPH, 19.3% of Drive Time)
Data Collection Routes The market routes were identified through an evaluation of the Detroit road network. The primary objective
for route selection was a combination of road volume (large user base) and expected traffic congestion. A
portion of lower classification roads (FC 2) were also identified.
ROUTE DESCRIPTIONS
Roadway From To Length FC Class
I-275 NB Eureka Road 6 Mile Road 14.23 FC1
I-275 SB 6 Mile Road Eureka Road 14.23 FC1
I-696 EB E. 10 Mile Road Nieman Street 8.27 FC1
I-696 WB Nieman Street E. 10 Mile Road 8.27 FC1
I-75 NB E. State Fair Ave W. Big Beaver Rd 8.72 FC1
I-75 SB W. Big Beaver Rd E. State Fair Ave 8.72 FC1
I-96 EB Kensington Road Grand River Ave 13.75 FC1
I-96 WB Grand River Ave Kensington Road 13.75 FC1
State Route 10 NB Howard Street Wyoming Street 7.64 FC1
State Route 10 SB Wyoming Street Howard Street 7.64 FC1
State Route 14 EB Ford Road Newburgh Ave 12.49 FC2
State Route 14 WB Newburgh Ave Ford Road 12.49 FC2
Telegraph Road NB West 8 Mile Rd West Long Lake Rd 8.56 FC2
Telegraph Road SB West Long Lake Rd West 8 Mile Rd 8.56 FC2
As in the other two markets, data collection was focused on the two main peak periods, morning (AM) and
afternoon (PM), with each period lasting approximately four hours. The main goal was to observe as many
congestion events as possible.
ROUTES SCHEDULE
Roadway Dates Run AM Time PM Time
I-275 NB 10/8/08 6-10 am 3-7 pm
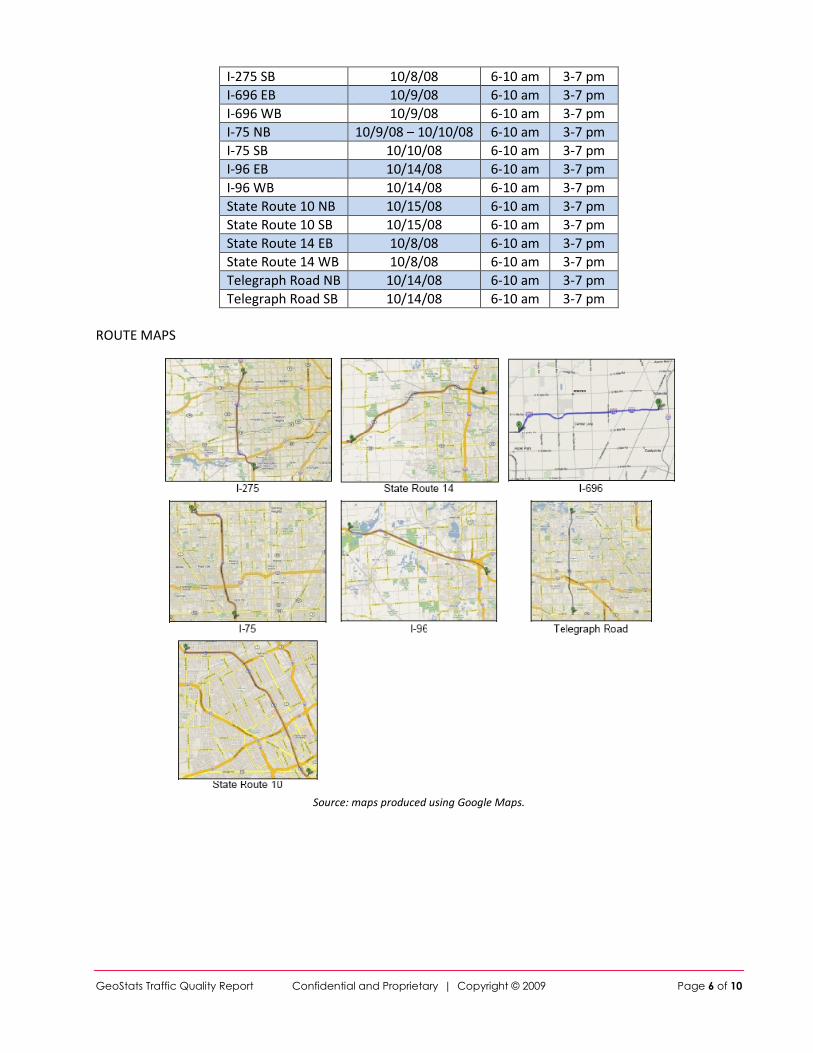
GeoStats Traffic Quality Report Confidential and Proprietary | Copyright © 2009 Page 6 of 10
I-275 SB 10/8/08 6-10 am 3-7 pm
I-696 EB 10/9/08 6-10 am 3-7 pm
I-696 WB 10/9/08 6-10 am 3-7 pm
I-75 NB 10/9/08 – 10/10/08 6-10 am 3-7 pm
I-75 SB 10/10/08 6-10 am 3-7 pm
I-96 EB 10/14/08 6-10 am 3-7 pm
I-96 WB 10/14/08 6-10 am 3-7 pm
State Route 10 NB 10/15/08 6-10 am 3-7 pm
State Route 10 SB 10/15/08 6-10 am 3-7 pm
State Route 14 EB 10/8/08 6-10 am 3-7 pm
State Route 14 WB 10/8/08 6-10 am 3-7 pm
Telegraph Road NB 10/14/08 6-10 am 3-7 pm
Telegraph Road SB 10/14/08 6-10 am 3-7 pm
ROUTE MAPS
Source: maps produced using Google Maps.

GeoStats Traffic Quality Report Confidential and Proprietary | Copyright © 2009 Page 7 of 10
New York
New York data collection experienced significant levels of congestion (the most observed across the three
markets), with almost 77% of the observations at speeds less than 45 MPH. New York also showed lower
performance than San Diego or Detroit but this was to be expected given the complex roadway network.
However, 92% of the samples on arterials in heavy congestion were correctly categorized.
BASIC FIELD DATA COLLECTION FACTS
Number of Route Groups 7
Number of unique TMC Segments 176
Dates of Data Collection 10/8/2008 to 10/16/2008
Number of GPS points 272757
Miles of Valid Data 2309.27
Total Miles Driven 2945.72
Average Travel Speed 34.16 MPH
Heavy Congestion Segment Observations 469 (Average Speed of 17.7 MPH, 36.1% of Drive Time)
Moderate Congestion Segment Observations 929 (Average Speed of 38.7 MPH, 36.5% of Drive Time)
Data Collection Routes The market routes were identified through an evaluation of the New York road network. The primary
objective for route selection was a combination of road volume (large user base) and expected traffic
congestion. A small portion of lower classification roads (FC 2) and toll roads were also identified.
ROUTE DESCRIPTIONS
Roadway From To Length FC Class
Broadway NB Ashburton Ave Park Ave 8.99 FC2
Broadway SB Park Ave Ashburton Ave 8.99 FC2
Bronx River Pkwy NB Story Avenue Vermont Terrace 9.60 FC1
Bronx River Pkwy SB Vermont Terrace Story Avenue 9.60 FC1
Garden State Pkwy NB Wachtung Avenue Exit 171 Rest Area 15.43 FC1
Garden State Pkwy SB Exit 171 Rest Area Wachtung Avenue 15.43 FC1
I-495 EB Maurice Avenue Little Neck Pkwy 10.22 FC1
I-495 WB Little Neck Pkwy Maurice Avenue 10.22 FC1
I-678 NB Waters Pl/Westchester N. Ave/Mill Rd 8.38 FC1
I-678 SB N. Ave/Mill Rd Waters Pl/Westchester 8.38 FC1
New York State Thruway EB N. Aimont Rd N. Route 303 8.35 FC1
New York State Thruway WB N. Route 303 N. Aimont Rd 8.35 FC1
Tonnelle Ave NB Tonelle Ave @ Wendy’s E. Sheffield Avenue 8.07 FC2
Tonnelle Ave SB E. Sheffield Avenue Tonelle Ave @ Wendy’s 8.07 FC2

GeoStats Traffic Quality Report Confidential and Proprietary | Copyright © 2009 Page 8 of 10
Data collection was focused on the two main peak periods, morning (AM) and afternoon (PM), with each
period lasting approximately four hours. The main goal was to observe as many congestion events as
possible.
ROUTE SCHEDULE
Roadway Dates Driven AM Time PM Time
Broadway NB 10/16/08 6-10 am 3-7 pm
Broadway SB 10/16/08 6-10 am 3-7 pm
Bronx River Parkway NB 10/9/08 6-10 am 3-7 pm
Bronx River Parkway SB 10/9/08 6-10 am 3-7 pm
Garden State Parkway NB 10/8/08 6-10 am 3-7 pm
Garden State Parkway SB 10/8/08 6-10 am 3-7 pm
I-495 EB 10/8/08 6-10 am 3-7 pm
I-495 WB 10/8/08 6-10 am 3-7 pm
I-678 NB 10/10/08 6-10 am 3-7 pm
I-678 SB 10/10/08 6-10 am 3-7 pm
New York State Thruway EB 10/14/08 6-10 am 3-7 pm
New York State Thruway WB 10/14/08 6-10 am 3-7 pm
Tonnelle Ave NB 10/14/08 6-10 am 3-7 pm
Tonnelle Ave SB 10/14/08 6-10 am 3-7 pm
ROUTE MAPS
Source: maps produced using Google Maps.

GeoStats Traffic Quality Report Confidential and Proprietary | Copyright © 2009 Page 9 of 10
San Diego
San Diego had the least congestion experienced during the data collection period of the three markets
evaluated. Only 28% of drive time occurred at speeds lower than 45 mph. Overall, AirSage performed well
for this market being in the same category 89% of the time on highways and 85% of the time on arterials.
Space-time diagrams also indicate that the data did a good job of capturing the overall traffic speed and
congestion patterns.
BASIC FIELD DATA COLLECTION FACTS
Number of Route Groups 6
Number of unique TMC Segments 158
Dates of Data Collection 10/27/2008 to 10/31/2008
Number of GPS points 331,066
Miles of Valid Data 3337.26
Total Miles Driven 4772.38
Average Travel Speed 56.08 MPH
Heavy Congestion Segment Observations 151 (average speed of 19.0 MPH, 13.1% of drive time)
Moderate Congestion Segment
Observations
327 (average speed of 34.7 MPH, 15.4% of drive time)
Data Collection Routes The market routes were identified through an evaluation of the San Diego road network. The primary
objective for route selection was a combination of road volume (large user base) and expected traffic
congestion. A small portion of lower classification roads (FC 2) were also identified. The data collection
schedule focused on the two main peak periods, morning (AM) and afternoon (PM), with each period lasting
approximately four hours. The main goal was to observe as much congestion events as possible.
ROUTE DESCRIPTIONS
Roadway From To Length FC Class
I-5 (Encinitas) NB Del Mar Heights Poinsettia Lane 11.24 FC1
I-5 (Encinitas) SB Poinsettia Lane Del Mar Heights 11.24 FC1
I-5 (San Diego) NB Mile of Cars Way Sea World Drive 10.57 FC1
I-5 (San Diego) SB Sea World Drive Mile of Cars Way 10.57 FC1
I-8 EB Nimitz Blvd Fletcher Pkwy 11.14 FC1
I-8 WB Fletcher Pkwy Nimitz Blvd 11.14 FC1
SR 52 EB La Jolla Colony Dr Mission Gorge Rd 13.98 FC1
SR 52 WB Mission Gorge Rd La Jolla Colony Dr 13.98 FC1
SR94/125 EB 17th Street Lemon Ave 9.33 FC1
SR94/125 WB Lemon Ave 17th Street 9.33 FC1
S. El Camino Real NB Encinitas Blvd Oceanside Blvd 11.42 FC2
S. El Camino Real SB Oceanside Blvd Encinitas Blvd 11.42 FC2

GeoStats Traffic Quality Report Confidential and Proprietary | Copyright © 2009 Page 10 of 10
ROUTE SCHEDULE
Roadway Dates Driven AM Time PM Time
I-5 (Encinitas) NB 10/27/08, 10/28/08, 10/30/08, 10/31/08 6-10 am 3-7 pm
I-5 (Encinitas) SB 10/27/08, 10/28/08, 10/30/08, 10/31/08 6-10 am 3-7 pm
I-5 (San Diego) NB 10/28/08, 10/30/08 6-10 am 3-7 pm
I-5 (San Diego) SB 10/28/08, 10/30/08 6-10 am 3-7 pm
I-8 EB 10/29/08 6-10 am 3-7 pm
I-8 WB 10/29/08 6-10 am 3-7 pm
SR 52 EB 10/31/08 6-10 am 3-7 pm
SR 52 WB 10/31/08 6-10 am 3-7 pm
SR94 EB 10/30/08 6-10 am 3-7 pm
SR94 WB 10/30/08 6-10 am 3-7 pm
S. El Camino Real NB 10/31/08 6-10 am 3-7 pm
S. El Camino Real SB 10/31/08 6-10 am 3-7 pm
ROUTE MAPS
Source: maps produced using Google Maps.