submission to productivity commission on “reaching for the
TRANSCRIPT

Submission to Productivity Commission on “Reaching for the Frontier” By Dr A.G. Barnett, Director, HYDRA Software Ltd
August 2020
Scope: This submission relates specifically to the experience of HYDRA
Software Ltd, a New Zealand firm at the world high technology
frontier of investigation and design of water infrastructure projects.

1. Qualifications and Experience
My full name is Alastair Gordon Barnett. I have a Ph.D in Civil Engineering from the
University of Canterbury, and have since gained over fifty years of experience of
computational studies of water flows in proposed or existing engineering projects in over
twenty countries. I have set up a wide range of field monitoring programmes for model
calibration and verification, and have developed the information technology for several
internationally used software packages for hydraulic analysis of floods and harbour waves,
including tsunamis. I was elected a fellow of IPENZ in 2002 with the citation reading in part
“for his substantial and ongoing contribution to the advancement of engineering knowledge
in the field of hydraulic modelling of water flows.”
With the New Zealand Ministry of Works and Development from 1961-86, after graduation I
began as manager of the highway construction breakthrough at Haast, which was opened
by the Prime Minister in 1965. Then followed my Ph.D and three years of post-doctoral
studies in leading hydraulic institutes in The Netherlands, France and Denmark, funded by
the National Research Advisory Council. On my return to New Zealand I worked with the
MWD Systems Laboratory on information technology, then with Power Division verifying
computational predictions of tsunami-like wave propagation at full scale in large
hydropower canals. I then moved to the Water Quality Centre in Hamilton, leading
computer modelling and coastal groups, as well as serving as acting Scientist in Charge in
1981-82. After the closure of the Ministry of Works and Development in 1988, public
engineering research ceased, but Government eventually made a decision to retain the
exclusively science-based parts of this research unit, reconstituted as a NIWA centre.
To ward off collapse of our hydraulic engineering research community, I set up Barnett
Consultants in 1987. We undertook specialist consulting commissions for a wide range of
water flow studies in a number of countries. Clients included the Governments of New
Zealand (tsunami hazards at Te Papa), Australia (dam break flood hazards for the Australian
Parliament in Canberra), Malaysia (several flood studies), Singapore (urban drainage) and
Hong Kong (siting the main sewage outfall in Hong Kong harbour). Clients for coastal hazard
studies included the World Bank (storm surges at Chittagong in the Bay of Bengal), the Asian
Development Bank (reef sewage outfalls and coastal erosion in Kiribati) and the European
Investment Bank (tsunami hazards in the Port of Suva, Fiji). In 2002 the consulting business
was re-incorporated as a partnership, Barnett & MacMurray Ltd.
I am also principal of HYDRA Software Ltd, a Hamilton company set up in 1991 to support
existing local, regional and central government users of specialised information technology
previously supplied by the MWD for rivers, stormwater systems, drainage networks,
hydropower networks, harbours and coastal tsunami prediction.
The frontier nature of much of this technology has been acknowledged by its adoption in 34
countries in all six inhabited continents. Recently members of the world hydraulic
engineering association (the IAHR) honoured my contribution by electing me as Chair of
their Flood Risk Management technical committee, the group given responsibility for
leading international engineering practice in responding to climate change flood hazards.

2. Comparative Study of Government Support Policies In addition to high technology developments, I have reached my international position
through experience of engineering practice in many countries, including most “small
advanced economies” proposed for comparative study by the Productivity Commission.
During the Webinar of 22 July, the presentation by Penny Mok identified these as Australia,
Belgium, Denmark, Finland and Sweden, together with Singapore which would be
collaborating in the study.
Because the Productivity Commission is an arm of our central government, the
benchmarking study will have an implied focus on the impact of policies of the respective
governments on the international success of their benchmarked frontier firms. The study
objectives could be paraphrased “What types of innovation does it pay to support?”
This is not a new question. In his 1667 publication “The History of the Royal Society” Thomas
Sprat (the first official historian of the Society) wrote “The English avers from admitting of
new Inventions, and shorter ways of labor, and from naturalizing New-people: Both which
are the fatal mistakes that have made the Hollanders exceed us in Riches and Trafic. They
receive all Projects and all People, and have few or no Poor.”
At the time the English and the Dutch were in a brutally competitive race to take over
mastery of the lucrative sea trade routes to the East, and the Dutch were winning. In Sprat’s
view, this was because the Royal Society were failing to produce important (and
marketable) innovations on the basis of its research – a fatal mistake likely to hand the
scientific advantage to England’s bitter rivals in Holland.
This submission will compare my experience of the support provided to innovative ventures
by the New Zealand government to that provided in three of the above selected countries
(Singapore, Denmark and Australia) together with Japan, where I have also had significant
experience of Government policies towards innovation.
Belgium is one of the countries to which I have supplied design software, and one of the
elected members of our IAHR committee is a Belgian professor. Also I have reviewed
technical papers from Sweden and Finland submitted for inclusion at international
conferences, but these contacts provide little basis for assessing their government policy
approaches. Therefore these three countries will not be discussed further.
3. Japan As a string of large mountainous islands over a similar range of latitudes on the active Pacific
“ring of fire”, Japan presents engineering design challenges for water infrastructure which
have much in common with New Zealand. Engineering expertise specific to these conditions
has been built around extensive project experience, but (unlike the New Zealand
government) the Japanese government has chosen to build a major external relations
strategy around the export of their engineering prowess, both as consulting services and as
well funded aid projects.

Through their Japan International Cooperation Agency (JICA) they are now supporting
infrastructure projects worldwide, including New Zealand neighbours as close as the Cook
Islands (see JICAPacific2019.pdf attached). Formerly New Zealand provided the engineering
expertise for major public projects such as the Rarotonga International Airport, but our
Government now appears to have abandoned this role to our international competitors.
JICA has translated Japanese engineering codes into English – for example, the excellent
Guideline and Manual for Hydropower Development Vol.1 “Conventional Hydropower and
Pumped Storage Hydropower” (see JICAHydro.pdf attached). In contrast, no such standard
methodology appears to back the process so far followed here before the announcement of
the proposed Lake Onslow scheme, which appears determined to reinvent Pumped Storage
design without reference to the institutional memory of engineering experience.
Yet the Japanese have always been willing to adopt overseas technology developments. In
1994 the Tokyo Metropolitan Government acted on behalf of all Japanese local authorities
in organising a worldwide competition for the most advanced engineering software for
drainage design. This was won by HYDRA Software on the basis of new tsunami modelling
techniques developed during the design of the Tekapo canal and the Museum of New
Zealand (Te Papa). An introductory training course attended by some forty engineers from
all over Japan was run in Tokyo, and negotiations were well in progress for the bulk supply
of design packages to all Japanese municipalities for about $20 million until they were
suddenly aborted without explanation.
Enquiries by the then-Tradenz representative in Tokyo, Eugene Bowen, established that the
Danish government (see Section 4 below) had intervened and withdrawn the joint Danish-
New Zealand entry from the competition, and that the Japanese had responded angrily by
cancelling the whole competition.
In 2011 the Japanese authors adopted corrections I suggested to their tsunami modelling
technology as peer reviewer of the first papers published internationally about inland
flooding during the great 2011 Tohoku tsunami.
Sound though the JICA Hydro Manual is with respect to the design of conventional hydro
projects, these aim for optimum performance under average flow conditions. Little
attention is given to advancing techniques for dealing with exceptional dry years, possibly
because the Japanese grid is not reliant on hydropower to the extent now contemplated in
New Zealand, or indeed in Ethiopia with the controversial GERD project. A major technology
improvement was published by HYDRA at the IAHR Asia-Pacific Division Conference hosted
by the University of Auckland in 2010 (see AGBPaper2010.pdf attached). This new ultra-high
speed continuous simulation technology was shown there to be capable of fully analysing
the New Zealand dry year problem.
Unfortunately there is very little New Zealand interest in solving either tsunami modelling or
dry year power supply on the basis of technology demonstrated in a University engineering
conference. If New Zealand is not interested, we can hardly expect the Japanese
government to examine this innovation.

4. Denmark The Danish Government has centralised infrastructure investigation and design under an
“academy” of wholly owned institutes. These are comparable with our Crown Research
Institutes, except they are engineering based instead of science based. The Danish Hydraulic
Institute (DHI) is the major research agency for water infrastructure, operating under its
own Board which in turn appoints the Chief Executive, known as the Director. The research
programme is largely government funded, and partial government funding for international
infrastructure may also be accessible for projects meeting foreign aid criteria.
In the early 1990s the DHI Director convinced his Board that Danish technology would
penetrate foreign markets faster through joint ventures with innovative groups based in
target countries (particularly the USA). In New Zealand the chosen group was HYDRA
Software, and a joint venture was set up to add a DHI user interface to the advanced
hydraulic computational engine developed by HYDRA, with sales income divided 50/50.
All went well initially, with the joint venture package (known as MIKE11-Urban Drainage or
UD for short) capturing the entire New Zealand local authority modelling market for urban
drainage design.
Impressed by this, DHI marketing engineers suggested building on this success by entering
UD in the worldwide competition just announced by the Japanese (see Section 3 above).
The Director agreed that this was in accord with the Joint Venture agreement he had signed,
but stipulated that DHI would also explore the Japanese market for their wholly owned
products as the competition rules had left unclear the precise modelling functions the
Japanese were seeking.
Unfortunately, soon after the Danish/New Zealand team met in Tokyo to conclude
negotiations with the Japanese representatives, the DHI team suddenly withdrew, with the
consequences described in Section 3. The outcome is further discussed in Section 7.6.
Whatever the problem, it could not have been concern about the quality of the UD
technology, as evidenced by the reference (see Ref Report Cook Award.pdf attached) given
to me by Dr Ir Gaele Rodenhuis in support of a James Cook Research Fellowship application
in New Zealand. At the time negotiations with the Japanese were proceeding, he was a
senior DHI executive (as noted in the reference), but he left Denmark to return to The
Netherlands shortly afterwards. This reference will be in government archives under the
2005 James Cook applications. His comments placed particular importance on validation
and calibration, noting that urgent action was needed “to avoid some disasters through ill-
used software that undoubtedly are looming ahead.”
5. Singapore The Singapore government pays close attention to the design of water infrastructure, for
example issuing a detailed Code of Practice on Surface Water Drainage through their
Ministry of the Environment. During my periods consulting there, Building Plans could not
proceed until approval was issued by the Chief Engineer, Central Building Plan Unit (CPBU)
that all the drainage and other environmental requirements had been fully complied with.

However, some 25 years ago New Zealand technology was regarded with considerable
respect, and there was no difficulty in having our modelling technology standards accepted.
More recently (2018) HYDRA technology has again been downloaded for use by local
Singapore consulting engineers.
In the intervening period, the Singapore Government has invested heavily in research on
water infrastructure, entering in strategic alliances between the National University of
Singapore and the Deltares network set up by the Netherlands government. To head the
resulting NUSDeltares project they sought out and appointed an internationally eminent
colleague in hydroinformatics and artificial intelligence, Professor Vladan Babovic.
As a result, I now regularly review excellent research papers from Singapore submitted for
presentation at international engineering conferences.
6. Australia The Australian Government has long had a policy of funding national water infrastructure
codes of practice. The preparation of some such as “Australian Rainfall and Runoff” is
contracted to the Institution of Engineers Australia, while others such as the Austroads
Bridge Design Code are prepared by engineers in Government departments.
There is considerable respect for New Zealand hydraulic engineering technology. For
example, Sir William Hudson, the Snowy Mountains Scheme Commissioner from 1949 to
1967, was recruited from New Zealand in recognition of our early experience with
hydropower construction.
More recently, based on my design experience in the Upper Waitaki Power Scheme, I was
approached to peer review modelling studies of the hazard to Lake Burley Griffin in
Canberra from a potential dam break in the Molonglo River. While critical of the lack of
water balance validation of the modelling package used, with resulting unreliable accuracy, I
was able to correct the results and report that our software could establish that the Federal
Parliament building would be (marginally) safe from flooding!
We also found ourselves the first New Zealand consultant to benefit from the newly
concluded mutual recognition of design qualifications between the Australian and New
Zealand government. We were consulted by a Victorian firm which had got into technology
trouble with an Australian aid project in Indonesia. Previously we could not have assisted
with a design funded by Australian aid, but under the new agreement we were allowed to
sort out the modelling problems by transferring the input data to our HYDRA technology.
7. New Zealand As noted in Section 1, public engineering research ceased in 1988, although the recent string
of earthquakes in Christchurch and Wellington has opened the purse strings for a review
and upgrade of structural engineering codes. However for water infrastructure, whether it
be hydropower, harbours, bridges, flood protection schemes, urban drainage, sewerage
systems, water supply networks, irrigation schemes, or coastal tsunami protection, building
innovations have been largely unrecognised by code updates in the last thirty years.

7.1 Verification Suspended In fact, one of the few changes in the Building Code Approved Document E1 “Surface water”
was to Verification Method E1/VM1. As noted by the Rodenhuis reference, model
verification and validation are a standard part of engineering procedure, as a preliminary
check both that a new model actually works and that the user is applying it correctly.
Verification means a demonstration that the model can match data observed in the field,
while validation is concerned more with the methodology coded in the modelling package.
An analogy can be drawn between engineering validation and financial auditing, which
investigates whether the double entry bookkeeping entries balance in a set of accounts.
If a financial modelling package fails to achieve a balance, the causes may be inaccurate data
entry (verification problem) or poor software coding (validation problem). Similarly an
engineering model may fail to achieve water balances even with verified data, as happened
with an American modelling package in the study of possible flood problems in the
Australian parliament (see Section 6). In both financial and engineering modelling,
verification should be checked first, after which validation failure should trigger immediate
action to have the faulty modelling package replaced.
Yet the essential verification step was suspended, at least for territorial authorities, by the
addition of a note “This verification method shall be used only if the territorial authority
does not have more accurate data from sophisticated hydrological modelling of the
catchment undertaken as part of its flood management plans.”
The overseas models then being marketed could not meet this verification requirement,
because it included flow through a culvert. This had not been considered by the designers,
because many countries in Europe (including England and Denmark) combine stormwater
and sewage in buried pipe networks whereas in most New World countries (including New
Zealand) standard practice is to separate stormwater and use surface culverts.
Then many territorial authorities were persuaded that, as practice back in sophisticated
London did not require culvert design verification, so the HYDRA UD product (which met the
Verification Method) should be replaced by European packages.
So Government had softened the verification test from whether the model can be verified
to whether it is “sophisticated”. There can be little doubt that “sophisticated” was
interpreted by most to mean “computer software designed in more sophisticated countries
than New Zealand”. The implicit bias of this action against the New Zealand domestic
software industry is very disappointing to find in official Government regulations.
Experienced professionals will by now be well aware that a computer model can produce
plausible nonsense (as can sophistry!), so constant vigilance is needed to detect and correct
software mistakes when they occur. Verification and validation are essential parts of this
process, and such auditing functions are long overdue to be reinstated as soon as possible.
7.2 Climate Change Effects Even with climate change forecasts, first taken into account here in 1989 in our design of Te
Papa, the foundation levels of homes are still designed to code standards which are over

thirty years old. The one change, introduced in 2002 in response to publicity about the Te
Papa design, was to expand design coastal flood hazards from storms to include tsunami.
This was done by changing the word “storm” to “event”.
Unfortunately, without accompanying explanation the intention of this one-word change is
not obvious, so most local authorities have remained unaware that tsunami event hazards
must now be considered in building foundation design.
Neglect of this code change has already cost the Government millions of dollars in
compensating home owners in the Bexley subdivision in the red zone in Christchurch. The
tsunami hazard to the entire red zone was determined by an application of the “Barnett
model” published in a report to Government – see
https://www.civildefence.govt.nz/assets/Uploads/publications/GNS-CR2005-104-review-of-
tsunami-hazard.pdf
Most of the buildings in the zone would have received their building consents before 2002,
when the code change was published. But the Bexley subdivision was constructed after
2002, and should not then have received building consents with the known tsunami hazard
unless the developers raised the floor levels drastically, either by landfill or by raising on
piles. As it was, dozens of new houses were rendered unusable by a minor tsunami:
seawater entering the properties after the Christchurch earthquake lowered local ground
levels by under half a metre.
Every year now the liability to Government increases for every house built which is similarly
substandard according to the 2002 code revision, and the “red zone” where the building
foundations ought to be redesigned creeps further inland by about 10 metres for every
centimetre of sea level rise. Yet Government seemingly feels no urgency to deal with this
rapidly growing economic risk by drawing the attention of Councils to this eighteen year old
Building Code revision.
7.3 Civil Defence Flood risk management has long been considered an engineering function for river floods.
The 1989 Te Papa study established that the “Barnett model” could be extended seamlessly
to the coast, “reaching for the frontier” where flood waves from the river and tsunami
waves from the sea may both be modelled in a single network using the same technology.
Yet Government departments were not interested in supporting HYDRA to build a world
lead at this technology frontier. Instead, when Government Ministers, shocked by television
coverage of the 2004 Indian Ocean tsunami, suddenly became interested in funding tsunami
research, scientific agencies used the ban on engineering research funding to set aside the
progress made by HYDRA and make a case for funding research to start non-technological
“scientific” study of the movement of tsunami waves. Of course, information technology
had to become involved as soon as numerical models were discovered to be necessary by
their programme, at which point they rejoined the trail pioneered by HYDRA three decades
earlier, but without the opportunities for full scale model verification and validation offered
by the large gravity waves through the hydropower canals.

So they simply used millions of dollars of research funding to go into direct government
sponsored competition with a private sector firm offering New Zealand technology at the
international frontier. There is scientific interest in studying cataclysmic events such as
asteroid impacts, using models for which validation will (hopefully!) never be required.
However at event scales relevant to government policy, engineering validation is essential.
This has never been achieved in this programme to my knowledge, as evidenced by the
repeated failure of the “scientific” tsunami models to forecast the times and magnitudes of
wave arrivals from the Samoa tsunami in 2010, or the 2016 Kaikoura tsunami. Evidently
Government was not happy with these failures, as after both the Samoa and Kaikoura
events public Ministerial enquiries were commissioned.
The “Barnett model” has only been validated in Wellington harbour, but was able to
forecast events there with considerable accuracy, as in 2016 I was able to issue Email
warnings to my Wellington relatives with accurate predictions of wave heights and arrival
times well before the first waves were observed.
Meanwhile plans to use the “scientific” model for civil defence appear to have been
dropped, and a centralised warning system is now being replaced by slogans advising
coastal residents not to wait for model forecasts before self-evacuating. This failure of
research funding allocation between scientists and engineers seems to have originated from
the reintroduction of the Royal Society to direct management of government research, as
certainly the previous National Research Advisory Council found no problem in funding my
post-doctoral engineering studies in Europe.
7.4 Harbour Wave Effects “Harbour wave” is the usual English translation of the Japanese “tsunami”. The 1989 Te
Papa study showed that harbour waves observed after the great 1855 earthquake could be
divided into three categories: Immediate waves, triggered by sudden horizontal movements
of steep banks, seismic seiches, triggered by variable vertical displacement across the
harbour, and classical tsunamis triggered at the mouth of the harbour by external
disturbances. Tides can be included as a regular example of the third category.
These waves were shown to all have different heights at different locations in the harbour,
and of course high tide heights are well known to vary by over a metre around New Zealand.
Surface flooding from storm rainfall in the local catchment would also need to be
considered, as would wind waves in less sheltered locations than Lambton Harbour.
Therefore the proposal currently circulating to fix the Building Code entrance floor level
throughout New Zealand at a single arbitrary contour above Mean Sea Level (+3m has been
suggested) is nonsense, potentially causing great loss of productivity throughout New
Zealand. If that figure is locally too low, seawater and/or stormwater will enter many times
during the life of the building; too high and unnecessary extra foundation costs will accrue.
Far better to leave it to the 2002 revision of Building Code Clause E1.3.2, which currently
requires qualified engineers to estimate the correct building floor level for coastal or inland
locations. Assistance from Council Engineers would be usual in urban locations.

7.5 Hydropower No New Zealand codes currently appear to exist for hydropower design, as evidenced by the
incompatibility of the many “designs” discussed in the media in response to the
Government announcement of interest in the Lake Onslow scheme. The models to date
certainly do not balance, in the sense that water should not be deposited in the reservoir
without a corresponding amount being withdrawn from other specified storage reservoirs.
I have had an abstract on pumped storage site optimisation accepted as the basis for
presentation of a full paper at an international conference of hydropower specialists in
Turkey. A copy of this is attached as background (see Abstract060120.docx). Unfortunately
the conference has been postponed for a year through Covid-19 problems, so the full paper
has yet to be completed.
Unless North Island calm conditions are highly correlated with South Island droughts, the
potential is demonstrated for wind power to be combined with storage pumping to and
from Lake Tekapo to replace most if not all of the Lake Onslow capacity for under $100
million plus the cost of any required new North Island wind farms. Further, unlike the Lake
Onslow proposal, the pumped water could be recycled many times instead of being
discharged to the sea after use (wasteful practice during a drought). No new reservoir is
required, and no new high voltage grid connections would be needed. Further, this
relatively modest conversion could be completed within one three-year electoral cycle,
advancing the desired closure of Huntly carbon emissions by some four years. To establish
the necessary correlations between wind and reservoir inflows, continuous simulation of
energy inflows to the whole national grid would be required for at least thirty years, a very
slow job before the HYDRA breakthroughs described in Section 3 increased the model
computation speed by a factor of a million times since the original Tekapo canal studies
were completed in 1977.
7.6 International Technology Exports A contrast has already been drawn between Denmark and Japan, which have invested
heavily worldwide in their engineering technology exports industry, and New Zealand, which
now seems content to pay for imports. In 1994, Eugene Bowen presumably reported the
circumstances of the intergovernmental discussion between Denmark and Japan back to
Wellington, but on my return to New Zealand I was unable to find any awareness of what
had happened. A possible explanation for this is given in a Canadian analysis of the time
https://books.google.co.nz/books?id=g3cLkKcF6gwC&pg=PA133&lpg=PA133&dq=Eugene+B
owen+Trade+Japan&source=bl&ots=85hZvOybbl&sig=ACfU3U2tZS3DErnMacQefMZExi_IJ68
KeA&hl=en&sa=X&ved=2ahUKEwjwssTQ2KHrAhVUOSsKHfZtBbAQ6AEwAnoECAgQAQ#v=on
epage&q&f=false This states “… the opinions expressed by Eugene Bowen at Tradenz in
Tokyo concerning future developments in Japanese trade were very different than those
held by leading trade officials in Wellington.”
Yet our technology advances take HYDRA to the frontier of model performance, and indeed
may do enough to crack solution of the GERD dam Nile dry year problem over which a large
scale Middle Eastern war is currently brewing. It is difficult to find an economic export
model for the productivity of stopping a war, but this must rate highly.

8. Summary If productivity is to be compared between “small advanced economies”, disparities in
growth would need to be traced to key factors which differ sharply between individual
countries in the test sample. It is proposed one such key factor is that identified (Section 2)
in the 1667 review of Royal Society performance: which types of innovation are selected to
receive support from their country?
Here Government policies vary greatly, making differences likely to be traceable by relative
economic success. At one extreme is Denmark, where engineering innovation is fully
supported on a narrow nationalistic basis. At the other extreme is New Zealand, where the
Royal Society determines which innovations are “engineering” and therefore do not qualify
for support from the “Science Fund”. The “Hollanders” today are vastly changed from 1667,
but they still make no such distinction between scientists and engineers, which they call
“ingenieurs”. For example, no eyebrows were raised when the great physicist Hendrik
Lorentz (Einstein’s acknowledged mentor when he developed the Theory of Relativity) spent
the entire later part of his career as an ingenieur developing numerical models to design
major water infrastructure (sluice gates in the Great Enclosing Dyke). The job needed
ingenuity, and he obliged! My colleague Dr Ir (Doctor Ingenieur) Rodenhuis was another
great Dutch “Ingenieur”, with clear skills traversing engineering, science and mathematics.
In New Zealand there is laissez faire, meaning no Government pre-qualification standard
applies for any method (local or foreign) competing for use in design of water infrastructure
– only provided the method is “sophisticated.” Sophistry is no substitute for ingenuity!
We have recently seen the spectacle of one consultant producing two directly contradictory
conclusions on the choice between Northport and Manukau as the replacement for
Auckland Harbour. Obviously, econometric modelling tools are simply not sharp enough to
separate these two options, whereas (from experience as the designer of the Northport and
Port of Tauranga expansions comparing exhaustively validated models of several design
options) the application of harbour engineering models would quickly show that one and
only one option could be optimised to provide economic benefits of national significance.
I have repeatedly complained about the lack of engineering software validation audits to
Government, most recently to MBIE. In their reply (see MBIEStandards.pdf attached) the
Minister reaffirmed Government had no intention of developing national quality standards
for infrastructure design software, as that task was seen as the responsibility of each
software user individually. This leaves private sector technology firms to fight out each sale
in direct competition with fully government funded public sector offerings both from inside
and outside New Zealand. A “level playing field” seems to mean in practice that every
competitor is free to deluge the client with as many claims (true or fake) as they wish, and
no client is to be disturbed by talk of validation audits. Even though imported products often
do not balance, users may simply refuse to attempt standard validation test procedures.
If product reliability and performance are less significant market attributes than the ability
to produce quantities of shiny brochures, I suggest none of these parties is likely to reach
the technology frontier, nor is national productivity enhancement likely.

Timor-Leste
Philippines
Indonesia
Malaysia
CambodiaViet NamThailand
LaosMyanmar
Samoa
Tonga
Kiribati
Fiji
Vanuatu
Solomon Islands
Papua New Guinea
Marshall Islands
Federated States of MicronesiaPalau
Singapore
Tuvalu
JICA Programs in Southeast Asia and the Pacific (Fiscal 2018)The Pacific
Total: 16,821(Unit: millions of yen)
Southeast Asia
Total: 326,615(Unit: millions of yen)
Total value of JICA programs
(Unit: millions of yen)Composition
ratio
Southeast AsiaViet Nam 77,177 23.6%Indonesia 74,307 22.8%Philippines 60,135 18.4%Myanmar 59,446 18.2%Thailand 25,429 7.8%Cambodia 17,600 5.4%Laos 7,954 2.4%Timor-Leste 2,710 0.8%Malaysia 1,852 0.6%Singapore 3 0.0%
The PacificPapua New Guinea 4,745 28.2%Tonga 3,071 18.3%Kiribati 2,236 13.3%Palau 1,484 8.8%Solomon Islands 1,426 8.5%Samoa 1,148 6.8%Vanuatu 910 5.4%Fiji 810 4.8%Tuvalu 611 3.6%Federated States of Micronesia 242 1.4%
Marshall Islands 115 0.7%Other 3 countries 24 0.1%
The figures show the total value of JICA programs in each country including Technical Cooperation (Training Participants, Experts, Study Teams, Provision of Equipment, JOCV and Other volunteers, and Other costs), Finance and Investment Cooperation (disbursements), and Grants (newly concluded G/As) in fiscal 2018.Note: • Figures exclude JICA’s cooperation for multiple countries and/or multiple regions and international organizations.• For the Pacific, this map lists only countries with program value of ¥100 million and over.
Southeast Asia
Regional Issues
Bordering the Indian and Pacific Oceans, the ASEAN countries will become a dynamic presence to maintain and develop free and open international order based on the rule of law, and take the lead in promoting the stability and prosperity of the Indo-Pacific region—this ideal constitutes the core of the Japanese government’s vision of a “Free and Open Indo-Pacific.” It is critical that ASEAN develop as a free and open region, and this is directly linked to Japan’s national interest. To this end, Japan must expand its strategic assistance to enhance the autonomy, independence, and integrity of ASEAN. Promoting economic integration and strengthening connec-tivity, by, for example, the development of the East-West and Southern Economic Corridors, and Maritime Economic Corridor, in particular is the key to ASEAN integrity and sustainable growth. It is also critical for Japan to provide cooperation for marine infrastructure development and strengthening maritime law enforcement capabilities to maintain and strengthen free and open maritime order, and “quality growth” that overcomes economic disparity and establishes solid regional stability and prosperity. In addition, cooperation is necessary in many aspects, including climate change measures toward the global trend of decarbonization, and fostering future national leaders and administrative officials who play key roles in national man-agement. Cooperation is also necessary on measures to counter regional vulnerability, including Rakhine State in Myanmar and Mindanao in the Philippines, as well as the development of peaceful, stable, and safe communities that share universal
values such as the rule of law and good governance. Support is also required for Timor-Leste’s membership of ASEAN and to underpin its transition from the reconstruction period to the development stage.
JICA Initiatives
1. Encouraging “Quality Growth” JICA provides assistance for “quality growth” that embraces inclusiveness, sustainability and resilience. JICA considers physical connectivity and key land and maritime transport infrastructure to be vital for meeting expanding infrastructure needs. Urban problems such as traffic congestion and air pollution caused by sudden population increase hinder sustainable growth and are becoming a social issue. As the Southeast Asian countries continue their economic growth, JICA is placing priority on the development of the urban infrastructure and urban environment including traffic systems, waste disposal, and water supply and sewerage, which are crucial for improving urban functions and fostering the urban middle class. Indonesia’s first subway commenced services [ see the case study on page
23]. JICA encourages quality infrastructure development which serves as the foundation for environmentally friendly quality growth that improves the lives of local communities through job creation and access to social services. JICA is also continuing to promote infrastructure development in the East-West Economic Corridor and the Southern Economic Corridor in Indochina to enhance east-west connectivity in Southeast Asia, and is working to strengthen “vibrant and effective connectivity,” such as improving customs systems
Southeast Asia and the PacificSeeking to Achieve Quality Growth under the “Free and Open Indo-Pacific”
Activities and Initiatives by Region
22 JICA Annual Report 2019
and personnel training for this with the aim of strengthening institutional connectivity.
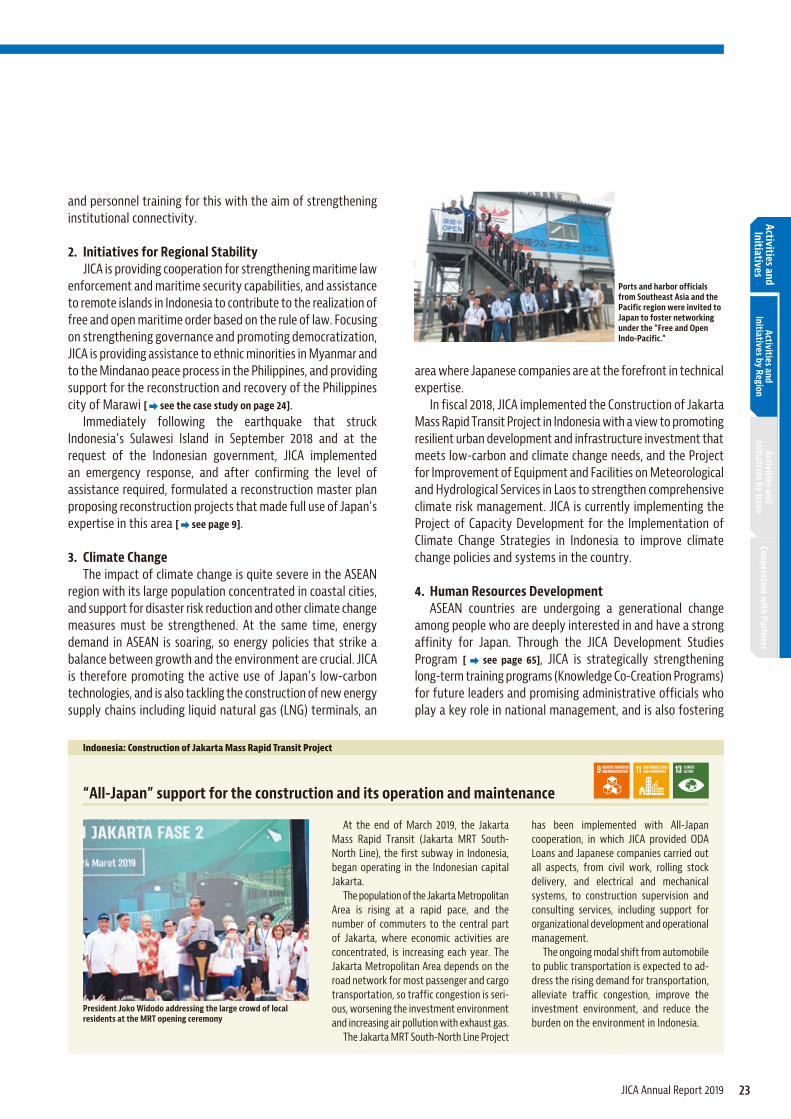
2. Initiatives for Regional Stability JICA is providing cooperation for strengthening maritime law enforcement and maritime security capabilities, and assistance to remote islands in Indonesia to contribute to the realization of free and open maritime order based on the rule of law. Focusing on strengthening governance and promoting democratization, JICA is providing assistance to ethnic minorities in Myanmar and to the Mindanao peace process in the Philippines, and providing support for the reconstruction and recovery of the Philippines city of Marawi [ see the case study on page 24]. Immediately following the earthquake that struck Indonesia’s Sulawesi Island in September 2018 and at the request of the Indonesian government, JICA implemented an emergency response, and after confirming the level of assistance required, formulated a reconstruction master plan proposing reconstruction projects that made full use of Japan’s expertise in this area [ see page 9].
3. Climate Change The impact of climate change is quite severe in the ASEAN region with its large population concentrated in coastal cities, and support for disaster risk reduction and other climate change measures must be strengthened. At the same time, energy demand in ASEAN is soaring, so energy policies that strike a balance between growth and the environment are crucial. JICA is therefore promoting the active use of Japan’s low-carbon technologies, and is also tackling the construction of new energy supply chains including liquid natural gas (LNG) terminals, an
area where Japanese companies are at the forefront in technical expertise. In fiscal 2018, JICA implemented the Construction of Jakarta Mass Rapid Transit Project in Indonesia with a view to promoting resilient urban development and infrastructure investment that meets low-carbon and climate change needs, and the Project for Improvement of Equipment and Facilities on Meteorological and Hydrological Services in Laos to strengthen comprehensive climate risk management. JICA is currently implementing the Project of Capacity Development for the Implementation of Climate Change Strategies in Indonesia to improve climate change policies and systems in the country.
4. Human Resources Development ASEAN countries are undergoing a generational change among people who are deeply interested in and have a strong affinity for Japan. Through the JICA Development Studies Program [ see page 65], JICA is strategically strengthening long-term training programs (Knowledge Co-Creation Programs) for future leaders and promising administrative officials who play a key role in national management, and is also fostering
Ports and harbor officials from Southeast Asia and the Pacific region were invited to Japan to foster networking under the “Free and Open Indo-Pacific.”
Activities and Initiatives by Region
Activities and Initiatives by Issue
Cooperation with Partners
Activities and Initiatives
At the end of March 2019, the Jakarta Mass Rapid Transit (Jakarta MRT South-North Line), the first subway in Indonesia, began operating in the Indonesian capital Jakarta. The population of the Jakarta Metropolitan Area is rising at a rapid pace, and the number of commuters to the central part of Jakarta, where economic activities are concentrated, is increasing each year. The Jakarta Metropolitan Area depends on the road network for most passenger and cargo transportation, so traffic congestion is seri-ous, worsening the investment environment and increasing air pollution with exhaust gas. The Jakarta MRT South-North Line Project
has been implemented with All-Japan cooperation, in which JICA provided ODA Loans and Japanese companies carried out all aspects, from civil work, rolling stock delivery, and electrical and mechanical systems, to construction supervision and consulting services, including support for organizational development and operational management. The ongoing modal shift from automobile to public transportation is expected to ad-dress the rising demand for transportation, alleviate traffic congestion, improve the investment environment, and reduce the burden on the environment in Indonesia.
“All-Japan” support for the construction and its operation and maintenance
Indonesia: Construction of Jakarta Mass Rapid Transit Project
President Joko Widodo addressing the large crowd of local residents at the MRT opening ceremony
23JICA Annual Report 2019

personnel in advanced industries at the forefront of industrial development and technological innovation. Under the Global Public Leadership Program (SDGs Global Leadership Program from fiscal 2019), JICA hosted 28 participants at eight universities in fiscal 2018. In November, JICA held a networking conference where participants, JICA and university representatives gathered to build relationships of trust with future national leaders. JICA will provide support to Timor-Leste for training the personnel responsible for improving administrative capabilities and institution building through the Project for Human Resource Development Scholarship under Grant Aid.
Under the “Free and Open Indo-Pacific,” an issue facing ASEAN in the new era is a need to foster a sound and healthy middle class that fully respects freedom, democracy, equality, the rule of law, and good governance, and can play a central role in national development. With a view to the middle class, JICA is promoting cooperation for urban environmental development, agriculture, food safety and nutrition, health, sport and medical care, and education. In implementing cooperation, JICA will continue to make maximum use of the broad-ranging expertise and know-how of private-sector companies, universities and research institutions, and local governments.
The Pacific
Regional Issues
JICA provides assistance to 14 Pacific island countries. These
countries have diverse languages and their own cultures and customs. While their development status differs, they face the common challenges unique to island countries: they are small, isolated, and remote. Japan and the Pacific island countries have been holding the Pacific Islands Leaders Meeting (PALM) every three years since 1997 where various regional and national issues are discussed at the summit level. The Eighth Pacific Islands Leaders Meeting (PALM8) was held in Iwaki, Fukushima Prefecture, in May 2018, and the cooperation and assistance initiatives were announced after discussions among the leaders of Pacific island countries and Japan as follows.(1) Assistance for maritime safety, including maritime law
enforcement and management of marine resources based on the concept of a “free and open sustainable ocean.”
(2) Strengthening the basis for resilient and sustainable development through developing ports, harbors, and other infrastructure, further promoting the introduction of renewable energy, and assisting in the field of climate change, the environment and disaster risk reduction, trade and investment, and tourism.
(3) Active people-to-people exchanges.
JICA Initiatives
JICA is providing comprehensive assistance under the cooperation and assistance initiatives adopted at PALM8.
1. Marine Cooperation Stable maritime order, maritime security, and sustainable development and management of marine resources are crucial
Conflict between Muslim groups seeking autonomy and the Philippine government had been continuing for about 50 years in the southwestern region of Mindanao, but under the Bangsamoro Organic Law established in 2018, the Bangsamoro Transition Authority (BTA) was inaugurated in February 2019. Together with the Ministry of Foreign Affairs, JICA has been cooperating for hu-man resources development and improving livelihoods in the region for about 20 years in an effort to promote peace. Before the inauguration of BTA, based on the mu-tual trust developed with both the Moro Islamic Liberation Front and the Philippine
government, JICA participated in the moni-toring team for the plebiscite to determine the autonomous region, and assisted in the organizational formation of the BTA. Toward the establishment and full-scale functioning of the Bangsamoro Government scheduled in 2022, JICA will provide technical cooperation aimed at strengthening gover-nance and improving livelihoods, Grants for building vocational training centers, and ODA Loans for building and rehabilitating access roads to intercity highways. JICA will continue to advance durable peace and sustainable development in the region.
Underpinning lasting peace with the relationship of trust
Philippines: Cooperation for Peace in Mindanao
Assistance for rice cultivation in Bangsamoro (southwestern region of Mindanao)
Activities and Initiatives by Region
24 JICA Annual Report 2019

for Pacific island countries. With the aim of eliminating illegal, unreported and unregulated (IUU) fishing, JICA provided training in Japan for participants from 12 Pacific island countries in cooperation with the United States [ see the case study below]. JICA has provided technical cooperation for improving coastal resource management capabilities in Vanuatu and the Solomon Islands. It has also supported port development, and provided technical cooperation on operation and maintenance of vessel and port facilities in Pacific island countries by dispatching regional advisers to Fiji.
2. Environmental Management JICA has been supporting institution building for sustainable waste management at the regional and national levels in Pacific island countries in cooperation with the Secretariat of the Pacific Regional Environment Programme (SPREP), based in Samoa, and contributed to a reduction of plastic waste in the oceans and measures to counter global warming. In the metropolitan coastal area in Papua New Guinea, untreated sewage was released into the ocean. JICA contributed to improving sanitation for residents and protecting the marine environment with the completion of a sewage treatment plant in the area.
3. Disaster Risk Management and Climate Change JICA has been supporting reinforcing meteorological training functions for the Fiji Meteorological Service for personnel in Pacific island countries [ see the case study on page 39] and has supported establishing the Pacific Climate Change Center in cooperation with SPREP.
4. Stable Supply of Energy JICA has been extending bilateral financial assistance and regional technical cooperation to promote the optimal introduction of renewable energy while stabilizing electric power systems and making efficient use of diesel power generation.
5. Human Resources Development JICA provides government officials who will play key roles in respective governments in the future with the opportunity to study in Japan under the Pacific Leaders’ Educational Assistance for Development of States (Pacific-LEADS). Following the 41 participants in both fiscal 2016 and fiscal 2017, JICA accepted 20 new participants in fiscal 2018 and provided internship programs for the participants at central or local governments.
Activities and Initiatives by Region
Activities and Initiatives by Issue
Cooperation with Partners
Activities and Initiatives
Marine resources are economically, so-cially and culturally crucial to Pacific island countries with their vast exclusive economic zone. In recent years, however, excessive ex-ploitation of those resources due to illegal, unreported and unregulated (IUU) fishing has become a serious problem that requires strong countermeasures. In November and December 2018, train-ing aimed at eliminating IUU fishing in the Pacific was held in Japan for 12 Pacific island countries (Papua New Guinea, Fiji, Tonga, Vanuatu, Samoa, Solomon Islands, Marshall Islands, the Federated States of Micronesia, Palau, Kiribati, Tuvalu, and Nauru). With cooperation from the Fisheries Agency, Japan Coast Guard, and private-sector
companies, participants attended lectures, visited sites, and gained an understanding about Japan’s expertise in combatting IUU fishing, including collaboration among the relevant ministries and agencies, and deal-ing with violations of fishing-related laws and regulations. Lectures were also held by the National Oceanic and Atmospheric Administration as a part of collaboration with the U.S. in maintaining and promoting a Free and Open Indo-Pacific. Participants stated that they intended to utilize the knowledge they gained in Japan in their own countries. JICA will continue to provide support for enhancing IUU fishing countermeasures in the Pacific.
Sharing Japanese expertise for the sustainable use of marine resources
Twelve Pacific Countries: Policies and Countermeasures against Illegal, Unreported and Unregulated (IUU) Fishing (Country Focus Knowledge Co-Creation Program)
Participants receiving a Japan Coast Guard briefing on IUU fishing countermeasures
Reception for the third intake of Pacific-LEADS participants
25JICA Annual Report 2019

Guideline and Manual for Hydropower Development Vol. 1
Conventional Hydropower and Pumped Storage Hydropower
March 2011
Japan International Cooperation Agency
Electric Power Development Co., Ltd.
JP Design Co., Ltd.
IDD JR
11-019

TABLE OF CONTENTS
Part 1 Significance of Hydroelectric Power Development
Chapter 1 Significance of Hydroelectric Power Development ............................................... 1-1 Chapter 2 Objectives and Scope of Guideline and Manual .................................................... 2-1 Chapter 3 Outline of Hydropower Generation ........................................................................ 3-1 Chapter 4 Development Aid Programs ................................................................................... 4-1
Part 2 Reconnaissance Study
Chapter 5 Planning by Reconnaissance Study Method........................................................... 5-1 Chapter 6 Preliminary Estimate of Construction Cost and Project Optimization ................... 6-1 Chapter 7 Application of Reconnaissance Study Method....................................................... 7-1
Part 3 Feasibility Study on Conventional Hydropower Projects
Chapter 8 Objectives and Flow of Feasibility Study .............................................................. 8-1 Chapter 9 Power Demand Forecast, Geological and Hydrological Studies ............................ 9-1 Chapter 10 Planning of Conventional Hydropower Projects .................................................... 10-1 Chapter 11 Design of Civil Structures ...................................................................................... 11-1 Chapter 12 Design of Electro-mechanical Equipment .............................................................. 12-1 Chapter 13 Design of Transmission and Transformation Facilities .......................................... 13-1 Chapter 14 Construction Planning and Construction Cost Estimate ........................................ 14-1 Chapter 15 Environmental and Social Considerations ............................................................. 15-1 Chapter 16 Economic and Financial Analyses .......................................................................... 16-1
Part 4 Feasibility Study of Pumped Storage Project
Chapter 17 Roles of Pumped Storage Projects in Electric Power System ................................ 17-1 Chapter 18 Planning of Pumped Storage Projects .................................................................... 18-1 Chapter 19 Design of Pumped Storage Projects ....................................................................... 19-1
Part 5 Operation and Maintenance
Chapter 20 Operation and Maintenance ................................................................................... 20-1
Part 1
Significance of Hydroelectric Power
Development

TABLE OF CONTENTS
Chapter 1 Significance of Hydroelectric Power Development ........................................ 1-1
Chapter 2 Objectives and Scope of Guideline and Manual ............................................. 2-1
2.1 Objectives ................................................................................................................. 2-1 2.2 Scope of Manual ....................................................................................................... 2-1 2.3 Composition of Manual ............................................................................................ 2-2
Chapter 3 Outline of Hydropower Generation ................................................................. 3-1
3.1 Energy of Hydropower ............................................................................................. 3-1 3.1.1 Hydropower Generation ............................................................................ 3-1 3.1.2 Electric Power Output ............................................................................... 3-1 3.1.3 Energy Generation .................................................................................... 3-1
3.2 Types of Hydropower Plant ...................................................................................... 3-2 3.2.1 Classification from Viewpoint of Power Supply Capability ..................... 3-2 3.2.2 Classification by Method of Head Acquisition ......................................... 3-4
3.3 Power Demand and Supply ...................................................................................... 3-5 3.4 Current Situation on Hydropower Development, and Climate Change and
Hydropower .............................................................................................................. 3-6 3.4.1 Current Situation on Hydropower Development ...................................... 3-6 3.4.2 Climate Change and Hydropower ............................................................. 3-8
Chapter 4 Development Aid Programs .............................................................................. 4-1
4.1 Development Aid Programs of Japan ....................................................................... 4-1 4.1.1 Types of Economic Participation Programs .............................................. 4-1 4.1.2 Official Development Assistance (ODA) .................................................. 4-1
4.2 Technical Cooperation .............................................................................................. 4-2 4.2.1 Training Acceptance.................................................................................. 4-2 4.2.2 Dispatch of Experts ................................................................................... 4-3 4.2.3 Technical Cooperation Project .................................................................. 4-4 4.2.4 Technical Cooperation for Development Planning ................................... 4-5
4.3 ODA Loans (Yen Loan) ............................................................................................ 4-5 4.3.1 General ...................................................................................................... 4-5 4.3.2 Type of ODA Loans .................................................................................. 4-5 4.3.3 Project Cycle ............................................................................................. 4-6 4.3.4 Flow of Yen Loan ...................................................................................... 4-6
4.4 Grant Aid Cooperation ............................................................................................. 4-9 4.5 Development Scheme by IPP ................................................................................... 4-9
4.5.1 IPP Project Scheme ................................................................................... 4-9
i

4.5.2 Development Aid Programs by Japanese Government ........................... 4-12 4.6 Development Scheme by PPP .................................................................................. 4-14
LIST OF FIGURES
Figure 3-1 Run-of-River Type ............................................................................................ 3-2 Figure 3-2 Pondage Type and Reservoir Type.................................................................... 3-3 Figure 3-3 Types of Pumped Storage ................................................................................. 3-4 Figure 3-4 Dam and Waterway Type .................................................................................. 3-4 Figure 3-5 (a) Example of Daily Load Curve (System Composed Mainly of Thermal
Power) ............................................................................................................... 3-5 Figure 3-5 (b) Example of Daily Load Curve (System Composed Mainly of
Hydropower) ..................................................................................................... 3-6 Figure 3-6 Variation of Rainfall Amount and Influence to GDP Growth and
Agricultural GDP Growth ................................................................................. 3-8 Figure 3-7 Economically Feasible Hydropower ................................................................. 3-8 Figure 3-8 Changes in Annual Rainfall Due to Global Warming ....................................... 3-9 Figure 4-1 ODA Mechanism of Japan ................................................................................ 4-2 Figure 4-2 Types of Training Program ............................................................................... 4-2 Figure 4-3 Trainee Acceptance System .............................................................................. 4-3 Figure 4-4 Expert Dispatch System .................................................................................... 4-4 Figure 4-5 Project Cycle ..................................................................................................... 4-6 Figure 4-6 Flow of Yen Loan ............................................................................................. 4-8 Figure 4-7 IPP Scheme ....................................................................................................... 4-10 Figure 4-8 Oversea Investment Loan by JBIC ................................................................... 4-13 Figure 4-9 Structure of Export Loan .................................................................................. 4-14 Figure 4-10 Partnership among Four Participants to PPP .................................................... 4-15
ii

Chapter 1
Significance of Hydroelectric Power
Development

Guideline and Manual for Hydropower Development Vol. 1 Conventional Hydropower and Pumped Storage Hydropower Chapter 1 Significance of Hydroelectric Power Development
(1) Use of undeveloped energy
It is now known from available reports that developable potential hydro resources world-wide are equivalent to approximately 14 trillion kWh per year. Most of these hydro resources are located in the developing countries where sharp increases in energy demands are on-going. Development of these undeveloped hydro resources would contribute greatly in easing the global energy demand and supply balance.
(2) Global environment issues
With the increasing use of energy each year, the combustion of fossil fuel has resulted in an increasing volume of carbon dioxide (CO2), and global warming become an urgent concern with global environmental problems. It has also resulted in acid rain problems caused by gaseous pollutants (Sox & NOx) emissions into the atmosphere. In developing countries, wood and charcoal fuels are the major energy resources, resulting in ever-advancing deforestation and desertification. Under these circumstances, demands for the development of non-fossil energy sources are growing stronger. Hydropower, especially, is a renewable energy which offers excellent merits against the negative factors of carbon dioxide and other flue gases which contaminate our environment.
(3) Economic development of developing countries
With advancing industrialization and strong moves toward better standards of living, the energy demands of the developing countries are rising significantly. The development of electricity related infrastructures is, therefore, a matter of vital importance to assure sustained growth of the economy. Since hydro power resource is an indigenous and renewable energy, its development enhances energy self-sufficiency. It also contributes toward improving the balance of payment of international trade and self-sustaining economic growth. With this, through more than 100 years of practical application, hydropower generation technology is already well established. Transfer of the appropriate technologies to engineers of the developing countries enables production of safe, reliable electric energy. The major construction works for hydropower plants can be done with domestic currency, thereby providing significant beneficial effects on domestic employment and contributing even further to a nation’s economic prosperity.
(4) Local energy source
Electricity consumption is mainly concentrated in cities and suburban areas and the imbalance with the outlying areas is quite remarkable. A relatively small hydropower development plays a significant role in not only providing local electrification, but also in enhancing local prosperity. It responds to basic human needs as the alternative energy replacing wood and charcoal fuel for
1 - 1

Guideline and Manual for Hydropower Development Vol. 1 Conventional Hydropower and Pumped Storage Hydropower
heating and lighting and as the alternative energy which replaces human and animal labor for irrigation, drainage, drinking water supply, and as motive power for small processing plants. It also contributes to vitalizing local community activities, for instance, the electrification of public facilities such as hospitals and schools improves the local economy, living standards and cultural standards. The small scale hydropower supplying energy for rural area is described in Vol.2.
(5) Stabilization of electricity rate
Hydropower generation incurs no fuel costs but the large initial investment is reflected in the large proportion of capital cost in the power production cost. Though the production cost at the beginning of service life is somewhat higher than that for a thermal power plant, no fuel costs means lower unit production cost increase against inflation once the plant is completed, enabling stable, and low priced power supply for a very long period.
(6) Efficiency improvement in the entire power system
Generally, power demands fluctuate significantly depending on the time of the day. One significant feature of a hydropower plant controlled with a reservoir or pondage, and a pumped storage hydropower plant is that it is able to respond instantly to such fluctuations. Contrarily, while thermal power plants provide high efficiency through constant operation, they do not however, have a quick load following characteristic to demand fluctuations. Therefore, the combination of hydropower and thermal power provides higher efficiency in the entire power system.
1 - 2

Chapter 2 Objectives and Scope of Guideline and Manual

Guideline and Manual for Hydropower Development Vol. 1 Conventional Hydropower and Pumped Storage Hydropower Chapter 2 Objectives and Scope of Guideline and Manual
2.1 Objectives
This guideline and manual (hereinafter referred to as "Manual") describes the hydropower projects as electric power supply sources for the electric power system. Manual includes the contents mainly project development scheme, initial study stage and feasibility study stage.
Manual is specially designed for policy makers, executives of generating authorities and private power companies, and hydro power engineers in developing countries.
The content focuses on the following;
To provide central government officials, executives of private power companies and power
authorities with basic knowledge of hydro power generation, in order to understand the process
required to implement a project and to understand the development aid scheme.
To provide engineers in developing countries with planning method in the initial stage to
enable them to find new projects, formulate hydropower potential study and to understand the
basic concept of the feasibility study.
2.2 Scope of Manual
Hydropower generation systems are mainly classified into the conventional and the pumped storage types as described below.
This Manual describes generation systems of conventional and pumped storage types. The development scale for conventional type covers 5MW to 500MW, and those of pumped storage type cover 100MW to 1,000MW. The projects mentioned above are to be newly constructed and connected to the power grid system. Small scale hydropower projects for rural electrification are described in Vol.2.
The process from planning to operation of hydropower development projects is classified into investigation and planning, design, construction, and operation and maintenance stages as shown in the followings.
1) Investigation and planning : Reconnaissance study, Feasibility study
2) Design : Detailed design
Hydropower generation
Conventional type
Pumped storage type
Run-of-river type Reservoir type Pondage type
Pure pumped storage type Pumped and natural flow storage type
2 - 1

Guideline and Manual for Hydropower Development Vol. 1 Conventional Hydropower and Pumped Storage Hydropower
3) Construction : Civil works, Hydro-mechanical and Hydro-electrical works
4) Operation & maintenance : O & M of power plant, Environment monitoring
This Manual describes the reconnaissance study and the feasibility study of hydropower projects. Reconnaissance study is defined as investigation and planning based on topographic maps to scale 1/10,000-1/50,000 as these are easily acquired in the developing countries. The basic concept of feasibility study is also explained herein.
As reference, important items related to the operation and maintenance of civil facilities and electric facilities are also described.
2.3 Composition of Manual
Vol.1 of this Manual consists of following 20 chapters in which Chapter 5, 6, 10, 14, 16 and 20 are almost same contents as “Guild Manual for Development aid Programs and Studies of Hydro Electric Power Projects” prepared by the New Energy Foundation in 1996.
Several technical methods and approaches are used such as investigations, studies to develop hydropower projects for power systems. This Manual introduces one of the typical methods in Chapter 5 to 20, however another methods could be used depending on the conditions which each project faces.
(1) Part 1 (Introduction of hydropower)
This Part consists of Chapters 1 to 4.
Significance of hydropower development, hydropower generation systems are explained as basic knowledge for those engaged in development of hydropower projects.
The following are the major content.
Concept of power output and electric energy of hydropower station
Power generation systems such as run-of-river type, pondage type, reservoir type, and pumped storage type
Positioning of hydropower as a supply source in response to the power demand
Development aid programs provided by Japan and international organizations
(2) Part 2 (Reconnaissance study)
This Part consists of Chapters 5 to 7.
It describes the concept and methodology of hydropower planning in the reconnaissance study stage, and hydropower potential study, and master plan study.
The following are the major subjects.
Pre-investigation (collection of topographic and geologic maps and runoff data, etc.) prior to project study
2 - 2

Guideline and Manual for Hydropower Development Vol. 1 Conventional Hydropower and Pumped Storage Hydropower
Calculation method of river flow at the planned site
Selection of dam and powerhouse locations, waterway route, determination of plant discharge, head calculation, selection of turbine and generator, calculation method of power output and energy generation
Simplified method to calculate the work quantity for each structure such as the dam, waterway, and powerhouse, and their approximate construction cost
Simplified benefit-cost ration analysis (B/C) using the approximate construction cost and generated energy, and economic analysis method using as indicator construction cost per kWh
Main points for confirming the viability of a planned project from the site reconnaissance
Methodology to make a master plan of river basin is descried by using the method above.
(3) Part 3 (Feasibility study of hydropower project for conventional type)
This Part consists of Chapters 8 to 16.
It describes the concept of feasibility study and the following are the major subjects.
Methodology of power demand forecast Positioning of the planned hydropower project in the electric power system
Investigation for feasibility study using topographic and geologic data, aerial photograph interpretation, physical prospecting, drilling, and exploratory adit
Methodology of hydrologic and meteorological study, and hydrologic analysis
Methodology of hydropower planning
Design of civil structures including the dam, intake facility, water conveyance facility, and powerhouse
Design of electric facilities including turbine and generator
System analysis and design of transmission facility
Construction planning, construction schedule and construction cost estimate
Environmental assessment
Economic analysis using border price and shadow price to benefit-cost method and internal rate of return
Financial analysis and generation cost
Cost allocation for multi-purpose dam
(4) Part 4 (Feasibility study of hydropower project for pumped storage type)
This Part consists of Chapters 17 to 18.
It describes the concept of feasibility study and the following are the major subjects.
2 - 3

Guideline and Manual for Hydropower Development Vol. 1 Conventional Hydropower and Pumped Storage Hydropower
Positioning of the planned pumped storage project in the electric power system
Methodology of pumped storage hydropower planning
Design of civil structures
Design of electric facilities including turbine and generator
(5) Part 5 (Operation & maintenance of hydropower plant)
This Part consists of Chapter 20, and describes operation and maintenance of hydropower plant.
2 - 4

Chapter 3 Outline of Hydropower Generation
Guideline and Manual for Hydropower Development Vol. 1 Conventional Hydropower and Pumped Storage Hydropower Chapter 3 Outline of Hydropower Generation
3.1 Energy of Hydropower
3.1.1 Hydropower Generation
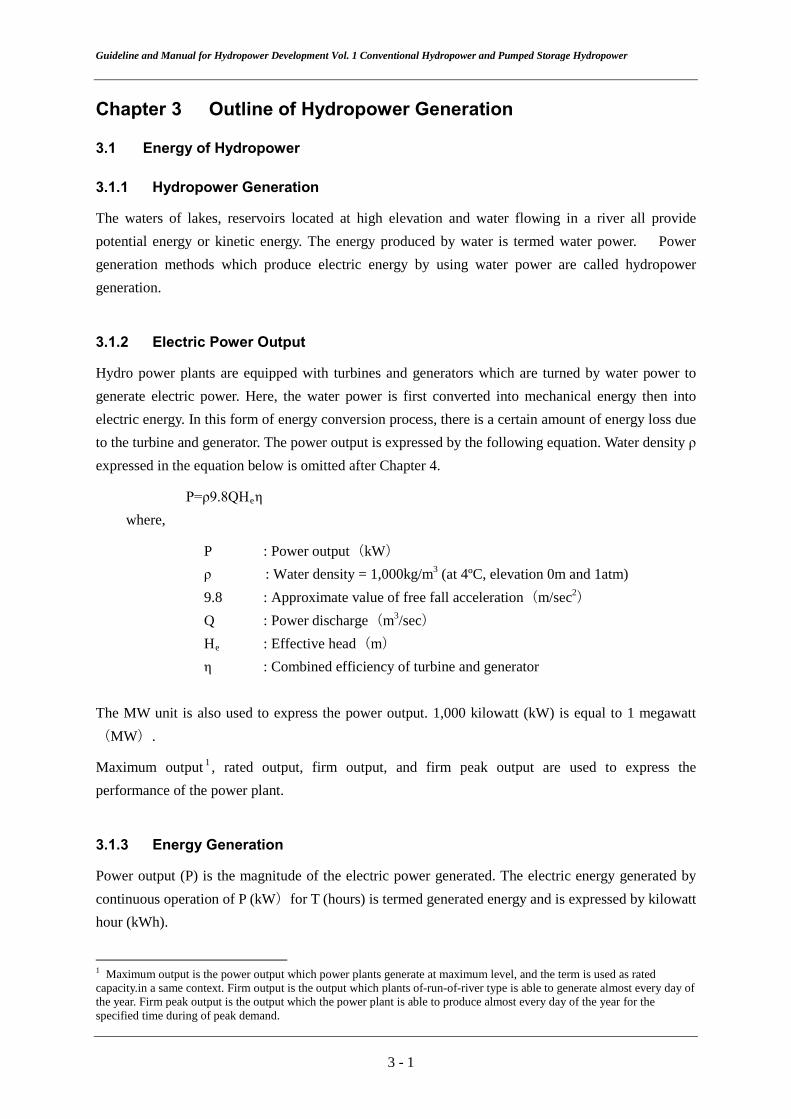
The waters of lakes, reservoirs located at high elevation and water flowing in a river all provide potential energy or kinetic energy. The energy produced by water is termed water power. Power generation methods which produce electric energy by using water power are called hydropower generation.
3.1.2 Electric Power Output
Hydro power plants are equipped with turbines and generators which are turned by water power to generate electric power. Here, the water power is first converted into mechanical energy then into electric energy. In this form of energy conversion process, there is a certain amount of energy loss due to the turbine and generator. The power output is expressed by the following equation. Water density ρ expressed in the equation below is omitted after Chapter 4.
P=ρ9.8QHeη where,
P : Power output(kW) ρ : Water density = 1,000kg/m3 (at 4ºC, elevation 0m and 1atm) 9.8 : Approximate value of free fall acceleration(m/sec2) Q : Power discharge(m3/sec) He : Effective head(m) η : Combined efficiency of turbine and generator
The MW unit is also used to express the power output. 1,000 kilowatt (kW) is equal to 1 megawatt(MW).
Maximum output 1 , rated output, firm output, and firm peak output are used to express the performance of the power plant.
3.1.3 Energy Generation
Power output (P) is the magnitude of the electric power generated. The electric energy generated by continuous operation of P (kW)for T (hours) is termed generated energy and is expressed by kilowatt hour (kWh).
1 Maximum output is the power output which power plants generate at maximum level, and the term is used as rated capacity.in a same context. Firm output is the output which plants of-run-of-river type is able to generate almost every day of the year. Firm peak output is the output which the power plant is able to produce almost every day of the year for the specified time during of peak demand.
3 - 1

Guideline and Manual for Hydropower Development Vol. 1 Conventional Hydropower and Pumped Storage Hydropower 3.2 Types of Hydropower Plant
3.2.1 Classification from Viewpoint of Power Supply Capability
(1) Conventional hydropower
1) Run-of-river type
This type takes water from the natural runoff to generate electricity, therefore it has no reservoir or pond to adjust river runoff to the generation. Waterway type mentioned in 3.2.2 (1) is the category of this type. Most of the small scale hydropower adopts run-of-river type.
Area affected by river diversion
Powerhouse
Head tank
Penstock
Headrace
Intake weir
Area affected by river diversion
Powerhouse
Head tank
Penstock
Headrace
Intake weir
Powerhouse
Head tank
Penstock
Headrace
Intake weir
Powerhouse
Head tank
Penstock
Headrace
Intake weir
Figure 3-1 Run-of-River Type
2) Pondage type
The pondage type has a pond which can regulate the river runoff for one to several days as shown in Figure 3-2. Power demand changes in a day depending on time, the hydropower of pondage type can regulate river runoff to follow the change in power demand.
3) Reservoir type
A power plant with a reservoir which can regulate annual or seasonal river runoff is called the reservoir type as shown in Figure 3-2. Since river runoff changes depending on the season, a reservoir stores water in a rainy season and releases it in a dry season. The reservoir can release an even flow throughout the year as much as possible. This type has the same function as the pondage type to be able to follow the change in power demand. It is used for large scale hydropower plants.
3 - 2

Guideline and Manual for Hydropower Development Vol. 1 Conventional Hydropower and Pumped Storage Hydropower
Dam
Tailrace
Penstock
Powerhouse
Dam
Tailrace
Penstock
Powerhouse
Figure 3-2 Pondage Type and Reservoir Type
(2) Pumped storage hydropower
The pumped storage power plant consists of upper pond (or upper reservoir), lower pond (or lower reservoir), waterway and powerhouse, as shown in Figure 3-3. In this system, electricity is generated with the water stored in the upper pond in response to the peak demand in the daytime. Contrarily, during the night time when the power demand drops, the water is pumped up from the lower pond to the upper pond using the excess energy generated by the thermal power.
Pumped storage power generation is classified into the "pure pumped storage type” and "pumped and natural flow storage type" as shown in Figure 3-3 and below.
1) Pure pumped storage type
Electricity of the pure pumped storage type is generated by utilizing the head and circulating water stored in the lower and upper ponds. This type is not affected by river flow because the power plant does not use natural water but uses only circulating water. Therefore the output can be set freely by determining the head and maximum plant discharge.
2) Pumped and natural flow storage type
Electricity of the pumped and natural flow storage type is generated by utilizing the circulating water stored in the lower and upper ponds and natural flow into the upper pond. This type has a merit to be able to reduce pumping energy by using natural flow into the upper pond.
3 - 3
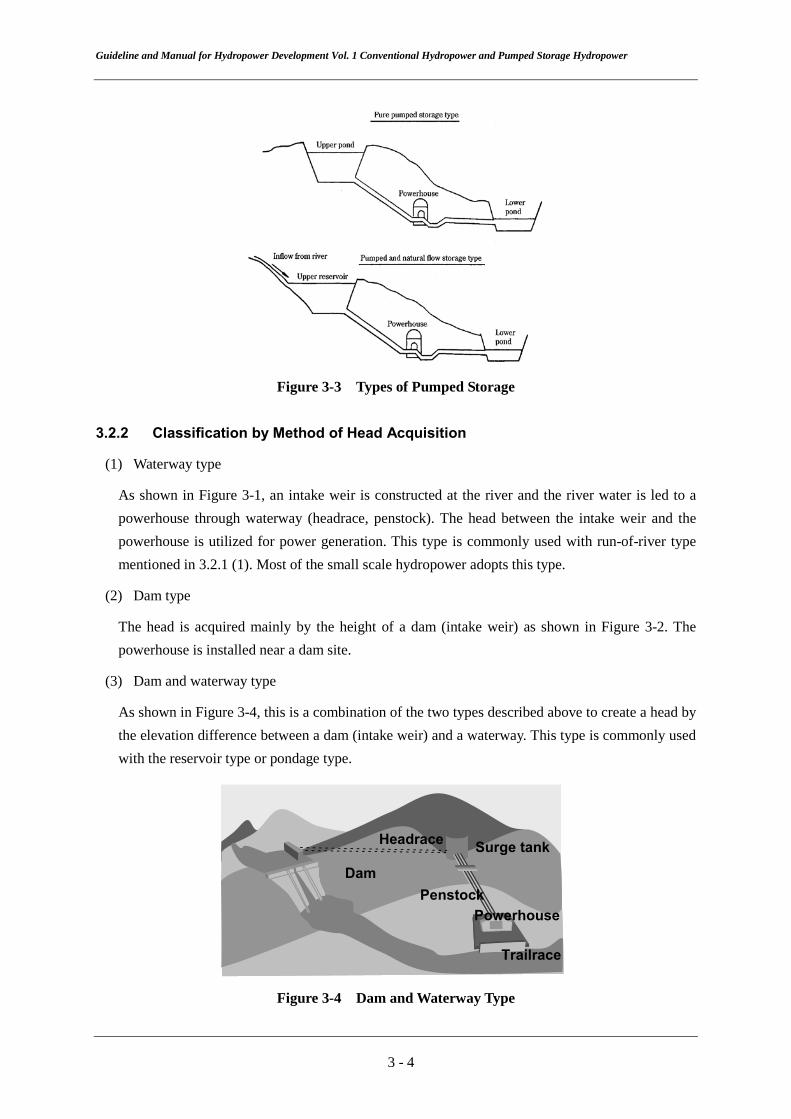
Guideline and Manual for Hydropower Development Vol. 1 Conventional Hydropower and Pumped Storage Hydropower
Figure 3-3 Types of Pumped Storage
3.2.2 Classification by Method of Head Acquisition
(1) Waterway type
As shown in Figure 3-1, an intake weir is constructed at the river and the river water is led to a powerhouse through waterway (headrace, penstock). The head between the intake weir and the powerhouse is utilized for power generation. This type is commonly used with run-of-river type mentioned in 3.2.1 (1). Most of the small scale hydropower adopts this type.
(2) Dam type
The head is acquired mainly by the height of a dam (intake weir) as shown in Figure 3-2. The powerhouse is installed near a dam site.
(3) Dam and waterway type
As shown in Figure 3-4, this is a combination of the two types described above to create a head by the elevation difference between a dam (intake weir) and a waterway. This type is commonly used with the reservoir type or pondage type.
Headrace
DamPenstock
Trailrace
Powerhouse
Surge tankHeadrace
DamPenstock
Trailrace
Powerhouse
Surge tank
Figure 3-4 Dam and Waterway Type
3 - 4

Guideline and Manual for Hydropower Development Vol. 1 Conventional Hydropower and Pumped Storage Hydropower 3.3 Power Demand and Supply
Power demand fluctuates according to the time of day and by season. The power demand to the power supplier is called load. The curve showing the load fluctuation status in timed sequence is called the load curve. In most cases, a load fluctuation curve is produced for one single day (24hours) and is termed the daily load curve, an example is shown in Figure 3-5. The curve showing load fluctuation for one year is termed the annual load curve.
The characteristics of daily load fluctuation vary depending on the composition of the power demand. Generally, the load increases in the daytime due to the operation of factories and offices, or in the evening when electricity is consumed for lighting. It drops off through the night to the early morning and again during the noon-time period. In the load curve, peak load may include those areas before and after reaching its peak. The heavy load time of day is termed on-peak load times (peak time) while the light load time of day late at night and early in the morning is termed the off-peak load time (off-peak time).
Electric power supply in response to the power demand is depicted in the load curve show in Figure 3-5 described above. Figure 3-5 (a) show examples of power systems in which the major power source is thermal power. Figure 3-5 (b) shows the case where the major power source is hydro power.
Of the hydro power plants, run-of-river plants takes charge of the base load in the daily load curve. The reservoir type, pondage type and pumped storage type power plants generally take charge of peak demand. Run-of-river plants do not have the capability to regulate the river runoff to generate electricity in response to peak power demand however the other three types of plants can regulate the river flow to generate peak power at the time and in the quantity as required by the system load.
Figure 3-5 (a) Example of Daily Load Curve (System Composed Mainly of Thermal Power)
3 - 5
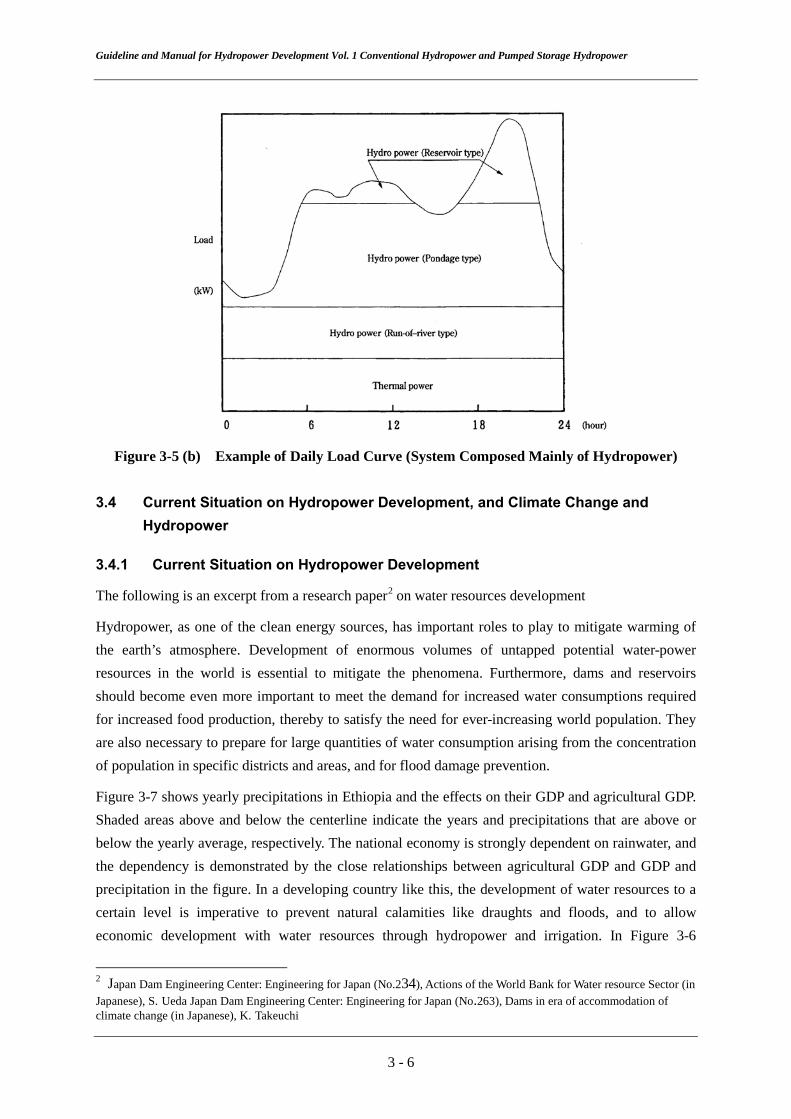
Guideline and Manual for Hydropower Development Vol. 1 Conventional Hydropower and Pumped Storage Hydropower
Figure 3-5 (b) Example of Daily Load Curve (System Composed Mainly of Hydropower) 3.4 Current Situation on Hydropower Development, and Climate Change and
Hydropower
3.4.1 Current Situation on Hydropower Development
The following is an excerpt from a research paper2 on water resources development
Hydropower, as one of the clean energy sources, has important roles to play to mitigate warming of the earth’s atmosphere. Development of enormous volumes of untapped potential water-power resources in the world is essential to mitigate the phenomena. Furthermore, dams and reservoirs should become even more important to meet the demand for increased water consumptions required for increased food production, thereby to satisfy the need for ever-increasing world population. They are also necessary to prepare for large quantities of water consumption arising from the concentration of population in specific districts and areas, and for flood damage prevention.
Figure 3-7 shows yearly precipitations in Ethiopia and the effects on their GDP and agricultural GDP. Shaded areas above and below the centerline indicate the years and precipitations that are above or below the yearly average, respectively. The national economy is strongly dependent on rainwater, and the dependency is demonstrated by the close relationships between agricultural GDP and GDP and precipitation in the figure. In a developing country like this, the development of water resources to a certain level is imperative to prevent natural calamities like draughts and floods, and to allow economic development with water resources through hydropower and irrigation. In Figure 3-6
2 Japan Dam Engineering Center: Engineering for Japan (No.234), Actions of the World Bank for Water resource Sector (in Japanese), S. Ueda Japan Dam Engineering Center: Engineering for Japan (No.263), Dams in era of accommodation of climate change (in Japanese), K. Takeuchi
3 - 6

Guideline and Manual for Hydropower Development Vol. 1 Conventional Hydropower and Pumped Storage Hydropower economically feasible hydropower potential is shown horizontally, while the ratios of hydropower already developed are plotted vertically. In spite of greater potential hydropower resources in Asia, China, South America and Africa, the large percentage of them still remain untapped. In recognition of the close relationships between water resources and GDP and untapped potential hydropower, the World Bank published new water resource strategies in 2003. It cites five major policies:
(1) National level of water resources development contributes to the improvement of living standards of citizens through wider economic benefits it entails. It differs from a small-scale sanitary and tap water business targeted to the poorest segment of population.
(2) Effective water resources management necessitates existence of infrastructure relating to the water resources. Lack of such provisions in developing countries warrants immediate water resources development.
(3) In dry and semi-dry regions like Africa, fluctuations of rainwater are generally large. In such cases, securing of stable supply of water is a fundamental condition for any economic development.
(4) A big project like aqueducts and water reservation involves multi-faceted expertise and nations. This essentially precludes development of such a project by a developing nation on its own. This necessitates the World Bank to support projects having greater contributions to nations’ economy and to the improvement of living standards of citizens-a project of high risks and high returns-with careful attentions and considerations to socio-environmental aspects.
(5) Where the World Bank supports developing nations in water resources areas; it will evaluate their political and economic conditions, and will develop a country by country base of water resources development strategies. Deliberations in the course of strategy preparation will cover basic policy for water management, including water costs and cost recovery.
Every project financed by the World Bank has to observe ten safeguard policies on socio-environmental matters: environmental assessment, habitat environment, forests, pesticide control, resident relocation, aborigines, cultural heritages, dam safety, and business in international waters and disputed areas. The bank makes it clear that requires the funded to strictly observe the policies, and any incompliance with them by the funded constitutes a cause for immediate withdrawal of loans.
3 - 7

Guideline and Manual for Hydropower Development Vol. 1 Conventional Hydropower and Pumped Storage Hydropower
Source: World Bank Figure 3-6 Variation of Rainfall Amount and Influence to GDP Growth and Agricultural GDP
Growth
Figure 3-7 Economically Feasible Hydropower 3.4.2 Climate Change and Hydropower
(1) Changes in yearly precipitation from global warming
The following is an excerpt from a research paper3 on changes of hydrology circulation from
3 Matsuoka, Sugita, Tanaka, Matuyama, Tezuka, Onda: Global Environmentology (in Japanese), p.p49-50, 2007
3 - 8
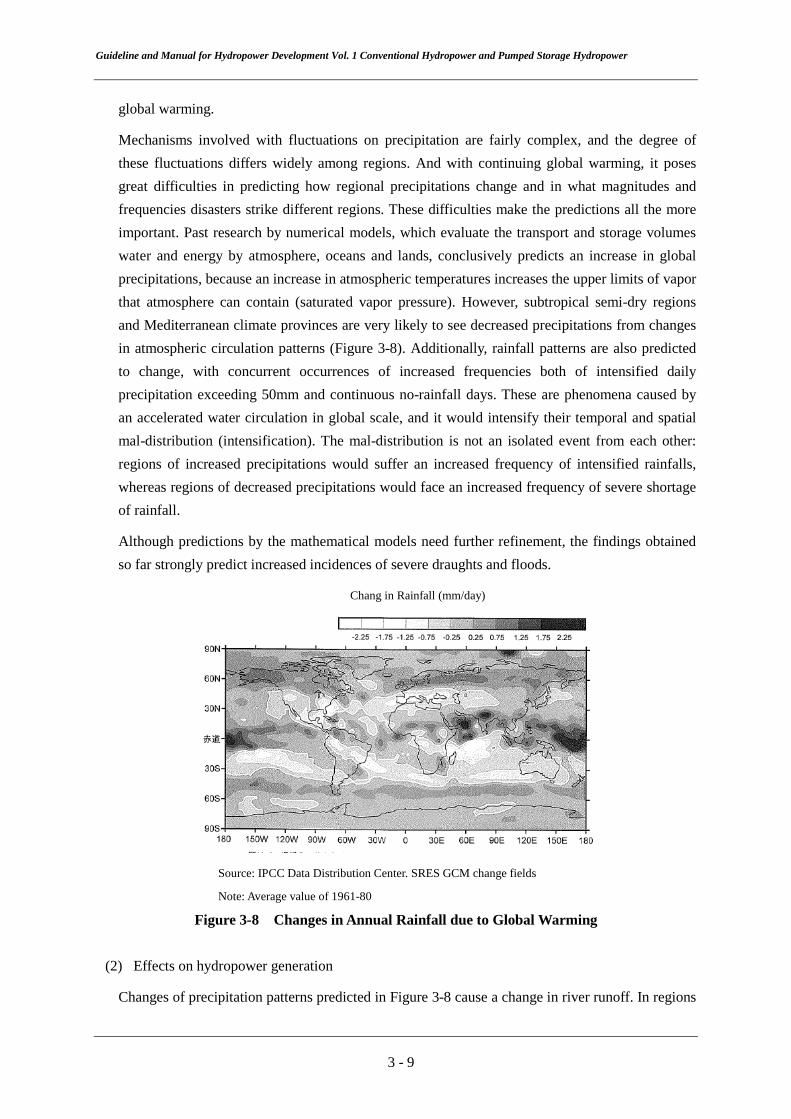
Guideline and Manual for Hydropower Development Vol. 1 Conventional Hydropower and Pumped Storage Hydropower
global warming.
Mechanisms involved with fluctuations on precipitation are fairly complex, and the degree of these fluctuations differs widely among regions. And with continuing global warming, it poses great difficulties in predicting how regional precipitations change and in what magnitudes and frequencies disasters strike different regions. These difficulties make the predictions all the more important. Past research by numerical models, which evaluate the transport and storage volumes water and energy by atmosphere, oceans and lands, conclusively predicts an increase in global precipitations, because an increase in atmospheric temperatures increases the upper limits of vapor that atmosphere can contain (saturated vapor pressure). However, subtropical semi-dry regions and Mediterranean climate provinces are very likely to see decreased precipitations from changes in atmospheric circulation patterns (Figure 3-8). Additionally, rainfall patterns are also predicted to change, with concurrent occurrences of increased frequencies both of intensified daily precipitation exceeding 50mm and continuous no-rainfall days. These are phenomena caused by an accelerated water circulation in global scale, and it would intensify their temporal and spatial mal-distribution (intensification). The mal-distribution is not an isolated event from each other: regions of increased precipitations would suffer an increased frequency of intensified rainfalls, whereas regions of decreased precipitations would face an increased frequency of severe shortage of rainfall.
Although predictions by the mathematical models need further refinement, the findings obtained so far strongly predict increased incidences of severe draughts and floods.
Chang in Rainfall (mm/day)
Source: IPCC Data Distribution Center. SRES GCM change fields
Note: Average value of 1961-80
Figure 3-8 Changes in Annual Rainfall due to Global Warming
(2) Effects on hydropower generation
Changes of precipitation patterns predicted in Figure 3-8 cause a change in river runoff. In regions
3 - 9

Guideline and Manual for Hydropower Development Vol. 1 Conventional Hydropower and Pumped Storage Hydropower
where decreased precipitations are forecasted, a quantity of water usable for generation decreases which, in turn, reduces electricity generated. In addition, a growth of population in global magnitude increases water consumption. For example, an increased consumption of water drawn from the reservoir located upstream of a river for irrigation, would reduce the quantity of water available for power plants located downstream.
Even in cases where yearly precipitations remain unchanged, a short-term intensified precipitation would occur and, as a result, a possibility exists where river runoff greater than the expected values flows within a short span of time. Hydropower plants without reservoirs would be incapable of utilizing a river runoff of short duration which exceeds the maximum flows for the plants. And even for a hydropower with reservoirs, reservoir operation rules determined before global warming may become obsolete for flow patterns occurring from global warming.
3 - 10

Chapter 4 Development Aid Programs

Guideline and Manual for Hydropower Development Vol. 1 Conventional Hydropower and Pumped Storage Hydropower Chapter 4 Development Aid Programs
4.1 Development Aid Programs of Japan
4.1.1 Types of Economic Participation Programs
Aid for the economic development of developing countries is generally called economic cooperation and is mainly classified into the following forms;
Official development assistance (ODA): Loan, technical cooperation, grant aid cooperation,
investment and contribution to international organizations, etc. by the Japanese government
Other Official Flows (OOF): Export credit, direct investment and other funding aid by the
Japanese government.
Private Fund (PF): Export credit, direct investment, etc. by private sectors 4.1.2 Official Development Assistance (ODA)
(1) Definition of ODA
ODA, as defined by the Development Assistance Committee (DAC) of the Organization for Economic Co-operation and Development (OECD), must meet the following three requirements:
It should be undertaken by governments or government agencies.
The main objective is the promotion of economic development and welfare in developing countries.
It has concessional terms, having a grant element1 of at least 25%.
(2) Bilateral aid and multilateral aid
ODA as shown in Figure 4-1 is broadly divided into bilateral aid, in which assistance is given directly to developing countries, and multilateral aid.
Donation of multilateral aid is provided for organizations of the United Nations such as UNDP2, UNFPA3, UNICEF4, and investment of the multilateral aid is provided for international financial institutions such as the IBRD5, IDA6, and ADB7.
Japan International Cooperation Agency (JICA8) provides the bilateral aid consisting of technical cooperation, ODA loans and grant aid shown in Figure 4-1.
1 The grant element measures the concessionality or "softness" of financial terms of a loan. The lower the interest rate and the longer the maturity period, the higher the grant element, which means it is more beneficial to the borrower. The grant element for a grant is 100%. 2 United Nations Development Programme 3 United Nations Population Fund 4 United Nations Children's Fund 5 International Bank for Reconstruction and Development 6 International Development Association 7 Asian Development Bank 8 Japan International Cooperation Agency
4 - 1

Guideline and Manual for Hydropower Development Vol. 1 Conventional Hydropower and Pumped Storage Hydropower
Figure 4-1 ODA Mechanism of Japan
4.2 Technical Cooperation
Technical cooperation consists of trainee acceptance, dispatch of experts, technical cooperation projects, equipment provision, Japan overseas cooperation volunteers, etc. The cooperation relating to an electric power sector is training acceptance, dispatch of experts and technical cooperation projects.
4.2.1 Training Acceptance
The trainee acceptance scheme accepts trainees from developing countries and they are expected to play a leading role in the development of their country. Expert knowledge and technology in many fields are transferred to these people, including administration, agriculture, forestry, fishery, mining, energy, health and medical services, and social welfare. Trainee acceptance schemes on the government base are mainly conducted through JICA as shown in Figure 4-2. Flow chart of the JICA’s training acceptance is shown in Figure 4-3.
Figure 4-2 Types of Training Program
Bilateral Assistance
Multilateral Assistance Grant Aid*
Technical Cooperation
ODA Loan ODA Official Development Assistance
JICA
Group training: according to predetermined course, group training
Ordinary individual training:arranged on indivisual request. Includes trainingpaid for, by receipent countries
Special course:Provided to specific countries, regions orspecific field.
Counterpart training:Project type technical cooperation,short termexperet, development studies, grand aid,immigrant.
Special project
Third country training: Assistance to technical cooperation among developingcountries(TCDC)
Second countries training: Assists to disseminate and establish technologies indeveloping countries
Training inJapan
Individualtraining
Acceptanceof trainee
4 - 2

Guideline and Manual for Hydropower Development Vol. 1 Conventional Hydropower and Pumped Storage Hydropower
Figure 4-3 Trainee Acceptance System Other training is conducted by the Japan Productivity Center-Social Economic Department (JPC-SED) and Association for Overseas Training Service (AOTS).
4.2.2 Dispatch of Experts
The purpose of dispatching experts is to carry out technology transfer from Japanese experts to government officers and engineers in developing countries. The technology transfer is done based on the situation in the countries. Taking into account historical background of the country etc., experts from another country other than Japan can be dispatched if it is more efficient. The flow chart for the dispatch of experts in specific fields by JICA is shown in Figure 4-4. The request form from a developing country must describe the background of the request, the detailed duty of the experts, the assignment in the organization, required years of experience and number of experts, and period of service.
Ministry of Foreign Affairs
Japanese Embassy, Consulate (or JICA overseas office)
Recipient Government
Japanese International Cooperation Agency
(JICA)
Ministries Concerned (METI for power sector) Trainee
4 - 3
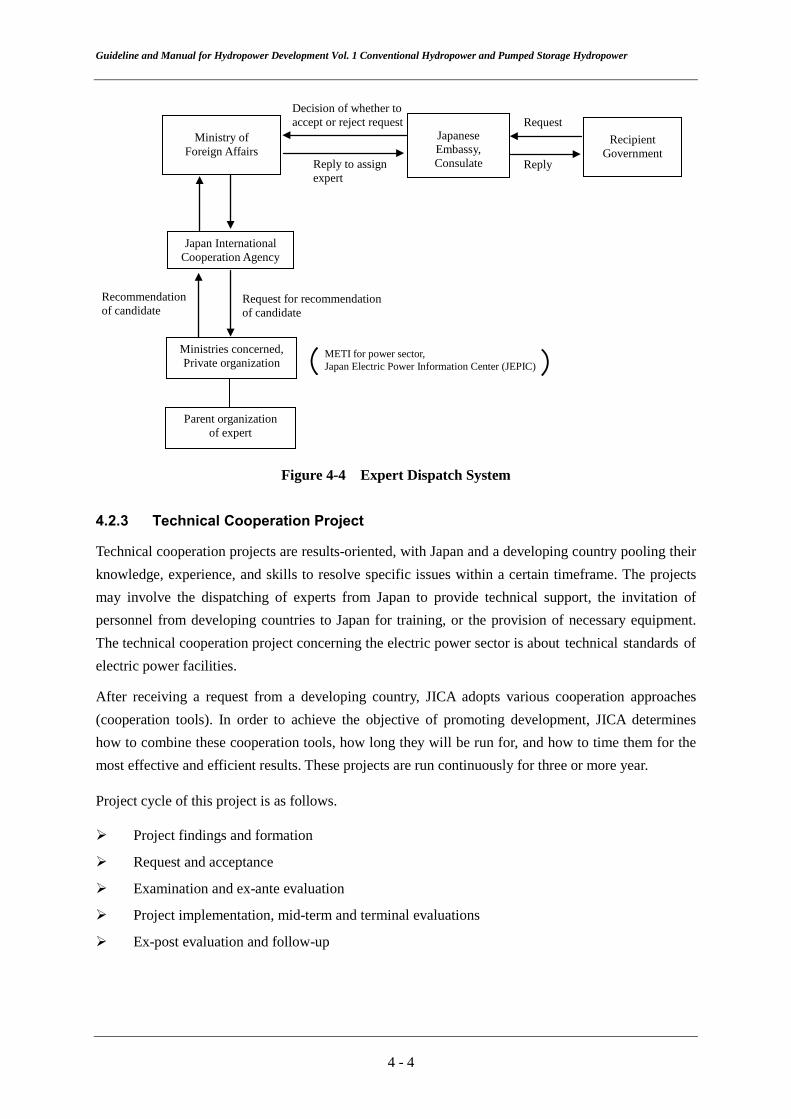
Guideline and Manual for Hydropower Development Vol. 1 Conventional Hydropower and Pumped Storage Hydropower
Figure 4-4 Expert Dispatch System 4.2.3 Technical Cooperation Project
Technical cooperation projects are results-oriented, with Japan and a developing country pooling their knowledge, experience, and skills to resolve specific issues within a certain timeframe. The projects may involve the dispatching of experts from Japan to provide technical support, the invitation of personnel from developing countries to Japan for training, or the provision of necessary equipment. The technical cooperation project concerning the electric power sector is about technical standards of electric power facilities.
After receiving a request from a developing country, JICA adopts various cooperation approaches (cooperation tools). In order to achieve the objective of promoting development, JICA determines how to combine these cooperation tools, how long they will be run for, and how to time them for the most effective and efficient results. These projects are run continuously for three or more year.
Project cycle of this project is as follows.
Project findings and formation
Request and acceptance
Examination and ex-ante evaluation
Project implementation, mid-term and terminal evaluations
Ex-post evaluation and follow-up
Ministry of
Foreign Affairs
Japan International Cooperation Agency
Japanese Embassy, Consulate
Recipient
Government
Ministries concerned, Private organization
Parent organization of expert
Recommendation of candidate
Request for recommendation of candidate
Reply to assign expert
Decision of whether to accept or reject request
Reply
Request
METI for power sector, Japan Electric Power Information Center (JEPIC) ( )
4 - 4

Guideline and Manual for Hydropower Development Vol. 1 Conventional Hydropower and Pumped Storage Hydropower 4.2.4 Technical Cooperation for Development Planning
Technologies on investigation & analysis and planning method are transferred to counterparts in developing countries, by supporting policy planning and public work planning. This includes master plan of public works, feasibility studies, and other investigation such as mapping, etc.
After the cooperation is terminated, the developing countries conduct the followings based on the cooperation result.
Regional and sector development plans, etc. are formulated.
Projects are implemented by finance of international institutions and, etc.
Organization reform and institution reform are implemented as recommended by the cooperation 4.3 ODA Loans (Yen Loan)
4.3.1 General
A government loan is to provide financing of development projects to developing countries at low interest on long, concessional terms. It is also known as a direct government loan or yen loan. Interest rate varies with market conditions, and it is lower than that of other aid organizations. The repayment period varies depending on the project's revenue.
The development of a country’s economic and social infrastructures is a vital factor for its prosperity. In many cases, however, reliance on a market mechanism to secure the required fund is not possible for a developing country. Therefore, the Japanese Government supports the necessary funding on the condition of the self-sustaining efforts of these countries for their economic independence. This is the major purpose of government loan.
4.3.2 Type of ODA Loans
Yen loans are classified into two types, project type and non project type. Projects in power sector are in the category of the project type. The project type has three kinds of loan, project loans, engineering service loans and financial intermediary loans (two-step loan).
(1) Project Loans
Project Loans, which are predominant among ODA loans, finance projects such as roads, power plants, irrigation, water supply and sewerage facilities. The loans are used for the procurement of facilities, equipment and services, or for conducting civil works and other related works.
(2) Engineering Services (E/S) Loans
This type of loan is for engineering services, which are necessary at the survey and planning stages of the projects. The services include reviews of feasibility studies, surveys on detailed data on project sites, detailed designs and preparation of bidding documents. Completion of feasibility studies or their equivalents are prerequisite for this type of loan.
4 - 5

Guideline and Manual for Hydropower Development Vol. 1 Conventional Hydropower and Pumped Storage Hydropower
(3) Financial Intermediary Loans (Two-Step Loans)
Financial intermediary loans are implemented through the financial institutions of the recipient country based on the policy-oriented financial system of that country. These loans provide funds necessary for the implementation of designated policies, such as the promotion of small-and medium-scale enterprises in manufacturing, agriculture, and other specified industries and the construction of facilities to improve the living standards of the poor. These loans are known as "two-step loans" because there are two or more steps before the end-beneficiaries receive the funds. Under this type of loan, funds can be provided to a large number of end-beneficiaries in the private sector. Since these loans are implemented through local financial institutions, they also serve to strengthen the operational capabilities of these institutions and to develop the financial sector of the recipient countries.
4.3.3 Project Cycle
ODA loans follow six steps as shown in Figure 4-5.
1Project
preparation
2Loan request
3Examination/
Appraisal&ex-anteEvaluation of
the project
4Exchange of
Notes and loan agreement
5Project
implementation
6Project
completion/Ex-post evaluation &
folow-up
Figure 4-5 Project Cycle 4.3.4 Flow of Yen Loan
Flow chart of yen loan is shown in Figure 4-6.
(1) Project preparation
Most developing countries formulate and execute their middle and long term development plans to extend over many years. The planned project is included in this development plan. Prior to the implementation of the project, a feasibility study is conducted including technical, economical and environmental analysis as well as a study of alternative plans. The feasibility study may be carried out by the government of the recipient country, or through the technical cooperation of JICA or other international organizations. JICA may carry out an investigation which integrates project formation process for technical cooperation, ODA loans and grant.
4 - 6

Guideline and Manual for Hydropower Development Vol. 1 Conventional Hydropower and Pumped Storage Hydropower
(2) Request
The government of a recipient country requests a loan to the Japanese Government through the Japanese Embassy, together with the project implementation plan based on the feasibility study.
(3) Study and appraisal of the project
As it is necessary to justify that the project implementation will contribute to developing the economy and to improving the living standard in the recipient country, the following matters are confirmed by the Japanese Government before making a commitment for financing.
Feasibility, viability, environmental consideration, benefits, of the projects.
Priority and importance of the project in the economic development program of the recipient country
The contents of the feasibility study are examined to confirm that the project is technically, economically and financially feasible. In case of a yen loan, submission of a feasibility study report is required when applying for a loan. Once a feasibility study report is submitted, a government mission may be dispatched to discuss the details of the project with the government of the applicant country. If the project is deemed promising, an appraisal is conducted by the JICA.
In the JICA appraisal, discussions with the implementing organization and site survey are carried out by the mission. A comprehensive study is conducted including macro economic analysis to test the loan repayment capability together with further detailed technical, economical and environmental analysis of the project.
Based on the results of the JICA appraisal, the amount of the loan and its terms are determined by the Japanese Government through discussions with the government of the applicant country.
(4) Exchange of notes and loan agreement
The Japanese Government conveys its decision to the applicant country through the Japanese Embassy or at an international meeting. This is called a pledge. An exchange of notes (E/N) is describing the agreed detailed conditions is signed by the two governments.
The JICA then concludes a loan agreement (L/A) with the recipient country which binds the rights and obligations of the signatory of the loan. Legal and financial matters, procurement method, disbursement procedure, project purpose, project scope, and content are specified in this L/A.
(5) Project implementation (Procurement, disbursement, etc.)
The project is implemented following the signing of the L/A. A consultant is first selected by a short list method normally employed internationally when hiring consultants. The materials, equipment and services required for the project are then procured by international competitive bidding. Such procurement is carried out according to JICA guidelines.
4 - 7

Guideline and Manual for Hydropower Development Vol. 1 Conventional Hydropower and Pumped Storage Hydropower
While the loan is provided in response to the request or application of a country, in actual practice, however, disbursement from the loan is made, in principle, according to the payment terms and conditions in the agreement and/or contract with the suppliers of goods and services with the project progress after the procurement stage.
Foreign consultants carry out bidding matters of construction, construction supervision under cooperation with clients in order for construction to proceed as expected, as mentioned below.
Whether the project progress is on schedule
Whether the construction is carried out in accordance with the detailed design
Whether the construction material and facility are used properly
(6) Project completion and post evaluation
When the project is completed after such process, post evaluation is carried out.
Post evaluation is conducted by the JICA or by a third party. Following its completion, the management and operation of the project is the responsibility of the recipient country. However, JICA directs its attention to inform itself of actual conditions in order to provide appropriate advice as required. The followings are evaluated for post evaluations.
Whether the project was able to realize its purpose
Whether the procurement procedure was appropriate
Change in social and economical environment at project site
Strengthening of project implementation organization
Whether the project involved in vast cost overrun
Figure 4-6 Flow of Yen Loan
ProjectPreparation
LoanRequest
Fact Finding (F/F)Appraisal
Prior Notification,E/N, L/A
Implementationmid-term review
Completionpost-evalation
ProjectPreparation
LoanRequest
Fact Finding (F/F)Appraisal
Prior Notification,E/N, L/A
Implementationmid-term review
Completionpost-evalation
Consultation, Info. gathering
Info. collection
TA by JICA(training, TA by expert)
Monitoring, TA
TA by other donors
Preparatory Survey(M/P, F/S etc.)
F/S
Policy Dialogue
Loan Request
Embassy receives request
F/F Appraisal
Report,Consultation
PriorNotification E/N
E/NPriorNotification
L/A
L/A Bid Procurement,Construction
Concurrence for procurement Disbursement
Implementation, Monitoring
ProjectCompletion
Post-evaluation
GOJ
JICA
Recipient
Country
Other Donors
NGO etc.
ODA charterMid-term policy
JICACountry Assistance Strategy
ODA Task Force
Collaboration with NGO, Japanese Local Govt, Japanese University
Harmonization with other donorsCo-finance/periodical dialogue/study/seminarwith other donors(WB. ADB, AfDB, UNDP. AFD
KfW, new donors, etc.)
Govtmission
4 - 8

Guideline and Manual for Hydropower Development Vol. 1 Conventional Hydropower and Pumped Storage Hydropower 4.4 Grant Aid Cooperation
Grant Aid is a form of ODA involving the provision of funds to developing countries without the obligation of repayment. The aim is to cooperate in economic and social development by helping the Government to introduce and upgrade its facilities and equipment. JICA is responsible for the preliminary surveys as well as supports for project implementation and post implementation follow up. Grant Aid is available mainly for the social development sector including education, health and medical care, agricultural development as well as upgrading of public infrastructure such as roads and bridges. Small scale hydropower plant for rural electrification, which is described in Vol.2, is included on the grant aid.
4.5 Development Scheme by IPP
4.5.1 IPP Project Scheme
(1) BOT and BOO
IPP is defined as an Independent Power Producer who wholesales electricity to public utilities. Entry into IPP markets takes two different forms: i) Construction of a new power plant, ii) Acquisition of an existing power plant. The first option does not produce revenue for the construction period, although capital infusions had already taken place, while the latter generates revenues upon acquisition. For a new power plant construction project, the first option is further divided into two different forms, BOT and BOO.
BOT (Build, Operate and Transfer)
The IPP owns the plant for a certain fixed period (i.e. payout time of 20 to 30 years), and
after which the plant is transferred to the developing country (i.e. government, public
corporation)
BOO (Build, Own and Operate)
The IPP continues to own and operate the plant and a transfer to the developing country
does not take place.
Benefits out of BOT in developing countries include the following.
Although infrastructure development is a pressing need in many of the developing nations, it does not proceed in ways preferable to their needs. And this causes a major slowdown in economic development in many cases. An introduction of BOT removes financial burdens and allows simultaneous development of plural projects, thereby accelerating the speed of infrastructure development.
Other benefits of BOT include transfer of state of the art technologies from advanced nations. BOT can also be an effective vehicle to promote privatization and deregulation of the electrical power industry and to nurture domestic financial markets.
4 - 9
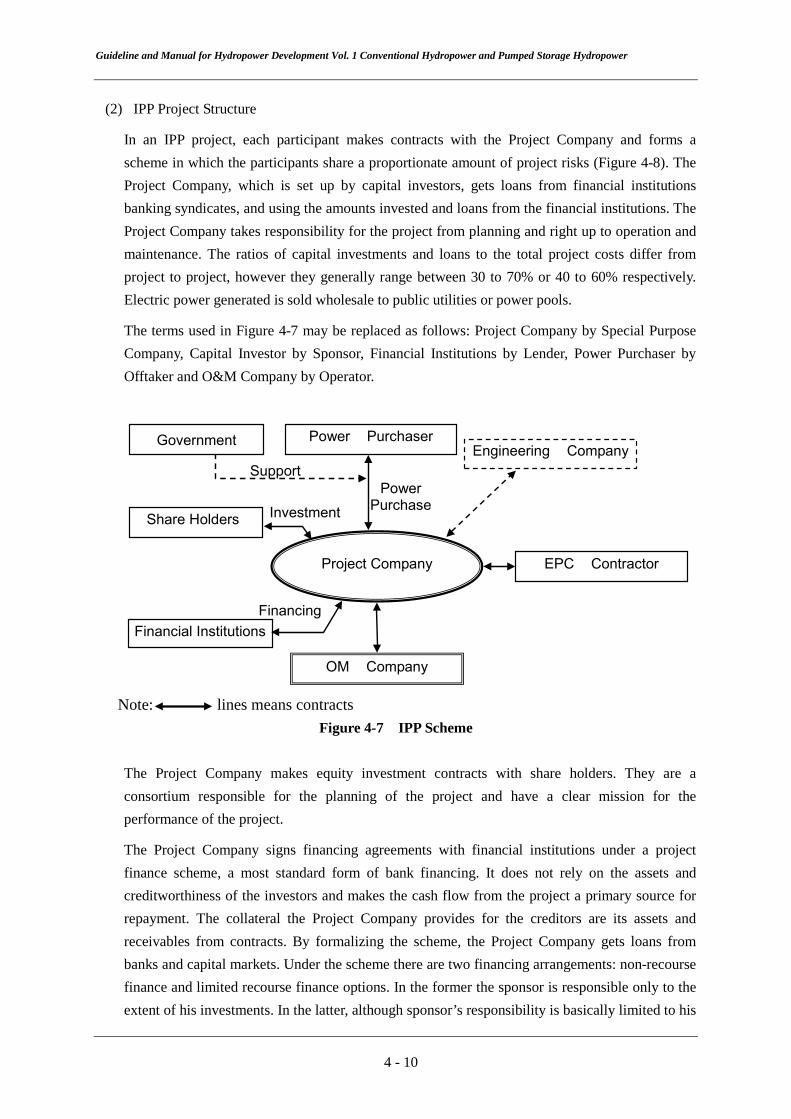
Guideline and Manual for Hydropower Development Vol. 1 Conventional Hydropower and Pumped Storage Hydropower
(2) IPP Project Structure
In an IPP project, each participant makes contracts with the Project Company and forms a scheme in which the participants share a proportionate amount of project risks (Figure 4-8). The Project Company, which is set up by capital investors, gets loans from financial institutions banking syndicates, and using the amounts invested and loans from the financial institutions. The Project Company takes responsibility for the project from planning and right up to operation and maintenance. The ratios of capital investments and loans to the total project costs differ from project to project, however they generally range between 30 to 70% or 40 to 60% respectively. Electric power generated is sold wholesale to public utilities or power pools.
The terms used in Figure 4-7 may be replaced as follows: Project Company by Special Purpose Company, Capital Investor by Sponsor, Financial Institutions by Lender, Power Purchaser by Offtaker and O&M Company by Operator.
Project Company
OM Company
EPC Contractor
Support Power
Purchase
Financing Financial Institutions
Share Holders Investment
Government Power Purchaser Engineering Company
Note: lines means contracts
Figure 4-7 IPP Scheme The Project Company makes equity investment contracts with share holders. They are a consortium responsible for the planning of the project and have a clear mission for the performance of the project.
The Project Company signs financing agreements with financial institutions under a project finance scheme, a most standard form of bank financing. It does not rely on the assets and creditworthiness of the investors and makes the cash flow from the project a primary source for repayment. The collateral the Project Company provides for the creditors are its assets and receivables from contracts. By formalizing the scheme, the Project Company gets loans from banks and capital markets. Under the scheme there are two financing arrangements: non-recourse finance and limited recourse finance options. In the former the sponsor is responsible only to the extent of his investments. In the latter, although sponsor’s responsibility is basically limited to his
4 - 10

Guideline and Manual for Hydropower Development Vol. 1 Conventional Hydropower and Pumped Storage Hydropower
investments, he is also required to share additional costs to cover contingency liability, for example, an increase in the construction costs, provided such an increase is in accordance with specified conditions.
The Project Company contracts power purchase agreements with both power transmission and power distribution companies, and agrees on electric power rates. Where a power purchaser’s credit rating is low, the Project Company hedges the risk by obtaining assurance of the host government’s involvement for continuance of the project, or by having buyout agreements in the contract in case of bankruptcy. The Engineering Company provides technical services according to the contracts signed with the Project Company. Where the Project Company has in-house engineers, they may replace the function of the Engineering Company.
The Project Company signs a contract with Engineering, Procurement & Construction: (EPC) contractor. The EPC contractor, under full turn-key contracts, provides services for engineering, equipment purchasing and construction of the project. The construction costs are fixed in most instances, and the project is turned over to the Project Company upon completion of the project. The EPC contractor takes the risks for potential increases in the costs of construction. An EPC contractor is a consortium consisting of construction companies, electrical equipment suppliers and steel corporations, for example, and each participant to the consortium takes risks for potential increases in construction costs and performance risks.
The Project Company may own and operate the finished facilities or outsource such management to a third party. In the latter case, the party for operation and maintenance signs contract with the Project Company.
(3) IPP Business and Risks
Risks associated with IPP businesses are categorized into commercial risks (risks of project participants), political risks (risks caused by host government and government agencies), and those from natural force majeure.
1) Commercial Risks
Performance risk
A failure to meet the target date or budgets, or a failure of a finished project reaching specified performance targets
Operation and Maintenance risk
A risk of a finished project becoming inoperable or a risk of the project not reaching target capacity factors
Risk from electric power selling
Risks of electric power selling not generating expected cash flows due to lower-than-expected electric power generation and electricity rates
2) Political Risks
Exchange risk
4 - 11

Guideline and Manual for Hydropower Development Vol. 1 Conventional Hydropower and Pumped Storage Hydropower
Risks from restrictions by host government or its central bank on currency exchange transactions. An offshore escrow account is one of the methods to circumvent the risks whereby the cash flow from the project is managed in countries or their central government outside the host nation.
Risks from amendments of applicable laws and standards
Risks arising from amendments or repeals of laws and standards applicable to the project
Risks from expropriation, impoundment and nationalization
Risks of ousting of the project by the host government
Risks from strike, civil war, insurgency, terrorism
Direct and indirect risks in the host country from such events
Risk of war
Risks from host country’s engagement in war with neighboring countries and regions
Risks from failure to comply with performance obligation
Risks arising from host country’s or its agencies’ failure to observe performance obligation
Natural force majeure
Risks caused by force majeure represented by natural events such earthquake, typhoon and cyclone, tsunami, flood and lightning
4.5.2 Development Aid Programs by Japanese Government
(1) Oversea investment loan
1) JBIC loan
JBIC provides overseas investment loans to meet long-term financing needs of Japanese firms for their international business development, including projects that will establish/expand production bases and develop natural resources overseas. As shown in Fig 4-8, direct and indirect financing is provided for the projects undertaken by the firms incorporated in developing countries and regions in which Japanese firms have equity shares.
With JBIC assuming specific risks, businesses can reduce political risk, including the risk associated with currency convertibility and transfer, which characteristically involves overseas business operations.
4 - 12

Guideline and Manual for Hydropower Development Vol. 1 Conventional Hydropower and Pumped Storage Hydropower
Figure 4-8 Oversea Investment Loan by JBIC 2) Loan terms
Loan terms and conditions are determined following the loan appraisal with respect to individual projects, while taking account of the following points.
(a) Loan amount, currencies and interest rates
The loan amount, which should not exceed the value of a contract associated with overseas investment, is applied to meet financial needs for undertaking a specific overseas investment project or long-term needs for investment to develop overseas business operations. Loans are disbursed when actual financing needs arise. Loans finance, in principle, up to a specified percentage of financial needs and are provided in co-financing with private financial institutions with a view to complementing their financing. Loans may be provided in currencies other than the Japanese yen (in principle, in the US dollar or euro). Loans denominated in the yen carry fixed interest rates, while loans in other currencies carry, in principle, floating interest rates.
(b) Repayment period and method
The repayment period is determined by taking account of the period required for recouping investment. Since no limit is set on the repayment period, repayment schedule can be set flexibly, including the grace period, depending on the expected rate of return on individual projects. In general, repayment periods range between one and ten years, and the repayment method is installment repayment.
(2) Export loans
1) JBIC loan
Exports to developing countries of machinery and equipment produced in Japan, such as turbine & generators and transmission facilities and provision to developing countries of Japanese technical services (including consulting services for various project-related studies, designing and project implementation monitoring and supervision) and overseas construction as well as other projects
JBIC
Japanese Film
Foreign Government Financial Institution of Foreign Countries
Local (joint venture corporation)
Investment
Investment Loan
Financing
Financing
4 - 13

Guideline and Manual for Hydropower Development Vol. 1 Conventional Hydropower and Pumped Storage Hydropower
A buyer's credit (B/C) and a bank-to-bank loan (B/L) are direct loans respectively provided to a foreign importer and a foreign financial institution for financing the import of Japanese machinery and equipment or the utilization of Japanese technical services. A direct loan to an importer is called buyer's credit and to a financial institution is called a bank-to-bank loan.
2) Loan terms
(a) Loan amount and interest rates
The loan amount is usually determined based on the OECD Arrangement. In principle, the loan amount should not exceed the value of an export contract or technical service contract and excludes down payment. While export loans, in principle, do not apply to local costs, such costs may be covered, fully or partially, provided that their amount does not exceed down payment (max.30% of the export contract value). Interest rates are determined based on the provisions of the OECD Arrangement.
(b) Repayment period and method
Loan repayment periods and methods are determined based on the OECD Arrangement. The maximum repayment period differ depending on importing countries, goods and services and contract values.
Figure 4-9 Structure of Export Loan
4.6 Development Scheme by PPP
There appears to be no universally agreed definition of Public-Private Partnership (PPP). This manual defines it as a “term to represent a form of relationship between public organizations and private sectors, which have expertise and clear objectives to make profit and are formed for the purpose of supporting movements towards opening up public facilities and services”.
In spite of vast investment opportunities for infrastructure development in developing countries, government finance alone or inputs from overseas public sectors are insufficient to meet the needs of
*1 Buyers credit *2 Bank loan
Financial institution, etc., in foreign countries
Importers in foreign countries
Japanese exporters
JBIC
Loan
Loan (B/L)*2
Loan (B/C)*1
Export of plants, etc.
4 - 14

Guideline and Manual for Hydropower Development Vol. 1 Conventional Hydropower and Pumped Storage Hydropower such large investments. Specifically, a project financed by the budget of one’s own government may lead to a bloated government budgets, to an unjustifiable reliance on external debts, or a lack of incentives for efficiency on the part of project owner. It is against these backgrounds that the execution of a project by PPP is becoming increasingly indispensable for infrastructure development, and for providing public services, with private and public sectors each raising adequate amount of capitals and sharing risks among them. One such example is a PPP in which the public sector takes charge of the basic part of infrastructure development and for establishment of rules and standards. Thus the private and public sectors plays collaborative roles in PPP-based development as shown in Figure 4-10.
Introduction of a PPP, in essence, is the opening up to private sectors of public facilities and services, and at the same time, encourages movements away from infrastructure -development- oriented approach to management-and-service-oriented approach. A PPP is a joint project composed of four participants, public and private sectors from both developed and developing nations, which shares risks among themselves in the execution of a collaborative project.
A concept of partnership was a rarity in the existing framework of ODA where only an implicit relationship of donor-nation versus donor-receiving-nation existed. And the roles of public sectors, both in developed and developing nations, were not explicitly recognized either. In any PPP projects it is imperative that the four participants to the partnership clearly recognize their expected collaborative and cooperative roles in the framework of PPP for the execution of PPP projects.
Figure 4-10 Partnership among Four Participants to PPP
Developing Nation Developed Nation (Japan)
Private Sector Private Sector
Collaboration Collaboration Collaboration
4 - 15

Part 2
Reconnaissance Study
TABLE OF CONTENTS
Chapter 5 Planning by Reconnaissance Study Method ................................................... 5-1
5.1 Basics of hydropower planning ................................................................................ 5-1 5.1.1 Purpose of reconnaissance study ................................................................. 5-1 5.1.2 Study of Hydropower Planning ................................................................... 5-3 5.1.3 Terminology of Hydropower Planning ........................................................ 5-6
5.2 Preparatory Investigation.......................................................................................... 5-12 5.2.1 Data Collection ............................................................................................ 5-12 5.2.2 River Investigation by Maps........................................................................ 5-14
5.3 Planning of Conventional Hydropower Projects ...................................................... 5-14 5.3.1 Selection of Type of Power Generation ....................................................... 5-14 5.3.2 Calculation of Flow at Dam Site and Preparation of Flow-Duration
Curve ........................................................................................................... 5-15 5.3.3 Study on Run-of-River Type........................................................................ 5-16 5.3.4 Reservoir Type ............................................................................................. 5-25 5.3.5 Pondage Type .............................................................................................. 5-42
5.4 Planning of Pumped Storage Type ........................................................................... 5-44
Chapter 6 Preliminary Estimate of Construction Cost and Project Optimization ....... 6-1
6.1 Condition for Construction Cost Estimate ............................................................... 6-1 6.2 Calculation of Quantity of Work .............................................................................. 6-13
6.2.1 Calculation Method ..................................................................................... 6-13 6.2.2 Quantities of Construction Work for Run-of-River Type Power Plant ........ 6-13 6.2.3 Quantities of Work for Pondage Type and Reservoir Type Power Plant ..... 6-22 6.2.4 Quantities of Work for Pumped Storage Type Power Plant ......................... 6-27 6.2.5 Transmission Lines ...................................................................................... 6-29
6.3 Optimazation of the Scale ........................................................................................ 6-30 6.3.1 Economic Analysis (Simplified Method) .................................................... 6-30 6.3.2 Unit Construction Cost Method ................................................................... 6-33
6.4 Optimization Study ................................................................................................... 6-33
Chapter 7 Application of Reconnaissance Study Method ................................................ 7-1
7.1 Application for Study of Individual Projects ............................................................ 7-1 7.2 Application for Hydropower Potential Study ........................................................... 7-1 7.3 Application for Master Plan Study ........................................................................... 7-1
7.3.1 Conventional Hydropower .......................................................................... 7-1 7.3.2 Master Plan Study on Pumped Storage Hydropower .................................. 7-3
i

LIST OF TABLES
Table 5-1 Features of Waterway Route ............................................................................. 5-18 Table 5-2 Standard Efficiency of Turbine and Generator (Francis Turbine of 100%
load) .................................................................................................................. 5-23 Table 5-3 Energy Calculation by Mass Curve .................................................................. 5-37 Table 5-4 Energy Calculation Table .................................................................................. 5-41 Table 6-1 Construction Cost Summary (Run-of-River Type) ........................................... 6-3 Table 6-2 Construction Cost Summary (Pondage and Reservoir Types) .......................... 6-4 Table 6-3 Construction Cost Summary (Pumped Storage Type) ...................................... 6-5 Table 6-4 (1) Civil Engineering Work Cost (Run-of-River Type) .......................................... 6-6 Table 6-4 (2) Hydraulic Equipment Cost (Run-of-River Type) ............................................. 6-7 Table 6-5 (1) Civil Engineering Work Cost (Pondage and ReservoirTypes) .......................... 6-8 Table 6-5 (2) Hydraulic Equipment Cost (Pondage and Reservoir Types) ............................ 6-9 Table 6-6 (1) Civil Engineering Work Cost (Pumped Storage Type) ..................................... 6-10 Table 6-6 (2) Hydraulic Equipment Cost (Pumped Storage Type) ......................................... 6-12
LIST OF FIGURES
Figure 5-1 Sequence of Investigation and Study of Hydropower Project .......................... 5-2 Figure 5-2 Flow Chart for Planning of Conventional Type ................................................ 5-4 Figure 5-3 Flow Chart for Planning of Pumped Storage Type ........................................... 5-5 Figure 5-4 Schematic Figure on Head ................................................................................ 5-8 Figure 5-5 Example of Flow Duration Curve ..................................................................... 5-10 Figure 5-6 Flow Utilization Factor ..................................................................................... 5-11 Figure 5-7 Peak Duration Hours......................................................................................... 5-12 Figure 5-8 Calculation of Flow at Dam Site ...................................................................... 5-16 Figure 5-9 Layout Example of Run-of-River Type ............................................................ 5-17 Figure 5-10 Comparison of Waterway Routes ..................................................................... 5-18 Figure 5-11 Waterway Route ................................................................................................ 5-20 Figure 5-12 95% Flow by Flow Duration Curve .................................................................. 5-20 Figure 5-13 Temporary Setting of Maximum Plant Discharge (Run-of-River Type) .......... 5-21 Figure 5-14 Water Level of Intake Weir ............................................................................... 5-21 Figure 5-15 Waterway Profile .............................................................................................. 5-22 Figure 5-16 Combined Efficiency of Turbine and Generator (50 MW) ............................... 5-24 Figure 5-17 Layout Examples of Reservoir Type and Pondage Type .................................. 5-26 Figure 5-18 Example of Dam and Powerhouse Sites ........................................................... 5-27 Figure 5-19 Reservoir Area and Storage Capacity Curve .................................................... 5-28 Figure 5-20 Setting of Sedimentation Level ........................................................................ 5-29 Figure 5-21 Relation Between Intake and LWL ................................................................... 5-30 Figure 5-22 Discharge and Tunnel Inner Diameter .............................................................. 5-30 Figure 5-23 Spillage to Adjacent River Basin ...................................................................... 5-31
ii

Figure 5-24 Concept of Mass Curve .................................................................................... 5-32 Figure 5-25 Firm Discharge by Mass Curve ........................................................................ 5-33 Figure 5-26 Profile of Waterway .......................................................................................... 5-34 Figure 5-27 Reservoir Operation by Mass Curve ................................................................. 5-37 Figure 5-28 Variable Head Efficiency (Francis Turbine) ..................................................... 5-38 Figure 5-29 Variable Head Efficiency (Kaplan Turbine and Bulb Turbine)......................... 5-38 Figure 5-30 Variable Head Efficiency (Pelton Turbine) ....................................................... 5-39 Figure 5-31 Capacity of Re-regulating Pond ........................................................................ 5-40 Figure 5-32 95% Flow by Flow Duration Curve .................................................................. 5-42 Figure 5-33 Maximum Plant Discharge and Pondage Capacity ........................................... 5-43 Figure 5-34 Types of Pumped Storage Power Generation ................................................... 5-45 Figure 5-35 Setting of High Water Level ............................................................................. 5-47 Figure 5-36 Draft Head ........................................................................................................ 5-48 Figure 5-37 Waterway Profile .............................................................................................. 5-49 Figure 6-1 Example of Electro-mechanical Equipment Cost ............................................. 6-12 Figure 6-2 Inner Diameter of Waterway ............................................................................. 6-19 Figure 6-3 (1) Inner Diameter of Penstock .............................................................................. 6-20 Figure 6-3 (2) Inner Diameter of Penstock (Design Discharge<20m3/s) ................................ 6-20 Figure 6-4 Inner Diameter of Spillway Channel ................................................................ 6-21 Figure 6-5 Relationship Between Inner Diameter of Tunnel and Lining Concrete
Thickness .......................................................................................................... 6-24 Figure 6-6 Capacity of Transmission Line ......................................................................... 6-29 Figure 6-7 Determination of Optimum Scale of Development (Run-of-River Type) ........ 6-34 Figure 6-8 Determination of Optimum Scale of Development (Reservoir Type) .............. 6-35 Figure 7-1 Schematic Figure of Mainstream’s Developments and Tributary’s
Development ..................................................................................................... 7-2 Figure 7-2 Example of Master Plan of Basin Development ............................................... 7-3 Figure 7-3 Candidate Projects for Pumped Storage Projects.............................................. 7-4
iii

Chapter 5 Planning by Reconnaissance Study Method

Guideline and Manual for Hydropower Development Vol. 1 Conventional Hydropower and Pumped Storage Hydropower Chapter 5 Planning by Reconnaissance Study Method
Chapter 5 and 6 are materials of “Guide Manual for Development Aid Programs and Studies of Hydroelectric Power Projects (New Energy Foundation, 1996).
5.1 Basics of Hydropower Planning
5.1.1 Purpose of Reconnaissance Study
A study of initial stage is called reconnaissance study or preliminary study. The term "reconnaissance study" is used in Vol.1 of this Manual.
The purpose of reconnaissance study is outlined below.
Initial stage study of individual project
Hydropower potential survey
Master plan study
The flow chart of investigation and study of hydropower projects is shown in Figure 5-1. It is roughly classified into reconnaissance study and feasibility study. The reconnaissance study is the initial stage study in which 1:50,000 scale topographic maps are used. The feasibility study is the final stage study to determine the realization of the project in which 1:1,000 to 1:5,000 scale topographic maps are used. Part 2, Chapters 5 through 7, describes the method of reconnaissance study in detail. The method of feasibility study is given in Part 3, Chapters 8 through 19.
5 - 1

Guideline and Manual for Hydropower Development Vol. 1 Conventional Hydropower and Pumped Storage Hydropower
Figure 5-1 Sequence of Investigation and Study of Hydropower Project
Yes
No
START
Finalization of development plan
Part 3 Feasibility Study (Pre-feasibility study)
Part 2 Reconnaissance Study (Preliminary Study)
END
Master Plan
Selection of project for F/S
No
Yes
Planning
Construction cost estimate
Economic evaluation
Planning of development plan
Structure design
Finalization of development plan
Economic and financial analysis
Construction planning and cost estimate
Technical, environmental
and economic aspects
Economic aspect
Site reconnaissance Topography,
geology, natural and social environment, etc.
Preparatory investigation ・ 1/50,000~10,000scale topographic
map ・ River flow ・ Hydrology, meteorology and geology ・ Power demand and supply ・ Environmental regulations, etc.
Feasibility investigation
Load forecast, Geologic and
topographic survey
Hydrologic0meteorological
survey, Environmental survey
5 - 2

Guideline and Manual for Hydropower Development Vol. 1 Conventional Hydropower and Pumped Storage Hydropower 5.1.2 Study of Hydropower Planning
Various steps are required to prepare development plans at the reconnaissance study stage. Generally, they are a series of works as described below.
To select the dam or weir site and powerhouse site (or tailrace site) in consideration of the flow
and topography of the river
To set the maximum plant discharge on the basis of the river flow at the dam site
To calculate the power output and energy generation from the product of the discharge
multiplied by the head between the dam site and powerhouse site
To estimate the construction cost of the dam, waterway, powerhouse and other civil works and
the turbine, generator and other electric facilities, thereby obtaining the construction cost for the
entire project.
To analyze and evaluate the project from the aspects of engineering, economy and environment
and to finalize the plan
Figure 5-2 and Figure 5-3 show the flow charts in the reconnaissance study stage for conventional type and pumped storage type development.
5 - 3

Guideline and Manual for Hydropower Development Vol. 1 Conventional Hydropower and Pumped Storage Hydropower
Figure 5-2 Flow Chart for Planning of Conventional Type
Comparison of waterway route (dam and powerhouse sites)
Run-of-river type, Pondage type
Comparison of maximum plant discharge
Comparison on dam height (Reservoir type)
Reservoir operation (Reservoir type)
Flow duration curve
Preparatory Investigation
Determination of power generation type
START
Selection of dam (weir) and powerhouse sites
Flow calculation of dam site
Types of power generation
Storage capacity curve and estimation of sedimentation
Determination of high water level, low water level, and active storage capacity
Estimate of construction cost
Economic evaluation
Determination of max. plan discharge Calculation of effective head
Calculation of maximum output Calculation of annual energy generation
END
Determination of optimum development scale
Determination of project plan
Site reconnaissance
Power generation type
Pondage type
Reservoir type
Run-of-River type
5 - 4

Guideline and Manual for Hydropower Development Vol. 1 Conventional Hydropower and Pumped Storage Hydropower
Figure 5-3 Flow Chart for Planning of Pumped Storage Type
Comparison of waterway route (dam and powerhouse sites)
Site reconnaissance
(Note) For pumped and natural flow storage type
Preparatory Investigation
Selection of pumped and natural flow storage
type, pure pumped storage type
Selection of Upper pond, Lower pond and powerhouse site
Flow calculation of dam site
Preparation of storage capacity curve, Estimate of sedimentation, setting low water level
Setting of maximum, output
Estimate of construction cost
Economic evaluation
Determination of max. plan discharge Calculation of effective head
Calculation of maximum. output Calculation of annual energy generation
Determination of project plan
END
START
(Note)
5 - 5

Guideline and Manual for Hydropower Development Vol. 1 Conventional Hydropower and Pumped Storage Hydropower 5.1.3 Terminology of Hydropower Planning
(1) Reconnaissance study and feasibility study
The initial stage study using 1:50,000 scale maps are called the reconnaissance study. The more detailed study using 1:1,000 to 1:5,000 scale maps is called the feasibility study.
(2) Maximum output and maximum plant discharge
Maximum output is the power output which the power plant can generate. This is often used in the same context as installed capacity and rated capacity. Maximum plant discharge is the largest discharge used by the power plant. It is the basic value for the determination of installed capacity and for the design of waterway.
The maximum output corresponding to the maximum plant discharge is expressed by the following equation.
Pmax=9.8×Qmax×He×η t×ηg where,
Pmax : Maximum output (kW) He : Effective head (at maximum output: m) Qmax : Maximum plant discharge (m3/sec) η t : Turbine efficiency (at maximum output) ηg : Generator efficiency (at maximum output)
The term of maximum output is used as the same meaning of rated output here. In some cases the maximum output is designed such that the output increases more than rated output without reducing the maximum plant discharge. In this condition the maximum output is defined the output by the effective head and the plant discharge.
(3) Firm output and firm discharge
The firm output is the output which the plant of-run-of-river type is able to generate almost every day of the year, for example 90 to 95% of the days of a year.
The firm discharge is the discharge which can be exclusively used for hydropower generation almost every day of the year. This Manual defines the firm discharge as “95% flow m the flow duration curve", in which the flow is the amount usable exclusively for hydropower generation, less water used for irrigation, fishery, tourism, etc.
The firm output corresponding to the firm discharge is expressed by the following equation.
Pf=9.8×Qf×Hef×η tf×ηgf where,
5 - 6

Guideline and Manual for Hydropower Development Vol. 1 Conventional Hydropower and Pumped Storage Hydropower
Pf : Firm output (kW) Hef : Effective head (at firm output: m) Qf : Firm discharge (m3/sec) η tf : Turbine efficiency (at firm output) ηgf : Generator efficiency (at firm output)
The firm output is the basic numerical value to evaluate the electric power supply capability and economy of run-of-river type project. The power supply service level (non-interruption level) is generally set at 95% depending on the importance of electric power in the supply area. The firm discharge is, therefore, set to meet the above level.
(4) Firm peak output and firm plant discharge
The firm peak output is the output which the power plant is able to produce almost every day of the year (95% of the days of a year) continuously for the specified time during the peak demand. In this Manual, the firm plant discharge is defined as the plant discharge which can be used during peak demand by regulating the firm discharge in a reservoir or pond. The firm peak output is the power output corresponding to the firm plant discharge. The firm peak output is the basic numerical value to evaluate the electric power supply capability and economy of pondage type and reservoir type projects.
(5) Gross head, head loss and effective head (rated head)
A schematic figure concerning heads is shown in Figure 5-4.
The gross head is the difference in elevation between the water level at the dam or intake weir and the river water level at the powerhouse or tailrace site. The former water level is called normal water level (NWL) and the latter water level is called tailwater level (TWL). The gross head (Hg) is calculated as follows.
Hg = NWL - TWL
In this Manual, concept of normal water level, normal tailwater level and effective head are employed and defined in order to set the maximum output as follows.
1) Normal water level (NWL)
Following definition is adapted in this manual.
(a) Run- of- river type
Water level at intake weir
(b) Reservoir type, pondage type and pumped storage type
Water level at 1/3 of available drawdown (ha) from the high water level (HWL) as shown in Figure 5-4, or the water level corresponding to the half storage volume of effective storage capacity
5 - 7

Guideline and Manual for Hydropower Development Vol. 1 Conventional Hydropower and Pumped Storage Hydropower
Basically, the NWL should be determined by the feasibility study.
NWL = HWL - 1/3 × ha Hg = NWL- TWL
Power house River
TWLT
Hg
Dam
HWL
NWL
LWL
Ha/3
ha
Figure 5-4 Schematic Figure on Head
2) Normal tailwater level (TWL)
(a) Conventional type
A river water level at the powerhouse or tailrace site (The water level is simply called "tailwater level" for conventional type)
(b) Pumped storage type
Water level at 1/3 of available drawdown from the high water level of lower pond
3) Effective head (Rated head)
The head loss (Hℓ) is the loss when water flows down in a hydropower system.
Effective head (He) is the head which works effectively for the turbine, and expressed as follows.
He = Hg - Hℓ
The effective head which is generally called "rated head" is the head obtained by subtracting the normal tailwater level and head loss from the normal water level.
He = NWL - TWL - Hℓ
(6) Power output and Energy generation
Power output is the magnitude of electric energy generated in one second. When generated continuously, the work load is called the energy generation and is expressed in kilowatt-hours (kWh) or megawatt-hours (MWh). The energy generation in one year is called the annual energy generation. The energy is classified into primary energy, which corresponds to firm output or firm peak output, and secondary energy.
5 - 8

Guideline and Manual for Hydropower Development Vol. 1 Conventional Hydropower and Pumped Storage Hydropower
(7) Annual plant factor
The ratio of annual energy generation to electric energy produced at continuous operation for one year at maximum output is called the plant factor.
100(hr) 8,760(kW)output Maximum
(kWh) generationenergy Annual(%)factor Plant ××
=
(8) Load and load factor
Power demand is called the load at the power supply side. The ratio of the mean load to the maximum load for a specific period is called the load factor. It is also called the daily load factor and the annual load factor, according to the period taken.
100(kW) load Maximum
(kW) loadMean (%)factor Load ×=
(9) Regulating capability factor of reservoir (RCF)
The regulating capability of the river flow at a regulating pond or a reservoir is expressed by the following equation;
100)inflow(m Annual
)mcapacity( storage Active(%)factor capability Regulating 3
3
×=
(10) Regulating pond
River flow fluctuates greatly with season but shows no large change in the course of one day or week. The power load does, however, change sharply in a day or week. The regulating pond regulates flow for a day or a week by storing water when the load is low at midnight or on Sunday, and then using it at peak load time. In this Manual a project having storage capacity which RCF is less than 5% is defined as “Pondage type”.
(11) Re-regulating pond
As power plants of pondage type and reservoir type are mainly operated during peak load hours in accordance with the peak load, the plant discharge is released into the river for a short duration. Consequently, the difference in river flow between the peaking hours and off-peak hours is large and may affect the living environment of the people and other water uses located downstream. A pond in order to re-regulate the peak discharge to avoid the undesirable situation above is called the re-regulating pond.
(12) Reservoir
River flow fluctuates significantly throughout the course of one year. Plant discharge can be increased by storing surplus water in the wet season and then releasing it in the dry season. Thus, a relatively equalized discharge can be obtained and stable electric power can be generated. The reservoir is, therefore, constructed to regulate seasonal fluctuation of river flow. In this Manual a project having storage capacity which RCF is more than or equal to 5% is defined as “Reservoir type”.
5 - 9

Guideline and Manual for Hydropower Development Vol. 1 Conventional Hydropower and Pumped Storage Hydropower
(13) Representative year
A representative year is the year when the features of the river flow are best expressed for an entire period for which runoff data is available. It is applied when a project is planned using runoff data of one year.
(14) Mean flow
The mean flow is obtained by dividing the total flow over a specific period of time by the number of days involved. It is called the monthly mean flow for monthly periods and the annual mean flow for yearly periods.
(15) Mass curve
A graph of the cumulative values of a hydrologic quantity such as daily flow or monthly flow plotted daily or monthly is called “mass curve”. The mass curve is used in the study of a reservoir plan. It is described in detail in 5.3.4 (11).
(16) Flow duration curve
When flows of a specific period are arranged in the order of their descending magnitude, the percent of the time for which a given magnitude is equaled or exceeded can be calculated. Plotting of the magnitude of flow on ordinate against the corresponding percent of time on abscissas is called "flow duration curve". An example of "flow duration curve" of 365 days is shown in Figure 5-5 where 100% flow, 95% flow, and 75% flow can be shown.
2.84
1.020.63 0.45 0.30
0.28
0.21
6.0
5.0
4.0
3.0
2.0
1.0
0
Percent of Time Exceed
Flow
(m3 /s
)
10%(37day) 25%(95day) 50%(183day) 75%(274day) 100%(365day)
95%(346day)90%(328day)
Figure 5-5 Example of Flow Duration Curve
(17) Flow utilization factor
The flow utilization factor is the ratio of the annual plant discharge to the volume of plant discharge at continuous operation of maximum output for one year. Figure 5-6 is an example of
5 - 10

Guideline and Manual for Hydropower Development Vol. 1 Conventional Hydropower and Pumped Storage Hydropower
flow utilization factor using the flow duration curve.
The annual plant factor of the run-of-river type is generally 5 to 10% lower than the flow utilization factor (See (7)).
Flow utilization factor (%) = 100(sec)400,86365/sec)(m dischargeplant Max.
)m( dischargeplant Annual3
3
×××
100area) (adcfarea) (abcde
×=
Percent of Time Exceeded
Maximum Plant dischrge
Flow Duration Curve from Daily Flow
Flow
(m
3 /s)
100%(365days)
e
bcd
fa
Figure 5-6 Flow Utilization Factor
(18) Peak duration hours
In this Manual, peak duration hours is defined as the minimum operating hours per day on the condition of maximum output operation or firm peak output operation required by the power system. The peak duration hours are used for planning of the reservoir type, pondage type or pumped storage type project to supply power for the peak demand. The electric energy for actual operation shown by the broken line in Figure 5-7, is equal to the electric energy for peaking hours shown in the rectangle. The peak duration hours used in planning is generally 4 to 8 hours in an area where the power system is interconnected, and 2 to 3 hours mostly in areas where the power system is not interconnected and the lighting peak accounts for the greater part of the demand.
5 - 11

Guideline and Manual for Hydropower Development Vol. 1 Conventional Hydropower and Pumped Storage Hydropower
8 10 12 14 16 18 20 22 24
Time in hours
Out
put i
n kW
Maximum Output or Firm Peak Output
Peak duration hours
Actual Operation
Figure 5-7 Peak Duration Hours 5.2 Preparatory Investigation
5.2.1 Data Collection
The initial stage study of hydropower is called the reconnaissance study. The minimum data required in this stage are topographic maps and runoff data. Other data on hydrology, meteorology and geology are desirable for study, if available. However the reconnaissance study can be made without such data.
(1) Topographic maps
Plant discharge of hydropower plant is determined by the river flow available at the dam site. The catchment area is necessary for calculation of the river flow. The head is determined by the difference in elevation between the intake site and tailrace site. The waterway route connecting these sites is determined from topographic maps.
Topographic maps are required to compute the catchment area and the head. Generally 1:50,000 scale topographic maps are used. If available, maps of higher accuracy than 1:50,000 will enable more reliable study.
(2) Runoff data
Together with the topographic maps described above, the most important data for drawing up a hydropower development plan is runoff data. In many cases, flow gauging and custody of data are conducted by the organization which will ultimately implement the hydropower project. If river flow is not recorded in the project site or nearby, it is necessary to prepare runoff data of the project site using data available, including runoff data of adjacent rivers.
(3) Other hydrologic and meteorological data
Normally, rainfall is observed even where runoff is not recorded. If the period of the recorded
5 - 12

Guideline and Manual for Hydropower Development Vol. 1 Conventional Hydropower and Pumped Storage Hydropower
runoff data is too short and inadequate for the reconnaissance study, rainfall data is used to prepare long-term runoff data. If a flow gauging station is not installed near the project site but in other basins, runoff data can be prepared from the data of the other basins taking into consideration rainfall of both basins (Refer to 9.3.3). In the case of a plan for a large reservoir, data concerning evaporation should be collected.
(4) Geologic data
In most instances, geologic data covering the entire river basin is in the custody of public organizations of the country. River flow may infiltrate underground in limestone or volcanic ash areas. In this case, special consideration is required to estimate the flow. A hydropower plan may not be feasible in a landslide prone area. It is desirable in the planning stage to know the geologic condition of the basin and waterway route. If data concerning seismic activity in the project site is available, that data should also be collected.
(5) Data concerning power demand, power supply and transmission lines
Daily load curve of the maximum load day shown in Figure 3-4, 3.3 in the supply area and the sources of power supply are investigated. Peak duration hours required for planning of reservoir type, pondage type and pumped storage type can be assumed by the daily load curve. The type of hydropower generation required by the power system can be examined from the supply capability of the sources of power supply. In the case of a pumped storage type, the availability of pumping-up energy should also be examined. If existing hydropower plants are located near the project site, reference data for project planning is collected including maximum output, generated energy and design drawings. In many cases, the percentage of transmission line cost in the hydropower generation cost is high, data concerning transmission lines in the supply area should be collected.
(6) Other data related to the project planning
1) Existing investigation data
If a study was done in the past in the project site or in its neighborhood, available information should be collected as it is useful for project planning.
2) Master plan of river basin development
The master plan on hydropower development is prepared for development of the entire river basin in a most effective and efficient manner. If other important water utilization plans are available, the master plan must be coordinated with them.
3) Environmental regulations
Development is impossible when environmental regulations prohibit development work in the planned area. When part of the plan is located in such restricted area, the plan must be made to not infringe such an area. In many cases where development is strictly controlled in the special areas of natural parks or wildlife conservation areas, related data is necessary. If restriction or concept of such nature exists for environmental reasons, related information should be collected.
5 - 13

Guideline and Manual for Hydropower Development Vol. 1 Conventional Hydropower and Pumped Storage Hydropower
4) Vested water rights
When vested water rights have been established for a river where hydropower projects are planned, that river cannot be used on a priority basis exclusively for power generation. As this situation exerts significant influence on project planning, information on vested water rights should be collected.
(7) Data concerning construction cost
Estimate of the construction cost is necessary to evaluate the economy of a project. The unit prices of the principal work items such as concrete, excavation for a similar work in that country, interest rate, etc., are useful for the estimation of the construction cost. Data concerning these items should be collected.
5.2.2 River Investigation by Maps
(1) Study of river utilization condition
As hydropower plants use river water, the river utilization condition must be investigated for project planning. River use includes hydropower generation, drinking, irrigation and industrial water supply, fishery, and inland transport activities. Development of the hydropower projects are is accompanied by inundation of houses and farmland and decrease of river flow between the intake and tailrace sites. Therefore, the land utilization condition in the reservoir area and water utilization facility in the project area should be studied with available topographic maps.
(2) Study of river profile
Hydropower plants generate electricity by using the difference in elevation of a river. The river gradient is studied by topographic maps so that the topographic features can be used most effectively. The study includes large and small tributaries flowing into the river and their catchment area.
5.3 Planning of Conventional Hydropower Projects
The reconnaissance study method for the conventional hydropower is shown below and an example of the study is attached in Appendix A-5-1.
5.3.1 Selection of Type of Power Generation
(1) The power supply (peak power and/or base power) required in the future is studied from the present situation of power demand and supply in the power system. Then the suitable type of power generation, such as reservoir type, pondage type or run-of-river type is selected.
This Manual is dedicated to the promotion of hydropower development in developing countries where growth of power demand though of varying degree is expected. Such
5 - 14

Guideline and Manual for Hydropower Development Vol. 1 Conventional Hydropower and Pumped Storage Hydropower
increased demand may result in the necessity for peak capability. Where the topography permits, in the selection of type of power generation, reservoir type and pondage type should be considered, except for supply for local independent power grid. Capacity of projects that should be studied in this Manual is about 5 to 500MW.
(2) Topographically, where the river is narrow and its immediately upper course is a wide valley, the reservoir type of development is selected as a reservoir having large storage capacity can be created with a relatively small dam. The pondage type of development is selected where the topography will not permit a large storage reservoir but a regulating pond to regulate daily or weekly runoff can be constructed.
In this Manual, reservoir type and pondage type are defined by using “Regulating capability factor (RCF) ". A plan providing a storage capacity of 5% or higher RCF is defined as the reservoir type and a plan providing less than 5% is defined as a pondage type. By experience, if the RCF is 5% or higher, it is judged that the reservoir operation will enable to store the wet season runoff and release it in the dry season. This Manual applies a slightly different planning method for reservoir type and pondage type development.
(3) Where topographic features will not permit the development of either a reservoir type or pondage type and the river gradient is steep and where a high head can be obtained by the waterway, a run-of-river type development described in 5.3.3 should be studied.
The run-of-river type is mainly small scale hydropower. This type has the characteristics of less impact on the environment than the reservoir type and pondage type of development. Even though the project site has the topographic feature which is suitable for reservoir and pondage types, run-of-river type should be adopted in case environmental problems are foreseen. This Manual treats run-of-river type development of about 5 to 50 MW.
5.3.2 Calculation of Flow at Dam Site and Preparation of Flow-Duration Curve
(1) Runoff data
It is necessary to use runoff data of the longest possible period for hydropower planning.
Generally monthly runoff data is used for the reservoir type and daily runoff data is used for the run-of-river type and the pondage type. For the purpose of training to acquire knowledge in hydropower planning procedure, a representative year is selected from the entire period of available runoff data.
(2) Calculation of river flow at the dam site
The flow at the dam site is obtained by catchment area ratio by applying the runoff data of the recorded runoff data or representative year obtained in (1) above. Runoff calculation is made by the following equation. Figure 5-8 shows catchment area of dam site and gauging station. Daily flow is used for the run-of-river type and pondage type, and monthly flow is used for the reservoir type.
5 - 15

Guideline and Manual for Hydropower Development Vol. 1 Conventional Hydropower and Pumped Storage Hydropower
CA(g)CA(d)Q(g)Q(d) ×=
where,
Q (d) : Daily or monthly flow at dam site (m3/sec) Q (g) : Daily or monthly flow at gauging station (m3/sec) CA (d) : Catchment area at dam site (km2) CA (g) : Catchment area at gauging station (km2)
In the application of the above equation, the runoff conditions such as the meteorology (rainfall), soil, vegetation, land utilization, topography, at the gauging station and proposed dam site must be similar. It is desirable that the gauging station is located near the dam site. The runoff analysis method under various conditions is described in 9.4.
Q(d)
Q(g)
Dam site
Gaging station
Catchment area of dam CA(d)
Catchment area of gaging station CA(d)
Figure 5-8 Calculation of Flow at Dam Site
(3) Preparation of flow duration curve
The flow duration curve is used in the planning of run-of-river type and pondage type development and is prepared by using the daily runoff data in the entire period of recorded runoff. The flow duration curve is prepared by condensing the entire period of runoff record into one year and is used for planning in this Manual for easy understanding of the study process. For example, when the recorded period is 10 years the flow of the flow duration curve is condensed by ten to prepare a flow duration curve for 365 days.
5.3.3 Study on Run-of-River Type
(1) Layout and sequence of study of run-of-river type
An example of the run-of-river type layout is shown in Figure 5-9 and sequence of study is shown
5 - 16

Guideline and Manual for Hydropower Development Vol. 1 Conventional Hydropower and Pumped Storage Hydropower
in Figure 5-2.
Plan(iii)
(i)
(ii)(iv) (v)
(vii)(viii)
(vi)
Profile
(i) (iii) (iv) (vi)(vii)
(viii)
(v)
(i)
(ii)
(iii)
(iv)
(v)
(vi)
(vii)
(viii)
Intake weir
Intake
Settling Basin
Headrace (Tunnel type or Open channel type)
Head tank
Penstock
Powerhouse
Tailrace
Figure 5-9 Layout Example of Run-of-River Type
(2) Decision of waterway route and its type
1) Waterway route
The waterway route is a general term given for the route of headrace, penstock and tailrace. Hydropower projects are advantageous when a large head is obtained with a short waterway. An intake weir is generally constructed in the upper reaches of river where the river changes from a gentle to a steep gradient and the powerhouse is constructed where the river changes from a steep to a gentle gradient. If the waterway is a tunnel, a work adit is constructed at intervals of about 3 to 4 km in many cases to curtail the construction period. Generally, the tunnel is aligned at least 30 m below the ground surface (rock cover) for the safety of the tunneling work.
Power output and energy generation are determined by the product of the available river flow and head. The construction cost is mainly determined by the length of waterway and the number and size of dams. The river flow is determined by the catchment area at the dam site.
The comparative study in Figure 5-10 shows routes A, B and C with the site of the power house unchanged and with only the intake weir site changed. The features are shown in Table 5-1. The optimum route is determined by conducting economic comparison. The sites of the intake weir, powerhouse and other facilities, are decided in full consideration of the access road, and other factors to enable easy maintenance and administration both during construction and after completion.
5 - 17

Guideline and Manual for Hydropower Development Vol. 1 Conventional Hydropower and Pumped Storage Hydropower
Table 5-1 Features of Waterway Route
Longitudinal profileRoute ARoute B
Route C
Legend
RiverIntake site
WaterwayHead tank
Powerhouse
Watershed
Plane view
Figure 5-10 Comparison of Waterway Routes
2) Structure of waterway
The structure of waterway is classified into a non-pressure tunnel and an open channel (or canal). As shown in Figure 5-11, the waterway route is aligned on the same contour line as the normal water level when the open channel type is selected. Either the open channel or the tunnel is selected in consideration of the topography, geology and construction cost.
Construction cost of open channel is significantly less than tunnel of the same length. However,
5 - 18

Guideline and Manual for Hydropower Development Vol. 1 Conventional Hydropower and Pumped Storage Hydropower
an open channel is unsuitable in locations where the topography is steep and the geology is unfavorable. A minimum cross section of approximately 1.8m high and wide is required for tunnel excavation and the discharge capacity is 3 to 4 m3/s at a gradient of 1:1,000. If the maximum plant discharge is less than this value, a tunnel would be overly expensive and an open channel would be more economical.
3) Determination of waterway route
(a) In the case the headrace is a non-pressure tunnel
Intake should be located immediately upstream of the intake weir.
Align the waterway route from the intake to the powerhouse (or tailrace) that will minimize the length of the headrace tunnel, and penstock.
The site of the head tank should be determined so as to shorten the length of penstock. The elevation of the head tank should be the same elevation of the intake in consideration of the accuracy of the reconnaissance study.
The penstock route should be along the ridge
Prepare a waterway profile. An example is given in Figure 5-15.
(b) In the case the headrace is an open channel.
Intake site should be the same as (a) above.
The open channel route should be aligned along the natural contour.
The site of the head tank and penstock route should be the same as (a) above.
(3) Measurement of catchment area
After the intake weir site is determined, confirm the watershed on the topographic map, and measure the catchment area. The catchment area is also called drainage area and is expressed in units of km2. In case water is to be drawn from tributaries, this should be included in the catchment area.
(4) Calculation of flow at the intake site and preparation of flow duration curve
Flow at the intake site is calculated in accordance with 5.3.2 and the flow duration curve is prepared.
(5) Determination of firm discharge
The firm discharge is obtained from the flow duration curve as shown in Figure 5-12. Here, 95% flow which corresponds to 347 day of a year is used as the firm discharge.
5 - 19

Guideline and Manual for Hydropower Development Vol. 1 Conventional Hydropower and Pumped Storage Hydropower
Open Channel
Intake weir
headrace tunnel
Penstock
Powerhouse
Figure 5-11 Waterway Route
Flow duration curve by daily flow
Flow
(m
3 /s)
100%(365day)
0
Q 95%
Percent of Time Exceeded (%) 95%(347day)
Figure 5-12 95% Flow by Flow Duration Curve
(6) Temporary setting of maximum plant discharge
The maximum plant discharge is set so that the flow utilization factor (FUF) at the planned site is approximately 70% as shown in Figure 5-13. The FUF of 70% is adopted in this Manual taking into account the fact that it is difficult for power systems in developing countries to consume all the secondary energy and its energy value is much lower than the primary energy. In case the project is planned to supply its power to an isolated power system of rural area, please refer to Vol.2.
5 - 20

Guideline and Manual for Hydropower Development Vol. 1 Conventional Hydropower and Pumped Storage Hydropower
abcde area
abcf area×100 = 70%
Percent of Time Exceeded
Maximum plant Discharge
Flow duration curveFl
ow (
m3 /s
)
e
bcd
fa
Figure 5-13 Temporary Setting of Maximum Plant Discharge (Run-of-River Type)
(7) Setting of water level of intake weir (Normal water level)
The intake weir diverts river flow into the waterway and does not regulate the flow. Therefore, the lowest possible height of weir is desirable to minimize construction cost. In this Manual, as shown in Figure 5-14, the intake water level of intake weir is 10m above the river bed as measured from topographic map, and this water level is called normal water level.
Intake weir
River Bed
Normal Water Level
10m
Figure 5-14 Water Level of Intake Weir
(8) Setting of tailwater level
The riverbed elevation at the powerhouse or tailrace site is taken from a topographic map to set the tailwater level. In case a tailrace channel is constructed, the tailwater level is set taking into consideration the tailrace channel gradient.
(9) Waterway profile
The waterway profile from the intake to the powerhouse is drawn to obtain the length of the headrace and penstock. An example is shown in Figure 5-15.
5 - 21
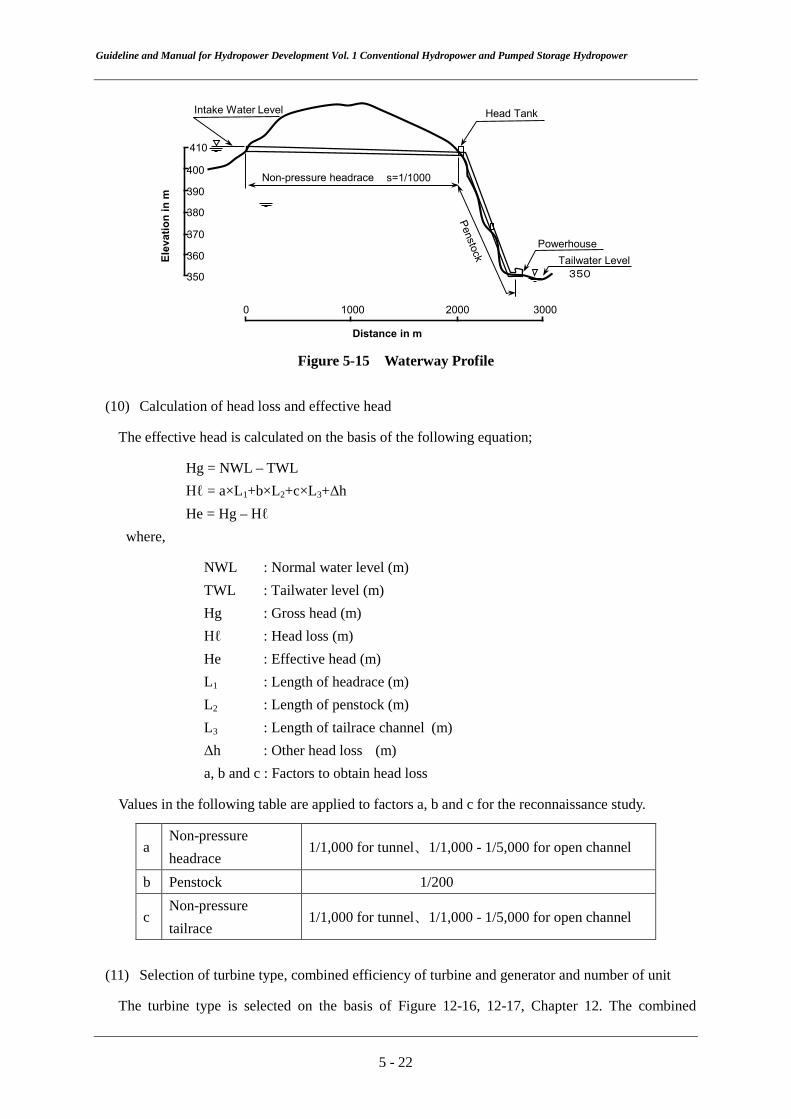
Guideline and Manual for Hydropower Development Vol. 1 Conventional Hydropower and Pumped Storage Hydropower
Tailwater Level
3000200010000
Distance in m
410
400
390
380
370
360
350
Elev
atio
n in
m
Powerhouse
350
Non-pressure headrace s=1/1000
Head TankIntake Water Level
Figure 5-15 Waterway Profile
(10) Calculation of head loss and effective head
The effective head is calculated on the basis of the following equation;
Hg = NWL – TWL Hℓ = a×L1+b×L2+c×L3+Δh He = Hg – Hℓ
where,
NWL : Normal water level (m) TWL : Tailwater level (m) Hg : Gross head (m) Hℓ : Head loss (m) He : Effective head (m) L1 : Length of headrace (m) L2 : Length of penstock (m) L3 : Length of tailrace channel (m) Δh : Other head loss (m) a, b and c : Factors to obtain head loss
Values in the following table are applied to factors a, b and c for the reconnaissance study.
a Non-pressure headrace
1/1,000 for tunnel、1/1,000 - 1/5,000 for open channel
b Penstock 1/200
c Non-pressure tailrace
1/1,000 for tunnel、1/1,000 - 1/5,000 for open channel
(11) Selection of turbine type, combined efficiency of turbine and generator and number of unit
The turbine type is selected on the basis of Figure 12-16, 12-17, Chapter 12. The combined
5 - 22

Guideline and Manual for Hydropower Development Vol. 1 Conventional Hydropower and Pumped Storage Hydropower
efficiency for the turbine is obtained from Figure 5-10. Power generation is not possible for many days due to the effect that the efficiency declines when the discharge is small in the flow duration curve. In this case, two or more units of turbine may be installed.
(12) Calculation of maximum output and firm output
P =9.8×Qmax×He×η Pf =9.8×Qf×He×η f
where,
P : Maximum output (kW) Pf : Firm output (kW) Qmax : Maximum plant discharge (m3/sec) Qf : Firm discharge (m3/sec) He : Normal effective head (m) η : Combined efficiency at maximum output (Table 5-2) ηf : Combined efficiency at firm output (See Table 5-2 and Figure 5-10)
Table 5-2 Standard Efficiency of Turbine and Generator (Francis Turbine of 100% load)
Table 5-2 shows the standard efficiency of 5 to 200MW Francis turbine and generator at 100% output. Figure 5-16 shows the combined efficiency of generator and each type of turbine for maximum output of 50MW. Rough calculation of maximum output is made by applying efficiency at 100% output. In the case of the Francis turbine with 5MW output, for example, the combined efficiency at 100% output is 84% from Table 5-2. Since the combined efficiency is 88% for 50MW Francis turbine at 100% load, the efficiency curve for 5MW is made by shifting 4% down from that for 50MW shown in Figure 5-16. Rough calculation of energy generation is made by applying the efficiency corresponding to Q/Qmax in the modified efficiency curve. Small discharge may not generate power and the lower limit of Q/Qmax is about 35% for the Francis turbine, about 25% for the Bulb turbine and Kaplan turbine and about 20% for the Pelton turbine. The lower limit of Q/Qmax is taken to be 20% for all turbines for the reconnaissance study of this Manual.
5 - 23
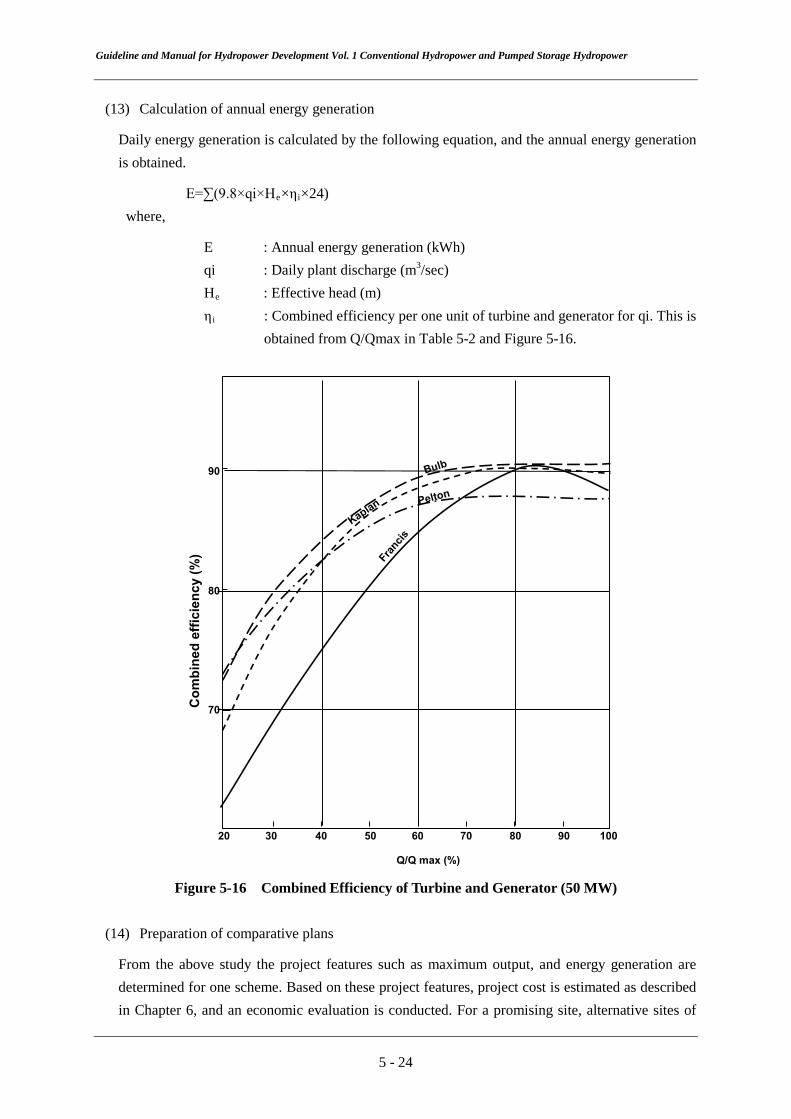
Guideline and Manual for Hydropower Development Vol. 1 Conventional Hydropower and Pumped Storage Hydropower
(13) Calculation of annual energy generation
Daily energy generation is calculated by the following equation, and the annual energy generation is obtained.
E=∑(9.8×qi×He×ηi×24) where,
E : Annual energy generation (kWh) qi : Daily plant discharge (m3/sec) He : Effective head (m) ηi : Combined efficiency per one unit of turbine and generator for qi. This is
obtained from Q/Qmax in Table 5-2 and Figure 5-16.
Com
bine
d ef
ficie
ncy
(%)
90
80
70
20 30 40 50 60 70 80 90 100
Q/Q max (%) Figure 5-16 Combined Efficiency of Turbine and Generator (50 MW)
(14) Preparation of comparative plans
From the above study the project features such as maximum output, and energy generation are determined for one scheme. Based on these project features, project cost is estimated as described in Chapter 6, and an economic evaluation is conducted. For a promising site, alternative sites of
5 - 24

Guideline and Manual for Hydropower Development Vol. 1 Conventional Hydropower and Pumped Storage Hydropower
the intake weir and powerhouse are selected, and alternative plans are prepared for flow utilization factor of 50 to 90%. Then these alternative plans are studied by economic evaluation to select the most optimum plan. However, detailed studies should be made in the feasibility study.
5.3.4 Reservoir Type
This Manual classifies projects with a reservoir having 5% or higher regulating capability factor (RCF: see 5.1.3(9)) as the reservoir type and projects with a reservoir of less than 5% as the pondage type. The procedure of study for a reservoir type project is described below. Paragraphs (1) through (10) are applicable for study of both the reservoir type and pondage type, and the scheme of development is decided. When hydropower is a part of multi-purpose dam project, reservoir operation is mainly decided by other uses and hydropower operation becomes secondary. The project study in this case is described in paragraph (22).
(1) Layout and sequence of study of reservoir type
Examples of layouts of reservoir type are shown in Figure 5-17. Sequence of study is shown in Figure 5-2. Layout 1 is "dam type" in which the dam is constructed across the main river course. Layout 2 is "dam waterway type (See 3.2.2)”. Layout 3 is "dam waterway type" constructing a dam across a tributary and diverting water from the main river course. This type of development is adopted where the topography of the main course is unsuitable for a reservoir or pondage type. This layout is also useful when the main river course faces heavily sediment. The following description is focused on Layouts 1 and 2.
(2) Selection of dam and powerhouse sites and waterway route
Figure 5-18 is an example of site selection.
1) Selection of dam site
The dam site is selected from the following point of view by using a topographic map.
A large storage capacity can be obtained with a dam of relatively small volume. That is a
site where the river is narrow and its upper reaches is a wide valley. In case the river
gradient is gentle, the head must be obtained by the dam height. The dam is constructed
in a narrow part of the river to reduce the construction cost as much as possible.
As water leakage from a reservoir or pondage presents a problem in calcareous rock zone,
such possibility should be investigated in detail.
When a large head is obtained by the waterway, the suitable dam site is just upstream of
the river where a gentle gradient changes to a steep gradient.
No serious compensation and/or resettlement problems are foreseen.
Roads exist nearby, and access to the site is easy.
5 - 25

Guideline and Manual for Hydropower Development Vol. 1 Conventional Hydropower and Pumped Storage Hydropower
(i)
(ii)
(iii)
(iv)
(v)
(vi)
(vii)
(viii)
(ix)
(x)
Regulating pond orreserviorDam
Intake
Waterway
Surge tank
Penstock
Powerhouse
Tailrace
Intake weir
Re-regulating dam
(Note) The re-regulating pond may not be provided in case the downstream conditions allow change of water depthLayout 3
(ix)(iv)
(i)(v)
(viii)
(vi)
(vii)
( )
(viii)
(vii)
(x)
(vi)(v)
(i)(iv)(iii)
(ix)
(iv)
Layout 1
(i)
(ii)
(iii)
(vii)
(viii)
(vi)
(x)
(i)
(iii)
(vi) (vii)
(viii)
(ii)
Layout 2
(iii)
(i)
(ii)
(v)(iv)
(vii)
(viii)
(vi)
(iii)
(i)
(ii)
(x)
(vii) (viii)
(vi)(iv)
(v)
Note: Plan (upper figure), Profile (lower figure)
Figure 5-17 Layout Examples of Reservoir Type and Pondage Type
5 - 26

Guideline and Manual for Hydropower Development Vol. 1 Conventional Hydropower and Pumped Storage Hydropower
2) Selection of powerhouse site
The powerhouse site is selected by considering the following factors;
In case a large head is attained by the waterway, the desirable site of the powerhouse is immediately downstream where the river changes from a steep gradient to a gentle gradient.
Space is available for the powerhouse.
Roads exist nearby to allow easy access.
Sudden change of river flow due to the peak generation does not adversely influence downstream area. A re-regulating pond is required where such influence is expected.
The location is safe from flooding.
3) Waterway route
The waterway route is the general term for the route of headrace, penstock and tailrace channel. Hydropower projects are advantageous when a large head is gained with a short waterway. The dam and powerhouse sites are generally selected by considering the river gradient described above. For a reservoir type or pondage type development, the type of headrace is a pressure tunnel in many cases. Work adits are provided along waterway tunnel route at intervals of about 3 to 4 km to ensure timely completion of the work. In general, the minimum distance from the tunnel to the ground surface (rock cover) is about 30m to assure safe tunnel work.
Legend
River
WaterwaySurge Tank
Powerhouse
Watershed
Longitudinal profile
Route ARoute B
Route C
DamReservoir
Dam
Reservoir
Figure 5-18 Example of Dam and Powerhouse Sites
(3) Calculation of catchment area
When the dam site is selected, the watershed is checked using the topographic map. The
5 - 27

Guideline and Manual for Hydropower Development Vol. 1 Conventional Hydropower and Pumped Storage Hydropower
catchment area is measured, and the unit is expressed in km2.
(4) Calculation of flow at dam site
The flow at the dam site is calculated in accordance with 5.3.2. The flow is calculated from the runoff data of the flow gauging station either at or near the dam site by catchment area ratio.
(5) Preparation of storage capacity curve
The reservoir area at each elevation is measured on a topographic map, and the water storage capacity curve shown in Figure 5-19 is prepared. The interval between the contour lines on a 1:50,000 topographic maps are generally 20 m and the storage capacity may not be measured for a reservoir or pond created by a low dam. In this case, the storage capacity curve is estimated by the river gradient and neighboring topographic features.
Volume(106m3)
Reservoir surface area(km2)
Elev
atio
n(m
)
Figure 5-19 Reservoir Area and Storage Capacity Curve
(6) Estimation of sediment volume and setting of sedimentation level
1) Estimation of Sediment Volume
The sedimentation level is determined by estimating sedimentation for a certain period. Generally 100 years period is used. If there is an existing dam nearby and data on annual sediment yield are available, that data is used. Specific sediment yield is expressed as the annual amount of sediment per km2 of catchment area. The sediment volume is estimated as follows.
Vs=qs×CA (d)×100 where,
Vs : Sediment volume for n years (m3) Qs : Specific sediment yield (m3/km2/year) CA(d) : Catchment area at dam site (km2) n : Calculation period of sediment volume (years)
In case data on specific sediment yield is unavailable, estimate method is described in 9.3.3.
5 - 28

Guideline and Manual for Hydropower Development Vol. 1 Conventional Hydropower and Pumped Storage Hydropower
2) Setting of Sedimentation level
The sedimentation level is obtained for the estimated sediment volume from the reservoir area and storage capacity curve as shown in Figure 5-20.
riverbed
Elev
atio
n (m
)
Storage(X 106m3)
Sedimentation Level
Estimated Sediment Volume
0
Figure 5-20 Setting of Sedimentation Level
(7) Temporary setting of low water level
The low water level (LWL) is set at a position of about twice the inner diameter (D) of the headrace tunnel above the sedimentation level, to prevent intrusion of air into the tunnel. (See Figure 5-21).
The inner diameter of the pressure tunnel is obtained from Figure 5-22 by using the design discharge. When the maximum plant discharge is carried by one waterway or two waterways, the design discharge for each case is the same as the maximum plant discharge or 1/2 of the maximum plant discharge respectively. The maximum plant discharge is determined by (13). Here, a temporary value is obtained by the following equation;
The value 0.25 is the annual plant factor of about 25%.
Qmax = Qave/0.25 where,
Qmax : Maximum plant discharge (m3/sec) Qave : Annual mean flow (m3/sec)
5 - 29
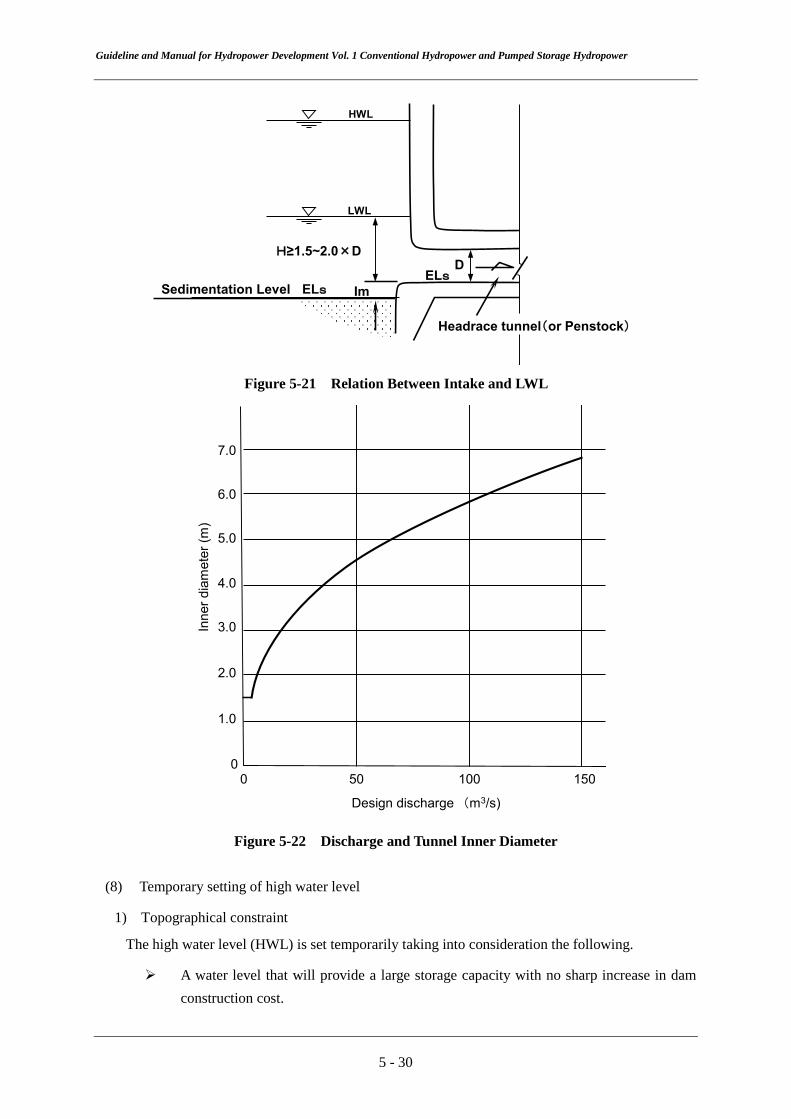
Guideline and Manual for Hydropower Development Vol. 1 Conventional Hydropower and Pumped Storage Hydropower
LWL
HWL
Sedimentation Level ELs ImELs
D
Headrace tunnel(or Penstock)
H≥1.5~2.0×D
Figure 5-21 Relation Between Intake and LWL
Inne
r dia
met
er (m
)
Design discharge (m3/s)
00
50 100 150
7.0
6.0
5.0
4.0
3.0
2.0
1.0
Figure 5-22 Discharge and Tunnel Inner Diameter
(8) Temporary setting of high water level
1) Topographical constraint
The high water level (HWL) is set temporarily taking into consideration the following.
A water level that will provide a large storage capacity with no sharp increase in dam construction cost.
5 - 30

Guideline and Manual for Hydropower Development Vol. 1 Conventional Hydropower and Pumped Storage Hydropower
Reservoir water level shall not exceed water divide elevation to avoid spillage into an adjacent basin. In case spillage is foreseen, HWL must be lowered or saddle dam must be constructed. (See Figure 5-23)
dam
Watershed
reservoir
Spillage
Figure 5-23 Spillage to Adjacent River Basin
When the geology of the reservoir is limestone or other rock susceptible to leakage, its distribution may determine the HWL.
In the case the reservoir area is topographically broad and flat, the setting of HWL should be carefully determined because many people might live in the area.
2) Constrain on economic view point
The effective storage capacity becomes excessive in relation o the inflow and no increase of firm plant discharge can be expected. If the height of the dam is raised to increase the effective storage capacity it may adversely affect the economy of the project. Consideration to lower the HWL is, therefore, necessary.
(9) Determination of LWL, HWL and effective storage capacity
1) Lower limit of low water level considering turbine characteristics
Turbine operation may be interrupted by the relation between the turbine efficiency and head fluctuation, depending on the available drawdown which is the water depth between HWL and LWL of the reservoir.
The limit of head fluctuation of the Francis turbine is about 0.7 and that of the Kaplan turbine about 0.55. For the Francis turbine, attempt is made to set the HWL and LWL in the range of the following equation. When the head fluctuation rate cannot be controlled to a value under 0.7, check if it is in the region of the Kaplan turbine and set the HWL and LWL so that the head fluctuation rate is more than 0.55.
Head fluctuation rateTWLHWLTWLLWL
−−
= ≥0.7
where,
HWL : High water level (m) LWL : Low water level (m)
5 - 31

Guideline and Manual for Hydropower Development Vol. 1 Conventional Hydropower and Pumped Storage Hydropower
LWL : Tailwater level (m) The lower limit of LWL is determined from the higher water level between the water level obtained in (7) and (9) 1) above.
2) Determination of effective storage capacity
The effective storage capacity is determined from the HWL and LWL determined above and using the storage capacity curve.
(10) Preparation of mass curve
The mass curve as shown in Figure 5-24 (a) is the curve accumulating daily or monthly inflow to the reservoir. The tangent of its tangential line shows the flow and the ordinate of a specific period shows the total inflow in that period.
F
E’
E QD
CB’A
B
∑qi
∑qo
∑qm
Time in days
Acc
umul
ated
flow
(∑qi
) m3 /s
-da
y
Fig. (a)
0 Acc
umul
ated
flow
∑(q
i -qm
) (m
3 /s -
day)
0
Fig. (b)
F
∑(qi - qm)
E
E’DB’
A
A’ F
C’BTime in days
∑(qo - qm)Q
Figure 5-24 Concept of Mass Curve
The mass curve is expressed in two ways. In Figure 5-24 (b), the abscissa represents the day or month and the ordinate represents the accumulated flow obtained by adding the difference between the inflow volume and mean flow for one year or a fixed period. This curve is called the differential mass curve. While it is troublesome to make the curve, the accuracy of the flow obtained from the figure is high and it is, therefore, convenient to use it.
The mass curve of natural flow (Σqi) becomes OABCDEF and the mass curve of design discharge (Σq0) becomes OQ in Figure 5-24 (a) where qi is the natural flow into the reservoir, qm is mean flow in the study period and q0 is design discharge. In Figure 5-24 (b), the mass curve of the difference between the natural flow and mean flow { Σ (qi-qm) } becomes OABCDEF, and the mass curve of the difference between the design discharge and mean flow { Σ (q0-qm) } becomes OQ. When the straight line AC is drawn from the contact point A in parallel to OQ, and A' BC' is drawn in the same way, the ordinate of B and B’ where the perpendicular line of point B intersects line AC is the required capacity of the reservoir for the period. If EE' obtained in the same way is greater than BB’, EE' becomes the necessary storage for the period O to F.
5 - 32
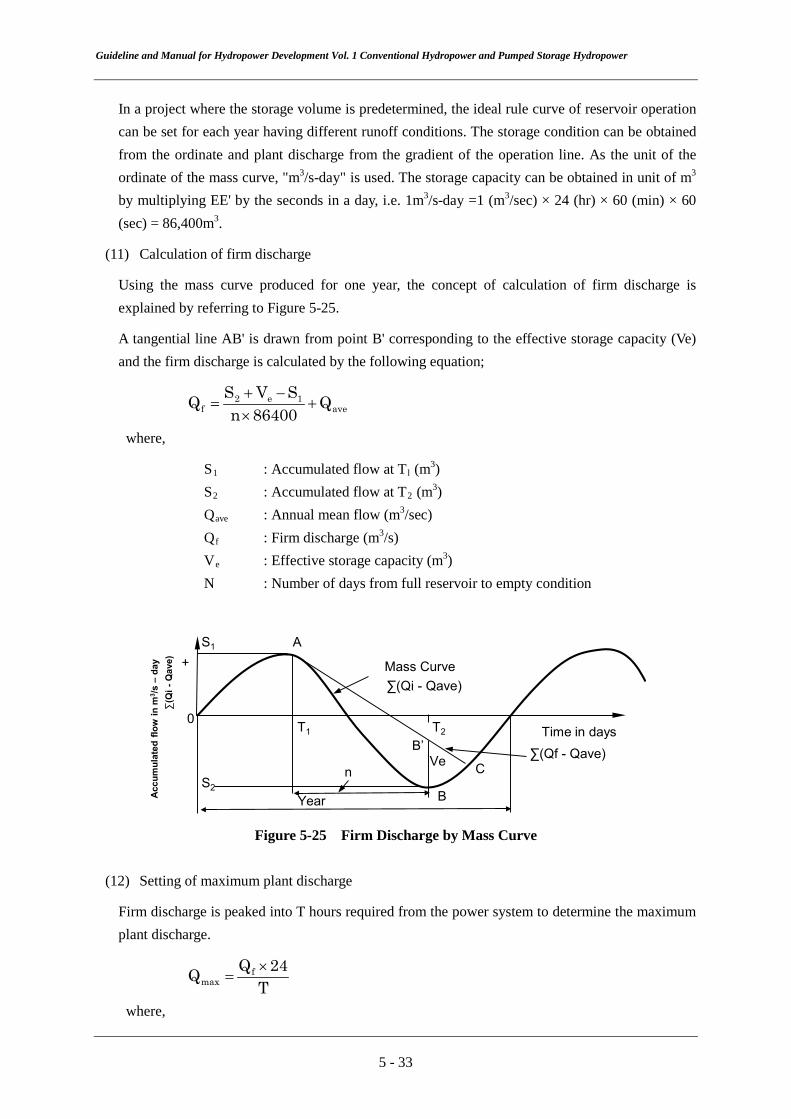
Guideline and Manual for Hydropower Development Vol. 1 Conventional Hydropower and Pumped Storage Hydropower
In a project where the storage volume is predetermined, the ideal rule curve of reservoir operation can be set for each year having different runoff conditions. The storage condition can be obtained from the ordinate and plant discharge from the gradient of the operation line. As the unit of the ordinate of the mass curve, "m3/s-day" is used. The storage capacity can be obtained in unit of m3 by multiplying EE' by the seconds in a day, i.e. 1m3/s-day =1 (m3/sec) × 24 (hr) × 60 (min) × 60 (sec) = 86,400m3.
(11) Calculation of firm discharge
Using the mass curve produced for one year, the concept of calculation of firm discharge is explained by referring to Figure 5-25.
A tangential line AB' is drawn from point B' corresponding to the effective storage capacity (Ve) and the firm discharge is calculated by the following equation;
ave1e2
f Q86400n
SVSQ +×
−+=
where,
S1 : Accumulated flow at Tl (m3) S2 : Accumulated flow at T2 (m3) Qave : Annual mean flow (m3/sec) Qf : Firm discharge (m3/s) Ve : Effective storage capacity (m3) N : Number of days from full reservoir to empty condition
Acc
umul
ated
flow
in m
3 /s –
day
∑(Q
i -Q
ave) Mass Curve
Time in days
∑(Qi - Qave)
∑(Qf - Qave)
S1
T1 T2
A+
S2n
0
B
B’
CVe
Year
Figure 5-25 Firm Discharge by Mass Curve
(12) Setting of maximum plant discharge
Firm discharge is peaked into T hours required from the power system to determine the maximum plant discharge.
T24QQ f
max×
=
where,
5 - 33
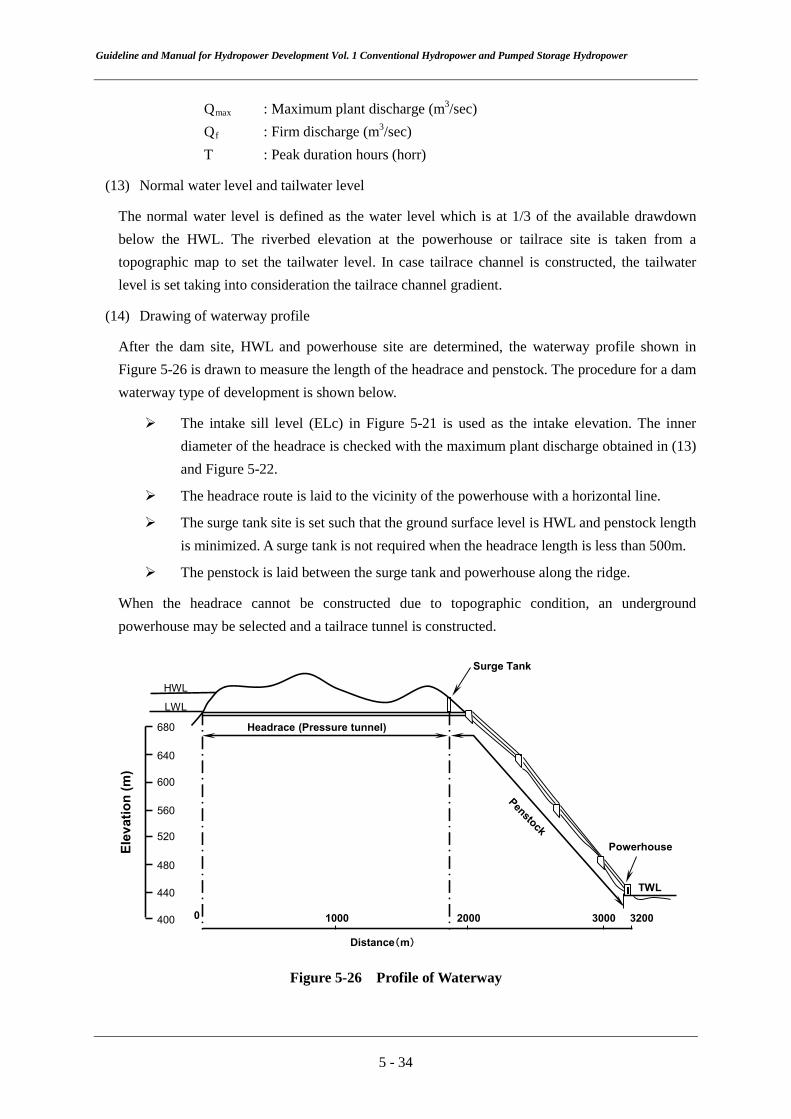
Guideline and Manual for Hydropower Development Vol. 1 Conventional Hydropower and Pumped Storage Hydropower
Qmax : Maximum plant discharge (m3/sec) Qf : Firm discharge (m3/sec) T : Peak duration hours (horr)
(13) Normal water level and tailwater level
The normal water level is defined as the water level which is at 1/3 of the available drawdown below the HWL. The riverbed elevation at the powerhouse or tailrace site is taken from a topographic map to set the tailwater level. In case tailrace channel is constructed, the tailwater level is set taking into consideration the tailrace channel gradient.
(14) Drawing of waterway profile
After the dam site, HWL and powerhouse site are determined, the waterway profile shown in Figure 5-26 is drawn to measure the length of the headrace and penstock. The procedure for a dam waterway type of development is shown below.
The intake sill level (ELc) in Figure 5-21 is used as the intake elevation. The inner diameter of the headrace is checked with the maximum plant discharge obtained in (13) and Figure 5-22.
The headrace route is laid to the vicinity of the powerhouse with a horizontal line.
The surge tank site is set such that the ground surface level is HWL and penstock length is minimized. A surge tank is not required when the headrace length is less than 500m.
The penstock is laid between the surge tank and powerhouse along the ridge.
When the headrace cannot be constructed due to topographic condition, an underground powerhouse may be selected and a tailrace tunnel is constructed.
680
640
600
560
520
480
440
400
Headrace (Pressure tunnel)
Surge Tank
Powerhouse
TWL
Distance(m)
1000 2000 3000 32000
Elev
atio
n (m
)
HWL
LWL
Figure 5-26 Profile of Waterway
5 - 34

Guideline and Manual for Hydropower Development Vol. 1 Conventional Hydropower and Pumped Storage Hydropower
(15) Calculation of head loss and effective head
The effective head is calculated on the basis of the following equation;
Hg = MWL – TWL=HWL – ha/3 – TWL Hℓ -= a×L1+b×L2+c×L3+Δh He = Hg –Hℓ
where,
NWL : Normal water level (m) TWL : Tailwater level (m) ha : Available drawdown (m) Hg : Gross head (m) Hℓ : Head loss (m) He : Effective head (m) L1 : Length of headrace (m) L2 : Length of penstock (m) L3 : Length of tailrace (m) Δh : Other head losses (m) a, b and c : Coefficients to obtain losses
(16) Selection of turbine type, combined efficiency of turbine and generator and number of unit
The turbine type is selected by using Figure 12-16 and 12-17, Chapter 12. Two or more units of turbine and generator may be used when the discharge fluctuation is large or when required by power system demand.
(17) Calculation of maximum output and firm peak output
P=9.8×Qmax×Hes×η Pfp=9.8×Qfp×Hes×η f
where,
P : Maximum output (kW) Pfp : Firm peak output (kW) Qmax : Maximum plant discharge (m3/sec) Qfp : Firm plant discharge (m3/sec) Hes : Normal effective head (m) η : Combined efficiency of turbine and generator at maximum output ηf : Combined efficiency of turbine and generator at firm peak output
5 - 35

Guideline and Manual for Hydropower Development Vol. 1 Conventional Hydropower and Pumped Storage Hydropower
When the maximum plant discharge is set on the basis of (12), P and Pfp have the same value.
(18) Calculation of annual energy generation by mass curve
The plant discharge and water level of reservoir for each month are obtained from the mass curve and reservoir storage capacity curve. The effective head is obtained from the water level, and then the energy generation of each month is calculated. The concept of calculation by using the mass curve is explained below and an example of energy calculation is given in Appendix A-5-1.
1) The mass curve (B) is prepared by drawing a line parallel to the mass curve (A). To arrive at the effective storage (Ve) which is the vertical distance between A and B curves. The mass curve (A) in Figure 5-27 is the same as the mass curve shown in Figure 5-25.
The operation line (1) of firm discharge (See (11).) in relation to water storage period (dry season) , and operation line (2) of maximum plant discharge in relation to supply period are drawn on the mass curve from which the plant discharge of each month is calculated.
When the line (Qmax) drawn from B' intersects the mass curve (A), it shows that the reservoir is full and water is spilled.
2) The vertical distance between the operation line and the mass curve (B) shows the volume of water stored in the reservoir, and vertical distance between the operation line and the mass curve (A) shows the vacant volume. The water level corresponding to this storage volume is obtained from the storage capacity curve at the beginning of each month.
3) Table 5-3 shows the calculation sheet of energy generation.
The water level at the beginning of the month and that at the beginning of the next month are averaged to obtain the mean water level of the month. (See column (6)).
Using the tailwater level explained in (14) and the head loss in (16), effective head of the month is calculated from the mean water level of the reservoir (See Column (7)).
Variable head efficiency is obtained from Figure 5-28 to Figure 5-30 by using the ratio of effective head of the month to effective head of maximum output (See Column (8) (9)).
Being a reservoir type, the combined efficiency of the turbine and generator at the effective head (at maximum output) is obtained by the maximum plant discharge on the condition that peak power generation is performed.
The combined efficiency for the water level of each month is obtained by multiplying the variable head efficiency by the combined efficiency at the effective head (at maximum output) (See Column (10)).
The energy generation of each month is calculated by the following equation; (See Column (11)).
E=9.8×(∑Q i)×Hei×ηth×24
where,
5 - 36

Guideline and Manual for Hydropower Development Vol. 1 Conventional Hydropower and Pumped Storage Hydropower
E : Energy generation (106 kWh) ∑Qi : Plant discharge in i month (m3/sec-day) Column (2) Hei : Effective head in i month (m) Column (7) ηth : (Combined efficiency at maximum output) × (Variable head efficiency) Column (10)
4) The energy generation is classified into primary energy and secondary energy which are dealt in the same way as in 5.3.3 (13).
Mass curve(B)
Mass curve(A)
Storage volume
Vacant volume
Time in days
Operation Line(2)
Operation Line(1)
Full
Full
EmptyB
B’0
A
Cal
cula
tive
flow
∑(Q
i -Q
ave)
m
3 /s -
day
Figure 5-27 Reservoir Operation by Mass Curve
Table 5-3 Energy Calculation by Mass Curve
Month Numberof days
(1)Inflow
(m3/s-day)
(2)Plant
discharge
(m3/s-day)
(3)Overflow
(m3/s-day)
(4)Storage
(m3/s-day)
(5)Water
level (m)
(6)Averaege
of (5) (m)
(7)Effectivehead (m)
(8)Head
variation
(9)Variable
headefficiency
(10)Combinedefficiency
(11)Energy
generation
(106kWh)
(7)891011121234567
Total
5 - 37

Guideline and Manual for Hydropower Development Vol. 1 Conventional Hydropower and Pumped Storage Hydropower
Varia
ble
head
effi
cien
cy:
ŋ th
(Francis Turbine)
Operational range
Hes
1.0
0.9
0.8
0.70.5 0.6 0.7 0.8 0.9 1.0 1.1 1.2 1.3 1.4 1.5 1.6
Ope
ratio
nal l
imit
Ope
ratio
n lim
it
Effective head at maximum outputEffective head
=HeHes
Figure 5-28 Variable Head Efficiency (Francis Turbine)
(Kaplan/bulb Turbine)
Operational range
Hes
Varia
ble
head
effi
cien
cy:
ŋ th
Effective head HeEffective head at maximum output = Hes
1.0
0.9
0.860.5 0.6 0.7 0.8 0.9 1.0 1.1 1.2 1.3 1.4 1.50.4
Ope
ratio
n lim
it
Figure 5-29 Variable Head Efficiency (Kaplan Turbine and Bulb Turbine)
5 - 38

Guideline and Manual for Hydropower Development Vol. 1 Conventional Hydropower and Pumped Storage Hydropower
(Pelton Turbine)
Operational range
Operation limit
HesVa
riabl
e he
ad e
ffici
ency
:ŋ
th
HeEffective head at maximum output
Effective head= Hes
1.0
0.9
0.8
0.70.5 0.6 0.7 0.8 0.9 1.0 1.1 1.2 1.3 1.4 1.5 1.6
Figure 5-30 Variable Head Efficiency (Pelton Turbine)
(19) Storage capacity of re-regulating pond
Since reservoir type and regulating pondage type are operated to generate peaking power, released water from the power plant causes fluctuation of downstream river flow and water level. A re-regulating pond is constructed when water utilization facilities exist on the downstream and there operation is adversely influenced. The storage capacity of the re-regulating pond is obtained by the following equation to regulate daily peak flow.
Ve =(Qmax-Qf)×T×3,600 where,
Ve : Storage capacity of re-regulating pond (m3) Qmax : Maximum plant discharge (m3/sec) Qf : Firm discharge (m3/sec) T : Peak duration hours (hour)
5 - 39

Guideline and Manual for Hydropower Development Vol. 1 Conventional Hydropower and Pumped Storage Hydropower
Storage Capacity
Dis
char
ge in
m3 /s
Tikme in hours24T0
Qf
Qmax
Figure 5-31 Capacity of Re-regulating Pond
(20) Preparation of comparative plans
From above study maximum output and energy generation are calculated, and the project features are determined for one scheme of development. Then the construction cost is estimated and economic evaluation is done as described in Chapter 6. Alternative plans changing the location of powerhouse site and the maximum plant discharge are to be compared for the promising site, and then the optimum development scale can be determined. However, detailed studies should be conducted in the feasibility study.
(21) Planning of hydropower in multi-purpose dam
Hydropower plant, in a multi-purpose dam for purposes of irrigation, other water uses, flood control etc. is studied as shown below.
1) To obtain the firm discharge from flow duration curve prepared according to water releases from reservoir operation for other purposes. (See 5.3.3 (5))
2) The maximum plant discharge is determined. When peak operation is impossible, see 5.3.3 (6). When peak operation is possible, see 5.3.4 (12).
3) Normal water level and tailwater level: See 5.3.4 (13).
4) Calculation of head loss and effective head: See 5.3.4 (15).
5) Selection of turbine type and combined efficiency of turbine and generator: See 5.3.4 (16).
6) Calculation of maximum output and firm output: See 5.3.4 (17)
7) Calculation of annual energy generation
The calculation procedure of output and energy generation of each month is shown in Table 5-4. In the case of hydropower in a multi-purpose dam, the efficiency of turbine varies significantly by flow and head fluctuation, and this should be taken into consideration.
5 - 40

Guideline and Manual for Hydropower Development Vol. 1 Conventional Hydropower and Pumped Storage Hydropower
Table 5-4 Energy Calculation Table
Month J F M A M J J A S O N D Total (a) Number of days day (b) Average monthly plant
discharge m3/sec
(c) Water level at the beginning of the month
EL. m
(d) Monthly mean water level
EL. m
(e) Tailwater level EL. m (f) Gross head m (g) Head loss m (h) Effective head m (i) Turbine input kW (j) Standard combined
efficiency -
(k) Variable head efficiency - (l) Power output kW (m) Energy production kWh
(b) Monthly mean plant discharge is obtained from the water released from dam.
(c) The water level at the beginning of the month is obtained from the reservoir operation, and then monthly mean water level (d) is calculated.
(e) The tailwater level is set at the river bed elevation of the powerhouse site (or tailrace).
(f), (g), (h) Gross head, head loss and effective head at the beginning of the month are obtained.
(i) Turbine input is obtained by the following equation;
When peak operation is not possible : (i) = 9.8 × (b) × (h) When peak operation is possible : (i) = 9.8 × (b) × 24/T × (h) where, (b) × 24/T ≤ Qmax.
(j) Combined efficiency of the turbine and generator is obtained from Figure 5-16 in 5.3.3 in relation to (b)/Qmax. When peak power generation is possible, combined efficiency is obtained from the ratio of peak discharge (b) × 24/T to Qmax.
(k) Variable head efficiency is obtained from He/Hes. The variable head efficiency of Francis turbine, Kaplan turbine (bulb turbine) and Pelton turbine is shown respectively in Figure 5-28, Figure 5-29 and Figure 5-30.
(l), (m) Output and energy generation.
5 - 41

Guideline and Manual for Hydropower Development Vol. 1 Conventional Hydropower and Pumped Storage Hydropower
(l) = (i) × (j) × (k) When peak operation is not possible : (m) = (l) × (a) × 24 When peak operation is possible : (m) = (l) × (a) × T
= 9.8 × (a) × (b) × (h) × (j) × (k) × 24
8) After the scheme of development is determined, the construction cost is estimated and economic analysis is made as described in Chapter 6.
5.3.5 Pondage Type
(1) Layout and sequence of study of pondage type
The power generation method which has a pond capable of regulating river flow for one or several days is called the pondage type. In this Manual, a pond with regulating capability factor (RCF) of less than 5% is defined as a regulating pond. Layout examples of the pondage type are shown in Figure 5-17. The sequence of study chart is shown in Figure 5-2.
(2) Calculation of flow at dam site and preparation of flow duration curve
Flow duration curve shown in Figure 5-32 is prepared on the basis of 5.3.2 (3).
(3) Calculation of firm discharge
Firm discharge is obtained from the flow duration curve as shown in Figure 5-32 corresponding to 347 day flow of a year is used as the firm discharge.
Flow duration curve of daily flow
Percent of Time Exceed(%)
Flow
in (
m3 /s
)
0
Q95%
95%(347day)
100%(365day)
Figure 5-32 95% Flow by Flow Duration Curve
(4) Determination of maximum plant discharge
As shown in Figure 5-33, and the maximum plant discharge is obtained by the equation.
T24QQ f
max×
=
where,
Qmax : Maximum plant discharge (m3/sec) Qf : Firm discharge (m3/sec)
5 - 42

Guideline and Manual for Hydropower Development Vol. 1 Conventional Hydropower and Pumped Storage Hydropower
T : Peak duration hours (hour)
Storage capacity
Flow
inm
3 /s
Time in hours24T0
Qf
Qmax
Figure 5-33 Maximum Plant Discharge and Pondage Capacity
(5) Determination of low water level
The low water level is set in relation to the tunnel diameter determined from the maximum plant discharge obtained above and the sedimentation level obtained in 5.3.4 (6).
(6) Determination of effective storage capacity and high water level
1) The effective storage capacity expressed by the following equation is determined as the pondage capacity necessary for daily flow regulation. (See Figure 5-33)
Ve = (Qmax-Qf)×T×3,600 where,
Ve : Effective storage capacity (m3) T : Peak duration hours (hour)
2) The water level which gives this effective storage capacity above the low water level is the high water level. The high water level may be raised to secure head when no sharp increase of construction cost is expected even if the high water level is raised.
(7) Normal water level and tailwater level
Refer to 5.3.4 (13).
(8) Preparation of waterway profile
Refer to 5.3.4 (14).
(9) Calculation of head loss and effective head
Refer to 5.3.4 (15).
5 - 43

Guideline and Manual for Hydropower Development Vol. 1 Conventional Hydropower and Pumped Storage Hydropower
(10) Selection of turbine type, combined efficiency of turbine and generator and number of unit
Refer to 5.3.4 (16).
(11) Calculation of maximum output and firm peak output
Refer to 5.3.4 (17).
(12) Calculation of annual energy generation
Daily energy generation is calculated by the following equation to arrive at the annual energy generation.
E = ∑(9.8×η×q1×He×24) where,
E : Annual energy generation (kWh) q1 : Daily plant discharge (m3/sec) He : Effective head (m) η : Combined efficiency at maximum output
(13) Storage capacity of re-regulating pond
A re-regulating pond is constructed when the peak flow must be flattened before discharging water to the downstream of the power plant. Refer to 5.3.4 (19).
(14) Preparation of comparative plans
From the above study, maximum output and energy generation are calculated for one scheme and the project features are determined. By using the project features, construction cost is estimated and economic evaluation is done as described in Chapter 6. For promising sites, alternative plans changing the powerhouse site and maximum plant discharge to arrive at utilization factor of 30 to 70% are prepared. However, detailed studies should be conducted in the feasibility study.
5.4 Planning of Pumped Storage Type
The reconnaissance study for the pumped storage hydropower is shown below and an example pf the study is attached in Appendix A-5-1.
(1) Classification, layout and sequence of study of pumped storage type
Layout examples of pumped storage type are shown in Figure 5-34, and sequence of study is shown in Figure 5-3. Pumped storage power generation is classified into the "pure pumped storage type” and "pumped and natural flow storage type", depending on natural inflow into the upper pond. The former type does not utilize natural river flow into the upper pond for generation or does not have the natural flow, and electricity is generated by circulating water stored in the lower and upper ponds. The latter type uses pumped water as well as natural flow into the upper pond to generate electricity. Therefore, the latter type is a conventional reservoir type or pondage type with pumping facility added.
5 - 44

Guideline and Manual for Hydropower Development Vol. 1 Conventional Hydropower and Pumped Storage Hydropower
Pure pumped storage type
Pumped and natural flow storage type
Lower pondPowerhouse
Upper pond
Powerhouse
Lower pond
Upper reservoir
Inflow from river
Figure 5-34 Types of Pumped Storage Power Generation
(2) Determination of installed capacity and peak duration hours
For a pumped storage type, maximum output can be set as desired without regard to river flow if the topographic features of the site are good, therefore, the project site can be selected after fixing the maximum output and peak duration hours. In the reconnaissance study, maximum output is set at 10% or less of the total capacity of power system and the peak duration hours is set at about 6 to 8 hours. If the system capacity is 10,000MW and 5,000MW, for example, the development scale of pumped storage is studied respectively at less than 1,000MW and 500MW. The number of 10% mentioned before is the example of Japan, the value might change depending on developing countries’ power systems.
(3) Selection of project site
A pure pumped storage type can be constructed where the topographic features allow construction of upper and lower ponds and where desirable head is available. The degree of freedom for site selection is wide and a high head site can be easily found. The site selection condition of the pumped and natural flow storage type is almost the same as conventional hydroelectric site and does not have a high degree of freedom for site selection as in the case of pure pumped storage type.
Since energy for pumping in a pumped storage power plant is supplied from thermal power plant, etc., integrated operation with these electric power facilities is important in project planning.
From the aspect of economic efficiency, it is desirable that the pumped storage power plant is
5 - 45

Guideline and Manual for Hydropower Development Vol. 1 Conventional Hydropower and Pumped Storage Hydropower
situated close to the load center as well being near to transmission lines with the capacity needed for sending and receiving power. Location near the load center saves construction cost of transmission line and decreases transmission line loss.
The pumped storage power plant site is selected on a topographic map by taking the above into consideration. Attention should be given to the following factors in the study of topographic features.
1) An indicator of L/H is used as reference index for site selection.
where,
L : Horizontal length of waterway from intake to tailrace (m) H : Difference of riverbed elevation between both dam sites (m)
From experience, a promising site is where the L/H is 4 to 6 times or less and H is 400 m or over. These values may be used as a target in the study if local conditions enable to construct tunnel at low cost.
2) When an existing and proposed reservoir or pond for other sector can be used as the pond for the pumped storage power plant, a plan utilizing these storage dams should be studied.
3) Necessary storage capacity of the pond can be obtained with a small scale dam. Geologic conditions indicate that there is no likelihood of water leakage from the pond to exert adverse influence on power generation. There is a road nearby allowing easy access. Compensation and resettlement problems are minimal.
(4) Calculation of catchment area
Refer to 5.3.4 (3).
(5) Calculation of flow at the upper dam site
Refer to 5.3.4 (4) for the pumped and natural flow storage type. River flow flowing into the upper pond is calculated.
(6) Preparation of storage capacity curve
The storage capacity curve of the upper and lower ponds is prepared by referring to 5.3.4 (5).
(7) Temporary fixing of maximum plant discharge
The maximum plant discharge is obtained by the following equation;
η××=
H9.8P
Q maxmax
where,
Qmax : Maximum plant discharge (m3/sec) Pmax : Maximum output (kW) H : Head (Difference in riverbed elevation between upper and lower dams)
5 - 46
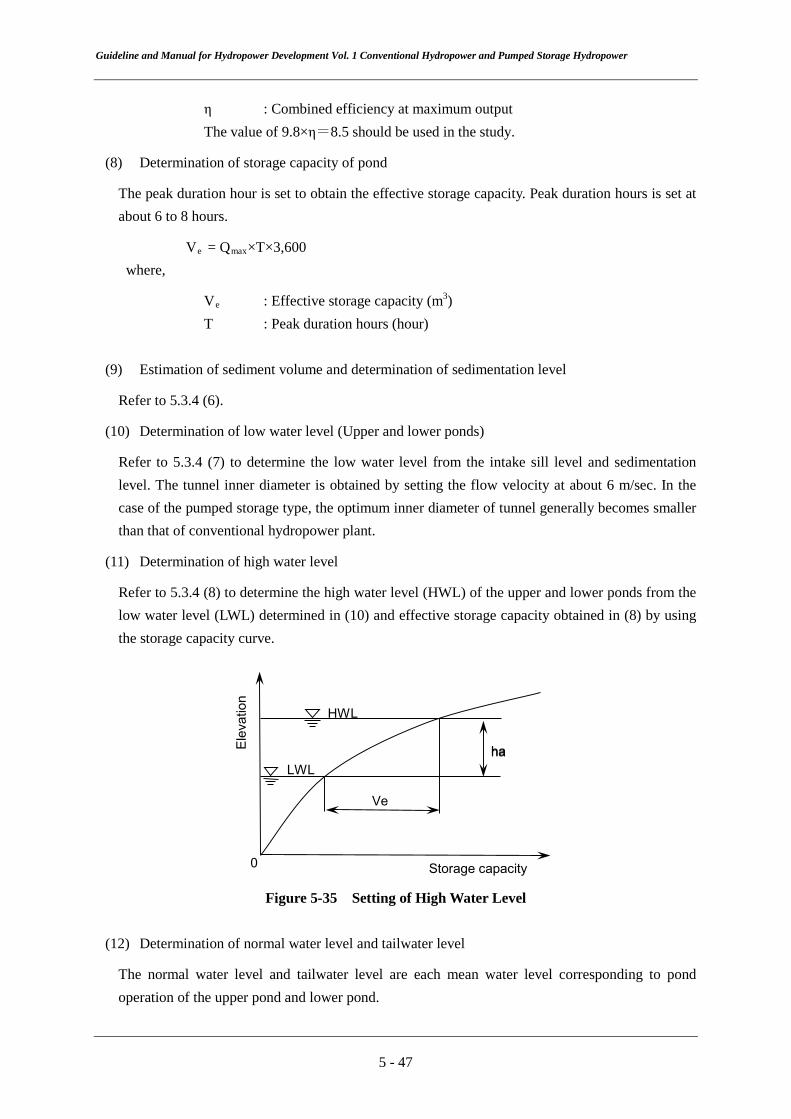
Guideline and Manual for Hydropower Development Vol. 1 Conventional Hydropower and Pumped Storage Hydropower
η : Combined efficiency at maximum output The value of 9.8×η=8.5 should be used in the study.
(8) Determination of storage capacity of pond
The peak duration hour is set to obtain the effective storage capacity. Peak duration hours is set at about 6 to 8 hours.
Ve = Qmax×T×3,600 where,
Ve : Effective storage capacity (m3) T : Peak duration hours (hour)
(9) Estimation of sediment volume and determination of sedimentation level
Refer to 5.3.4 (6).
(10) Determination of low water level (Upper and lower ponds)
Refer to 5.3.4 (7) to determine the low water level from the intake sill level and sedimentation level. The tunnel inner diameter is obtained by setting the flow velocity at about 6 m/sec. In the case of the pumped storage type, the optimum inner diameter of tunnel generally becomes smaller than that of conventional hydropower plant.
(11) Determination of high water level
Refer to 5.3.4 (8) to determine the high water level (HWL) of the upper and lower ponds from the low water level (LWL) determined in (10) and effective storage capacity obtained in (8) by using the storage capacity curve.
Storage capacity
Elev
atio
n
haha
Ve
HWL
LWL
0
Figure 5-35 Setting of High Water Level
(12) Determination of normal water level and tailwater level
The normal water level and tailwater level are each mean water level corresponding to pond operation of the upper pond and lower pond.
5 - 47

Guideline and Manual for Hydropower Development Vol. 1 Conventional Hydropower and Pumped Storage Hydropower
(13) Preparation of waterway profile
1) Setting the elevation of turbine center
The turbine center is set at the elevation corresponding to the draft head below the low water level of the lower pond. The relation between the maximum pumping head and draft head is shown in Figure 5-36.
Maximum pumping head (m)
Dra
ft he
ad
(m
)
-60
-50
-40
-30
-20
-10
00 100 200 300 400 500 600
Figure 5-36 Draft Head
2) Dam specification and turbine center
Dam specifications (HWL and LWL) and the elevation of turbine center of the power plant are determined and the waterway profile shown in Figure 5-37 is then prepared.
5 - 48

Guideline and Manual for Hydropower Development Vol. 1 Conventional Hydropower and Pumped Storage Hydropower
Intake water level
LWLHWL
Upper pond
Intake Penstock
Ground surface
Tail water levelSurge tank
TailracePowerhouseLower pond
HWLLWL
Figure 5-37 Waterway Profile
(14) Calculation of head loss and effective head
Refer to 5.3.4 (16). Coefficients a, b and c to obtain head loss are shown below.
a= 1/300, b = 1/ 100, c = 1/300
(15) Re-calculation of maximum plant discharge
The normal effective head (Hes) is determined in (14) and the maximum plant discharge is then determined from the following equation;
Hes8.5P
Q maxmax ×
=
(16) Calculation of annual energy generation
The energy generation is obtained by the following equation.
E=P×T where,
E : Annual energy generation (kWh) T : Annual generating hours (hour)
When there is natural inflow into the upper pond and this natural water can be used for power generation, the electric energy (E') is calculated by the following equation;
E'=9.8×η×∑Qi×Hes×24/3600 where,
∑Qi : Annual inflow available for power generation (m3)
5 - 49

Guideline and Manual for Hydropower Development Vol. 1 Conventional Hydropower and Pumped Storage Hydropower
(17) Calculation of annual pumping energy by pumped storage
Ep=(E-E' )/α where
α : Gross efficiency of pumped storage power plant (around 0.7, which is the ratio of the generated energy to pumping-up energy of pumped storage power plant)
(18) Determination of project features
The above study determines the project features including output and other factors. The construction cost is then estimated by the method described in Chapter 6 and an economic evaluation is conducted.
5 - 50

Guideline and Manual for Hydropower Development Vol. 1 Conventional Hydropower and Pumped Storage Hydropower Reference of Chapter 5
[1] Guide Manual for Hydropower Development, New Energy Foundation, 1996
5 - 51

Chapter 6 Preliminary Estimate of Construction Cost and
Project Optimization

Guideline and Manual for Hydropower Development Vol. 1 Conventional Hydropower and Pumped Storage Hydropower Chapter 6 Preliminary Estimate of Construction Cost and Project
Optimization
6.1 Construction Cost Estimate
The condition of construction cost estimate for the reconnaissance study is shown below and an example of the study is attached in Appendix A-5-1.
(1) Construction cost of reconnaissance study is calculated using Tables 6-1 to 6-3 without distinguishing local and foreign currencies.
(2) Access roads cost of the preparatory works is calculated based on quantity of work and unit cost, while the cost of the office and camp facilities is the amount of 5% of the total cost of civil works for run-of-river type and 2% for pondage type, reservoir type and pumped storage type. Since the run-of-river type is a relatively small scale hydropower project, compensation and resettlement costs are ignored.
(3) Environmental mitigation cost is l% of the total cost of the civil works for the run-of-river type, and 3% for the pondage type, reservoir type and pumped-storage type.
(4) The cost of civil works and hydraulic equipment are calculated by multiplying the quantity of main work items by unit cost (See Table 6-4 through Table 6-6). The work quantity is obtained from tables, diagrams and numerical formula.
1) In this Manual, the main work items of civil structures are excavation, concrete, embankment, and reinforcement bars, and those of hydraulic equipment are gate, screen, and steel pipe.
2) The costs of other work items, other than the main items, are calculated as "Others" in a lump- sum at a certain ratio against the total cost of the main work items.
3) Unit costs are used by referring to the latest data of similar works in the relevant country.
4) In case it is difficult to collect such data in the relevant country, it is recommendable to collect data on prices on the international market for hydraulic equipment from specialists, consultants, and/or manufacturers.
(5) The construction cost of electro-mechanical equipment such as turbines, generators, control devices and main transformers, etc. are estimated in a lump-sum in "Electro-mechanical equipment". Follow the same procedures as unit prices explained above when it is difficult to obtain data of the electro-mechanical equipment. There is a relationship that is almost as a straight line on logarithmic paper between electro-mechanical equipment cost according to each turbine type and P/He1/2 (P: maximum output in kW, He: effective head in meters), as shown in the example in Figure 6-1. Therefore, actual cases of recent projects should be used as reference by plotting the data on logarithmic paper.
(6) In this Manual, the construction cost of transmission lines is treated in the following manner. Transmission line cost is only calculated in case the project appears promising, and is not calculated in other cases or in hydropower potential survey. Transmission line cost is calculated
6 - 1

Guideline and Manual for Hydropower Development Vol. 1 Conventional Hydropower and Pumped Storage Hydropower
by multiplying the length by the unit price per km which is determined by the line capacity and number of circuits. Follow the same procedures in (4) in case it is difficult to obtain unit price data.
(7) The following are included in the costs of “administration”, “engineering service”, “contingencies”, which are calculated by multiplying the direct construction cost by an appropriate ratio.
1) The administration cost includes personnel expense and expenses to maintain the construction office. The engineering service cost includes expenses related to technical services such as design work and construction supervision of consultants. In this Manual, 15% of the direct construction cost is assumed to be as the cost of administration and engineering service.
2) The contingency includes physical contingency which is the increase of quantities of work, and 10% of the direct construction cost is assumed for the contingencies.
(8) Interest during construction is calculated based on the following conditions.
Interest rate (i) is calculated taking into account the ratio of local currency and foreign currency. For example, if the local and foreign currency portions are 40% and 60% respectively, the calculation is as follow.
i = i1×0.4 + i2×0.6 i1 : Interest rate for local currency i2 : Interest rate for foreign currency
Interest during construction = (cost of preparatory works + cost of environmental mitigation + cost of civil works + cost of hydraulic equipment + cost of electro mechanical equipment + cost of administration and engineering service + contingency)×0.4×i×T
where,
T : Construction period (years)
The value of 0.4 is a cash flow coefficient which is an empirical value of existing projects
(9) Preliminary construction cost is calculated according to the following tables.
Run-of-river type: Table 6-1 and Table 6-4 (1) (2)
Pondage and Reservoir types: Table 6-2 and Table 6-5 (1) (2)
Pumped storage type: Table 6-3 and Table 6-6 (1) (2)
6 - 2

Guideline and Manual for Hydropower Development Vol. 1 Conventional Hydropower and Pumped Storage Hydropower
Table 6-1 Construction Cost Summary (Run-of-River Type)
6 - 3
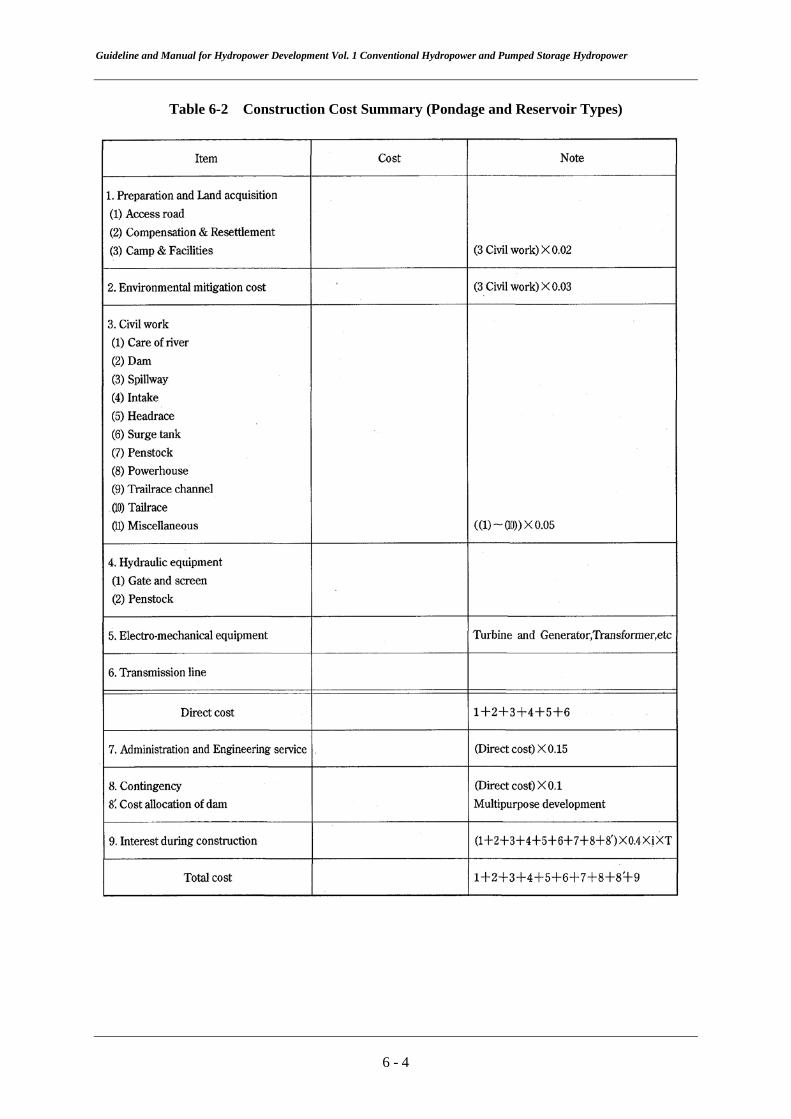
Guideline and Manual for Hydropower Development Vol. 1 Conventional Hydropower and Pumped Storage Hydropower
Table 6-2 Construction Cost Summary (Pondage and Reservoir Types)
6 - 4

Guideline and Manual for Hydropower Development Vol. 1 Conventional Hydropower and Pumped Storage Hydropower
Table 6-3 Construction Cost Summary (Pumped Storage Type)
6 - 5

Guideline and Manual for Hydropower Development Vol. 1 Conventional Hydropower and Pumped Storage Hydropower
Table 6-4 (1) Civil Engineering Work Cost (Run-of-River Type)
6 - 6

Guideline and Manual for Hydropower Development Vol. 1 Conventional Hydropower and Pumped Storage Hydropower
Table 6-4 (2) Hydraulic Equipment Cost (Run-of-River Type)
6 - 7

Guideline and Manual for Hydropower Development Vol. 1 Conventional Hydropower and Pumped Storage Hydropower
Table 6-5 (1) Civil Engineering Work Cost (Pondage and ReservoirTypes)
6 - 8

Guideline and Manual for Hydropower Development Vol. 1 Conventional Hydropower and Pumped Storage Hydropower
Table 6-5 (2) Hydraulic Equipment Cost (Pondage and Reservoir Types)
6 - 9

Guideline and Manual for Hydropower Development Vol. 1 Conventional Hydropower and Pumped Storage Hydropower
Table 6-6 (1) Civil Engineering Work Cost (Pumped Storage Type)
6 - 10

Guideline and Manual for Hydropower Development Vol. 1 Conventional Hydropower and Pumped Storage Hydropower
6 - 11
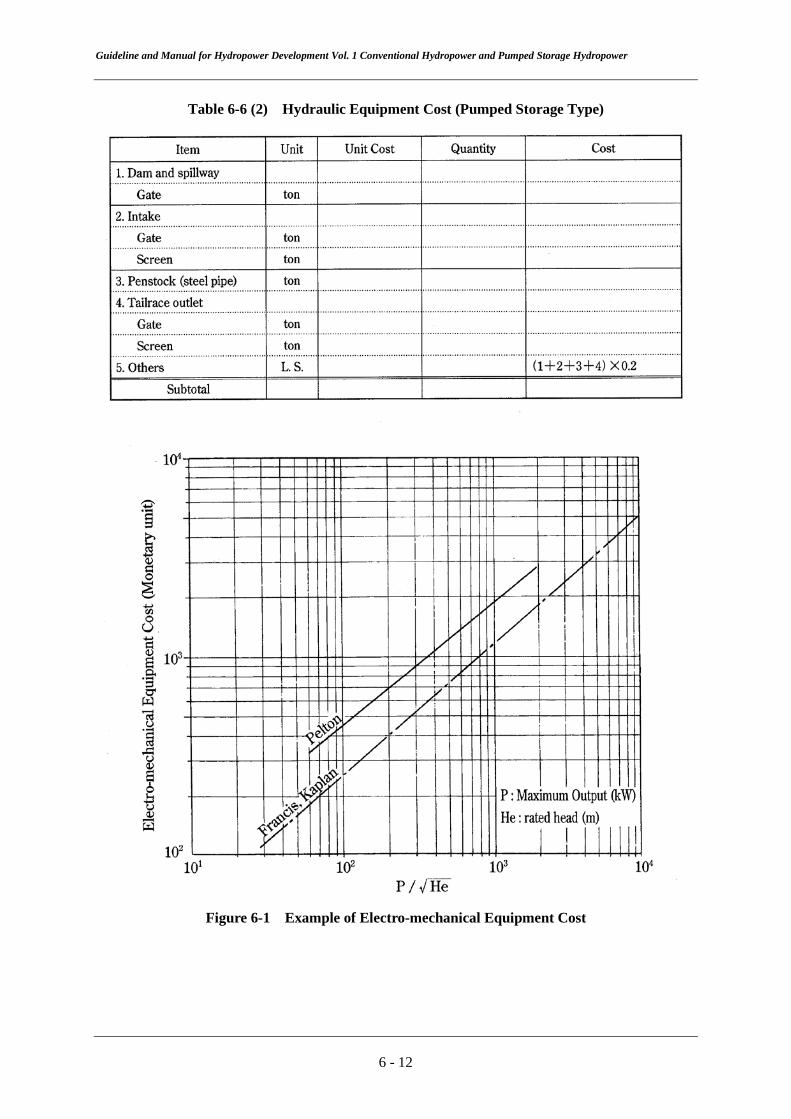
Guideline and Manual for Hydropower Development Vol. 1 Conventional Hydropower and Pumped Storage Hydropower
Table 6-6 (2) Hydraulic Equipment Cost (Pumped Storage Type)
Figure 6-1 Example of Electro-mechanical Equipment Cost
6 - 12

Guideline and Manual for Hydropower Development Vol. 1 Conventional Hydropower and Pumped Storage Hydropower
6.2 Calculation of Quantity of Work
6.2.1 Calculation Method
As 1:50,000 scale topographical maps do not provide the accuracy required to enable the design and cost estimate of structures, the quantities of civil works and hydraulic equipment, are, calculated by formulae based on the quantities of existing facilities. The formulae used were developed in Japan for the purpose of the hydropower potential study. When adequate data regarding quantity of work are available in the relevant country, these data are used to revise the above formulae and may be used for practical application.
These formulas are prepared for each facility such as intake weir, intake, and headrace etc. The quantities of work are calculated for main work items such as excavation, concrete, embankment, reinforcement bars, gates, screens, and steel conduits.
Following symbols and units are used in the calculation.
Ve : Excavation volume (m3) Vc : Concrete volume (m3) Vf : Dam embankment volume (for fill dam) (m3) Wr : Weight of reinforcement bars (ton) Wg : Weight of gate (ton) Wp : Weight of steel conduit (ton) Ws : Weight of screen (ton)
Quantities of work items other than main work items are not calculated. However, their cost are calculated as "others" in a lump-sum at a certain ratio against the total cost of main work items
Quantities of work of headrace tunnels and penstock are calculated based on their inner diameters. The inner diameter adopted in this Manual indicates the economic cross section based on the prices of commodities in Japan. Although there may be differences due to the price levels in the relevant developing countries, such differences are neglected in this Manual.
6.2.2 Quantities of Construction Work for Run-of-River Type Power Plant
Quantities of construction work are calculated according to Table 6-4 (1) and (2).
(1) Intake weir
The height of weir is assumed at 10m, and its crest length is obtained from the contour lines of topographic maps. The excavation volume, concrete volume, weight of reinforcement bars, and weight of gates are calculated by the following equations.
Ve = 8.69 × (Hd×L)1.14 Vc = 16.1 × (Hd2×L)0.695 Wr = 0.0274 × Vc0.830 Wg = 0.145 × Qf0.692
6 - 13

Guideline and Manual for Hydropower Development Vol. 1 Conventional Hydropower and Pumped Storage Hydropower
where, Hd : Weir height (m) L : Crest length of weir (m) Qf : Design flood discharge (m3/sec)
Design flood discharge is calculated by Creager equation as follows.
Qf = q × A
)1A894.0( 048.0
CA46q −−
=
where, Qf : Design flood discharge (feet3/sec) q : Maximum specific discharge (feet3/sec/mile2) C : Region coefficient A : Catchment area (mile2)
The following simplified equation referring to Creager equation is applied in Japan.
Qf = q×A
( )1A 05.0
Aaq −−
×=
where, Qf : Design flood discharge (m3/sec) q : Specific discharge (m3/sec/km2) a : Region coefficient A : Catchment area (km2)
Note: Values of annual rainfall are obtained from Chronological Tables of Science in Japan.
Cost of other items of civil works such as grouting and coffering except the main items stated above is estimated as "Others" at 30% of the costs of the main items.
(2) Intake
Non-pressure type is adopted. And the inner diameter of the waterway is obtained from Figure 6-2 based on the maximum plant discharge. The excavation volume, concrete volume, weight of reinforcement bars, weight of gates, and weight of intake screen are obtained by the following equations.
Ve = 171×(R×Q)0.666 Vc = 147×(R×Q)0.470 Wr = 0.0145×Vc1.15
Region Region H Region T Region Ka Region Ki Region S Region Coefficient (a) 17 34 48 41 84 Annual Rainfall (mm) 1,080 1,360 1,710 1,440 2,280
6 - 14

Guideline and Manual for Hydropower Development Vol. 1 Conventional Hydropower and Pumped Storage Hydropower
Wg = 1.27×(R×Q)0.533 Ws = 0.701×(R×Q)0.582
where,
D : Inner diameter of waterway (m) R : Radius of waterway (=D/2, unit: m) Q : Maximum plant discharge (m3/sec)
In this Manual the waterway gradient is 1:1,000 and the inner diameter of the headrace is the value obtained in (4), for tunnel. Even when an open channel (canal) is adopted in (4), calculation is made using the inner diameter of tunnel.
Cost of other items of civil works such as coffering and trash rack, rake except the main items stated above is estimated at 25% of the cost based on the main items.
(3) Settling basin
The excavation volume, concrete volume, weight of reinforcement bars, weight of gates, and weight of screen are obtained by following equations.
Ve = 515×Q1.07 Vc = 169×Q0.936 Wr = 0.120×Vc0.847 Wg = 0.910×Q0.613 Ws = 0.879×Q0.785
where,
Q : Maximum plant discharge (m3/sec)
Cost of other items of civil works such as slope protection, etc. not included in the main items stated above is estimated at 20% of the cost of the main items.
(4) Headrace
1) In the case of tunnel
Concrete lined non-pressure tunnel of horseshoe shape is adopted.
The excavation volume, concrete volume, and weight of reinforcement bars are calculated by the following equations.
Ve = (0.893×D2+1.07×D+0.321)×L Vc = (1.07×D+0.321)×L Wr = (0.00911×D+0.00273)×L
where,
L : Total length of tunnel (m) D : Inner diameter of tunnel (m), obtained from Figure 6-2
6 - 15

Guideline and Manual for Hydropower Development Vol. 1 Conventional Hydropower and Pumped Storage Hydropower
2) In the case of open channel
The excavation volume, concrete volume, and weight of reinforcement bars are calculated by the following equations.
BH = 1.09×Q0.379
Ve = 6.22× ( )1.04BH ×L
Vc = H×t×2+(B+2t)×t Wf = 0.577×(Vc/L)0.888×L
where,
Q : Maximum plant discharge (m3/sec) L : Total length of open channel (m) B : Width of open channel (m) H : Height of open channel (m) t : Concrete thickness (m)
3) Others
In the case of a tunnel, cost of other items of civil works such as grouting and excavation of adit, which are not included in the main items stated above, is estimated at 15% of the cost of the main items. In the case of an open channel, it is estimated at 30% of the cost of main items for items such as slope protection and fencing.
(5) Head tank
The excavation volume, concrete volume, and weight of reinforcement bars are obtained by the following equations.
Ve = 808×Q0.697 Vc = 197×Q0.716 Wr = 0.051×Vc
where,
Q : Maximum plant discharge (m3/sec)
Cost of other items of civil works not included in the main items stated above is estimated at 40% of the cost of the main items. This 40% includes the cost of gate, screen, etc.
(6) Penstock and spillway channel
1) Penstock
The exposed type is adopted and a spillway channel is built. The average inner diameter is obtained from Figure 6-3.using the maximum plant discharge. The excavation volume, concrete volume, and weight of reinforcement bars for penstock are calculated by the following equations.
Ve1 = 10.9×Dm1.33×L (for Dm>2.0m, see reservoir and pondage types)
Vc1 = 2.14×Dm1.68×L
6 - 16

Guideline and Manual for Hydropower Development Vol. 1 Conventional Hydropower and Pumped Storage Hydropower
Wr1 = 0.018×Vc where,
Dm : Average inner diameter of steel conduit (m) Lc : Total length of penstock (m)
The weight of the steel conduit is obtained by the following equation. An allowable tensile stress of 115N/mm2 is adopted for steel pipes.
Wp1 = 7.85×π×Dm×tm×10-3×1.15×L tm = 0.0362×H×Dm+2
where,
Wp1 : Weight of steel conduit (ton) tm : thickness of steel conduit (mm) Dm : Average inner diameter of steel conduit (m) H : Design head (intake water level - tailwater level, in meters) L : Total length of penstock (m)
2) Spillway channel
The inner diameter (D) of the spillway channel is obtained from Figure 6-4. The excavation volume, concrete volume, weight of reinforcement bars, and weight of steel conduit are calculated by the following equations. It is unnecessary to consider the spillway channel when excess water can be discharged into a small valley.
Ve2 = 9.87×D1.69 Vc2 = 2.78×D1.70 Wr2 = 0.029×Vc Wp2 = 0.165×D1.25×L
3) Total quantity of penstock and spillway channel
Ve = Ve1+Ve2 Vc = Vc1+Vc2 Wr = Wr1+Wr2 Wp = Wp1+Wp2
Cost of other items of civil works such as grouting and slope protection not included in the main items stated above is estimated at 20% of the cost of main items.
(7) Powerhouse
An above-ground powerhouse is adopted. The number of unit of turbine and generator is determined. The excavation volume, concrete volume, and weight of reinforcement bars are calculated by the following formula.
Ve = 97.8×(Q×He2/3×n1/2)0.727 Vc = 28.1×(Q×He2/3×n1/2)0.795
6 - 17

Guideline and Manual for Hydropower Development Vol. 1 Conventional Hydropower and Pumped Storage Hydropower
Wr = 0.046×Vc1.05
where,
Q : Maximum plant discharge (m3/sec) He : Effective head (m) n: Number of unit
Cost of other items of civil works such as drainage works, foundation of outdoor steel structure, etc. not included in the main items stated above is estimated at 20% of the cost of main items. In addition to this cost, another cost of 30% of the cost of main items is added for the powerhouse building.
(8) Tailrace channel
Calculation of quantity of channel work is made in accordance with the calculation method of the quantity of work for the headrace.
(9) Tailrace
A non-pressure type is adopted. In case that the tailrace is constructed in a regulating pond or a reservoir, a pressure type should be adopted, however this case is not described in this Manual.
The inner diameter of the waterway is obtained from Figure 6-2 using the maximum plant discharge.
The excavation volume of the tailrace (without gate), concrete volume, and weight of reinforcement bars are calculated by the following equations.
Ve = 395×(R×Q)0.479 Vc = 40.4×(R×Q)0.684 Wr = 0.278×Vc0.610
where,
Q : Maximum plant discharge (m3/sec) R : Waterway radius (m)
Cost of other items of civil works such as coffering, slope protection, etc. not included in the main items, is estimated at 25% of the cost of the main items.
(10) Miscellaneous works
Cost of miscellaneous works such as the disposal area and landscaping work is estimated at 5% of the total cost of the civil works.
6 - 18

Guideline and Manual for Hydropower Development Vol. 1 Conventional Hydropower and Pumped Storage Hydropower
Figure 6-2 Inner Diameter of Waterway
6 - 19

Guideline and Manual for Hydropower Development Vol. 1 Conventional Hydropower and Pumped Storage Hydropower
Figure 6-3 (1) Inner Diameter of Penstock
Figure 6-3 (2) Inner Diameter of Penstock (Design Discharge<20m3/sec)
6 - 20
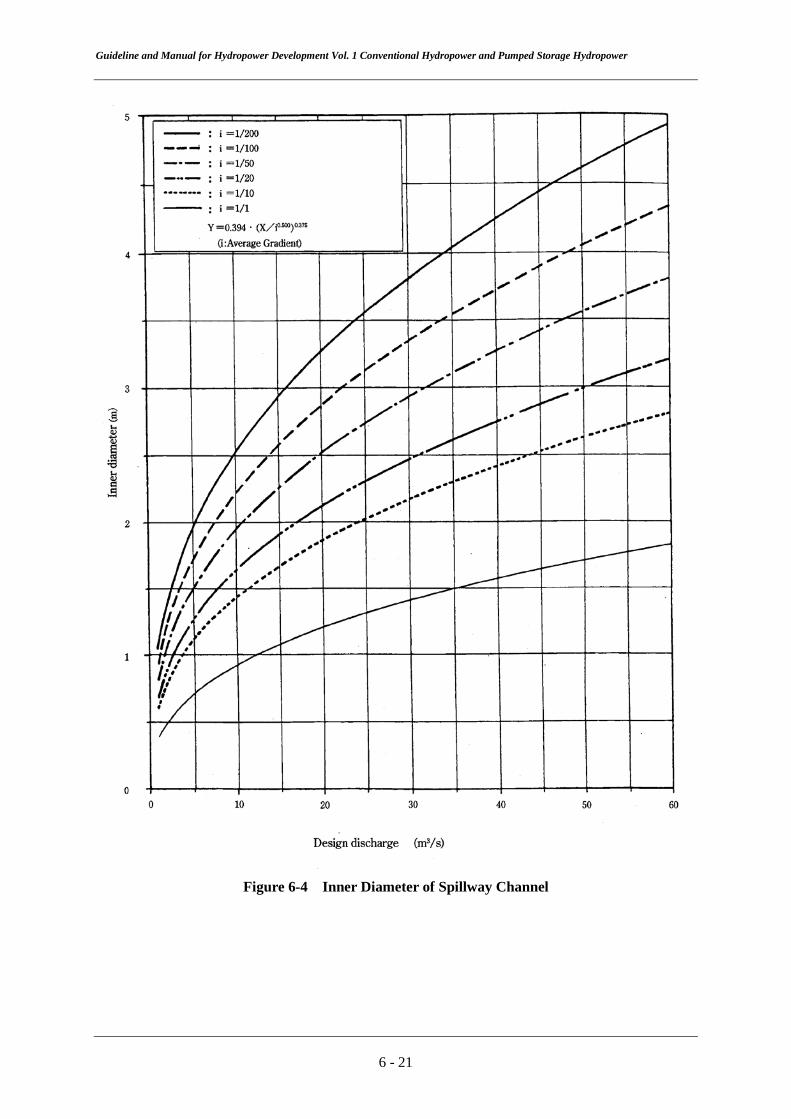
Guideline and Manual for Hydropower Development Vol. 1 Conventional Hydropower and Pumped Storage Hydropower
Figure 6-4 Inner Diameter of Spillway Channel
6 - 21

Guideline and Manual for Hydropower Development Vol. 1 Conventional Hydropower and Pumped Storage Hydropower
6.2.3 Quantities of Work for Pondage Type and Reservoir Type Power Plant
Quantities of work are calculated according to Table 6-5(1) (2).
(1) Dam
Determination of type of dam
In the case of a fill dam, as the spillway construction cost is large, type of dam shouldbe studied including the spillway.
Crest length (L) is calculated in relation to the dam height (Hd) from the contour linesin the map.
Design flood data such as Creager's curve should be used to calculate the design flooddischarge. In case such data are not available in the relevant country, calculation ismade in accordance with 6.2.2 (1).
Excavation volume and dam volume is obtained by the following equations.
1) Rockfill dam
Ve = 10.0×Hd×L
Vf = 1/6×(m+n)×Hd2×(L+2×B)+2W
×Hd×(L+B)
where,
Hd : Dam height (m) L : Dam crest length (m) B : River bed width (m) W : Crest width m : Upstream slope of dam (m=2.0 in this Manual) n : Downstream slope of dam (n=1.8 in this Manual)
2) Concrete gravity dam
In the case : Hd2×L≤100×103
Ve = 10.0×Hd×L Vc = 38.0×(Hd2×L)0.59 (B/L=0.5) Vc = 35.5×(Hd2×L)0.59 (B/L=0.4) Vc = 32.4×(Hd2×L)0.59 (B/L=0.3) Vc = 27.5×(Hd2×L)0.59 (B/L=0.2) Vc = 22.4×(Hd2×L)0.59 (B/L=0.1) Wg = 0.13×Qf
In the case : Hd2×L>100×103 (Ve is same as above)
Vc = 0.34×(Hd2×L) (B/L=0.5) Vc = 0.30×(Hd2×L) (B/L=0.4)
6 - 22

Guideline and Manual for Hydropower Development Vol. 1 Conventional Hydropower and Pumped Storage Hydropower
Vc = 0.27×(Hd2×L) (B/L=0.3) Vc = 0.21×(Hd2×L) (B/L=0.2) Vc = 0.16×(Hd2×L) (B/L=0.1)
where,
B : River bed width (m) L : Crest length (m) Qf : Design flood discharge: See 6.2.2 (1) (m3/sec)
Where the dam height is approximately 10 m, refer to the calculation method for the weir of run-of-river type described in 6.2.2.
Cost of other items of civil works such as grouting and coffering not included in the main items above, is estimated at 10% of the cost of the main items.
(2) Spillway
In the case of a fill type dam, the quantity of work of the spillway is calculated by the design flood discharge described in (1).
The excavation volume, concrete volume, weight of reinforcement bars, and weight of gates are calculated according to the following equations
Ve = 84× Qf ×Hd
Ve = 13× Qf ×Hd
Wr = 0.020×Vc Wg = 0.22×Qf
where,
Qf : Design flood discharge (m3/sec) Hd : Dam height (m)
Cost of other items of works such as grouting not included in the main items described above is estimated at 10% of the cost of the main items.
(3) Intake
A pressure type is adopted in this Manual, and the inner diameter of waterway is obtained from Figure 6-2 by using the maximum plant discharge. The excavation volume, concrete volume, weights of reinforcement bars, gate and screen are calculated by the following equations.
Ve = 130×[{(ha+D)×Q}1/2×n1/3]l.27 Vc = 56.5×[{(ha+D)×Q}1/2×n1/3]1.23 Wr = 0.04×Vc Wg = 0.9×(ha×D)1/9×Q Ws = 0.5×(ha×D)1/9×Q
6 - 23

Guideline and Manual for Hydropower Development Vol. 1 Conventional Hydropower and Pumped Storage Hydropower
where,
ha Available drawdown (m) Q Maximum plant discharge (m3/sec) D Inner diameter of waterway n Number of headrace tunnel
Cost of other items of works such as coffering and trashrack, rake, etc. not included in the main items obtained above is estimated at 20% of the cost of the main items.
(4) Headrace
A circular fully lined pressure tunnel is adopted. The excavation volume of the pressure tunnel, concrete volume, and weight of reinforcement bars are calculated by the following equations.
Ve = 3.2×(R+t0)2×L×n Vc = {3.2×(R+t0)2 − πR2}×L×n Wr = 0.04×Vc
where,
R : Tunnel radius (m) obtained from Figure 6-2 (design discharge = maximum plant discharge/ for one headrace tunnel)
t0 : Lining concrete thickness (m) calculated from Figure 6-5 (Upper line is used when the geology is unknown.)
L : Total length of headrace tunnel (m) n : Number of headrace tunnel
Cost of other items of works such as grouting, adit, etc. not included in the main items stated above is estimated at 15% of the cost of the main items.
Figure 6-5 Relationship Between Inner Diameter of Tunnel and Lining Concrete Thickness
6 - 24
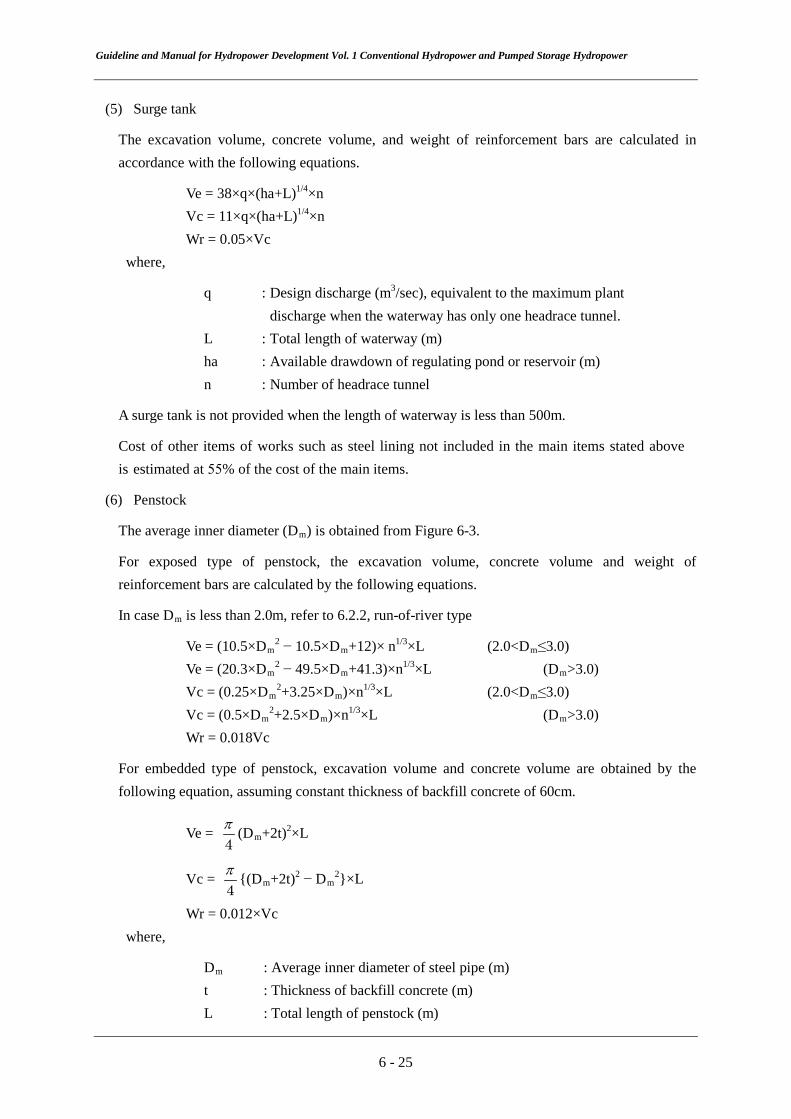
Guideline and Manual for Hydropower Development Vol. 1 Conventional Hydropower and Pumped Storage Hydropower
(5) Surge tank
The excavation volume, concrete volume, and weight of reinforcement bars are calculated in accordance with the following equations.
Ve = 38×q×(ha+L)1/4×n Vc = 11×q×(ha+L)1/4×n Wr = 0.05×Vc
where,
q : Design discharge (m3/sec), equivalent to the maximum plant discharge when the waterway has only one headrace tunnel.
L : Total length of waterway (m) ha : Available drawdown of regulating pond or reservoir (m) n : Number of headrace tunnel
A surge tank is not provided when the length of waterway is less than 500m.
Cost of other items of works such as steel lining not included in the main items stated above is estimated at 55% of the cost of the main items.
(6) Penstock
The average inner diameter (Dm) is obtained from Figure 6-3.
For exposed type of penstock, the excavation volume, concrete volume and weight of reinforcement bars are calculated by the following equations.
In case Dm is less than 2.0m, refer to 6.2.2, run-of-river type
Ve = (10.5×Dm2 − 10.5×Dm+12)× n1/3×L (2.0<Dm≤3.0)
Ve = (20.3×Dm2 − 49.5×Dm+41.3)×n1/3×L (Dm>3.0)
Vc = (0.25×Dm2+3.25×Dm)×n1/3×L (2.0<Dm≤3.0)
Vc = (0.5×Dm2+2.5×Dm)×n1/3×L (Dm>3.0)
Wr = 0.018Vc
For embedded type of penstock, excavation volume and concrete volume are obtained by the following equation, assuming constant thickness of backfill concrete of 60cm.
Ve = 4π (Dm+2t)2×L
Vc = 4π {(Dm+2t)2 − Dm
2}×L
Wr = 0.012×Vc where,
Dm : Average inner diameter of steel pipe (m) t : Thickness of backfill concrete (m) L : Total length of penstock (m)
6 - 25
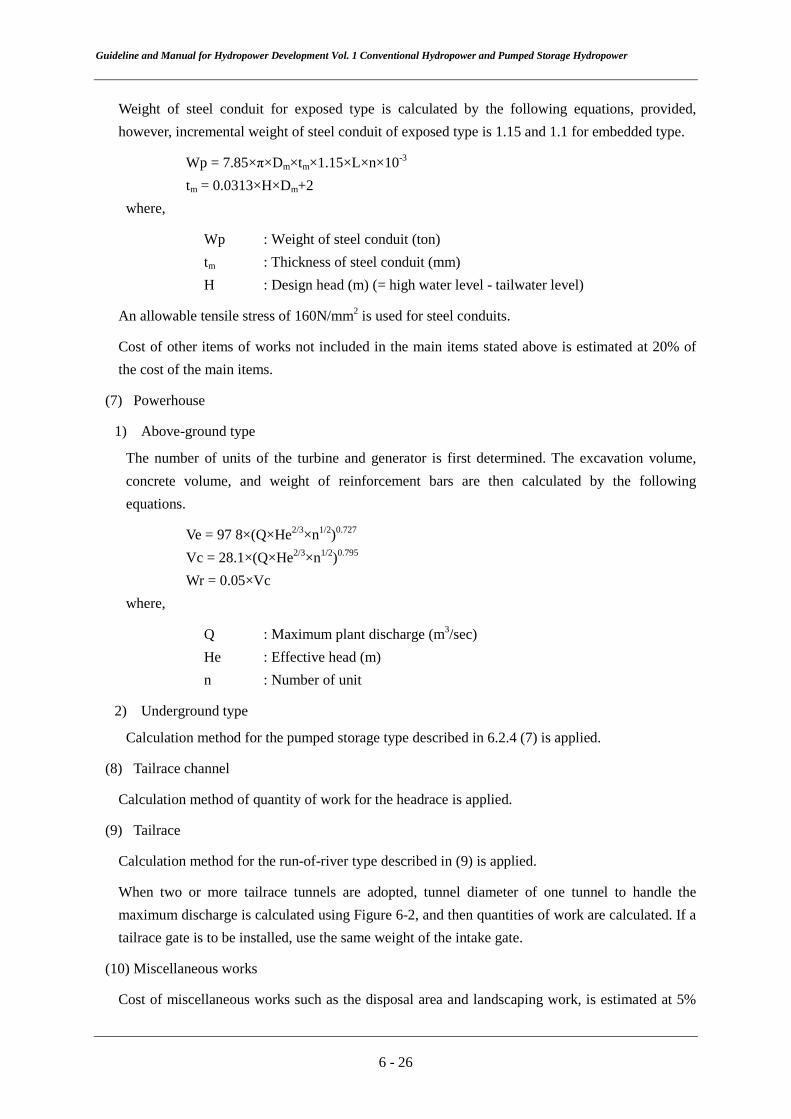
Guideline and Manual for Hydropower Development Vol. 1 Conventional Hydropower and Pumped Storage Hydropower
Weight of steel conduit for exposed type is calculated by the following equations, provided, however, incremental weight of steel conduit of exposed type is 1.15 and 1.1 for embedded type.
Wp = 7.85×π×Dm×tm×1.15×L×n×10-3 tm = 0.0313×H×Dm+2
where,
Wp : Weight of steel conduit (ton) tm : Thickness of steel conduit (mm) H : Design head (m) (= high water level - tailwater level)
An allowable tensile stress of 160N/mm2 is used for steel conduits.
Cost of other items of works not included in the main items stated above is estimated at 20% of the cost of the main items.
(7) Powerhouse
1) Above-ground type
The number of units of the turbine and generator is first determined. The excavation volume, concrete volume, and weight of reinforcement bars are then calculated by the following equations.
Ve = 97 8×(Q×He2/3×n1/2)0.727 Vc = 28.1×(Q×He2/3×n1/2)0.795 Wr = 0.05×Vc
where,
Q : Maximum plant discharge (m3/sec) He : Effective head (m) n : Number of unit
2) Underground type
Calculation method for the pumped storage type described in 6.2.4 (7) is applied.
(8) Tailrace channel
Calculation method of quantity of work for the headrace is applied.
(9) Tailrace
Calculation method for the run-of-river type described in (9) is applied.
When two or more tailrace tunnels are adopted, tunnel diameter of one tunnel to handle the maximum discharge is calculated using Figure 6-2, and then quantities of work are calculated. If a tailrace gate is to be installed, use the same weight of the intake gate.
(10) Miscellaneous works
Cost of miscellaneous works such as the disposal area and landscaping work, is estimated at 5%
6 - 26

Guideline and Manual for Hydropower Development Vol. 1 Conventional Hydropower and Pumped Storage Hydropower
of the total cost of civil works (from (1) through (9)).
6.2.4 Quantities of Work for Pumped Storage Type Power Plant
Quantities of work are calculated according to Table 6-6 (1) and (2).
(1) Dam
Quantities of work are calculated according to 6.2.3 (1), pondage type and reservoir type. However, upper and lower dams are required.
(2) Spillway
Quantities of work are calculated according to 6.2.3 (2), pondage type and reservoir type. However, spillways are required for both the upper and lower dams.
(3) Intake
Quantities of work are calculated according to 6.2.3 (3), pondage type and reservoir type.
(4) Headrace
A circular fully lined pressure tunnel is adopted.
The excavation volume, concrete volume, and weight of reinforcement bars are obtained in accordance with the formula described in 6.2.3 (4) for a flow velocity of 6.0 m/sec in the tunnel.
(5) Surge tank
Quantities of work are calculated according to Section 6.2.3 (5), pondage type and reservoir type.
(6) Penstock
1) Exposed type
Quantities of work are calculated according to Section 6.2.3 (6), pondage type and reservoir type.
2) Embedded type
Quantities of work are calculated according to Section 6.2.3 (6), pondage type and reservoir type. The inner diameter of the steel conduit is obtained for a design discharge based on a velocity of flow in the conduit of constant value of 10 m/sec.
The weight of the steel conduit is obtained by the following equations for embedded type in tunnel.
Wp = 7.85×π×Dm×tm×1.1×L tm = 0.0270H×Dm+ 2
where,
Wp : Weight of steel conduit (ton) tm : Thickness of steel conduit (mm)
6 - 27

Guideline and Manual for Hydropower Development Vol. 1 Conventional Hydropower and Pumped Storage Hydropower
H : Design head (m) (high water level - tailwater level)
An allowable tensile stress of 185N/mm2 is used for the steel conduit.
(7) Powerhouse
1) Above-ground type
Quantities of work are calculated according to Section 6.2.3 (7), pondage type and reservoir type.
2) Underground type
The excavation volume, concrete volume, and weight of reinforcement bars are obtained by the following equations.
Ve=27×A+1.3×A×d Vc=15×A Wr=0.6×A
Provided that,
A=20×Q1/2×He1/3 where,
Q : Maximum plant discharge (m3/sec) He : Effective head (m) A : Area of powerhouse (m2) d : Height of powerhouse (m)
The cost of powerhouse building and transformer chamber is included in 50% of "Others" in Table 6-6 (1).
(8) Tailrace tunnel
Quantities of work are calculated according to the calculation method of headrace.
(9) Tailrace outlet
During pumping operation, the tailrace is an intake; therefore, calculation method of quantity of work for intake is adopted.
(10) Access tunnel to powerhouse
Excavation volume, concrete volume, and weight of reinforcement bars of the access tunnel are obtained by the following equations. The maximum gradient of the access tunnel is 1:10.
Ve = 45×L (m3) Vc = 10×L (m3) Wr = 0.3×Vc (ton)
(11) Miscellaneous Works
Cost of miscellaneous works such as the disposal area and landscaping work is estimated at 5% of
6 - 28

Guideline and Manual for Hydropower Development Vol. 1 Conventional Hydropower and Pumped Storage Hydropower
the total civil work cost.
6.2.5 Transmission Lines
The total length of transmission line is calculated on a straight line between the powerhouse site and the nearest existing transmission line. The capacity of transmission line is determined by the transmission distance and the output of the power plant shown in Figure 6-6. Figure-A is an example of single circuit (S/C) and double circuit (D/C). Figure-B is an example of double circuit, and for a single circuit, 1/2 of the vertical value shown on the figure is used.
Figure 6-6 Capacity of Transmission Line
6 - 29

Guideline and Manual for Hydropower Development Vol. 1 Conventional Hydropower and Pumped Storage Hydropower 6.3 Optimization of the Scale
6.3.1 Economic Analysis (Simplified Method)
The economics of the project is analyzed on the basis of maximum output and energy generation determined in Chapter 5, and the construction cost obtained in Section 6.1 and 6.2.
(1) Methodology of analysis
An economic analysis of a hydropower project is made by a method to compare its benefit (B) and cost (C). The benefit (B) of a hydropower project is the cost of an alternative thermal power that supplies electric power equivalent to the hydropower project and the cost (C) is derived from the construction cost of the hydropower project. In the case B/C≥1.0 (or B−C≥0), the hydropower is economically better than the alternative thermal power while in the case B/C<1.0 (or B−C<0), the hydropower is economically less attractive than the alternative thermal power. It is also possible to judge that a certain hydropower project is economically attractive if the B/C value is outstanding among a number of hydropower projects that are compared. One method to calculate B and C is to calculate the annual costs of thermal power and hydropower (i.e. method by annual expense). Another method to arrive at B and C is to calculate the present values of annual costs of hydropower and thermal power throughout the period of analysis. Yet another method is to use the latter method and calculate the Internal Rate of Return (IRR) applying a discount rate which will give equal present values for both B and C. In this section, the former method, i.e. "Method by Annual Cost" is introduced in a simple manner.
When the latter method is adopted to conduct detailed analysis of individual sites in the reconnaissance study refer to Chapter 16.
(2) Selection of alternative thermal power
The alternative thermal power plants are gas turbine, coal fired, oil fired, liquefied natural gas fired, combined cycle, and diesel power plants. The power source most commonly used in the electric power system is selected as the alternative thermal power.
(3) Benefit and cost of conventional hydropower projects
1) Benefit
Annual benefit (B) of a hydropower project is obtained in accordance with the following formula, based on the fixed cost (mainly the equipment cost) and variable cost (mainly the fuel cost) of the alternative thermal power selected.
B = B1+B2 B1 = PH×b1 B2 = E×b2
where,
B : Annual benefit of hydropower plant (monetary unit)
6 - 30
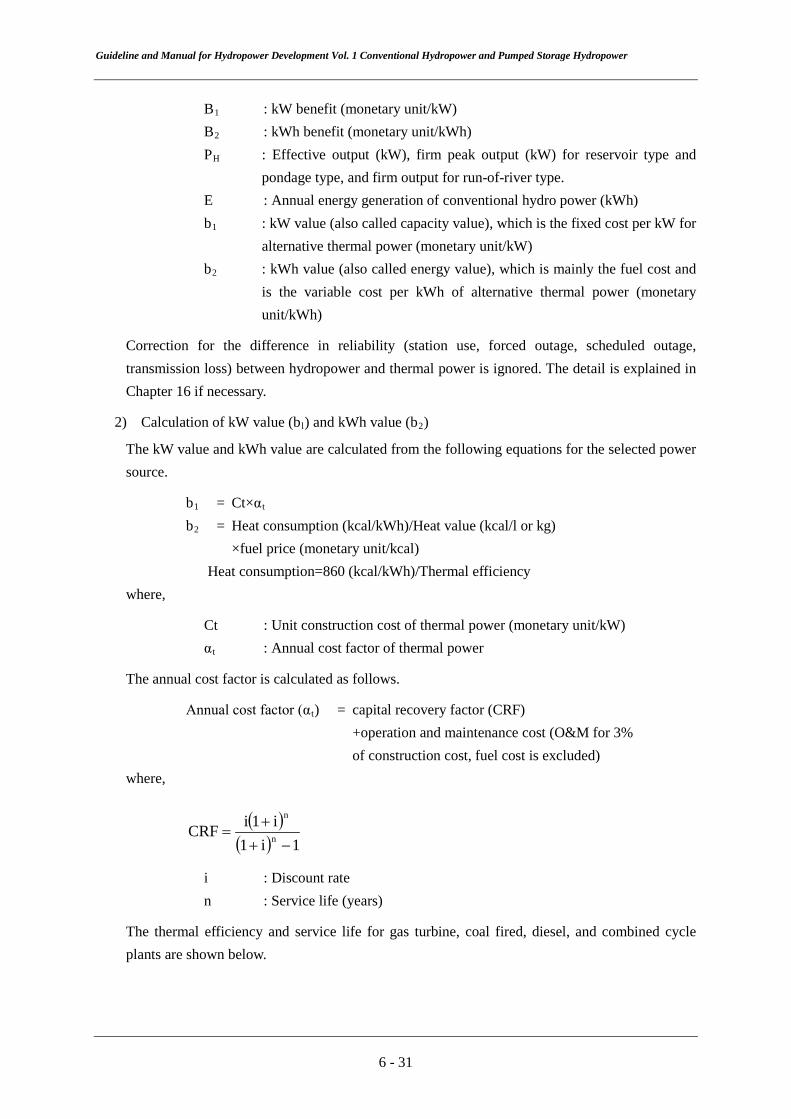
Guideline and Manual for Hydropower Development Vol. 1 Conventional Hydropower and Pumped Storage Hydropower
B1 : kW benefit (monetary unit/kW) B2 : kWh benefit (monetary unit/kWh) PH : Effective output (kW), firm peak output (kW) for reservoir type and
pondage type, and firm output for run-of-river type. E : Annual energy generation of conventional hydro power (kWh) b1 : kW value (also called capacity value), which is the fixed cost per kW for
alternative thermal power (monetary unit/kW) b2 : kWh value (also called energy value), which is mainly the fuel cost and
is the variable cost per kWh of alternative thermal power (monetary unit/kWh)
Correction for the difference in reliability (station use, forced outage, scheduled outage, transmission loss) between hydropower and thermal power is ignored. The detail is explained in Chapter 16 if necessary.
2) Calculation of kW value (bl) and kWh value (b2)
The kW value and kWh value are calculated from the following equations for the selected power source.
b1 = Ct×αt b2 = Heat consumption (kcal/kWh)/Heat value (kcal/l or kg) ×fuel price (monetary unit/kcal) Heat consumption=860 (kcal/kWh)/Thermal efficiency
where,
Ct : Unit construction cost of thermal power (monetary unit/kW) αt : Annual cost factor of thermal power
The annual cost factor is calculated as follows.
Annual cost factor (αt) = capital recovery factor (CRF) +operation and maintenance cost (O&M for 3% of construction cost, fuel cost is excluded)
where,
( )( ) 1i1
i1iCRF n
n
−++
=
i : Discount rate n : Service life (years)
The thermal efficiency and service life for gas turbine, coal fired, diesel, and combined cycle plants are shown below.
6 - 31

Guideline and Manual for Hydropower Development Vol. 1 Conventional Hydropower and Pumped Storage Hydropower
Gas Turbine Coal Fired Combined Cycle Diesel
Thermal efficiency approx. 30% approx. 40% approx. 43% approx. 35%
Service life approx. 20 years
approx. 25 to 30 years
approx. 25 to 30 years
Approx 15 years
3) Calculation of cost
Annual cost of hydro power is derived from the following equation.
C = Ch×αh where,
C : Annual cost (monetary unit) Ch : Construction cost (monetary unit) αh : Annual cost factor (ratio of annual cost to construction cost)
Annual cost factor of hydropower is calculated in the same way as the thermal power. It varies depending on service life of hydropower, O&M cost and discount rate. In the case of 10% of discount rate and 0.1% of O&M cost, the annual cost factor of hydropower is approximately 0.10 to 0.12 in general.
Annual cost factor = capital recovery factor + ratio of O&M cost.
Capital recovery factor =1)1i(
)i1(i50
50
−++
In case that (i) = 10% and ration of O & M cost is 1%, αh=0.1009 + 0.01=0.11.
(4) Benefit and Cost of Pumped Storage Type
1) Benefit
The same methods used for conventional hydropower are applied, however the energy is estimated as follow.
PH : Effective output (kW) E : Annual energy generation (kWh), here it is assumed to be 800 hours
2) Cost
The same concepts used for conventional hydro power apply, but the cost of pumping-up energy is additional.
C=Ch×αp+E×b3 /γ where,
b3 : Pumping energy cost (monetary unit/kWh) αp : Annual cost factor of pumped storage γ : Gross efficiency (= generated energy/pumping-up energy)
6 - 32

Guideline and Manual for Hydropower Development Vol. 1 Conventional Hydropower and Pumped Storage Hydropower
Energy losses arise at the waterway and turbine during pumping and generation of pumped storage power plants. Ratio of generated energy (output) to pumping energy (input) is defined as "Gross efficiency of pumped storage power plant", and the ratio is generally about 70%. Since pumped storage power plants use the excess energy of thermal power plants such as coal fired, etc for base and/or middle load supply for pumping. Pumping energy cost is calculated based on fuel cost of such thermal power plants.
6.3.2 Unit Construction Cost Method
More easy methods are described as follows.
(1) Conventional type
In the case of run-of–river type, kWh benefit is much larger than kW benefit, therefore only kWh is weighed heavily and "construction cost per kWh" can be used for economic evaluation.
Construction cost per kWh (monetary unit/kWh) =(kWh) generationenergy Annual
unit)(monetary cost on Constructi
(2) Pumped storage type
In the case of pumped storage type, kW benefit is much larger than kWh benefit, therefore only kW is weighed heavily and "construction cost per kW" can be used for economic evaluation.
Construction cost per kW (monetary unit/kW) ( )
(kW)output Maxmumunitmonetary cost on Constructi
=
6.4 Optimization Study
(1) Optimization study
Scale of development is determined from maximum plant discharge and the effective head, therefore, comparative studies should be conducted by applying different parameters. The following are often examined for prospective projects in a reconnaissance study.
1) Run-of-river type
Alternative plans with different locations of intake weir and powerhouse (study of waterway route)
Alternative plans with different values of maximum plant discharge
There are cases where diversion of water from neighboring river or tributary is studied.
2) Reservoir type and pondage type
Alternative plans with different dam and powerhouse sites (study of waterway route)
Alternative plans with different dam heights (reservoir type only)
6 - 33

Guideline and Manual for Hydropower Development Vol. 1 Conventional Hydropower and Pumped Storage Hydropower
Alternative plans with different maximum plant discharge values
3) Pumped storage type
Alternative plans with different dam and powerhouse sites (study of waterway route)
(3) Optimization method
The optimum scale of development is a plan that gives the maximum value of B/C or B−C. A plan of development that gives the maximum B/C value is deemed the optimum plan when the emphasis is efficiency of capital investment. The plan of development that gives the maximum B−C value is deemed the optimum plan when emphasis is effective use of resources. Figure 6-7 and Figure 6-8 are examples to adopt the former criteria.
Since the kW benefit is small in the case of a run-of-river type, in many cases a plan with the maximum B/C value and a plan with a minimum construction cost per kW are identical. For convenience’ sake, therefore, the plan with the minimum construction cost per kWh is deemed the optimum plan.
Figure 6-7 shows an example of optimization study of run-of-river type power development. In the study 3.0m3/sec is concluded as being optimum.
In the study of the reservoir type, as shown in Figure 6-8, comparison of three waterway routes, i.e. Route A, B and C is made with Route B being selected as the optimum as it provides the maximum B/C value. The alternative with Maximum plant discharge of Q2 and dam height of option 1 is selected for Route B.
Figure 6-7 Determination of Optimum Scale of Development (Run-of-River Type)
6 - 34

Guideline and Manual for Hydropower Development Vol. 1 Conventional Hydropower and Pumped Storage Hydropower
Figure 6-8 Determination of Optimum Scale of Development (Reservoir Type)
6 - 35

Guideline and Manual for Hydropower Development Vol. 1 Conventional Hydropower and Pumped Storage Hydropower Reference of Chapter 6 [1] Guide Manual for Development Aid Programs and Studies of Hydroelectric Power Projects,
New Energy Foundation, 1996
6 - 36

Chapter 7 Application of Reconnaissance Study Method

Guideline and Manual for Hydropower Development Vol. 1 Conventional Hydropower and Pumped Storage Hydropower Chapter 7 Application of Reconnaissance Study Method
7.1 Application for Study of Individual Projects
In advancing the investigation and study of hydropower projects, the general method is to upgrade the quality of the work gradually considering the work and cost efficiency. The reconnaissance study method mentioned in Chapter 5 and 6 is useful for an initial study of projects because existing information such as 1/50,000 maps and runoff records can be utilized without sizable budget.
Project characteristics can be grasped roughly from the reconnaissance study by comparing alternatives changing the sites of dam and powerhouse, dam height, waterway route and maximum plant discharge, etc.
The study results of the individual projects can be reflected to the feasibility study of the individual project, hydropower potential study and development master plan.
7.2 Application for Hydropower Potential Study
Hydropower potential is defined as the amount of potential energy existing in a river or a certain area. A hydropower potential survey is carried out from the following view points.
To utilize the water head existing in a river as much as possible in consideration of the present
technical and economic level of hydropower.
To determine generation types (reservoir type, runoff- river-type and pondage type) judging
from topography and river flow conditions.
To select the appropriate dam site where river flow is stored and utilized as much as possible.
The reconnaissance study method is used to carry out planning and investigation of many projects. The result is tabulated with project name, maximum output, generated energy, economic factor, environmental and other important matters. Development priority is put for all projects, and prospective project is selected for pre-feasibility and/or feasibility study.
7.3 Application for Master Plan Study
7.3.1 Conventional Hydropower
(1) Identification of core projects of the basin development
A master plan study is carried out for the river basin development of relatively large drainage area having many hydropower projects. It has the following main purposes.
To plan possible projects and grasp the overall feature of basin development
To find core projects which play the most important role for the entire basin development
7 - 1

Guideline and Manual for Hydropower Development Vol. 1 Conventional Hydropower and Pumped Storage Hydropower
To figure out the development priority of projects in order to develop the hydropower resources most efficiently
Core projects are determined by judging from a view points of project scale (output), economic viability, natural and social environment, access road, transmission lines etc. In case core projects are developed in an early stage, they should bear a large portion of the costs of transmission line and access road. Consequently the other projects with low development priority have chance to bedeveloped because they can reduce bearing the costs.
Although 1/50,000 scale map is used for the master plan study, more detailed map such as 1/5,000 or 1/10,000 scale can be used for prosperous projects.
In case there are very few projects in the basin, a study on individual project mentioned in 7.1 iscarried out without conducting the master plan study.
(2) Development of mainstream and tributaries
Figure7-1 shows a schematic of a basin development. “Main river development (MD)” means that a large dam is constructed for hydropower plants along the main river. “Tributary development (TD)” means that several dams are constructed mainly in the tributaries and a large dam is not constructed at a main river. Figure7-1 shows the figure focusing on tributaries at left bank of the main river, and those at right bank are left out from the figure.
Compared with the MD plan and the TD plan which has almost same runoff regulating effect and water head as the MD has, the MD plan might be more economical than the TD plan in case a high dam of MD can be constructed with low construction cost, because river runoff gathers to the main river. However MD plan might have defects of vast inundated reservoir area, resettlement of villagers, change in ecosystem, sedimentation, etc.
A comparison study among the MD plan, TD plan and their mixed plan should be considered for the master plan study.
Figure 7-1 Schematic Figure of Mainstream’s Developments and Tributary’s Development
7 - 2

Guideline and Manual for Hydropower Development Vol. 1 Conventional Hydropower and Pumped Storage Hydropower
(3) Example of basin development master plan
An example of the master plan is shown in Figure 7-2 where five projects are selected as development potential. The most promising project “A” is found and identified as a core project for basin development.
Project E
Project D
Project B
Project A
Project C
SeaProject E
Project D
Project B
Project A
Project C
Sea
Figure 7-2 Example of Master Plan of Basin Development
7.3.2 Master Plan Study on Pumped Storage Hydropower
A master plan study of pumped storage projects is different from that of conventional hydropower projects. Power supply area and thermal & nuclear power plants are roughly specified firstly, andthen possible candidate project sites are found by map and be listed as shown in Figure 7-3.
7 - 3

Guideline and Manual for Hydropower Development Vol. 1 Conventional Hydropower and Pumped Storage Hydropower
Figure 7-3 Candidate Projects for Pumped Storage Projects
Investigation is carried out from following points.
Head of more the 400m is available and serious geological problems for civil structures cannot be observed
It is located relatively close to the area of demand
It is located close to the existing or planned transmission line connecting between the power demand areas and sites of large scale thermal power plants.
The transmission line has enough capacity to send generated power by the project and to receive pumping energy for the proposed projects
Environmental problem is less, and access condition is good
The project site is selected by using 1:50,000 scale map and “L/H value” explained below. In the case a site has head of more than 400m and L/H of less than about 6, the site might be worth to study.
L/H where,
H : horizontal distance between upper dam site and lower dam site L : Height difference between upper dam site and lower dam site
Project finding is conducted by the above mentioned procedure.
Demand area
Pumped storage A
Pumped storage B
Pumped storage C
Pumped storage D
Pumped storage E
Thermal Power Plant Nuclear Power Plant Transmission line
7 - 4

COMPUTATIOAL FEASIBILITY OF LOG TERM
COTIUOUS SIMULATIO
Dr A.G. Barnett1
1HYDRA Software Ltd, PO Box 9463, Hamilton, New Zealand www.auloshydraulics.com
Abstract Infrastructure planning increasingly relies on projections of future conditions, usually modified by factors
such as climate change as well as a range of development scenarios. Design criteria are often expressed in
terms of event return periods, and long term hydraulic simulation can determine which events will prove to
be critical. However wider adoption of this technology depends on overcoming uncertain solution reliability,
and improved treatment of overfalls, floodplain corrections and sudden boundary changes is discussed. Run
times and data analysis have previously added further logistical constraints, but acceptable model
performance is now demonstrated to be practical.
Key words : Continuous simulation, solution reliability, overfalls, floodplains, hydraulic computation
1 COTEXT Estimation of the long term statistical probability (or return period) of extreme events is contentious where
conditions governing those events are subject to infrastructure changes related to economic development.
Typically significant hydraulic examples are
(a) Flood events, which are modified by factors such as projected climate change, progressive
urbanisation or flood control schemes
(b) Electricity shortages, which are modified by factors such as construction of new hydropower
schemes, expanded storage and retirement of obsolescent generation capacity.
Long term continuous simulation is attractive for hydraulic systems, as in principle this is able to retain the
historical natural variation in systems input (usually weather related, especially rainfall) while incorporating
a deterministic interpretation of various projections of climate and infrastructure changes. The statistical
probability of natural events then remains the same, but their severity of outcome may be aggravated or
mitigated by the projected scenarios. Hence their ranking relative to other events may change, with important
planning consequences.
Given the advantages of a capability to separate probabilistic and deterministic aspects of planning
projections, the obvious question arises “Why is long term simulation not more widely used?” The answer is
the considerable remaining practical difficulty of aspects of long term simulation technology, and this paper
explores solutions to some of the problems.
2 SOLUTIO RELIABILITY The term “solution reliability” is introduced, meaning the ability of a computational algorithm to survive all
possible failure mechanisms, alone or in combination, and to complete any solution assignment, in all but
exceptional circumstances.
For long term simulation, conditions must be changing with time, usually in some nonlinear way, which
immediately introduces the need for a time stepping solution. This must be linear in structure if it is using
matrix solution analysis. Where flow problems are quasilinear, meaning changes in the variables will also
cause changes in the coefficients multiplying the variables, a generally acceptable approach is to treat the
coefficients as constant to calculate a locally linear solution over a single time step. The process is then
repeated, updating the linear coefficients every time step. The difficulty with this procedure is that, while it
may demonstrably work under a wide range of trial conditions, this can never guarantee that some tiny
loopholes in the solution domain cannot exist, through which in exceptional cases the coefficients may
change at an unstable rate, causing solution failure.
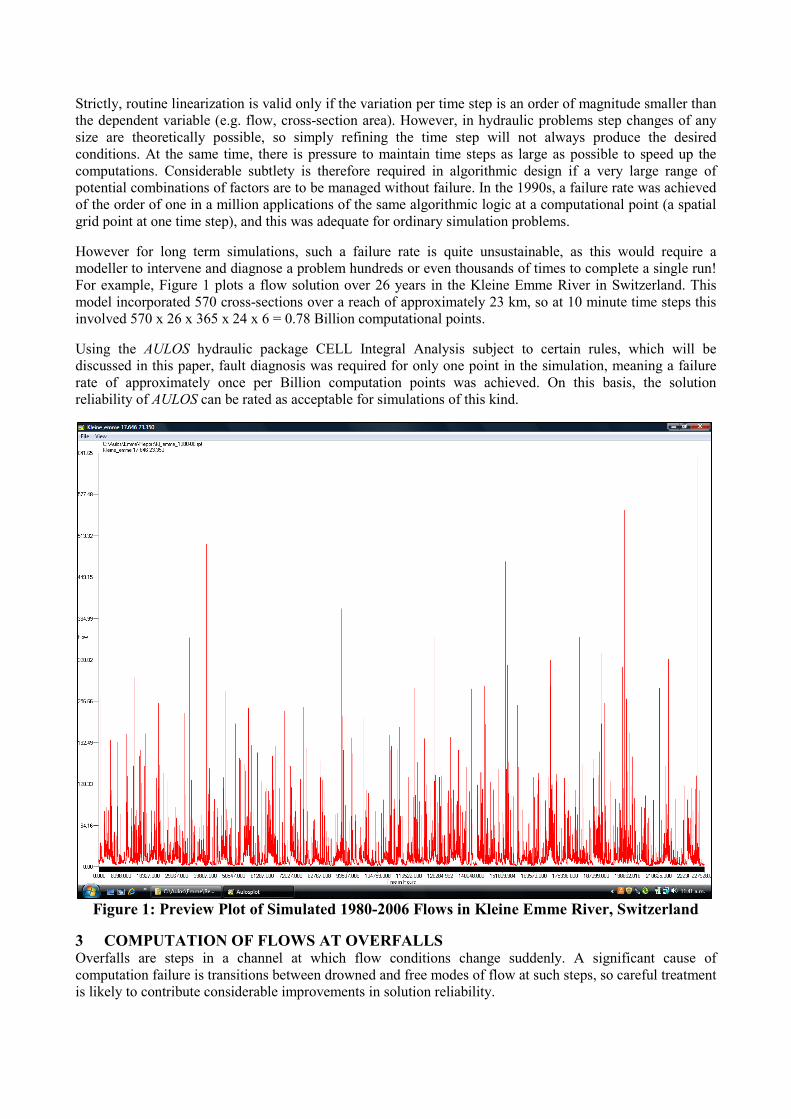
Strictly, routine linearization is valid only if the variation per time step is an order of magnitude smaller than
the dependent variable (e.g. flow, cross-section area). However, in hydraulic problems step changes of any
size are theoretically possible, so simply refining the time step will not always produce the desired
conditions. At the same time, there is pressure to maintain time steps as large as possible to speed up the
computations. Considerable subtlety is therefore required in algorithmic design if a very large range of
potential combinations of factors are to be managed without failure. In the 1990s, a failure rate was achieved
of the order of one in a million applications of the same algorithmic logic at a computational point (a spatial
grid point at one time step), and this was adequate for ordinary simulation problems.
However for long term simulations, such a failure rate is quite unsustainable, as this would require a
modeller to intervene and diagnose a problem hundreds or even thousands of times to complete a single run!
For example, Figure 1 plots a flow solution over 26 years in the Kleine Emme River in Switzerland. This
model incorporated 570 cross-sections over a reach of approximately 23 km, so at 10 minute time steps this
involved 570 x 26 x 365 x 24 x 6 = 0.78 Billion computational points.
Using the AULOS hydraulic package CELL Integral Analysis subject to certain rules, which will be
discussed in this paper, fault diagnosis was required for only one point in the simulation, meaning a failure
rate of approximately once per Billion computation points was achieved. On this basis, the solution
reliability of AULOS can be rated as acceptable for simulations of this kind.
Figure 1: Preview Plot of Simulated 1980-2006 Flows in Kleine Emme River, Switzerland
3 COMPUTATIO OF FLOWS AT OVERFALLS Overfalls are steps in a channel at which flow conditions change suddenly. A significant cause of
computation failure is transitions between drowned and free modes of flow at such steps, so careful treatment
is likely to contribute considerable improvements in solution reliability.

3.1 Overfalls vs Weirs AULOS distinguishes between overfalls and weirs in computational treatment. For this purpose, overfalls
(see Figure 2) are defined as points of sudden downstream steepening in channel slope to a gradient greater
than critical slope, while weirs (see Figure 3) are defined as transition points between a reach of negative
channel slope and a downstream gradient greater than critical slope. Both overfalls and weirs may be
drowned from downstream by raised water levels, such as those created by a dam.
As a useful rule of thumb, “critical slope” is a bed slope of approximately 1% in typical channels, although
the exact value must be computed for general channel models, as it depends on the cross-section shape and
its variation along the channel, as well as the various roughness settings across the channel.
3.2 Sample Profile Plots Figures 2 and 3 are both profile plots derived from an AULOS solution of flows through two adjacent reaches
of the river Kleine Emme, specifically at 1pm on 9 September 2005. This solution time was chosen for
illustration as the flow was then very high for the river (about 400 cumecs), but only slowly varying
timewise so the solution could be expected to be quasi-steady as usually assumed for longitudinal profile
analysis.
442
444
446
448
450
452
454
456
19.8 19.85 19.9 19.95 20 20.05 20.1 20.15
Lev
els
(m
)
Channel Distance (km)
Overfall Profile
Water Level
Total Energy Head
Bed Invert
Figure 2. A typical overfall profile as computed by AULOS
3.3 Practicalities of Modelling Overfalls AULOS users make the initial choice between overfalls and weirs, as any change in gradient is treated as an
overfall if not marked explicitly as a weir. This is because the standard AULOS energy or momentum
balance cell integral is applied unchanged to an overfall, modified only by the automatic solution protection
features based on Froude Number. There is no difference in treatment between the downstream supercritical
side of an overfall and a prismatic supercritical reach, as in both cases stability theory shows that an exact
solution of the theoretical energy/momentum balance cannot be stable above a certain criterion [1].
Since any zones of solution instability practically rule out a successful long time series solution, there is no
alternative but to introduce local stabilising measures (in AULOS these are implemented automatically

through the Accuracy Bias). The energy/momentum balances will then continue to be exact only in the non-
stabilised reaches, but there is no alternative if stable solutions are to be obtained.
The effect of this is observable in Figure 2, where the solution behaves correctly upstream and downstream
of the overfall, but there is a localised gain and loss in total energy head across the overfall itself. A gain in
total energy head clearly violates the conventional expectations of an energy balance, but this can be
understood as reflecting a localised overestimate of velocity and hence velocity head. The mass balance still
applies, so such an overestimate of velocity must coincide with an underestimate of water level so that the
correct flow passes the section. Note the hydraulic grade line is locally lowered by this effect, but in
supercritical flow the corresponding energy head still increases.
429
430
431
432
433
434
435
436
22.8 22.85 22.9 22.95 23 23.05 23.1
Lev
els
(m
)
Channel Distance (km)
Weir Profile
Water Level
Total Energy Head
Bed Invert
Figure 3. A typical weir profile as computed by AULOS.
3.4 Practicalities of Modelling Weirs Any section marked by the user as a weir is initially checked at run time, after the RUN instruction is issued
and before the actual model run proceeds. For a weir to be installed in the AULOS model, the flow through
the next section upstream must be actually subcritical at all flow values anticipated during the model run, not
merely at the initial flow through the reach. Only then can the transition from subcritical flow upstream to
supercritical flow downstream be expected to happen reliably throughout model runs, so that critical flow
can be assumed at the weir itself (unless the weir is drowned by downstream effects, but this condition can
be tested at each time step of the solution).
If a weir solution is found not to be possible at any section marked as a weir, an error message advises the
user, who can consider whether the lack of satisfaction of weir conditions is caused by a poor choice of weir
site, or by a mistake in the channel bed levels supplied to the model in the vicinity.
In Figure 3, a weir site at 23.047 km would be expected to be suitable because of the local rise in bed level
there, and indeed the AULOS checks confirmed the acceptability of the proposed site.
Because of this, an exact solution is available right down to the weir site, with no evidence of an unphysical
energy gain in Figure 3. Downstream of the weir crest, the energy/momentum integral balance solution is
suspended for the adjacent computational cell, as (except where the weir is drowned) flow conditions are

supposed to be governed from downstream except for a mass balance equation. This allows the solution to be
virtually independent of the drop downstream of the weir, as would be expected for flow through a pond at
the bottom of a waterfall.
If the weir conditions are unable to be satisfied even when all bed data has been thoroughly checked for
correctness, the user will not be able to proceed with model runs without removing the weir identifier from
the relevant section, allowing the computational model to revert to an overfall.
3.5 Discussion Stability theory has established that a computational solution for high velocity flows cannot be both exact
and stable. Stabilisation measures are therefore essential for any solution algorithm if long term simulation is
to be achieved. The stabilisation method used in AULOS is successful (as evidenced by a range of completed
long term simulations) and the resulting inaccuracies are localised to the immediate vicinity of the overfall
crests.
These effects are mainly apparent as small overestimates of velocity. For applications such as sediment
transport, such local overestimates will have negligible effects, as overfall crests can be expected to be swept
clear of sediment even with accurate velocity estimates, so no further transport would be triggered by the
velocity excess.
4 FLOODPLAI CORRECTIO Channel cross-section shape is one possible source of computational unreliability, as it is known [2] that a
distinct change in flow pattern typically accompanies the transition from inbank to overbank flow, and
attempts to model this effect may result in significant disturbances to the solution.
4.1 Conveyance Concepts Conveyance analysis makes a distinction between factors driving flow as balanced by the friction slope Sf,
and factors affecting channel flow capacity, represented by the conveyance K. This is standard textbook
material [3], using the channel flow Q to define
K = Q/Sf1/2
(1)
4.2 The Manning Formula The Manning formula for conveyance is then
n
MARKM
32
= (2)
where M is a dimensioned constant (=1.00m1/3
s-1). A, R and n are respectively the area, hydraulic radius and
Manning n roughness of the section. R is usually defined as A/P, where P is the wetted perimeter, so KM is
expressed fully in terms of section properties.
This formula was developed using data from channels with simple concave cross-sections with fairly
homogeneous bed roughness, and has been found over many years to be satisfactory for such channels.
However a compound (multichannel) section may incorporate a range of shapes and roughnesses outside the
low flow channel. Further, as the bankfull stage of a channel is exceeded and there is an overflow into the
floodplains, the Manning formula will predict an unrealistic sudden major reduction of conveyance when the
wetted perimeter increases greatly with little increase in cross-section area, because R is sharply reduced.
Apart from the question of physical reality, this computational discontinuity introduces unreliability of the
solution, making long term simulation impractical. Ways are therefore needed to adjust the Manning formula
to correct for these factors.

4.3 Lotter Conveyance In a compound section, different values of n may be associated with subdivisions of A. If a flow Qi is passing
through the ith subsection, the objective is then to relate that part of the total section flow to Sf by means of
local conveyance and Manning expressions attributed to Lotter [3]
21
fii SKQ = i
iii
n
RMAK
32
=
Here Ki is the ith subsection subconveyance, but if Ai and ni are known, somehow Ri must be defined in such
a way that both of the above two expressions will be true.
The textbook approach [4] defines the subsection Ri values as Ai/Pi, where Pi is the subsection wetted
perimeter, excluding all subsection perimeter lengths which pass through the fluid, and are therefore shared
with another subsection. This has the merit of being locally consistent with the Manning definition of
hydraulic radius, so using this interpretation of Ri a Lotter total conveyance KL can be defined as
∑=
=�
i
iL KK1
(3)
where � is the number of subsections.
Knight and Shamseldin (2006) noted that, in experiments under overbank flow conditions, the actual
discharge is always less than the discharge obtained by summing the subsection discharges found by the
Lotter approach (Qzones) and greater than the whole discharge obtained by treating the channel as a single unit
(Qsingle), that is
Q Q Qgle actual zonessin ≤ ≤
4.4 The Coherence Method Coherence can be defined as the ratio of the conveyance calculated obtained by treating the channel as a
single cross-section to that obtained by treating by summing the conveyances of the separate flow zones [5].
Ideally the coherence should always be unity, because the sum of the subsection flows should be the same as
the whole section flow Q. Therefore departures from unity of the coherence represent inaccuracy of one or
both of the calculations of conveyance and hence of flow Q.
In present terminology, therefore, the Ackers definition of coherence is
∑∑==
==�
i
i
�
i
i Q
Q
K
KCOH
11
(4)
Note this definition uses only Equation (1) and its Lotter subsection equivalent, so it is not restricted to the
Manning formula.
Using the Manning formula and the Henderson-Lotter local conveyance model, Equation (4) then becomes
COH = KM/KL (5)

4.5 Coherence-based Model The reported experimental results show the desired conveyance model is to fall between KM and KL, while
remaining close to KL at low values of overbank floodplain flow. Appeal to subsection area weighting [6]
then suggests the following model:
F
FC
FMFCC
A KAA
KKAKAK +
+
−+=
)( (6)
Here KA is the adjusted total conveyance, while the subscripts C and F refer to the (main) channel and
floodplain respectively, noting that the floodplain may be the sum of floodplains on each side of the channel.
This model has been validated against tests carried out by the UK Flood Channel Facility (FCF) as described
in [6]. Figure 4 presents the conveyance results for FCF Test 02.
0
0.1
0.2
0.3
0.4
0.5
0.6
0.7
0.8
0.9
0.85 0.9 0.95 1
Re
lati
ve
De
pth
Conveyance Ratio
FCF Test 02 Conveyance Comparisons
Ka/Kl
Km/Kl=COHm
FCF Results
AULOS
Figure 4. Conveyance Comparisons for Test 02
The FCF results (small circles) are plotted against “Relative Depth” as the vertical axis, in which the value
zero is the level at which the main channel flow suddenly overflows to the floodplain, while the horizontal
axis “Conveyance Ratio” is effectively the measured discharge divided by the discharge obtained using
Equations (1) and (3).
The Coherence is plotted as a dashed line, while the curve formed by KA/KL is then added as a solid line,
where KA is defined in Equation (6). Finally the values of Conveyance Ratio computed from a Coherence-
based AULOS model of the FCF are plotted for the given test FCF levels. The small differences between the
AULOS results and the theoretical curve arise from the practicalities of evaluating conveyances as described
in Section 4.6. In Figure 4 this tends to bias the AULOS results further away from the FCF results, but this is
not always so.

4.6 Reliability of the Coherence-based Model For a general-purpose compound channel model, an unlimited number of channel subdivisions must be
available rather than the more limited floodplain-channel-floodplain model envisaged by Coherence analysis.
Further, the choice between compound-channel (modified Henderson-Lotter) and simple-channel (Manning)
models may already have been made by the model user, for example by specifying different resistance
factors in different channel subsections across the section. These can be applied only by using a compound-
channel model.
The AULOS implementation therefore approaches the definition of “channel” and “floodplain” in the
proposed model by testing each cross-section for a decrease in total conveyance with increase in depth, as
this is the key factor which may cause solution instability. If such a decrease occurs, the occurrence at the
lowest depth is taken to define the “channel”, with the first and last wetted channel edges at that depth
defining the boundaries between the “channel” and the two “floodplains”. In principle then, both the
“channel” and the two “floodplains” may comprise many subsections. However the subconveyances from
each can be summed, so there is no problem in adjusting the total conveyance using Equation (6).
Another practicality is creating efficient code, as even with current computing hardware, multiple
recomputations of conveyance adjustments can be time-consuming in a large model, especially in long term
simulations. This is solved by tabulating the cross-section functions, including adjusted conveyance, once
only at the beginning of a model run. These tabulations then allow all cross-section parameters to be
interpolated for each section as functions of water level at all other times in the model run.
As can be seen by inspection of Figure 4, the resulting implementation successfully reproduces the transition
between inbank and overbank flow as measured at the FCF, but unavoidably this may still involve a
significant flow reduction at the overflow point, and the potential for the same discharge to occur at different
water levels at the same cross-section. Some solution unreliability can therefore be expected.
On the basis of numerical experiments, introduction of the Coherence-based method greatly improves
solution reliability compared with the use of the Manning formula unmodified for overbank flows, but
solution failures are still an order of magnitude more common than with the use of the highly tractable Lotter
method. Unfortunately this extra reliability therefore comes at some cost in reduced solution accuracy.
5 BOUDARY CODITIOS Matrix inversion methods are conventionally applied to implicit solutions to find the numerical solution.
However this requires that the nonlinear hydraulic equations can be accurately approximated by linearised
versions with a lifetime of at least one time step.
For example, an energy loss term is conventionally written as g
v
2
2
ε , or more generally g
vv
2ε , allowing for
flow reversals, as the loss applies in the same sense as the velocity v. Here g is the acceleration of gravity.
For a contraction, ε is a constant of the order of 0.1 according to standard texts (e.g. [4]). This energy loss
term is quadratic in v and for a time stepping solution is to be expressed as the weighted sum
[ ] [ ])''(2
)1(''2
vvvvvvg
vvvvg
−+=−+ θε
θθε
Here v’ is the velocity at the end of the time step, v that at the beginning of the time step, and θ is the forward
time weighting coefficient chosen for the computational scheme. Assuming that flow Q and cross-sectional
area A have been chosen as the two dependent variables to be linearised, we can write v = Q/A etc. to get
−=−
−+=−=−
∗∗∗∗
A
A
Q
Q
A
Q
A
A
A
Q
Q
A
A
A
QQvvvv
22222221
'
'
''''

Here we have assumed that '' QQQQ = (true except at flow reversals, where these products and the
corresponding loss terms should be small).
We have also introduced the variations ∗
Q = Q’ – Q, ∗
A = A’ – A and neglected products of relative
variations in order to linearise the equations for solution.
This rested on the reasonable assumptions that the relative variations ∗
Q /Q << 1, ∗
A /A << 1, but these are not
universally true where flows may start suddenly from dry beds. In such circumstances occasional failure of
these linearisations should not therefore cause surprise.
However, from experience the solutions usually survive and recover quickly as long as ∗
Q /Q < 10 at the
solution boundary conditions. These should therefore be checked in advance for such occurrences, and
smoothed if possible, especially if this extreme change (i.e. the boundary flow suddenly multiplying by some
ten times within one computational time step) appears to have resulted from an input error by the model user.
If the specified extreme input change is correct, and critical to the outcome of the simulation,
experimentation with a reduction in time step may be expected to reduce the magnitude of the variations,
improving the chances of a successful solution.
In the Kleine Emme example, boundary flow variation was extreme, with a maximum/minimum ratio being
of the order of 1000:1, but the full simulation was still found to be feasible at practical time steps.
6 RU TIMES For multi-year runs, computation times can become prohibitively long, especially when a range of alternative
scenarios is to be modelled over the full period. In a modern office, individual scenario runs should be kept
under 1 hour on standard desktop computing equipment for assessment of a useful range of scenarios to be
feasible, so a computation speed of around 1 model year/minute is desirable.
This is now becoming practical, as the 26 year AULOS model run discussed above took about 45 minutes on
a 3 GHz laptop, and many models will be smaller than 570 cross-sections.
Also run times can be further reduced by the application of variable time steps, so that uneventful periods
can be simulated using time steps of hours rather than minutes.
7 DATA AALYSIS COSTRAITS Long term simulations produce very large result files – the Kleine Emme example saved results only every
hour, but even so the file grew to over 1 GByte, with 225,096 hourly results. Windows utilities will cut and
paste files of this size, but use of standard spreadsheets for plotting is not yet possible with hundreds of
thousands of rows. The earlier Windows Excel had a limit of 65,536 rows, while the extended 2007 Excel
accepts larger time series, but appears unable to produce plots from more than 32,000 rows.
AULOS Preview successfully plotted the full range of results, and was used to prepare Figure 1. The Golden
Software Grapher package was also tested, and successfully produced plots of the full time series.
8 SUMMARY Long term simulation provides significant advantages, in that the effect of infrastructure changes can be
incorporated without statistical distortion in the probability estimation of design criteria. However wider
adoption of the technology is being impeded by computational problems with overfalls, floodplain
corrections and sudden boundary changes, as well as logistical constraints with run times and data analysis.
These problems have been discussed in the context of an example based on long term simulation of the
Kleine Emme River in Switzerland. This is a steep river with a testing range of longitudinal drops, cross-
section shapes, and flow variability of the order of 1000:1 from maximum to minimum at any given point.

Successful strategies to improve solution reliability have been demonstrated as follows:
(a) For longitudinal drops, distinction between overfalls and weirs is important, and the continued
existence of weir behaviour at all flows should be established in advance of a run.
(b) The simple Manning formula is likely to generate difficulties where channel flow goes overbank if
there are significant floodplains. The widely used Lotter formula is a computationally reliable
correction, but at some expense in accuracy at sections where in reality the floodplain effect initially
reduces the combined conveyance below the bankfull channel conveyance.
(c) Boundary conditions should be checked in advance to ensure that nowhere does the flow suddenly
multiply by some ten times in one time step.
Using these strategies, the solution failure rate has been reduced to the order of once per Billion computation
points, run times of the order of 1 model year/minute of computation are achievable on ordinary office
computers, and result data analysis is now practical for decades of simulation.
ACKOWLEDGEMETS The Kleine Emme model was developed as part of a joint study with Hunziker, Zarn & Partner AG, Aarau,
Switzerland, www.hzp.ch
REFERECES [1] Barnett, A.G., 2009 : (Discussion [in Press] of) Nonlinear effects in the propagation properties of
numerical schemes employed in computational hydraulics and computational hydrology by Alvaro A.
Aldama J. Hydr. Res. Volume 46, Extra Issue 1 (2008), pp. 3-10
[2] Knight, D.W., and Shamseldin, A.Y., 2006 : River Basin Modelling for Flood Risk Mitigation, Taylor &
Francis/Balkema, Leiden
[3] Chow, V.T., 1959 : Open-Channel Hydraulics, McGraw-Hill, New York.
[4] Henderson, F.M., 1966 : Open Channel Flow, MacMillan, New York
[5] Ackers, P., 1991 : Discussion of Flow Resistance of Compound Channels (and associated papers) J.
Hydr. Res. Volume 29, No. 2, pp. 263-271
[6] Barnett, A.G., and Shamseldin, A.Y., 2008 : Resistance Computation in Overbank Flows, Proceedings of
the 16th IAHR-APD Congress and 3
rd Symposium of IAHR-ISHS, Vol. V, pp. 1829-1834

1
The Royal Society of New Zealand
James Cook Research Fellowship
Referee Report on behalf of Dr Alastair Gordon Barnett by
Dr. Ir. Gaele S. Rodenhuis
1. Scientific and Technological Capability I am keeping in this section heading deliberately scientific and technological capability together. As I will argue in a moment this combination is essential for a successful completion of the research proposed. And in both these aspects Dr. Barnett is outstandingly capable. It is the combination of his own research and development of highly powerful computer software in the field of hydraulic engineering and water management combined with hands-on application in a wide range of important real-life engineering applications, both in New Zealand and – important in this connection – in quite a number of countries outside new Zealand, including the setting up of data gathering networks, that has created a solid foundation for the research proposed. Through this experience Dr. Barnett has developed the essential knowledge of the whole information chain that is involved in delivering the software results to be used in engineering works. (And as I will explain below, there is the great danger in the application of modern engineering software that this knowledge goes into hiding.) Dr. Barnett is also well connected to the scientific community in this field. He has personal contacts with the scientists and engineers in the institutes that are leading in the world today; institutes that are delivering the software systems most widely used internationally. For his capabilities in a more general sense I refer to his achievements, documented in his CV.
2. Potential to Conduct Independent Research Dr. Barnett is highly capable to conduct independent research. There is absolutely no doubt in my mind about that. This is eminently clear from his CV but this is also what I have experienced personally. Dr. Barnett has developed his own formulations of important software algorithms and has written both scientific and engineering papers with quite independent and original views. He is - in my opinion very important - comfortable with those situations and periods in independent research in which one can be quite lonely as a researcher. I have no doubt that he will be capable of keeping the momentum and completing the proposed research successfully.

2
3. Scientific and Technological Merit of the Proposed Research Programme Engineering works costing millions of dollars (Pounds), of enormous economic consequence and often with an irreversible impact on the natural environment and on human society are nowadays designed and managed with the use of powerful software systems. These systems are now common tools in design institutes, consulting firms and water authorities. They have developed into user friendly packages, and their beautiful colourful pictures of predicted results create the illusion of truth. Often a whole chain of linked parameters are computed in one application, i.e. from water movement through water quality to ecological impacts, or similarly, from water movement to changes in morphology (river beds, coastlines) and to changes in habitats. Throughout this chain, from the sampling of topographical data and the collection and interpretation of initial and boundary values of the hydraulic, water quality and ecological conditions, many steps of resampling, interpolation and smoothing may take place, steps of which the user may be totally unaware. Striking features of the phenomenon under study - think of fault lines, fronts or singular points - may thus be smoothed away: knowledge goes into hiding. And the interpretation of the outcomes of the software in this field is difficult. It is essential to understand that we here are dealing with natural systems as opposed to man-made systems. Almost every time one considers the outcome of a computer run for a natural system, one has to wonder whether what one sees is a correct prediction of a natural phenomenon or possibly the result of a particular computational artefact. Thus one needs to understand both the natural system and the computational representation of this system. It is this combination of the engineer/scientist and the mathematician that makes this so difficult. It is of the utmost importance that the users of these systems – engineers and scientists in those design institutes, consultancy bureaus and authorities – are aware of the pitfalls of the systems they are working with, learn how to select the right tools for their tasks, are capable of putting the right questions to the suppliers of software, do understand essential concepts as validation and calibration. The proposed textbook will address this need. There is at this moment not much literature available on modern hydraulic software systems that precisely combine these engineering/scientific and computational aspects. Because his career has covered both those aspects and more, Dr. Barnett is well equipped to write an authorative textbook that will be of great value to the New Zealand engineering and scientific society as well as to the broader international community. Perhaps it can help to avoid some disasters through ill-used software that undoubtedly are looming ahead.
4. Level of Support I leave it to persons familiar with the New Zealand scene to judge whether the NIWA organisation can provide the required support. I can only say that it appears to me the right environment to conduct the proposed work. What I can say is that I believe that through his international contacts with leading organisations in this field in Europe and the U.S., Dr. Barnett will be capable of writing a

3
textbook that addresses the major software systems being used in this field today. These contacts are solid and long-standing and I trust that Dr. Barnett will get the support in his work that is needed to achieve an in-depth coverage of commonly used tools that will make his textbook complete and successful. Dr. Ir. Gaele S. Rodenhuis, Workum, The Netherlands, 24-08-2005 e-mail: [email protected] =============================================================== Dr. Rodenhuis was until 2002 Director of Science and Technology of Delft Hydraulics, one of the two leading organizations in the world on research and specialized consultancy in hydraulic engineering and water management and a supplier of leading software in this field. Earlier he was Head of the Computational Hydraulics Centre of the Danish Hydraulic Institute, the other of the two leading institutes on water software. In these two institutes he was responsible for the development and application of comprehensive software packages that are now used world-wide. He is presently working as an independent international consultant. As such he is at this moment co-author of the research agenda on water supply and technology (including water management) proposed for the forthcoming 7-th Framework Programme of the European Union. He recently also worked for UNESCO on an assignment to establish the research programme and project portfolio on water management for a UNESCO sponsored institute for Middle and Central Asia. He has been involved in international projects in a great many countries, including among others, the U.S., Saudi Arabia, the Soviet Union and Russia, Japan, India, Bangladesh, Malaysia, Singapore and Australia. Dr. Rodenhuis is member of the Council of IAHR, the International Association for Hydraulic Engineering and Research. In this capacity he was co-organizer of the Science, Technology and Management Panel of the 3rd World Water Forum in Kyoto in 2004.
== end of report ==

Pumped hydropower is increasingly acknowledged as the primary option world-wide for integrating
intermittent renewable power sources such as wind and solar energy into a resilient electricity grid.
Selection of a site with optimal properties can greatly reduce development project costs, as
demonstrated by the Tekapo-Pukaki scheme. This can hold 2700 GWh, two-thirds of the total hydro
energy storage available in New Zealand, which as an island country without land borders must
organise to be totally self-sufficient in electricity generation. Criteria for an optimal site are shown to
include the existence of two naturally unconnected lakes, adjacent at differing altitudes and with
strong natural inflows. Location near the national grid is also an advantage. Regional droughts are the
main threat to a national system relying mainly on hydropower. Before full commitment can be made
to reservoir storage alone, the frequency, recurrence interval and correlation between regional
droughts and wind and solar inputs must be thoroughly researched from historical records to establish
an Annual Exceedence Probability of around 95% for adequate reservoir inflows. A model of the
reservoirs, connecting channels and power stations must also be validated against projected cycles of
power demand from the national grid under various regional drought scenarios. This can be used to
ensure that the required power delivery does not exceed the capacity of any station or connecting
channel, possibly causing collapse of parts of the system. The Tekapo-Pukaki scheme has been run as
a once-through system to date, but 370GWh of pumped storage could easily be superimposed at a cost
well under $1 per kWh. This would enable the country to move to 100% renewable electricity at a
very low cost compared with estimates of over $100 per kWh published by international energy
authorities for pumped hydrostorage.
