submission for nsf protocol p352 · nsf protocol p352, part b ... basf corporation 100 park avenue,...
TRANSCRIPT

Submission for Verification of Eco-efficiency Analysis Under
NSF Protocol P352, Part B
Controlled Release Fertilizers Eco-efficiency Analysis
Revised Final Report - December 2013
Submitted by:
BASF Corporation 100 Park Avenue, Florham Park, NJ, 07932
Prepared by:
Bruce Uhlman, Senior Sustainability Specialist
Johanne Wilson, Manager New Business Development
James Taft, Account Manager
Jon Rosenthal, President Florikan® E.S.A, LLC
Brian Patterson, Regional Sales Manager, Florikan® E.S.A, LLC

Copyright © 2013 BASF Corporation
1
Table of Contents 1. Purpose and Intent of this Submission ..................................................... 2 2. Content of this Submission ....................................................................... 2 3. BASF's Eco-efficiency Methodoloy ………………………………………………... 2
3.1. Overview …………………………………………………………………………………………………..2 3.2. Preconditions ……………………………………………………………………………………………..2 3.2.1 Environmental Burden Metrics ……………………….…………………………………………… 3 3.2.2 Economic Metrics ……………………………………………………………………………………….3 3.3 Work Flow ………………………………………………………………………………………………...4
4. Study Goals, Decision Criteria and Target Audience ................................. 4 4.1. Study Goals .................................................................................................. 4 4.2. Decision Criteria ........................................................................................... 6 4.3. Target Audience ........................................................................................... 7
5. Customer Benefit, Alternatives, System Boundaries and Scenarios ......... 7 5.1. Customer Benefit .......................................................................................... 7 5.2. Alternatives .................................................................................................. 7 5.3. System Boundaries ....................................................................................... 8
5.4 Scenario Analyses ………………………………………………………………………………………9 6. Input Parameters and Assumptions ......................................................... 9
6.1. Input Parameters.......................................................................................... 9 6.2 Costs………………………………………………………………………………………………………..13
6.3. Further Assumptions ........................................................................... ……...14 7. Data Sources ........................................................................................... 14 8. Eco-efficiency Analysis Results and Discussion ...................................... 17
8.1. Environmental Impact Results ......................................................................17 8.1.1. Cumulative Energy Demand (CED) ............................................................17 8.1.2. Abiotic Depletion Potential (ADP) ...............................................................17 8.1.3. Air Emissions ...........................................................................................18 8.1.3.1. Global warming potential (GWP) ............................................................18 8.1.3.2. Photochemical ozone creation potential (smog) .......................................19 8.1.3.3. Ozone depletion potential (ODP) ............................................................19 8.1.3.4. Acidification potential (AP) ....................................................................20 8.1.4. Water emissions ......................................................................................21 8.1.5. Solid waste emissions ...............................................................................21 8.1.6. Land use .................................................................................................22 8.1.7. Toxicity potential .....................................................................................23 8.1.8. Risk potential ...........................................................................................25 8.1.9. Environmental fingerprint .........................................................................26 8.2. Economic Cost Results .................................................................................26 8.3. Eco-Efficiency Analysis Portfolio ....................................................................27
9. Data Quality Assessment .............................................................. ……….28 9.1. Data Quality Statement ................................................................................28
10. Sensitivity and Uncertainty Analysis ....................................................... 29 10.1. Sensitivity and Uncertainty Considerations .....................................................29 10.2. Critical Uncertainties ....................................................................................32
10.3 Sensitivity Analyses …………………………………………………………………………………32 11. Limitations of EEA Study Results ............................................................ 36 12. References .............................................................................................. 37

Copyright © 2013 BASF Corporation
2
1. Purpose and Intent of this Submission
1.1. The purpose of this submission is to provide a written report of the methods and findings of BASF Corporation’s “Controlled Release Fertilizer Eco-efficiency Analysis”, with the intent of having it verified under the requirements of NSF Protocol P352, Part B: Verification of Eco-efficiency Analysis Studies.
1.2. The Controlled Release Fertilizer Eco-efficiency Analysis was performed by BASF according to the methodology validated by NSF International under the requirements of Protocol P352. More information on BASF’s methodology and the NSF validation can be obtained at http://www.nsf.org/services/by-industry/sustainability-environment/claims-validation/eco-efficiency or http://www.basf.com/group/corporate/en/sustainability/eco-efficiency-analysis/index
2. Content of this Submission
2.1. This submission is a revised version of the Controlled Release Fertilizer Final Report which was verified by NSF in September 2013. Since the completion of the original study the Florikote® technology which was the basis for the controlled release fertilizer was purchased by the J.R. Simplot Company. Simplot has rebranded the controlled release fertilizer as Gal-XeONE. No changes were made to the Florikote® technology, formulation or manufacturing process. The rebranding was simply a name change. Thus references in this report to Florikote® have been replaced with Gal-XeONE.
3. BASF’s EEA Methodology
3.1. Overview: BASF EEA involves measuring the life cycle environmental impacts and life cycle costs for product alternatives for a defined level of output. At a minimum, BASF EEA evaluates the environmental impact of the production, use, and disposal of a product or process in the areas of energy and resource consumption, emissions, toxicity, risk potential, and land use. The EEA also evaluates the life cycle costs associated with the product or process by calculating the costs related to, at a minimum, materials, labor, manufacturing, waste disposal, and energy.
3.2. Preconditions: The basic preconditions of this eco-efficiency analysis are that all alternatives that are being evaluated are being compared against a common functional unit or customer benefit. This allows for an objective comparison between the various alternatives. The scoping and definition of the customer benefit are aligned with the goals and objectives of the study. Data gathering and constructing the system boundaries are consistent with the functional unit and consider both the environmental and economic impacts of each alternative over their life cycle in order to achieve the specified customer benefit. An overview of the scope of the environmental and economic assessment carried out is defined below.
Copyright © 2013 BASF Corporation
3
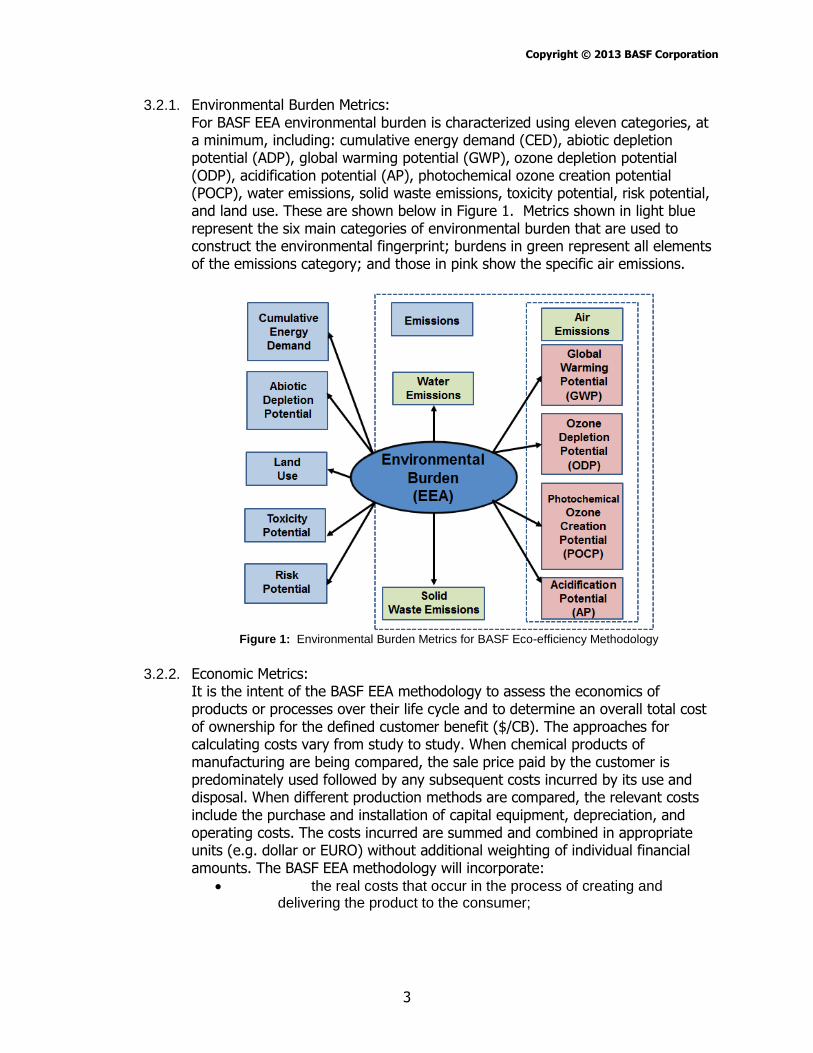
3.2.1. Environmental Burden Metrics: For BASF EEA environmental burden is characterized using eleven categories, at a minimum, including: cumulative energy demand (CED), abiotic depletion potential (ADP), global warming potential (GWP), ozone depletion potential (ODP), acidification potential (AP), photochemical ozone creation potential (POCP), water emissions, solid waste emissions, toxicity potential, risk potential, and land use. These are shown below in Figure 1. Metrics shown in light blue represent the six main categories of environmental burden that are used to construct the environmental fingerprint; burdens in green represent all elements of the emissions category; and those in pink show the specific air emissions.
Figure 1: Environmental Burden Metrics for BASF Eco-efficiency Methodology
3.2.2. Economic Metrics:
It is the intent of the BASF EEA methodology to assess the economics of products or processes over their life cycle and to determine an overall total cost of ownership for the defined customer benefit ($/CB). The approaches for calculating costs vary from study to study. When chemical products of manufacturing are being compared, the sale price paid by the customer is predominately used followed by any subsequent costs incurred by its use and disposal. When different production methods are compared, the relevant costs include the purchase and installation of capital equipment, depreciation, and operating costs. The costs incurred are summed and combined in appropriate units (e.g. dollar or EURO) without additional weighting of individual financial amounts. The BASF EEA methodology will incorporate:
the real costs that occur in the process of creating and delivering the product to the consumer;

Copyright © 2013 BASF Corporation
4
the subsequent costs which may occur in the future (due to tax policy changes, for example) with appropriate consideration for the time value of money; and
costs having ecological aspect, such as the costs involved to treat wastewater generated during the manufacturing process.
3.3 Work Flow:
A representative flowchart of the overall process steps and calculations conducted for this eco-efficiency analysis is summarized in Figure 2 below.
4. Study Goals, Decision Criteria and Target Audience
4.1. Study Goals:
The expanding and rapid growth of our world’s population continues to stress the economic, environmental and societal pressures we place on our earth. By 2050, more than nine billion people will live on our planet. The world population and its demands will keep growing, while the planet’s resources are finite. If nothing changes, we will need the resources of almost three of our planets to meet the demands of the population. This will pose huge global challenges and is not a sustainable model. Companies and individuals alike will need to be more cognizant of how their actions and products impact the environment, how they will be able to reduce these negative impacts, and ultimately how they will be able to produce more with less. Perhaps in no other industry are these issues more apparent and perhaps the future innovations more vital to us addressing these global challenges than in agriculture. Getting more from every acre is an urgent priority. Land suitable for growing crops is dwindling so optimizing yields from existing agricultural spaces is essential. Resources will be constrained so effective use of agricultural resources (e.g. mineral fertilizers, water etc.) is essential as well.

Copyright © 2013 BASF Corporation
5
The fundamental principle behind fertilizer use is simple: apply the right quantity of nutrients at the right time. Fertilizers deliver the necessary macro- and micronutrients that crops require in order to ensure proper crop growth and yields. Unfortunately, over fertilization, besides having the obvious negative economic impacts, is a major contributing factor to many detrimental environmental problems such as soil and water acidification, contamination of surface and groundwater, depletion of natural resources, increased photochemical ozone creation and global warming potential and loss of biodiversity. Recent innovations have enabled the agricultural industry to begin to address these challenges and optimize the production and application of both mineral based and organic derived fertilizers. This eco-efficiency analysis will look at one of these recent innovations, controlled release fertilizers and compare it against conventional fertilizers with conventional application methods.
Controlled release fertilizers are traditional fertilizers that are encapsulated with a coating that acts as a semi-permeable barrier to allow continuous release of the fertilizer over time. Benefits of this slower release of nutrients into the environment include:
continuous release of nutrients to crop root zone throughout the growth season
nutrient availability that matches specific plant requirements and can be tailored to take into consideration climate and soil type
the ability to deliver plants annual nutrient requirements in a single application while matching the crop’s uptake pattern
minimizing nutrient losses through leaching and volatilization allows reduced application rates and enhanced use efficiency of nutrients
reducing emissions to both air and water
potential economic savings through eliminating or reducing fertilizer applications This study compares two different fertilizer packages for sugarcane growth in Florida’s sandy soils: (1) conventional fertilizers applied to a sugarcane crop in sandy soils and (2) a controlled release fertilizer package for sugarcane grown in the same soils. Specifically, this study looks to quantify the eco-efficiency difference between a conventional and controlled release fertilizer program for sugarcane crops grown in Florida sandy soils. During the 2009 – 2010 growing season Florikan® E.S.A LLC, partnered with US Sugar Corporation, the largest sugarcane grower in the United States, to conduct a field trial comparing sugarcane yield and sucrose percentage obtained with its standard nutritional program versus a 12 month Gal-XeONE controlled release fertilizer (CRF) program applied once at the time of planting.1 In addition to the specific fertilizer types and application rates, field tissue samples from the sugarcane plant were collected from both the control plots (conventional fertilizer)
1 Since the completion of this study the Florikote® technology which was the basis for the controlled
release fertilizer was purchased by the J.R. Simplot Company. Subsequently, Simplot has rebranded the controlled release fertilizer as Gal-XeONE. No changes were made to the Florikote® technology,
formulation or manufacturing process. All references in this report to Florikote® have been replaced with a reference to Gal-XeONE.

Copyright © 2013 BASF Corporation
6
and the Gal-XeONE CRF plots to determine differences in the nutritional status of the plants. Finally, the study considered application of these fertilizer programs specifically for sandy soils in Florida, thus regional data was used for study input parameters such as average fuel price, electricity grid mix, anticipated annual miles driven, etc.
Study results were used as the basis to guide product development in the area of controlled release fertilizers as well as support external marketing claims around the environmental and economic benefits of controlled release fertilizers. The Eco-efficiency methodology will facilitate the clear communications of the study results to key stakeholders in the professional horticulture, specialty agriculture, landscaping, and sports turf industries as well as to potential state and federal government agencies and can also support the education and awareness of the benefits of controlled release fertilizers to the end consumer.
4.2 Decision Criteria:
The context of this eco-efficiency analysis compared the defined life cycle environmental and cost phases studied for production of sugarcane on a 1 acre of crop land in southwest Florida during one full growing season (2009/2010). The general soil type is a sandy mineral soil14 and as each alternative was grown on the same type of soil, influences caused by any differences in soil structure and characteristics were minimized. The study used data mainly documented by US Sugar Corporation and Florikan® E.S.A, LLC who partnered together to conduct field trials comparing various fertilization programs for sugarcane crop in Florida. The data in the study included specific field data such as plant tissue samples and growth measurements for both the control plots (conventional fertilizer program) and the sugarcane plots utilizing a Gal-XeONE controlled release fertilizer program. Plant tissue samples would allow comparison of the nutrient levels (N-P-K) in the sugarcane crop. Other data collected would be the specific fertilizer type and application rates, application methods and costs. The study relied on both public and internal information and MSDSs were utilized for any non-BASF supplier information. The context of this EEA study compared the life cycle environmental and cost impacts for utilizing a specially tailored slow release fertilization program for sugarcane in place of a conventional program. The study was technology driven with specific focus on capturing the environmental benefits relative to conventional fertilization programs for an innovative technology which applies a polymer coating to conventional fertilizers. This coating allows for a “slow, staged release” of nutrients which is timed with a crop’s uptake pattern and thus increases fertilizer efficiency, reduces waste and field emissions and enhances overall crop performance. The study goals, target audience, and context for decision criteria used in this study are displayed in Figure 3.

Copyright © 2013 BASF Corporation
7
Figure 3: Context of Decision Criteria for Controlled Release Fertilizer (CRF) Eco-efficiency Analysis
4.3. Target Audience:
The target audience for the study has been defined as professionals in the commercial horticulture, specialty agriculture, professional landscape and lawn care industries, government agencies, NGOs as well as the end consumer.
5. Customer Benefit, Alternatives and System Boundaries
5.1. Customer Benefit (CB):
The Customer Benefit (identified also as CB), Functional Unit (FU) or User Benefit (UB) applied to all alternatives for the base case analysis is the fertilization of one (1) acre of sugarcane crop grown in southwest Florida over the period of one (1) year producing the same tonnage and overall sucrose yield.
5.2. Alternatives:
The product alternatives compared under this eco-efficiency study cover (1) conventional or standard fertilization program delivered in 5 applications over the year and (2) a customized Gal-XeONE controlled release fertilizer (CRF) program delivered one time on the day of planting.
Actual field data will be used to compare the effectiveness of each alternative with regards to sugarcane crop growth and yield. Florikan® E.S.A. LLC, partnered in 2009 with US Sugar Corporation, to conduct a trial comparing sugarcane yield and sucrose percentage obtained with its standard nutritional program versus a 12 month Gal-XeONE CRF program that delivered all nutrients needed for the entire crop at the time of planting. This study will quantify the eco-efficiency differences between the two programs. For the base case analysis, the alternatives compared
40 years
10 years
3 years
consumer emerging
survival
global regional
local technology
competitve
regulatory
gap closure step change
NGO/ external
supplier/customer
internal
1 product 1 market consumer post-consumer
full life cycle
all products/markets
Scenario and Horizon (years) Geography
Drivers
Innovation
Economy Product / Material
Engagement
Value Chain supply chain
incremental

Copyright © 2013 BASF Corporation
8
will consider a cost neutral approach where the annual costs of the two fertilizer programs will be the same for US Sugar. Thus this analysis will focus on the environmental differences between the two alternatives.
5.3. System Boundaries:
The system boundaries define the specific elements of the production, use, and disposal phases of the life cycle that are considered as part of the analysis. The system boundary for the conventional fertilizer blend alternative is depicted in Figure 4 while Figure 5 depicts the system boundary for the Gal-XeONE controlled release fertilizer blend.
Grey boxes are assumed equivalent impacts for each alternative and thus excluded
Figure 4: System boundary – Conventional Fertilizer Application – US Sugar

Copyright © 2013 BASF Corporation
9
Grey boxes are assumed equivalent impacts for each alternative and thus excluded
Figure 5: System boundary – Gal-XeONE Controlled Release Fertilizer Application – US Sugar
All relevant life cycle stages including the production, transport, application, use and disposal (end-of-life + field emissions) of both the conventional and controlled release fertilizers alternatives are considered. Life cycle stages or processes within the defined life cycle which were deemed equivalent for each alternative (e.g. usage of herbicides and additives, crop harvest activities etc.) have been excluded from the analysis and have been highlighted in grey in Figures 4 and 5.
5.4 Scenario Analyses:
In addition to the base case analysis, the following scenario analyses were considered:
5.4.1 Scenario #1: Florida citrus crop application with comparison of a conventional fertilizer blend to both a single and a double application Gal-XeONE controlled release fertilizer blend
5.4.2 Scenario #2: Florida turf/sod application with comparison of conventional fertilizer and a single application Gal-XeONE controlled release fertilizer program
5.4.3 Scenario #3: Adjustment to field emissions factors for controlled released fertilizers to compensate for less leaching and volatilization
6. Input Parameters and Assumptions
6.1. Input Parameters:
Gal-XeONE
CRF mfg.

Copyright © 2013 BASF Corporation
10
A comprehensive list of input parameters were included for this study and considered all relevant material and operational characteristics. Specific data sources included US Sugar Corp., Florikan® E.S.A. LLC, and BASF’s North American Absolute input values for costs and environmental inputs and outputs were utilized as opposed to differential values.
This study evaluates fertilization technologies for sugarcane cultivation in Florida. Though a highly efficient plant, sugarcane like most crops still requires adequate sunlight, water, pest management and the proper type and quantities of nutrients. Proper delivery of the nutrients using fertilizers can enhance both crop growth and yield while minimizing costs and environmental impacts. This analysis looks specifically at comparing fertilization programs, leaving the other variables (e.g. herbicide/pesticide treatment, harvesting etc.) constant. To confirm the effectiveness of the fertilization programs, test plots were established in US Sugar sugarcane fields in Florida. Trials were established so that the Gal-XeONE CRF technology program ensured no cost increase to US Sugar versus its conventional program. These trials continued on the test plots through the first and second stubble crops in 2012. This eco-efficiency analysis specifically looks at the trials conducted during the 2009-2010 growing season with harvesting in 2011.
For the “cost neutral” field study, two specific fertilization programs were administered on fallow cane. Through close partnership with US Sugar, Florikan® was able to tailor the specific conventional and Gal-XeONE CRF fertilizer blend so the total cost per acre for US Sugar were basically equivalent to their current conventional program. Delivering the required N-P-K nutrients to the sugarcane can be accomplished with various fertilizers all of which have different prices. Thus, to come up with the cost neutral program, a carefully tailored program with consideration for when fertilizers are being applied during the emergence and growth periods as well as their N-P-K value and cost all needed to be considered and balanced.
One fertilization program consisted of US Sugar’s standard program for sandy soils of five (5) Nitrogen applications throughout the year including three critical Nitrogen applications during the summer “grand growth” period (to be defined as study alternative 1: conventional fertilizer blend). The alternate program consisted of a single 12 month staged nutrient release blend (to be defined as study alternative 2: Gal-XeONE CRF Single Application Blend).
As the trial progressed, tissue samples and growth measurements were taken on both the control plots (conventional program) and the Gal-XeONE CRF plots. Tissue samples would help confirm nutrient delivery to the crops.
6.1.1. Application Rates:
Tables 1 and 2 below detail the specific fertilization programs for both the conventional and CRF programs. Though the tables show only the blended N-P-K values for the fertilizer, the specific list and quantity of organic or mineral fertilizer applied was provided to NSF for review. The Florikan® CRF Program

Copyright © 2013 BASF Corporation
11
noted in Table 2 required two passes of the ground rig in order to deliver the entire amount of fertilizer during a one time application.
Table 1: US Sugar Conventional Fertilization Program – 2009 / 2010 Growing Season
Application Date
Average Miles
Driven Application Meathod Blend Used
Application Rate
(Lbs.)
Nitrogen
Applied (Lbs.)
Phosphorus
Applied (Lbs.)
Potassium
Applied (Lbs.)
11/1/2009 110 In Furrow With Ground Rig 7-8-13 700 49 56 91
1/1/2010 110 Drop Spread With Ground Rig 15-0-30 300 45 0 90
3/1/2010 110 Drop Spread With Ground Rig 34-0-0 150 51 0 0
5/1/2010 110 Fly On 25-0-15 200 50 0 30
8/1/2010 110 Fly On 34-0-0 150 51 0 0
246 56 211
Table 2: Florikan® CRF Program – 2009 / 2010 Growing Season
Application Date
Average Miles
Driven Application Meathod Blend Used
Application Rate
(Lbs.)
Nitrogen Applied
(Lbs.)
Phosphorus
Applied (Lbs.)
Potassium
Applied (Lbs.)
1-Nov 110 x 2 passes In Furrow With Ground Rig 13.5-3-13.3 1200 162 36 159.6
162 36 159.6
6.1.2. Field Emissions
Fertilizers applied to the ground can undergo various transformations (e.g. nitrification, denitrification, hydrolysis, volatilization and leaching) in the soil prior to uptake by the crop. These transformations are directly dependent on variables such as the chemical composition of the fertilizer, the soil type and the climate to name a few. Through the transformations, the original fertilizer can transform into various other components where some are directly absorbed by the plant as nutrients while others contribute to environmental hazards as either an air or water emission or as an unused resource that remains in the soil. One example of this transformation process is nitrification. Nitrification by soil bacteria converts ammonium into nitrate and during this transformation gases such as nitrous oxide and nitric oxide are lost to the atmosphere during this process.
This study looked at the direct and indirect air emissions as well as the water emissions associated with the various fertilizer application programs. Specifically, the study modeled both direct field emissions of N2O, NH3, NO and CO2 and indirect emissions of N2O through volatilization (N in fertilizer converts to NH3 with subsequent conversion in air to N2O) and leaching (NO3
- in water to N2O). In addition, water emissions due to agriculture were considered though these figures are highly dependent on climate, application method and soil type. Water emissions from fertilizers included in this analysis were N, P and heavy metals such as Cd, Hg, Ni, Pb and Zn.
It was assumed in the base cases analysis that no nitrification inhibitors were used in any of the fertilizers. Inclusion of nitrification inhibitors is not aligned with the goal and scope of the study which is focused on polymer coatings for controlled released fertilizers. An independent study would be better suited to adequately evaluate the impacts and benefits of the use of nitrification inhibitors. Finally, no additional benefit through a reduction in direct and indirect emissions was provided to the controlled release fertilizers due to its polymer coating In
Copyright © 2013 BASF Corporation
12
theory, the polymer coating on a CRF fertilizer could reduce unwanted emissions by better synchronizing the Nitrogen availability in the soil with the Nitrogen demand of the crop.
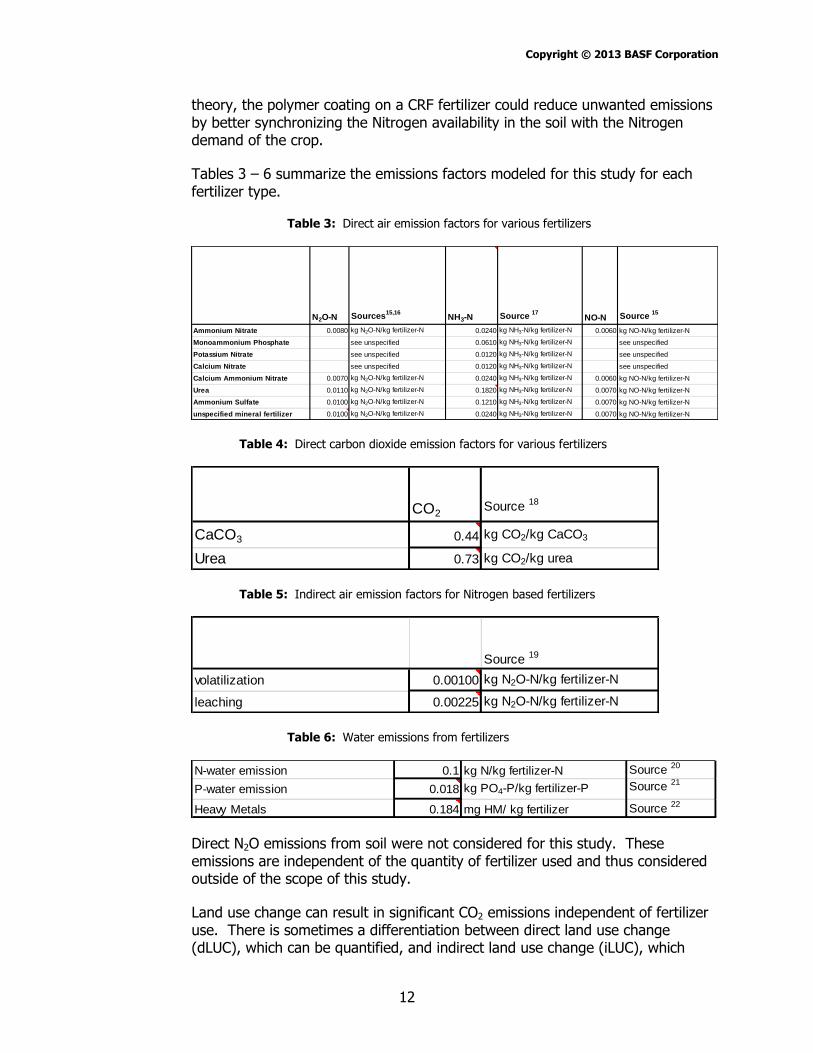
Tables 3 – 6 summarize the emissions factors modeled for this study for each fertilizer type.
Table 3: Direct air emission factors for various fertilizers
N2O-N Sources15,16
NH3-N Source 17
NO-N Source 15
Ammonium Nitrate 0.0080 kg N2O-N/kg fertilizer-N 0.0240 kg NH3-N/kg fertilizer-N 0.0060 kg NO-N/kg fertilizer-N
Monoammonium Phosphate see unspecified 0.0610 kg NH3-N/kg fertilizer-N see unspecified
Potassium Nitrate see unspecified 0.0120 kg NH3-N/kg fertilizer-N see unspecified
Calcium Nitrate see unspecified 0.0120 kg NH3-N/kg fertilizer-N see unspecified
Calcium Ammonium Nitrate 0.0070 kg N2O-N/kg fertilizer-N 0.0240 kg NH3-N/kg fertilizer-N 0.0060 kg NO-N/kg fertilizer-N
Urea 0.0110 kg N2O-N/kg fertilizer-N 0.1820 kg NH3-N/kg fertilizer-N 0.0070 kg NO-N/kg fertilizer-N
Ammonium Sulfate 0.0100 kg N2O-N/kg fertilizer-N 0.1210 kg NH3-N/kg fertilizer-N 0.0070 kg NO-N/kg fertilizer-N
unspecified mineral fertilizer 0.0100 kg N2O-N/kg fertilizer-N 0.0240 kg NH3-N/kg fertilizer-N 0.0070 kg NO-N/kg fertilizer-N
Table 4: Direct carbon dioxide emission factors for various fertilizers
CO2Source 18
CaCO3 0.44 kg CO2/kg CaCO3
Urea 0.73 kg CO2/kg urea
Table 5: Indirect air emission factors for Nitrogen based fertilizers
Source 19
volatilization 0.00100 kg N2O-N/kg fertilizer-N
leaching 0.00225 kg N2O-N/kg fertilizer-N
Table 6: Water emissions from fertilizers
N-water emission 0.1 kg N/kg fertilizer-N Source 20
P-water emission 0.018 kg PO4-P/kg fertilizer-P Source 21
Heavy Metals 0.184 mg HM/ kg fertilizer Source 22
Direct N2O emissions from soil were not considered for this study. These emissions are independent of the quantity of fertilizer used and thus considered outside of the scope of this study.
Land use change can result in significant CO2 emissions independent of fertilizer use. There is sometimes a differentiation between direct land use change (dLUC), which can be quantified, and indirect land use change (iLUC), which

Copyright © 2013 BASF Corporation
13
cannot. Alternative approaches do not differentiate between the two but combine them into an overall land use change (LUC). Never the less, for this study GHG emissions due to direct (dLUC) and indirect (iLUC) were not considered on the basis that the same quantity and type of land was being used/transformed by each alternative.
Finally, the end of life of the polymer coating of the Gal-XeONE CRF fertilizers was also considered. Data supports that the resin coating would not further degrade under the conditions described in this study and thus should be treated as a conventional waste to soil. Research showed that under simulated landfill conditions12 there was no physical evidence that typical polyurethane products decomposed under landfill conditions or degraded to release toluene diamine (TDA) or methylenedianiline (MDA). In addition, other research13 indicates that polyureas formed in contact with water can be expected to be essentially unreactive in the environment for millennia. Thus, polymer coating was modeled as being inert but a contribution to the solid waste category (end of life) was added to complete the overall material balance. There was also no short-term or long-term impact on the customer benefit or in general to soil productivity due to any build-up of this unreactive material in the soil. A conservative approach assuming all the unreactive coating applied over 100 years remains on the top of the soil yields only a build-up of about 2 ounces/ft2. From a volumetric perspective, assuming the average density of sandy mineral soil is around 125 pounds/ft3 the polymer coating would only constitute about 0.1% of the mass of a ft3 of soil.
6.1.3. Gal-XeONE Manufacturing Data
Generally speaking, controlled release fertilizers are conventional fertilizers that undergo an additional manufacturing step that coats them with a special resin which controls the rate of release of the fertilizer. Depending on the thickness of this coating, the fertilizer will be slowly released over a period of 3 months to up to one year. In support of this study, Florikan® E.S.A. LLC provided both coating formulation data as well as manufacturing data (e.g. electricity and fuel consumption, solid waste generation etc.). This data was inputted along with the raw materials required for the resin manufacturing process to develop an accurate eco-profile for the Gal-XeONE CRF fertilizers. Coating weights and formulations are confidential to Florikan® but were provided to NSF for review.
6.2. Life Cycle Costs
The scope of this study considered the application of two different fertilizer programs for sugarcane in Florida during the 2009 – 2010 growing season with harvest in early 2011. As the focus of the trial was to compare the Gal-XeONE CRF and conventional fertilizers programs from a “cost neutral” perspective, the final costs of the fertilizers applied for the base case analysis should be nearly equivalent. To achieve this cost neutrality, the Gal-XeONE CRF fertilizers are able to off-set their higher unit prices through higher nutrient utilization efficiencies and thus require less overall fertilizer to be applied to the field. Pricing of the fertilizers was based on end users costs and was determined by applying a
Copyright © 2013 BASF Corporation
14
standard mark-up of 15% to the supplied dealer costs. Material pricing was updated for this study to reflect current market pricing conditions thus 2012 pricing was utilized for the prices of both the conventional fertilizers as well as the Gal-XeONE CRF fertilizers.
Application costs varied depending on the application method utilized (e.g. broadcast spreader, fly on etc.) and how many applications (and passes) per year were made. Costs from the 2012 Iowa Farm Custom Rate Schedule were utilized. These costs are all inclusive and include costs for the equipment, labor and fuel.
6.3. Further Assumptions
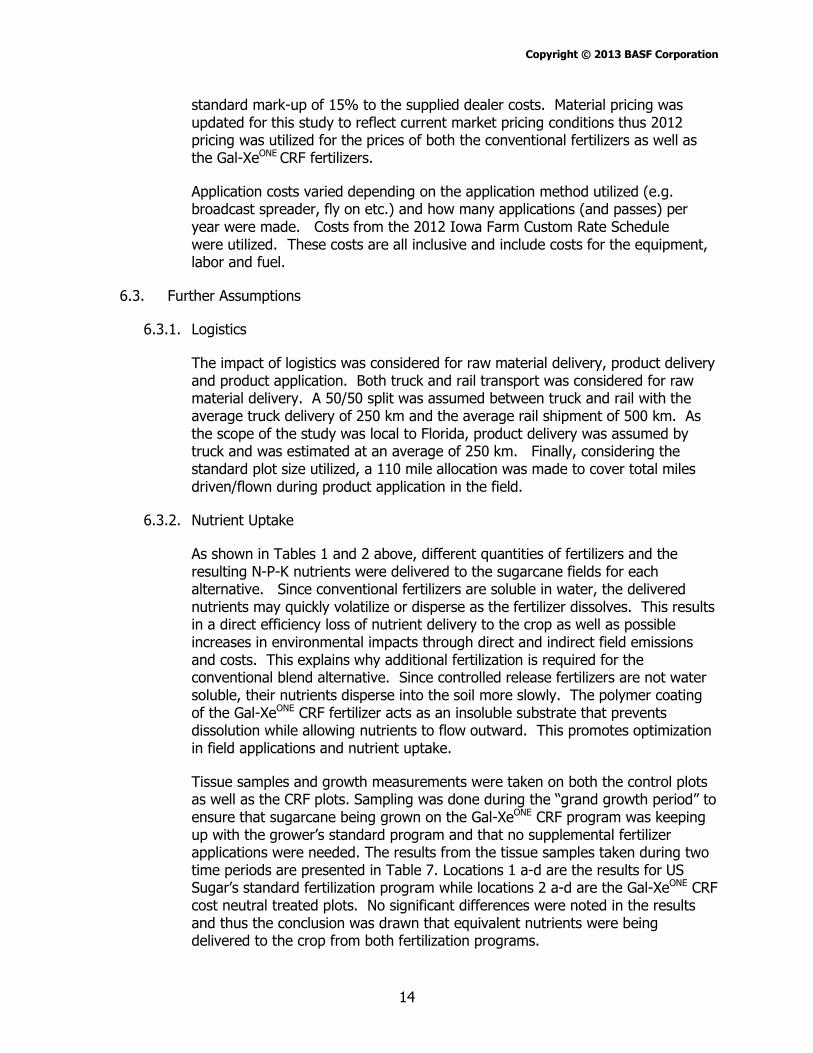
6.3.1. Logistics
The impact of logistics was considered for raw material delivery, product delivery and product application. Both truck and rail transport was considered for raw material delivery. A 50/50 split was assumed between truck and rail with the average truck delivery of 250 km and the average rail shipment of 500 km. As the scope of the study was local to Florida, product delivery was assumed by truck and was estimated at an average of 250 km. Finally, considering the standard plot size utilized, a 110 mile allocation was made to cover total miles driven/flown during product application in the field.
6.3.2. Nutrient Uptake
As shown in Tables 1 and 2 above, different quantities of fertilizers and the resulting N-P-K nutrients were delivered to the sugarcane fields for each alternative. Since conventional fertilizers are soluble in water, the delivered nutrients may quickly volatilize or disperse as the fertilizer dissolves. This results in a direct efficiency loss of nutrient delivery to the crop as well as possible increases in environmental impacts through direct and indirect field emissions and costs. This explains why additional fertilization is required for the conventional blend alternative. Since controlled release fertilizers are not water soluble, their nutrients disperse into the soil more slowly. The polymer coating of the Gal-XeONE CRF fertilizer acts as an insoluble substrate that prevents dissolution while allowing nutrients to flow outward. This promotes optimization in field applications and nutrient uptake.
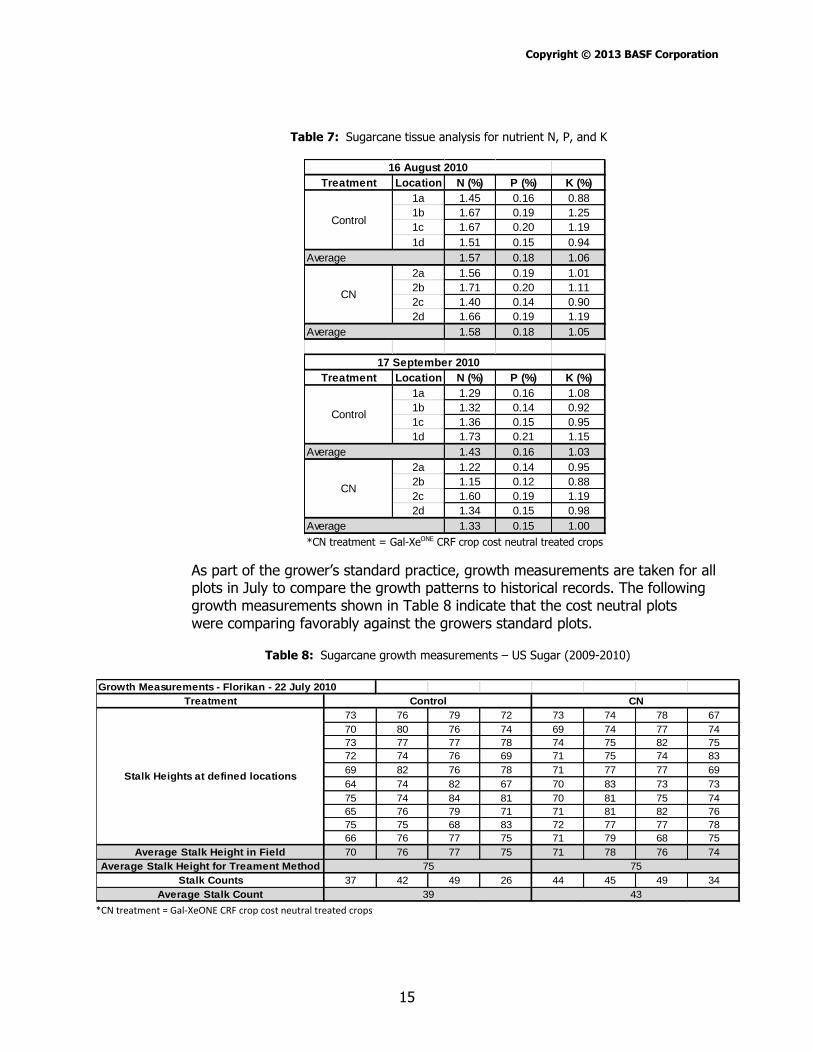
Tissue samples and growth measurements were taken on both the control plots as well as the CRF plots. Sampling was done during the “grand growth period” to ensure that sugarcane being grown on the Gal-XeONE CRF program was keeping up with the grower’s standard program and that no supplemental fertilizer applications were needed. The results from the tissue samples taken during two time periods are presented in Table 7. Locations 1 a-d are the results for US Sugar’s standard fertilization program while locations 2 a-d are the Gal-XeONE CRF cost neutral treated plots. No significant differences were noted in the results and thus the conclusion was drawn that equivalent nutrients were being delivered to the crop from both fertilization programs.
Copyright © 2013 BASF Corporation
15
Table 7: Sugarcane tissue analysis for nutrient N, P, and K
Treatment Location N (%) P (%) K (%)
1a 1.45 0.16 0.88
1b 1.67 0.19 1.25
1c 1.67 0.20 1.19
1d 1.51 0.15 0.94
Average 1.57 0.18 1.06
2a 1.56 0.19 1.01
2b 1.71 0.20 1.11
2c 1.40 0.14 0.90
2d 1.66 0.19 1.19
Average 1.58 0.18 1.05
Treatment Location N (%) P (%) K (%)
1a 1.29 0.16 1.08
1b 1.32 0.14 0.92
1c 1.36 0.15 0.95
1d 1.73 0.21 1.15
Average 1.43 0.16 1.03
2a 1.22 0.14 0.95
2b 1.15 0.12 0.88
2c 1.60 0.19 1.19
2d 1.34 0.15 0.98
Average 1.33 0.15 1.00
*CN treatment = Florikote® CRF crop cost neutral treated crops
16 August 2010
17 September 2010
Control
CN
Control
CN
*CN treatment = Gal-XeONE CRF crop cost neutral treated crops
As part of the grower’s standard practice, growth measurements are taken for all plots in July to compare the growth patterns to historical records. The following growth measurements shown in Table 8 indicate that the cost neutral plots were comparing favorably against the growers standard plots.
Table 8: Sugarcane growth measurements – US Sugar (2009-2010)
Growth Measurements - Florikan - 22 July 2010
Treatment
73 76 79 72 73 74 78 67
70 80 76 74 69 74 77 74
73 77 77 78 74 75 82 75
72 74 76 69 71 75 74 83
69 82 76 78 71 77 77 69
64 74 82 67 70 83 73 73
75 74 84 81 70 81 75 74
65 76 79 71 71 81 82 76
75 75 68 83 72 77 77 78
66 76 77 75 71 79 68 75
Average Stalk Height in Field 70 76 77 75 71 78 76 74
Average Stalk Height for Treament Method
Stalk Counts 37 42 49 26 44 45 49 34
Average Stalk Count
*CN treatment = Florikote® CRF crop cost neutral treated crops
4339
Control CN
7575
Stalk Heights at defined locations
*CN treatment = Gal-XeONE CRF crop cost neutral treated crops

Copyright © 2013 BASF Corporation
16
6.3.3. Crop and Sucrose Yields
Upon harvest of the sugarcane crop, yield (expressed as tons per acre (TPA)) and sucrose content were analyzed for each trial plot. As seen in Table 9, the Gal-XeONE CRF crop (cost neutral treatment) compared closely in comparison to US Sugar’s standard plots (control treatment). Statistically there was no difference between the conventional and CRF plots for both TPA and sucrose percentage.
Table 9: Sugarcane yield results – US Sugar sugarcane trials (2009-2010)
Treatment
Date Planted 12-Oct-09 12-Oct-09 13-Oct-09 13-Oct-09 13-Oct-09 13-Oct-09 13-Oct-09 13-Oct-09
Date Harvested 13-Mar-11 12-Mar-11 12-Mar-11 12-Mar-11 13-Mar-11 13-Mar-11 12-Mar-11 12-Mar-11
TPA 33.54 35.54 33.96 34.78 32.19 31.7 37.76 33.39
% Sucrose 15.14 13.93 14.74 15.96 16.05 16.55 15.75 16.18
Average TPA
Average % Sucrose
* All crops are plant cane variety CP892143. Data is for the 2010-2011 crop year
*CN treatment = Florikote® CRF crop cost neutral treated crops
Control CN
34.46
14.94
33.76
16.13
*CN treatment = Gal-XeONE CRF crop cost neutral treated crops
7. Data Sources
The environmental impacts for the production, use, and disposal of the various alternatives were calculated from eco-profiles (a.k.a. life cycle inventories) for the individual components and for fuel usage and material disposal. Life cycle inventory data for these eco-profiles were from several data sources, including Florikan® and BASF specific manufacturing data. Overall, the quality of the data was considered medium-high to high based on BASF’s data evaluation criteria. None of the eco-profiles data were considered to be of low data quality. A summary of the eco-profiles is provided in Table 10.
Table 10: Eco-profile Data Sources
Eco-Profile Source, Year Comments
Polyol BASF, 2003
Isocyanate BASF, 2011
N-Fertilizers Ecoinvent, 2011 Simapro4
P-Fertilizers Boustead, 1996 Boustead database; most reliable profile available1
K-Fertilizers Ecoinvent, 2011 Simapro4
Minerals Boustead, 1998 Boustead database; most reliable profile available1
Fertilizer Ground Rigs US Average, PE Americas, 2009 PE Americas3
Truck Transport US Avg., USLCI, 2010 USLCI5
Rail Transport US Avg., USLCI, 2010 USLCI6
Aircraft Boustead, 1998 Boustead database; most reliable profile available1
Gal-XeONE CRF Manufacturing Florikan®, 2012
BASF data sources are internal data, while the others are external to BASF. Internal data is confidential to BASF; however, full disclosure was provided to NSF International for verification purposes.
Copyright © 2013 BASF Corporation
17
8. Eco-efficiency Analysis Results and Discussion
8.1. Environmental Impact Results:
The environmental impact results for the Controlled Release Fertilizer EEA are generated as defined in Section 6 of the BASF EEA methodology. The key differences between the alternatives are (1) reduction in the amount of N-P-K applied to the soil for uptake by the sugarcane (2) reduction in the number of applications over the year to deliver the required nutrients. The environmental results presented below in sections 8.1.1 through 8.1.9 are primarily driven by these two differences.
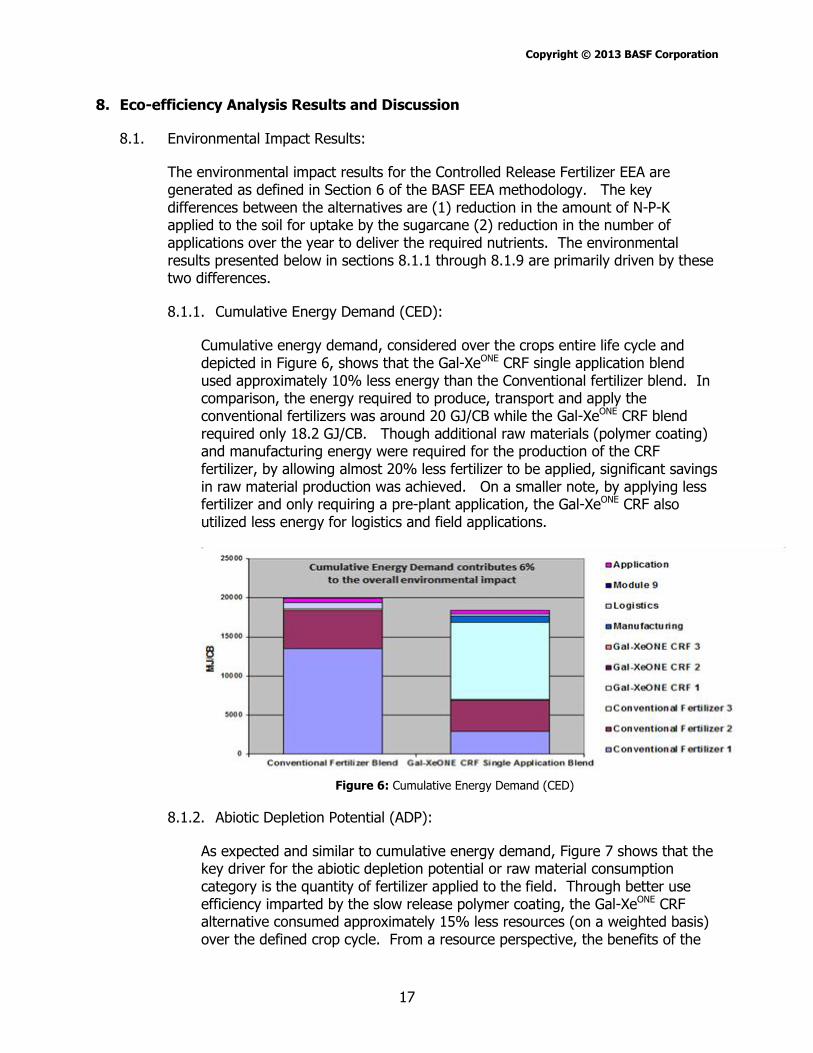
8.1.1. Cumulative Energy Demand (CED):
Cumulative energy demand, considered over the crops entire life cycle and depicted in Figure 6, shows that the Gal-XeONE CRF single application blend used approximately 10% less energy than the Conventional fertilizer blend. In comparison, the energy required to produce, transport and apply the conventional fertilizers was around 20 GJ/CB while the Gal-XeONE CRF blend required only 18.2 GJ/CB. Though additional raw materials (polymer coating) and manufacturing energy were required for the production of the CRF fertilizer, by allowing almost 20% less fertilizer to be applied, significant savings in raw material production was achieved. On a smaller note, by applying less fertilizer and only requiring a pre-plant application, the Gal-XeONE CRF also utilized less energy for logistics and field applications.
Figure 6: Cumulative Energy Demand (CED)
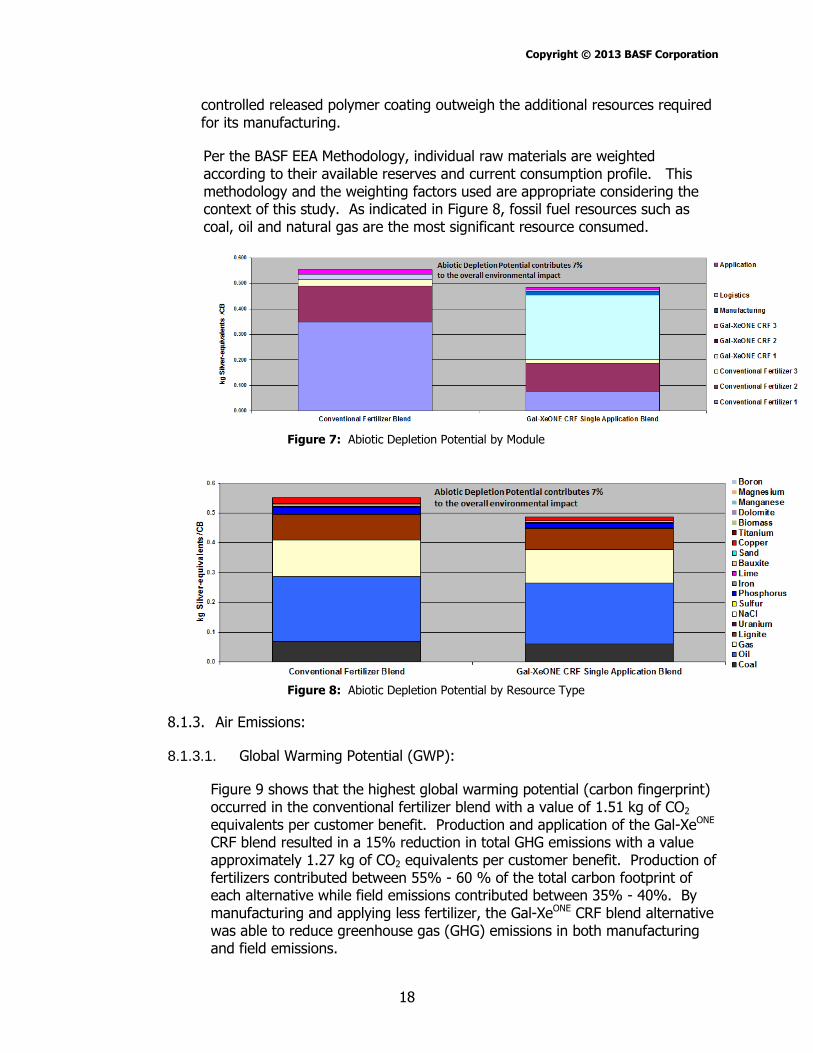
8.1.2. Abiotic Depletion Potential (ADP):
As expected and similar to cumulative energy demand, Figure 7 shows that the key driver for the abiotic depletion potential or raw material consumption category is the quantity of fertilizer applied to the field. Through better use efficiency imparted by the slow release polymer coating, the Gal-XeONE CRF alternative consumed approximately 15% less resources (on a weighted basis) over the defined crop cycle. From a resource perspective, the benefits of the
Copyright © 2013 BASF Corporation
18
controlled released polymer coating outweigh the additional resources required for its manufacturing.
Per the BASF EEA Methodology, individual raw materials are weighted according to their available reserves and current consumption profile. This methodology and the weighting factors used are appropriate considering the context of this study. As indicated in Figure 8, fossil fuel resources such as coal, oil and natural gas are the most significant resource consumed.
Figure 7: Abiotic Depletion Potential by Module
Figure 8: Abiotic Depletion Potential by Resource Type
8.1.3. Air Emissions:
8.1.3.1. Global Warming Potential (GWP):
Figure 9 shows that the highest global warming potential (carbon fingerprint) occurred in the conventional fertilizer blend with a value of 1.51 kg of CO2 equivalents per customer benefit. Production and application of the Gal-XeONE CRF blend resulted in a 15% reduction in total GHG emissions with a value approximately 1.27 kg of CO2 equivalents per customer benefit. Production of fertilizers contributed between 55% - 60 % of the total carbon footprint of each alternative while field emissions contributed between 35% - 40%. By manufacturing and applying less fertilizer, the Gal-XeONE CRF blend alternative was able to reduce greenhouse gas (GHG) emissions in both manufacturing and field emissions.

Copyright © 2013 BASF Corporation
19
Figure 9: Global Warming Potential (GWP)
8.1.3.2. Photochemical ozone creation potential (POCP) (smog):
The lowest contributor to ground level ozone creation potential occurs for the conventional fertilizer blend, with a value of 197 g ethylene equivalents/CB. Figure 10 shows that POCP is highest for the Gal-XeONE CRF blend alternative (239 g ethylene equivalents/CB) because of the resulting emissions from some of the pre-chain raw material chemistries which support the manufacturing of the resin coating. Along with Ozone Depletion Potential (ODP), POCP is the least relevant air emissions and very low contributor to the overall environmental impact for the alternatives, contributing less than 1% to the overall environmental impact.
Figure 10: Photochemical Ozone Creation Potential (POCP)
8.1.3.3. Ozone depletion potential (ODP):
All of the alternatives result in minimal ozone depletion potential. Measured at about 0.9 g CFC-11 equivalents per customer benefit, the Gal-XeONE CRF blend alternative had the highest impact. Figure 11 indicates that the ODP comes predominately from the pre-chain chemistries involved in the precursor materials used in polymer coating for the CRF fertilizers.

Copyright © 2013 BASF Corporation
20
Figure 11: Ozone Depletion Potential (ODP)
8.1.3.4. Acidification potential (AP):
It can be seen from Figure 12 that the life cycle operations that contribute most to acidification potential are fertilizer manufacturing and field emissions. Field emissions are mostly related to ammonia volatilization. The amount of volatilization is dependent upon many factors but mostly on the type of fertilizer used. The Gal-XeONE CRF blend alternative used both ammonium sulfate and urea based fertilizers and they have the highest field emissions rate of ammonium containing or producing fertilizers. With emissions of around 21.1 kg of SO2 equivalents per customer benefit, the Gal-XeONE CRF blend alternative has the highest acidification potential. The conventional fertilizer blend emitted only 17.9 kg of SO2 equivalents per customer benefit, a reduction of around 15%. Acidification potential (AP) is the most significant of the four air emissions categories and contributes about 7% to the overall environmental impact.
Figure 12: Acidification Potential (AP)
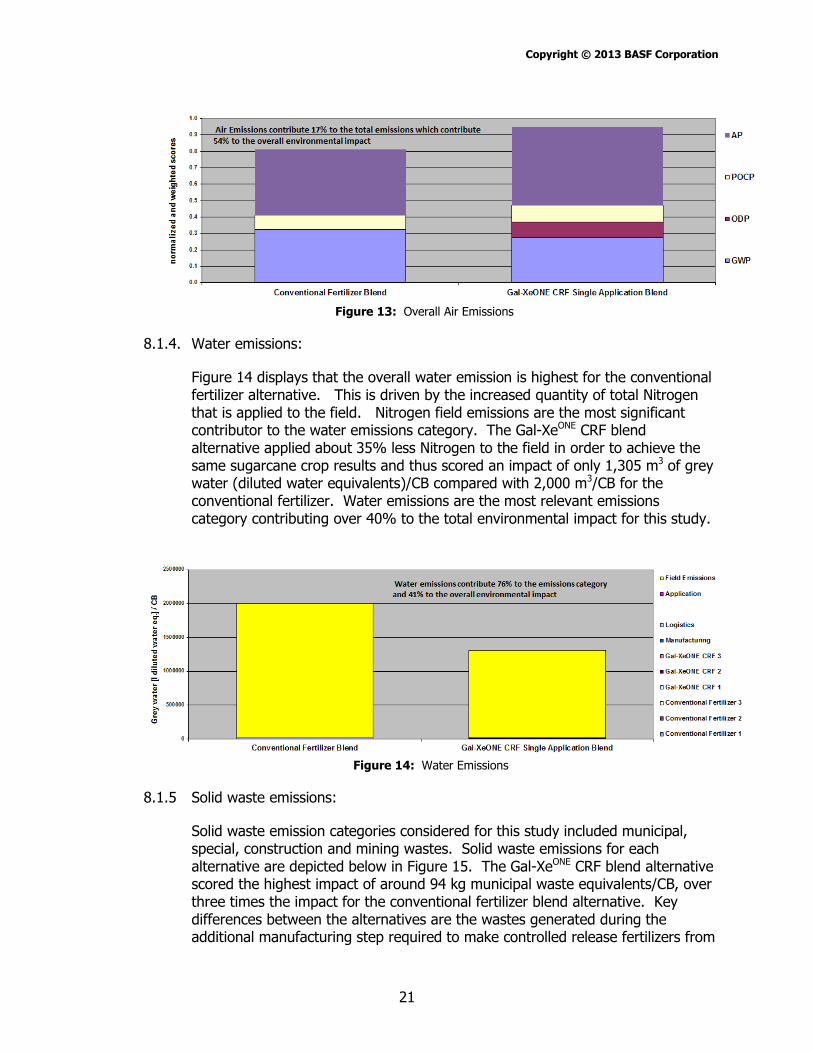
Utilizing the calculation factors from the sensitivity and uncertainty analysis, Figure 13 shows the normalized and weighted impacts for the four air emissions categories (GWP, AP, POCP and ODP) for each alternative. Due to its higher contributions in AP, POCP and ODP, the Gal-XeONE CRF blend alternative scored the highest overall.
Copyright © 2013 BASF Corporation
21
Figure 13: Overall Air Emissions
8.1.4. Water emissions:
Figure 14 displays that the overall water emission is highest for the conventional fertilizer alternative. This is driven by the increased quantity of total Nitrogen that is applied to the field. Nitrogen field emissions are the most significant contributor to the water emissions category. The Gal-XeONE CRF blend alternative applied about 35% less Nitrogen to the field in order to achieve the same sugarcane crop results and thus scored an impact of only 1,305 m3 of grey water (diluted water equivalents)/CB compared with 2,000 m3/CB for the conventional fertilizer. Water emissions are the most relevant emissions category contributing over 40% to the total environmental impact for this study.
Figure 14: Water Emissions
8.1.5 Solid waste emissions:
Solid waste emission categories considered for this study included municipal, special, construction and mining wastes. Solid waste emissions for each alternative are depicted below in Figure 15. The Gal-XeONE CRF blend alternative scored the highest impact of around 94 kg municipal waste equivalents/CB, over three times the impact for the conventional fertilizer blend alternative. Key differences between the alternatives are the wastes generated during the additional manufacturing step required to make controlled release fertilizers from

Copyright © 2013 BASF Corporation
22
conventional fertilizers and the resin coating that remains in the field at end of life.
Figure 15: Solid Waste Emissions
Utilizing the calculation factors from the sensitivity and uncertainty analysis, a composite of the cumulative impact of the three main emission categories of air, water and solid waste is depicted in Figure 16. Due to the significance of the water emissions category, the Gal-XeONE CRF blend alternative scored the lowest in the overall emissions category, about 6% less than the conventional fertilizer alternative.
Figure 16: Overall Emissions Scores
8.1.6 Land use:
As displayed in Figure 17, both alternatives were basically equivalent in their land use impacts. Both achieved an impact of around 37 m2*yr. per customer benefit. The land use benefits achieved by the Gal-XeONE CRF blend through using less fertilizer are off-set by the additional impacts associated with the manufacturing of the controlled release coating.

Copyright © 2013 BASF Corporation
23
Figure 17: Land Use
8.1.7 Toxicity potential:
The toxicity potential for the two fertilizer application alternatives was analyzed for the production, use, and disposal phases of their respective life cycles. For the production phase, not only were the final products considered but the entire pre-chain of chemicals required to manufacture the products were considered as well. Human health impact potential in the use phase consists of the application and any exposure to the fertilizers. Toxicity potential in the Disposal phase was also considered. Nanoparticles were not included in the chemical inputs of any of the alternatives
Inventories of all relevant materials were quantified for the three life cycle stages (production, use and disposal). Consistent with BASF’s EEA methodology’s approach for assessing the human health impact of these materials (ref. Section 6.8 of Part A submittal), a detailed scoring table was developed for each alternative broken down per life cycle stage. This scoring table with all relevant material quantities considered as well as their H-phrase and pre-chain toxicity potential scores were provided to NSF International as part of the EEA model which was submitted as part of this verification. Figure 18 shows how each module contributed to the overall toxicity potential score for each alternative. The values have been normalized and weighted. The toxicity potential weightings for the individual life cycle phases were production (20%), use (70%) and disposal (10%). These standard values were not modified for this study from the standard weightings.
As to be expected the major influencing factor for toxicity potential was the manufacturing impact of the fertilizers and the impacts from application. More fertilizers were utilized for the conventional alternative while the controlled release fertilizers required an additional manufacturing step in order to produce the final fertilizer. Benefits from applying less material was off-set by slightly higher toxicity scoring for the controlled release fertilizers, and thus the toxicity potential score for the production phase was slightly higher for the controlled release alternative. A more significant difference between the alternatives however, was the fact that the conventional alternative required five (5) separate applications to one pre-plant application for the controlled release alternative. These additional applications increased exposure as well as the fuel requirements (and associated emissions) that occur during field applications.

Copyright © 2013 BASF Corporation
24
Figure 19 shows how the toxicity potential scoring is distributed across the life cycle stages. The toxicity potentials of all modules that occur during the production phase of the life cycle are aggregated in the SUM Production module. This aggregation is also done for the use phase (SUM Use) and disposal phase (SUM Rec. /Disp.).
Consistent with the discussion above, the use phase is the most significant, followed by the production and then final disposal. A high safety standard was assumed for the manufacturing processes for the raw materials. For the use phase, an allowance was made to take into consideration the open nature of the application process and the vapor pressure of the materials. Finally, no reduction in the scores based on exposure conditions was applied for the disposal phase of the materials as the potential for human contact during removal and disposal of the materials is high.
Benefiting from the much lower toxicity potential score in the use phase, the Gal-XeONE controlled release fertilizer alternative had the lowest overall toxicity potential across the crop cycle.
Figure 18: Toxicity Potential – Modules
Figure 19: Toxicity Potential- Life Cycle Phases

Copyright © 2013 BASF Corporation
25
8.1.8. Risk (Occupational Illnesses and Accidents potential): All the materials and activities accounted for in the various life cycle stages were assigned specific NACE codes7. NACE (Nomenclature des Activities Economiques) is a European nomenclature which is very similar to the NAICS codes in North America. The NACE codes are utilized in classifying business establishments for the purpose of collecting, analyzing, and publishing statistical data related to the business economy and is broken down by specific industries. Specific to this impact category, the NACE codes track, among other metrics, the number of working accidents, fatalities, illnesses and diseases associated with certain industries (e.g. chemical manufacturing, petroleum refinery, inorganics etc.) per defined unit of output. By applying these incident rates to the amount of materials required for each alternative, a quantitative assessment of risk is achieved. For the industries considered in this analysis the rates utilized for accidents, fatalities etc. for Europe were also deemed representative for the United States and thus adequate for use in this study. In Figure 20, the greatest Occupational Illnesses and Accident potential occurs for the conventional fertilizer alternative. The module which contributes to the highest risk potential for occupational illnesses and accidents is the production of the basic fertilizers. Manufacturing 20% less fertilizer allows the controlled release fertilizer alternative to have the lowest risk during production. The risks associated with the production of the Gal-XeONE controlled release fertilizer blend were about 15% lower than the conventional fertilizer alternative. As depicted in Figure 21, occupational diseases were the most relevant risk category for each alternative. No unique risk categories were identified for this study so the standard weighting between working accidents and occupational diseases was maintained.
Figure 20: Risk Potential (Occupational Illnesses and Accidents) – per Module

Copyright © 2013 BASF Corporation
26
Figure 21: Risk Potential – per Impact Category
8.1.9. Environmental fingerprint:
Following normalization or normalization and weighting with regards to the emissions categories, the relative impact for all six of the main environmental categories for each alternative is shown in the environmental fingerprint (Figure 22). The Gal-XeONE controlled release fertilizer alternative had the lowest environmental impact on a weighted basis in all of the main categories. As disscused previously in the individual impact categories, energy and resource savings related to producing 20% less fertilizers as well as a significant reduction in field water emissions and toxicity potential, help contribute to this overall environmental benefit. The environmental impact savings related to using less fertilizers significantly outweighs the additional environmental impacts required to produce the controlled release polymer coating. The environmental fingerprint clearly shows that there is a positive environmental value proposition for controlled release fertilizers.
Figure 22: Environmental Fingerprint
8.2. Economic Cost Results:
The life cycle cost data for the Controlled Release Fertilizer EEA are generated as defined in Section 7 of the BASF EEA methodology and described in Section 6.2 above. The results of the life cycle cost analysis based on a present value approach (PV) are depicted in Figure 23. As specified earlier in section 5.2 (Alternatives), the

Copyright © 2013 BASF Corporation
27
field trials were specifically designed to develop a single application controlled released fertilizer that offered a “cost neutral” approach to US Sugar when applied during the 2009 / 2010 growing season. To reflect current market conditions and pricing, the costs for the applied amount of fertilizers was adjusted to 2012 costs, thus an overall total cost difference is reflected between the alternatives.
Figure 23: Life Cycle Costs – Modules
8.3. Eco-efficiency Analysis Portfolio:
The eco-efficiency analysis portfolio for the Controlled Release Fertilizer EEA has been generated as defined in Section 9.5 of the BASF EEA methodology. Utilizing relevance and calculation factors, the relative importance of each of the individual environmental impact categories are used to determine and translate the fingerprint results to the position on the environmental axis for each alternative shown. For a clearer understanding of how weighting and normalization is determined and applied please reference Section 8 of BASF’s Part A submittal to P-352. Specific to this study, the worksheets “Relevance” and “Evaluation” in the EEA model provided to NSF as part of this verification process should be consulted to see the specific values utilized and how they were applied to determine the appropriate calculation factors. Specific to the choice of environmental relevance factors and social weighting factors applied to this study, factors for the USA (national average) were utilized. The environmental relevance values utilized were last reviewed in 2012 and the social weighting factors were recently updated in 2009 by an external, qualified third party organization2. Figure 24 displays the eco-efficiency portfolio for the base case analysis and shows the single application Gal-XeONE CRF fertilizer blend being the most eco-efficient alternative. This is due to its preferred environmental position as the lifecycle costs for each alternative were equivalent. The Gal-XeONE CRF fertilizer blend is almost 12% more eco-efficient than the conventional fertilizer program conducted by US Sugar.

Copyright © 2013 BASF Corporation
28
Figure 24: Eco-efficiency Portfolio – Controlled Release Fertilizers – Sugarcane Florida
9. Data Quality Assessment
9.1. Data Quality Statement:
The data used for parameterization of the EEA was sufficient with most parameters of high data quality. Moderate data is where industry average values or assumptions pre-dominate the value. No critical uncertainties or significant data gaps were identified within the parameters and assumptions that could have a significant effect on the results and conclusions. The Eco-profiles utilized were deemed of sufficient quality and appropriateness considering both the geographic specificity of the study as well as the time horizon considered. Table 11 provides a summary of the data quality for the EEA.

Copyright © 2013 BASF Corporation
29
Table 11: Data Quality Evaluation for EEA Parameters
10. Sensitivity and Uncertainty Analysis
10.1. Sensitivity and Uncertainty Considerations:
A sensitivity analysis of the final results indicates that the environmental impacts were more influential or relevant in determining the final relative eco-efficiency positions of the alternatives. This conclusion is supported by reviewing the BIP Relevance (or GDP-Relevance) factor calculated for the study. The BIP Relevance indicates for each individual study whether the environmental impacts or the economic impacts were more influential in determining the final results of the study. For this study, the BIP Relevance indicated that the environmental impacts were significantly more influential in impacting the results than the economic impacts (reference the “Evaluation” worksheet in the Excel model for the BIP Relevance calculation). The main assumptions and data related to environmental impacts were:
Fertilizer Type and Application Rates
Field Emissions
Parameter Quality
Statement Comments
Fertilizers
Conventional N-P-K & Minerals
Moderate - High
Boustead V 5.0.12 BASF Ecoinvent v2.2
CRF Manufacturing High Florikan E.S.A. Corp.
Application Rates High Florikan E.S.A. Corp. US Sugar Inc.
Field Emissions High
Bouwman, Boumans & Batjes, Global Biogeochemical Cycles, Vol 16, Nr. 4, 1080 2002; IPCC Guidelines for National Greenhouse Gas Inventories; Vol 4. Chapter 11, Table 11.1 2006; EPA Report; EPA Contract No. 68-D-02-064
Water Emissions Moderate-
High
Hayo M.G. van der Werf Dr. (INRA - Institut National de la Recherche Agronomique) BASF; Washington State Dept of Agriculture and Washington State Dept of Ecology 2007
Sugarcane Crop yields High Field Tests, US Sugar Inc. 2009/2010
Sugarcane crop nutrient uptake High Field Tests, US Sugar Inc. 2009/2010
Logistics Moderate-
High
U.S. Life Cycle Inventory Database." (2012). National Renewable Energy Laboratory, 2012. PE Americas (now PE International)
Costs
Conventional and CRF
Moderate-High Supplier (Florikan® E.S.A. Corp.) 2012
Fertilizer Applications High 2012 Iowa Farm Custom Rate Schedule

Copyright © 2013 BASF Corporation
30
As the data quality related to these main contributors was of at least moderate-high quality, this strengthened our confidence in the final conclusions indicated by the study. A closer look at the analysis (see Figure 25) indicates that the impact with the highest environmental relevance was the emissions category (water specifically) followed by toxicity potential, risk potential and resource consumption. This is to be expected, as the previous discussions highlighted the significance of the direct and indirect air and water emissions from fertilizer use.
Air and water emissions are by far the most important in the emissions category. More specifically, AP and GWP are considered the two most important air emissions, which is not surprising as these emissions are strongly related to fossil fuel usage (fertilizer manufacturing, energy consumption) as well as field emissions (N2O and CO2 (GWP) and NH3 (AP)).
The calculation factors (Figure 27), which considers both the social weighting factors and the environmental relevance factors, indicate which environmental impact categories were having the largest effect on the final outcome. Calculation factors are utilized in converting the environmental fingerprint results (Figure 22) into the final, single environmental score as reflected in our portfolio (Figure 24). The impacts with the highest calculation factors were basically the same as those with the highest environmental relevance factors, with regards to the six main impact categories. The input parameters that were related to these impact categories have sufficient data quality to support a conclusion that this study has a low uncertainty.
The social weighting factors (Figure 26) did have an influence in adjusting the relative weightings of a few impact categories represented in the emissions and air emissions sub-categories. Higher societal relevance for air and solid waste emissions helped increase their respective weighting relative to water emissions. Likewise, GHG emissions received the highest societal relevance in the air emissions category and thus increased its respective weighting relative to all the other air emissions. This led to an almost 50% increase in its weighting factor while the AP weighting factor (environmental relevance factor vs. calculation factor) decreased by more than 33%.

Copyright © 2013 BASF Corporation
31
Figure 25: Environmental Relevance Factors that are used in the Sensitivity and Uncertainty Analyses
Figure 26: Social Weighting Factors that are used in the Sensitivity and Uncertainty Analyses

Copyright © 2013 BASF Corporation
32
Figure 27: Calculation Factors utilized in the Sensitivity and Uncertainty Analyses
10.2. Critical Uncertainties:
There were no significant critical uncertainties from this study that would limit the findings or interpretations of this study. The data quality, relevance and sensitivity of the study support the use of the input parameters and assumptions as appropriate and justified.
10.3 Sensitivity Analyses
10.3.1 Scenario #1 Florida Citrus Crop Application
This scenario looked at comparing a conventional fertilizer blend for mature citrus crops in Florida versus both a single and double application controlled release fertilizer blend from Florikan ®. This scenario focused on mature citrus crops being produced on sand ridge soils which are extremely prone to nutrient leaching. Heavy rainfall on these sandy ridges can significantly increase the nutrient leaching and thus growers traditionally apply much more conventional fertilizers than recommended in order to compensate for this nutrient loss. Through the use of a controlled release fertilizer a net reduction in total pounds of N and K nutrients applied to the crop can be achieved while still achieving the desired nutrient levels and resulting crop yields in the citrus trees. For this scenario, the coverage area was 1 acre of citrus crop for each alternative and field tests confirmed crop yield and plant health were consistent between the three alternatives.
Copyright © 2013 BASF Corporation
33
The three alternatives considered included:
1. Standard four (4) application program of traditional fertilizers totaling 1450 pounds.
2. A single 1000 pound application of both conventional and controlled release fertilizer.
3. A combination approach of applying an initial conventional fertilizer blend (350 pounds) followed by a second application (650 pounds) of a combined controlled release and conventional fertilizer blend.
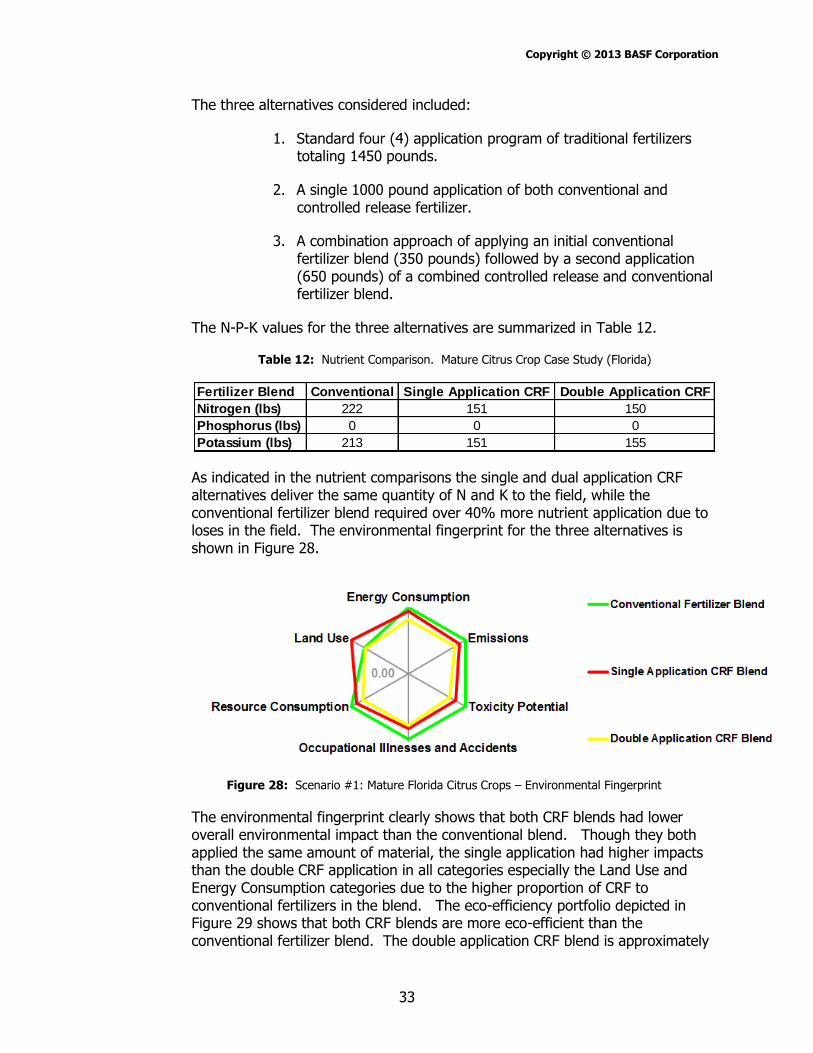
The N-P-K values for the three alternatives are summarized in Table 12.
Table 12: Nutrient Comparison. Mature Citrus Crop Case Study (Florida)
Fertilizer Blend Conventional Single Application CRF Double Application CRF
Nitrogen (lbs) 222 151 150
Phosphorus (lbs) 0 0 0
Potassium (lbs) 213 151 155
As indicated in the nutrient comparisons the single and dual application CRF alternatives deliver the same quantity of N and K to the field, while the conventional fertilizer blend required over 40% more nutrient application due to loses in the field. The environmental fingerprint for the three alternatives is shown in Figure 28.
Figure 28: Scenario #1: Mature Florida Citrus Crops – Environmental Fingerprint
The environmental fingerprint clearly shows that both CRF blends had lower overall environmental impact than the conventional blend. Though they both applied the same amount of material, the single application had higher impacts than the double CRF application in all categories especially the Land Use and Energy Consumption categories due to the higher proportion of CRF to conventional fertilizers in the blend. The eco-efficiency portfolio depicted in Figure 29 shows that both CRF blends are more eco-efficient than the conventional fertilizer blend. The double application CRF blend is approximately

Copyright © 2013 BASF Corporation
34
12% more eco-efficient than the single application and 25% more eco-efficient than the conventional application.
Figure 29: Scenario #1: Mature Florida Citrus Crops – Eco-efficiency Portfolio
10.3.2 Scenario #2 Florida Turf and Sod Application
Proper fertilization and application techniques are essential to the health and quality of turfgrass. Research11 has shown that the use of controlled release fertilizers can be beneficial to the health and development of turfgrass. This scenario looked at comparing a conventional fertilizer blend for turf grass/sod maintenance in Florida versus a single application controlled release fertilizer blend from Florikan®. Similar to the citrus crop scenario this analysis was designed to show the versatility and effectiveness of controlled release fertilizers for various agricultural and horticultural applications and to consider a broader measure of economic and environmental impacts than have been previously evaluated.
For this analysis, 360 pounds of a conventional fertilizer blend was compared against 250 pounds of a single application CRF blend. Table 13 shows the delivered nutrient (N-P-K) levels applied to the turfgrass for each of the two alternatives. As discussed previously in this report, better resistance to leaching and volatilization allows less CRF fertilizer to be applied to the turf grass than conventional fertilizers.
For this scenario, the coverage area was 1 acre of turf grass for each alternative and field observations confirmed turf grass health and appearance were consistent between the three alternatives.

Copyright © 2013 BASF Corporation
35
Table 13: Nutrient Comparison. Turf Grass Case Study (Florida)
Fertilizer Blend Conventional Single Application CRF
Nitrogen (lbs) 80 55
Phosphorus (lbs) 7 4
Potassium (lbs) 41 30
Figures 30 and 31 clearly show that the CRF fertilizer blend had significantly lower environmental impact in all six key environmental impact categories and was a more eco-efficienct alternative than the convetional fertilizer blend. The CRF blend also delievered a slightly lower lifecycle cost than the convetional fertilizer program.
Figure 30: Scenario #2: Florida Turfgrass – Environmental Fingerprint
Figure 31: Scenario #2: Florida Turfgrass – Eco-efficiency Portfolio

Copyright © 2013 BASF Corporation
36
10.3.3 Scenario #3 Reduction in Field Emissions for Controlled Release Fertilizers
The base case study assumed no reduction in direct field emissions (e.g. N2O, NH3), leaching or indirect field emissions for the controlled release fertilizer alternative. As previously discussed, field emissions and leaching rates are highly dependent on variables such as soil type, climate conditions, field management practices, etc. However, research8, 9, 10 does exist to support the assumption that under some conditions these emissions rates can be noticeably reduced (potential 25% - 80% reduction) through the use of CRF technology. This scenario will show only a conservative 30% reduction in order to assess the potential environmental significance and eco-efficient improvement possible through reductions in field emissions. Figure 32 shows the environmental fingerprint for this scenario. A significant improvement in the emissions category for the Gal-XeONE CRF blend relative to the base case analysis is demonstrated.
Figure 32: Scenario #3: Base Case Analysis (sugarcane) – Field Emisions Reductions for CRF
Relevance factor for Emissions stayed approximately the same at around 54% with a slight increase in the water emissions relevance factor. The Gal-XeONE
CRF single application enhanced its relative environmental performance by approximately 7%. Eco-efficiency improvement relative to the conventional fertilizer blend was improved by almost 8%. As expected, this scenario shows that technology and product enhancements that can reduce field emission loses can directly contribute to significant improvements in overall eco-efficiency.
11. Limitations of EEA Study Results
These eco-efficiency analysis results and its conclusions are based on the specific comparison of the production, use, and disposal, for the described customer benefit, alternatives and system boundaries. Transfer of these results and conclusions to other production methods or products is expressly prohibited. In particular, partial results may not be communicated so as to alter the meaning, nor may arbitrary generalizations be made regarding the results and conclusions.

Copyright © 2013 BASF Corporation
37
12. References
1 Boustead Consulting Ltd UK, The Boustead Model 5.1.2600.2180 LCA database 2 TNS Infratest Landsberger Strasse 338 Munich Germany 80687
3 Development of a US Truck Transportation LCI dataset, Fredholm, Susan et. al.; PE
Americas; Joint North American LCA Conference XI. October 2009
4 Ecoinvent v2.2; Swiss Center for Life Cycle Inventories http://www.ecoinvent.org/database/
5 U.S. Life Cycle Inventory Database. (2012). National Renewable Energy Laboratory, 2012. Multiple individual sources. https://www.lcacommons.gov/nrel/search
6 Franklin Associates 2003 Data Details for Locomotive Transportation (Diesel); Center for Transportation Research, Argo 2001 GREET Version 1.6 https://www.lcacommons.gov/nrel/search
7 European Commission, eurostat http://epp.eurostat.ec.europa.eu/statistics_explained/index.php/Glossary:Statistical_classification_of_economic_activities_in_the_European_Community_(NACE)
8 Controlled-Release and Stabilized Fertilizers in Agriculture, Trenkel, Martin E. Dr.; Published by the International Fertilizer Industry Association; December 1997 ISBN 2-9506299-0-3
9 New Leads on Nitrous Oxide; Agricultural Research (a USDA-ARS publication); November – December 2009 pgs. 8-9
10 REDUCED RATES OF CONTROLLED-RELEASE FERTILIZER LOWER POTENTIAL NITROGEN LEACHINGFROM A WISCONSIN BARE-ROOT TREE NURSERY; Fujinuma, Ryosuke et. al.; Proceedings of the 17th Central Hardwood Forest Conference; 2011
11 Comparison of Controlled-Release Nitrogen Fertilizers on Turfgrass in a Moderate Climate; Zhang M. et. al.; HortScience volume 33(7) December 1998
12 Monitoring Potential Degradation of Polyurethanes in a Landfill Simulator; Brown, W.E. et. al. Carnegie Mellon University and Bailey, R.E. Bailey Associates; Final Report to the Alliance for the Polyurethane Industry; June 2001
13 Hydrolytic Stability of Toluene Diisocyanate and Polymeric Methylenediphenyl Diisocyanate Based Polyureas under Environmental Conditions; Bailey, R.E. et. al.; Environmental Science and Technology vol. 38 no. 4 2004. Pages 1066 – 1072.
14 Gilbert, R.A., Rice, R.W., and Lentini, R.S. 2008. EDIS Publication SS-AGR-227,
Characterization of Selected Mineral Soils Used for Sugarcane Production
(http://edis.ifas.ufl.edu/SC027). University of Florida/IFAS, Gainesville, FL 32611
15 Bouwman, Boumans & Batjes, Global Biogeochemical Cycles, Vol 16, Nr. 4, 1080 2002

Copyright © 2013 BASF Corporation
38
16 2006 IPCC Guidelines for National Greenhouse Gas Inventories; Volume 4. Chapter 11,
Table 11.1
17 EPA Report; EPA Contract No. 68-D-02-064 (Direct NH3 emissions data only); Soil Group 2
18 2006 IPCC Guidelines for National Greenhouse Gas Inventories; Vol. 4, Chapter 11, Table
11.4.2
19 2006 IPCC Guidelines for National Greenhouse Gas Inventories; Chapter 11, Table 11.3
20 Hayo M.G. van der Werf, Agricultural Systems, 2005
21 Expert Opinion; Dr. Gregor Pasda, BASF SE, 2011
22 Washington State Dept. of Agriculture and Washington State Dept. of Ecology; Report to
Legislature, 2007