submission 49 - act government - horizontal fiscal ... · web viewsubmission to the productivity...
TRANSCRIPT

AUSTRALIAN CAPITAL TERRITORY
Submission to the Productivity Commission Inquiry into Horizontal Fiscal Equalisation
June 2017
Chief Minister, Treasury and Economic Development Directorate


Contents
1 KEY ISSUES RAISED BY THE PRODUCTIVITY COMMISSION.....................4
2 OVERVIEW..........................................................................................12
3 BACKGROUND – ACT SPECIFIC.............................................................16
4 PART I – THE IMPACT OF THE HFE SYSTEM ON THE AUSTRALIAN
COMMUNITY, ECONOMY AND STATE GOVERNMENTS..............................20
4.1 The Fundamental Objectives of HFE.....................................................................20
4.2 HFE and Economic Welfare..................................................................................21
4.3 HFE and State Reform...........................................................................................25
4.3.1 State Reform – First Order Effects................................................................25
4.3.2 State Reform – Second Order Effects............................................................28
4.3.3 Overall Incentive Effects of the HFE System..................................................33
4.4 HFE and State Fiscal Management.......................................................................34
5 PART II – OPTIONS TO REPLACE THE CURRENT HFE SYSTEM................36
5.1 Options for Change within the Current HFE Framework......................................36
5.1.1 Adjustments for Second Order Effects of Reform.........................................36
5.1.2 Reform Infrastructure Funding.....................................................................36
5.1.3 Extend Equalisation to Other Commonwealth Government Transfers.........38
5.2 Options for Change outside the Current HFE Framework....................................38
5.2.1 National Needs-Based Funding – Replacing Expenditure Equalisation.........38
5.2.2 Remove Minerals and Energy Resources from Equalisation.........................40
5.2.3 Reduce VFI through Federation Reform and Tax Sharing.............................42
2

5.2.4 Federal Financial Relations without Equalisation..........................................43
5.3 Overseas Experience – Federal Polities................................................................44
6 REFERENCE LIST..................................................................................46
7 ATTACHMENTS...................................................................................48
7.1 ATTACHMENT A....................................................................................................50
7.2 ATTACHMENT B....................................................................................................52
7.3 ATTACHMENT C....................................................................................................54
7.4 ATTACHMENT D....................................................................................................55
7.5 ATTACHMENT E....................................................................................................75
7.6 ATTACHMENT F....................................................................................................81
7.7 ATTACHMENT G....................................................................................................83
7.8 ATTACHMENT H....................................................................................................85
7.9 ATTACHMENT I.....................................................................................................91
3

1 KEY ISSUES RAISED BY THE PRODUCTIVITY COMMISSION
1. How does the current HFE system impact the Australian community, economy and State and Territory Governments?
a – Is the current HFE system getting in the way of States pursuing economic growth and productivity, and at the expense of higher national prosperity? If so, how?
The Australian Capital Territory’s (ACT) analysis indicates that while there are incentives
created by the current HFE system that may lead to the States and Territories (the States)
avoiding policies that stimulate economic and productivity growth, they are limited in their
potential impact on State finances. Further, there are many other factors in consideration
when States design economic policy. Consequently, the impact of the HFE system on
economic growth at the national level is likely to be minimal.
b – What evidence is available on whether and how the current HFE system affects the movement of labour and capital across State borders, particularly if a region is experiencing high labour demand?
Literature review by ACT indicates that there may be incentive effects of HFE on labour
movement. However, research indicates that the extent to which these incentives impact
economic efficiency is quite small and there is no consensus on whether it causes an
efficiency gain or efficiency loss. All considered, the ACT argues that there is no material
impact on economic efficiency through incentives or disincentives to labour movement
through the HFE system.
c –Does the current HFE system create perverse incentives or unintended consequences for reform at the State level? What evidence is there on how these incentives affect State policies and ultimately outcomes for the Australian community?
Does the HFE system impede State tax reform over time, including States’ decisions on developing their revenue bases and rates? If so, how and to what extent?
Previous investigations on this topic indicate that there is no clear evidence that the HFE
system creates direct incentive effects on State tax policies. However, there are indirect
effects from tax elasticity that may influence State decisions and the ACT recommends that
the Productivity Commission (the Commission) consider amendments to the HFE system to
address these effects.
4

Does the HFE system impede the efficiency of State service delivery, infrastructure investment and policies affecting where people live? If so, how and to what extent?
The ACT considers the claim that the current HFE system incentivises inefficiency in public
service delivery has no foundation, a conclusion which has been clearly demonstrated by the
Commonwealth Grants Commission (CGC) and endorsed by the GST Distribution Review.
Some of the perceived inefficiencies are the product of administrative scale effects, which
require smaller States to maintain higher per capita levels of public service staffing.
Is policy neutrality adequately addressed under the average state policy approach? Why or why not?
Averaging of State policies has generally proved to be an effective means of providing for
policy neutrality, with the exception of revenue or expenditure categories which are very
unevenly distributed on a per capita basis between States. The only category where this is a
concern in practice is that of mining revenue, where some States have a very large share of
the national endowment of some minerals. The ACT has suggested alternative approaches
which might be adopted in the design of the HFE system to cater for this problem.
d - Does the current HFE system influence policies to facilitate, restrict or tax the development of economic activity, and in particular energy and mineral resources?
As with economic growth in general, while HFE creates some disincentives in principle to the
development of economic activity, the ACT considers these disincentives to be minor
compared to other considerations in the design of economic policy. The ACT also notes that
the impacts on State finances of adjustments to the HFE system to account for costs of mining
and other economic development that are not already equalised are not likely to have a
significant impact on the distribution of GST. Moreover, the prospectivity of mineral and
energy resources is as much, if not more, of a consideration for the development of mining
industries as jurisdictional policy settings.
e – How does the current CGC relativity process affect States’ fiscal management from year to year and over time? How does this affect policy outcomes and economic activity in each State?
5

Does the current process impact the ability and propensity for States to manage budgets through cycles, especially for those states relatively more reliant on large and volatile revenue streams?
The current process has some negative impact on the effectiveness of States’ budget
management. This impact results from a number of factors, including the lags built into the
HFE process and the volatility of some revenue sources. However, measures to address these
impacts are likely to decrease volatility of total revenues for some States and increase
volatility of total revenue for others.
How does data reliability and the three-year averaging process affect fiscal management? Is there a better trade-off between GST relativity precision and timeliness?
The ACT contends that there is room for improvement in this area and proposes a
modification of the current approach to improve the contemporaneity of the CGC’s
assessments without drastically reducing the accuracy of the relativities. The ACT stresses that
this proposal is a refinement of the CGC’s current assessment processes and would retain the
underlying framework of the HFE system and the CGC’s assessments.
What is the ability (and track record to date) of States to project and anticipate their own GST relativities, including any impacts of major State initiatives?
The ACT contends that, while large States may have the capacity to estimate their relativities
with some accuracy, small States have very limited resources and their relativities are too
heavily influenced by the economic and fiscal outcomes of the large States for them to be
reliably forecast. Accordingly, the ACT does not attempt to estimate its GST relativities across
the budget out years.
What resources do individual States expend dealing with HFE matters?
The ACT has a team of three full-time equivalent officers to deal with all HFE matters, as well
as all other responsibilities concerning federal financial relations. HFE matters consume a
significant proportion of this resource, particularly during CGC Methodology Reviews and
during other reviews such as the current inquiry by the Commission.
6

2. What preferable alternatives are there to the current HFE system (as adopted by the CGC in its calculation of GST relativities) of equalising States’ fiscal capacities?
a - What should be the objective of HFE?
This submission contends that the sole objective of HFE is equity across States, in terms of
ensuring that each State has the fiscal capacity to provide its residents with the services and
associated infrastructure at the same standard. While considerations of economic efficiency
are important, this submission stresses that in a trade-off between equity and efficiency, the
former should prevail over the latter. Of course, if there are ways to improve efficiency
without affecting equity adversely, such measures should be given due consideration. That
said, the ACT considers that the system of HFE has a very limited effect on economic
efficiency.
Should HFE address fiscal divergences across States due to both structural factors (beyond State influence) and cyclical factors (beyond State influence)? If so, over what time period should this be achieved?
The ACT believes that HFE should primarily address fiscal divergence across States due to
structural factors, since they significantly impact States’ revenue raising capacity and/or
expenditure needs on ongoing basis. On the other hand, the ACT contends that addressing
shorter-term objectives like cyclical differences between States should not be a fundamental
objective of HFE. It can be a secondary or supporting principle. Nevertheless, it is important
that both be considered with regard to the current circumstances of States.
Should HFE compensate States for fiscal divergences where a State has by choice diverged from efficient tax arrangements and service delivery?
This submission contends that States should not be compensated for inefficient tax
arrangements or service delivery, especially if a State has diverged from efficient tax
arrangements and service delivery as a matter of choice. At the same time, States should not
be penalised for efficiency in their tax regimes and service delivery.
7

Should past State policy decisions (such as on economic development, revenue bases and rates, or budget provisioning) influence the form or degree of fiscal equalisation? If so, how?
The ACT considers that in situations where reforms undertaken by States affect their revenue
raising capacity or expenditure needs, the HFE system must not operate in a way that it
penalises such reforms. Such “second order” effects should be explicitly accounted for (e.g.
through elasticity adjustments), which does not happen at present. To this extent, State policy
decisions of the recent past (that is, which affect assessment years which are still in play)
should influence fiscal equalisation.
What are the advantages and disadvantages of targeting full versus partial fiscal equalisation across States?
Full fiscal equalisation enables each State to have the fiscal capacity to provide their residents
with services and associated infrastructure at the same standard as other States. As
implemented in Australia, equalisation has minimal adverse impact on economic welfare. So,
full fiscal equalisation has merit from both an equity and efficiency perspective.
Partial fiscal equalisation, on the other hand, would not achieve the fundamental equity
objective of HFE and may adversely affect efficiency, depending on the details of its design.
Partial fiscal equalisation which omits or discounts major components of fiscal capacity, such
as mining revenues, would be both inequitable and inefficient.
There is anecdotal evidence that having no fiscal equalisation in a federated economy
operating under a single currency can have significant detrimental effects on economic
growth, social cohesion and social equity. Such outcomes are likely to require significant
public spending with an associated secondary impact on economic welfare through higher
taxes and/or lower public investment in other more productive uses.
8
To what extent should States be held accountable for how they use funds received via equalisation?
States are accountable to their own electorates for the use of the funds, as it will be expected
that they be spent for the welfare of the State and its citizens and informal comparisons can
be made with how other States spend their allocations, which is arguably the most effective
accountability mechanism possible in a democratic system.
Funds received via equalisation are received in the form of Commonwealth grants, with
revenue from the GST acting as the pool of funds from which transfers are made. These are
untied funds which States are free to spend according to their own priorities. This approach
maximises potential economic welfare from use of the funds, given that they are allocated at
government level and not to individuals, but reduces the Commonwealth’s accountability for
the funds. The untied nature of the grants is a reflection of the sovereignty of States and their
constitutional responsibility for the functions on which their expenditures are made.
b - What are some alternatives to the current system and how would they affect States’ incentives to pursue higher prosperity? How would the alternatives perform, relative to the current system, in terms of efficiency, equity and simplicity, and ultimately which approach is best for national productivity and wellbeing?
Notwithstanding that the ACT remains a strong supporter of the current HFE system, the ACT
presents four significant changes which lie broadly within the current HFE framework, and
three options for fundamental change to the HFE framework. The alternatives suggested
within the purview of current HFE framework are: a) adjustments for second order effects of
reform; b) reform in infrastructure funding and c) extension of equalisation to other
government transfers. All of these options should improve equity outcomes.
The options for change outside the current HFE framework are: a) replacing expenditure
equalisation with national needs-based funding; b) removing minerals and energy resources
from equalisation; and c) reduction of Vertical Fiscal Imbalance (VFI) through federation
reform and tax sharing. Option a) would not affect equity adversely while options c) would.
Option b), if it involves a national system of resource taxation, would not affect equity
adversely and would be economically more efficient; while option a) could improve economic
efficiency by better targeting of expenditure to those who benefit most from it.
For completeness the ACT has suggested that the Commission consider the implications of a
federal financial relations framework without equalisation.
9

c - How do these alternative approaches fit within the wider scheme of federal financial relations? Are some inequalities across States better dealt with outside the HFE system?
All the alternative approaches suggested fit within the wider scheme of federal financial
relations. However, this submission indicates some inequalities across States could be dealt
with outside the current HFE system.
d - What practices in other federations offer pertinent evidence for the Commission’s considerations?
A comparison of HFE across federations like Belgium, Canada, Germany and Switzerland
reveals commonalities and differences with regard to the Australian HFE system. At the same
time, none of these differences are such that they invalidate the Australian HFE system with
regard to the goal of attaining horizontal equity among States. In fact, Australia is regarded as
having the most comprehensive HFE system in the world.
10
THIS PAGE LEFT INTENTIONALLY BLANK
11

2 OVERVIEW
While there is a broad consensus that the federal financial relations framework is relatively stable, underpinned by strong institutional and governance systems with reforms only undertaken when all parties agree, there are emerging problems with no clear path to reform. Although the States enjoy a strong degree of constitutional autonomy, with major rules articulated in Australia’s constitution, their fiscal sustainability in the longer term is in need of fundamental reform, an overall strategic approach to which has yet to emerge.
Indeed, it could be stated that federal financial relations is in a state of flux with piecemeal options for reform under consideration or awaiting further developments. Both the Goods and Services Tax (GST) distribution between the States and non-GST funding arrangements in the longer term are mired in some degree of uncertainty. Each is characterised by ongoing reviews which continues to create uncertainty for the States from both a budgeting and service delivery perspective.
The termination by the Commonwealth Government in 2016 of major national initiatives to reform the Federation and the Tax System initiated after the 2013 Federal Election has left the sphere of federal financial relations without a clear or comprehensive pathway for reform and renewal.
The unprecedented actions of the Commonwealth Treasurer of late to release the Terms of Reference [in April 2017] tasking the Commission to undertake its inquiry into the impact on the national economy of Australia’s system of Horizontal Fiscal Equalisation (HFE), while unexpected, is viewed by the ACT as a welcome addition to the national debate. This inquiry, in parallel with previously issued Terms of Reference to the CGC in late 2016 to undertake a review of the methodology underpinning the system of HFE presents an opportunity for all parties to once and for all participate in an ongoing national discussion on this vexed issue in a transparent and timely fashion.
For its part, the ACT has always adopted the view that ongoing support for equalisation can best be strengthened through a process that allows issues of concern to be addressed. A far reaching review of equalisation, including its underlying purposes and objectives in the context of the changing circumstances of jurisdictions and changes in thinking about the way services are provided should be undertaken at varying intervals. That said it is a matter for governments to ultimately settle on the final architecture of any system if they judge it desirable. The Commission can do no more than express their strong view that they think there would be value in doing so.
12

Effectively, the Commission review should be viewed as a starting point for a renewed impetus across all jurisdictions to explore and possibly settle on an alternative, but viable approach to the disbursement of federal funds within the federation which will ultimately improve economic efficiency and productivity in Australia.
In approaching the task, the ACT again contends that fiscal equalisation remains central to intergovernmental financial arrangements in Australia. The ACT understands the concerns that are being expressed by critics of the system but contends they are to be less about the need for equalisation arrangements and more about whether the current approach continues to be justified. Important issues of concept and principles are the matters most commonly raised.
In effect, this inquiry stems from some States and commentators suggesting Australia’s approach to HFE does not sufficiently recognise the differences between states’ individual circumstances nor states’ efforts to manage those circumstances, thereby creating disincentives for reform, including reforms to enhance revenue raising capacities or drive efficiencies in spending. Or put simply, what needs to be addressed is whether these claims and concerns ‘stack up’ in the sense that any gains from reform and economic development are effectively redistributed to other States.
To kick start the process, the initial specific task for the Commission is one to consider and report on the influence the current HFE system has on productivity, efficiency and economic growth, including the movement of capital and labour across state borders; the incentives for the States to undertake fiscal (expense and revenue) reforms that improve the operation of their own jurisdictions and on the States’ abilities to prepare and deliver annual budgets.
The ACT’s submission makes the crucial observation that the former Gillard government commissioned a similar review of the GST distribution system in 2011-2012, which was led by former state premiers John Brumby and Nick Greiner. It recommended no major changes, largely backing the current system. The ACT urges the Commission to review not only the final report from this inquiry, but also the interim reports and associated submissions, as a number of issues were signed off during the course of the review and not canvassed in the final set of recommendations.
The ACT argued at the time and has not changed its view since that the current approach to HFE continues to achieve the goals of the equalisation system. Given the zero-sum nature of the GST distribution under HFE, it is not surprising that the system generates friction between States. However, the concerns identified in the terms of reference for this latest review have in most cases been thoroughly addressed in previous reviews, which have validated the effectiveness and fairness of the current approach to HFE.
13
These matters are addressed in Part One of the ACT Submission:
The main objective of equalisation is to achieve equity of community access to services. The available evidence supports the view that the impact of HFE on economic efficiency is quite small and well within an acceptable level of ‘trade off’ with the equity objective. Indeed, HFE may enhance economic efficiency as it can operate to offset fiscally induced migration of capital and labour between States.
The CGC has established conclusively that the HFE system has virtually no impact on the efficiency of service delivery and that States overwhelmingly get to keep the benefits of reforms which enable services to be delivered at lower cost. Similarly, States keep the benefits of measures to improve the effectiveness of revenue raising from their existing tax bases. These conclusions were recognised by the Brumby/Greiner review.
However, the ACT has previously raised and, in keeping with the Commission’s request for submissions has done so again, the need for the CGC to reform certain existing approaches to the assessment framework. These are covered off in Part One of the submission, centred around:
Changes to take account of the effects of State tax reform measures on underlying tax bases, via so-called “elasticity adjustments”. The current system of HFE allows for such adjustments to be made, which would offset any disincentives for State tax reform.
Adjustments to allow for State expenditure on economic development which increases the size of State tax bases. Such adjustments must take account of the fact that all States actively pursue economic development and that the effectiveness of this expenditure in enhancing tax bases may differ across jurisdictions. The effects of such investment by States also need to be distinguished from differences in natural endowments, which can be a fundamental driver of States’ ability to generate own-source revenue.
Again, in keeping with the request from the Commission for a reform oriented focus, the ACT in Part Two of the submission also canvasses a number of alternative options to the current HFE system.
Regardless of options the ACT would encourage the Commission to adopt a broad focus on the totality of the operations of the federal financial relations framework encompassing all transfers by the commonwealth to the States and not one focused purely on alternative GST distribution models.
Within this structure, the ACT as an independent territory of the federation receives federal funding commensurate with its State counterparts, while also receiving funding in recognition of its unique circumstances as a city/state in a national capital setting and as a
14

major regional centre. These special circumstances warrant specific consideration regardless of which approach the Commission ultimately adopts. They go to the fundamental core of the ACT’s self government model and must be transparent to all Australians.
Finally, whatever direction the Commission might take in its final report the one lesson the ACT took from the GST Distribution Review exercise was recognition of the need for strong supporting protocols and governance arrangements to accompany any revised framework. All States continue to have concerns about the governance of the current HFE system. Unfortunately, many of the recommendations of the GST Distribution Review in this space have not seen the light of day but remain relevant more so today than ever. Specifically, governance arrangements for any system must reflect the need for the States and the Commonwealth to act as joint stewards of the system, rather than competitors or critics.
Similarly, effective communication and transparency of process are essential for public confidence in any HFE system and federal financial relations more broadly. Ultimately, whatever system arises from the review, it must be able to be clearly understood as to how the system works with full transparency of the process and confidence in the system paramount.
15
3 BACKGROUND – ACT SPECIFIC
While the ACT appreciates the main focus of the review is to undertake an inquiry into HFE, the terms of reference are both broad and reform oriented.
It is important from this perspective the Commission understand the context in which the ACT has supported the HFE framework since self government, one not simply premised on the fact that it is currently a recipient government within the system.
The successful integration of the ACT as the last jurisdiction to enter the Federation is living proof of the effectiveness of the present intergovernmental framework. In doing so a unique entity has been created, able to influence the national debate in many different ways, which are not dependent on fiscal capacity, population size or economic strength.
This integration has been achieved in a relatively short span of only 28 years. The ACT Federal Territory, previously administered by the Federal Parliament, has successfully transitioned into the federation as a fully independent member with most of the rights and privileges that integration brings with it. This was a major achievement in its own right and one that should be held up as an example of the flexibility of the framework that underpins the Federation. HFE was a major contributing factor, being implemented as a result of four ACT-specific reviews undertaken by the CGC - two prior to self government and two thereafter, leading to the adoption of a relativity for the ACT for the first time in the late 1990’s.
This transition took into account (and continues to do so today) the special circumstances of the ACT, which has led to its unique characteristics being addressed principally by the CGC through the exercise of the HFE principle. The ACT has many different characteristics to the other States:
Its city-State legislature, combining responsibility for State and local government that has no counterpart in the Federation;
Its unique role as the National Capital and Seat of Government and home to the Australian Public Service with economic and financial consequences for the ACT;
Ownership of all land by the Commonwealth, with planning shared between the Commonwealth and ACT governments;
The limits imposed on the city’s size and development by the ACT’s natural features;
The continued existence of Commonwealth legacies from the pre self-government era with flow-on implications for ACT Government services;
16

A home to 400,000 Territorians with a different demographic profile to most other jurisdictions with consequential implications for service delivery;
A markedly different economic base, reliant on the public sector and lacking in substantial manufacturing, primary industries and resources; and
A markedly different geographical and physical locality with the ACT a land-locked island within NSW, the only jurisdiction with 100per cent of its population living within 25 kilometres of another jurisdiction and thus creating cross border considerations at an unprecedented level.
This unique setting has been overlaid with a raft of compensatory financial mechanisms to ensure the financial and sustainable existence of the ACT as a fully functioning member of the Federation:
It does have the capacity to raise its own source revenues and does receive federal funding commensurate with its State and NT counterparts while also receiving funding in recognition for its unique circumstances.
Importantly, however, this co-existence is highly dependent on the Commonwealth Government of the day upholding its responsibilities for the unique pillars underpinning the National Capital.
This uniqueness has played an important role in the manner in which the ACT approaches public policy particularly when responding to national reform agendas. Often the ACT will lead the way by introducing innovative approaches to service delivery or entering reform schemes ahead of other jurisdictions across the spectrum of public policy. Some recent examples follow:
State Tax Reform;
First jurisdiction to transition to the NDIS;
Early acceptance of the agreements underpinning National Health & Education Reforms;
First jurisdiction to enter the Asset Recycling Initiative;
Engagement with the region with the ACT–NSW Government regional collaboration MOU, the ACT-Canberra Region Joint Organisation (CBRJO) MOU and the ACT-Queanbeyan Palerang Regional Council agreements;
17

Driven innovation in the community and the public service with implications for other jurisdictions;
Smart parking; created Office of the Chief Digital Officer driving a digital strategy across all services; created Access Canberra combining different regulatory teams of government into one integrated service – first of its kind in Australia; and established a whole of government approach to government communications and engagement; and
Combined corporate, finance and ICT services within government into one office that services the needs of the ACT Departments (Directorates).
All this, while still delivering normal government business in the form of important services to the community, releasing land, building infrastructure, conducting inspections, collecting revenue, responding to community enquires and maintaining important assets and community facilities.
Hence, through the framework of intergovernmental relations, the ACT continues to pave the way in many respects taking advantage of its economies of scale as a city/State while maintaining the appropriate mechanisms for compensatory funding streams for the diseconomies of scale in other facets.
These special attributes drive the ACT agenda but within a framework that supports its fiscal sustainability, with HFE of prime importance administered by an independent body in the form of the CGC.
The ACT would need compelling arguments to be presented for it to accept any wholesale or radical changes to the current system.
18

THIS PAGE LEFT INTENTIONALLY BLANK
19

4 PART I – THE IMPACT OF THE HFE SYSTEM ON THE AUSTRALIAN COMMUNITY, ECONOMY AND STATE GOVERNMENTS
4.1 The Fundamental Objectives of HFE
The fundamental starting point for an inquiry into horizontal fiscal equalisation (HFE) is what the objective of HFE should be. This assumes that equalisation should occur in some form. It also carries the implication that “horizontal” refers to equalisation at the sub-national level; that in the Australian context is between the States. The discussion of alternatives to the present system which follows will however canvass the possibilities that equalisation could be completely dispensed with..
Federal systems across the world all incorporate some form of equalisation as a fundamental element in their design. These systems vary in the scope and quantum of equalisation, particularly with regard to whether both revenue and expenditures are equalised and to what degree. In general, however, the objective of these arrangements is to enable sub-national governments to provide services at an equivalent level to all citizens, regardless of which particular sub-national jurisdiction they reside in.
James Buchanan, in his seminal work on federalism, characterised the need for equalisation as arising from the progressive national integration of economies within a decentralised political structure (1950, p. 584-585). This was reinforced by the extension of governmental activity through the provision of social services, to which all citizens were regarded as having an equal entitlement. At the same time, he accepted the desirability of retaining the federal, rather than a unitary, form of government in the United States. These considerations also underpin the equalisation system we have in Australia today.
Therefore, if equalisation in Australia is to continue as a fundamental element of the federal structure, it must constitute equalisation among the States, such as will further equity of treatment between all citizens of Australia, whichever State they live in. This means equity in the scope, standard and availability of the services which States are expected to provide and equity in the taxes and charges which are imposed on citizens to pay for these services. Such an objective is entirely in accordance with the economic principle of horizontal equity, which requires that individuals in the same circumstances be entitled to the same net benefits (services less taxes) and that this treatment should not differ as a result of geography.
Moreover, we contend that equity should be the sole objective of HFE and not qualified or diminished by the inclusion of other, secondary objectives. That does not mean that potential adverse impacts of equalisation on other desirable outcomes, such as economic efficiency, should not be considered.
20
If equivalent equity outcomes can be obtained with either reduced economic loss or increased economic gain, then the design of the HFE system should be altered accordingly.
Equity of treatment between citizens at a State level requires as comprehensive an approach as possible to the services provided by States and the taxes and charges levied by States to support provision of those services. An equalisation system which makes substantial exclusions of expenditures or revenues must substantially diminish equity, except to the extent that those expenditures and revenues are already distributed equitably. If they are already distributed equitably, then their inclusion in the equalisation system has no adverse impact.
HFE must address structural differences between States which significantly impact their revenue raising capacity or expenditure needs. Socio-economic, demographic and geographic differences are crucial in this respect, as are differences in endowments of natural resources and other economic factors. These differences must represent factors which are beyond the reasonable policy influence of State governments. This does not mean, however, that equalisation should aim to “correct” or reform these underlying differences over time: it is not a mechanism for economic or social reform, but rather a form of transfer payment at a governmental level which mitigates the adverse effects of such differences.
The ACT does not see addressing shorter-term differences, such as cyclical differences, between States as part of the fundamental objective of HFE. Rather, the latter goes to the level of secondary or supporting principles which should be considered. Mitigation of cyclical differences is desirable, in accordance with the principle that the equalisation process should, as far as possible, reflect the current circumstances of States, but it should not be at the cost of accurately compensating for structural differences.
Another secondary principle is that States should not be rewarded for inefficient tax arrangements or service delivery, nor penalised for efficiency in their tax regimes and service delivery. An effective HFE system should minimise such adverse impacts. However, it should not be an objective of the system to promote reform – other policy mechanisms should be used to achieve reform objectives. Where reforms undertaken by States significantly affect their underlying revenue raising capacity or expenditure needs, the HFE system must not operate to penalise such reforms. These are commonly referred to as “second order” effects and should be explicitly accounted for in the equalisation system – which does not occur at present.
4.2 HFE and Economic Welfare
While this submission contends that equity is the sole objective of HFE, it is worthwhile to consider HFE from the perspective of economic welfare.
21

The impact of HFE on economic welfare has been the subject of substantive consideration in the academic literature. The final report of the GST Distribution Review (Greiner, Brumby and Carter, 2012) summarised the conclusions of many of these academic papers on the topic of economic welfare and HFE. In addition, the ACT also touches upon further research that has happened on this topic after the release of the final GST Distribution Review Report in 2012.
A key distinction which underpins much of the debate about the economic welfare impact of equalisation is that between revenue equalisation and cost equalisation (i.e. equalising for higher costs of providing services in certain locations). All federations that fiscally equalise across their jurisdictions (e.g. Australia, Belgium, Canada, Germany and Switzerland) equalise revenue, while only some federations (e.g. Australia and Switzerland) equalise costs. There are divisions between researchers on the impact of cost equalisation from an economic welfare perspective. This submission shall touch upon it later in this section.
However, even though economists differ over the impact of cost equalisation on economic welfare, the results of quantitative analyses of comprehensive equalisation systems, such as Australia’s HFE, support the conclusion that HFE does not have a significant impact on economic welfare.
Common to all of the academic literature is that the key driver of the impact of HFE on economic efficiency is labour mobility. Thus HFE can be analysed as to whether it either offsets movement of labour between states due to fiscal incentives, or alternatively generates fiscal incentives for movement of labour. Buchanan established the argument that if horizontal equity was not maintained across states in a federation, labour would have an incentive to move across states due to a difference in net fiscal benefits (NFBs), instead of due to reasons of productivity (1950), where net fiscal benefit is defined as:
“... the variable cost of providing government services net of the tax revenue raised within the state (from residence-based taxes (e.g. payroll tax)) to fund those services”.
- Fiscal Equalization of Australian states and territories: policy options and welfare maximization, Murphy, Independent Economics, 2015
Buchanan reasoned that states follow redistributive policies in terms to charging a tax on some of their population and using the revenue to provide services to the others and that the distribution of people paying tax and receiving government services varies from state to state. Hence, there are two possible outcomes; a state with lower income (i.e. it has fewer people paying taxes and more service recipients) will have to either charge higher taxes in order to provide the same services, or charge the same taxes and provide a lower level of service.
22
He opined that such differences in terms of either taxes or services across states are neither efficient nor equitable for residents of the same union and they have an incentive to migrate across states, solely because of these fiscal considerations. He argued that if the union would have been a unitary state, then every citizen would have had to face the same tax and spending policies and such a situation of inequitable treatment would not have arisen.
His conclusion was that such a situation of migration across states due to fiscal considerations could be addressed through the establishment of a system of equalising fiscal transfers to state governments. Thus, right from the genesis, the basis of equalisation was horizontal equity to negate labour mobility driven solely by fiscal considerations.
Subsequent research has mostly supported Buchanan’s proposition that equalisation promotes more efficient settlement patterns. However, Boadway (2004) and Brennan and Pincus (2010) argued that cost equalisation could lead to ‘unfavourable’ inter-state migration and hence be less efficient. Their argument was that higher taxes should be imposed on locations that are more difficult to service, thereby acting as an incentive for labour to not move there. However, if cost equalization is done and equalisation payments are provided, then the disincentive would be removed, leading to a loss in economic welfare.
There have been several attempts at quantifying welfare gains and losses from equalisation transfers. Some of the work has shown welfare gains due to equalisation, while other studies have found welfare losses as a result of equalisation. The differences in these findings depend significantly on the underlying theoretical assumptions.
The earliest attempts at robust quantification were associated with Canadian equalisation, beginning from the early 1980s. In an often-cited paper, Albouy (2012) found that Canada’s system of equalisation and other federal transfers led to a reduction in national income by 0.41 per cent, or $4.3 billion per annum (in 2012 Canadian dollars). Like Boadway (2004) and Brennan and Pincus (2010), he also found cost-equalization to be inefficient. However, his analysis also showed that it was inefficient not to equalise all source-based revenues such as mining revenues (Canada equalizes only 50% of the mining revenues).
Dixon et al (1993, 2002, 2005) were the pioneers with regard to calculating the economic welfare impacts of Australian equalisation. Their analysis showed that if Australia moved from the current HFE system to an equal per capita (EPC) one, there would be a welfare gain of $150 million a year (in 2000-01 Australian dollars (AUD)), at the maximum (2005).
However, Murphy (2012) challenged their estimate due to a technical deficiency. On correcting for the deficiency and taking a similar approach, he found a welfare loss of about
23

$259 million (in 2009-10 AUD) in moving away from HFE to modified EPC, where ‘modified’ implies that GST is distributed EPC, except for expenses related to indigeneity, which are equalised.
Further, Murphy (2015) showed that any move from HFE to a relativity floor of 0.75, or a grants scenario where the Commonwealth Government paid recipient states from its taxation revenue (instead of payment by donor states), would lead to welfare losses of about $199 million and $284 million respectively (in 2015-16 AUD). The grants scenario has increased welfare losses due to two reasons; additional taxes that have to be imposed to fund the payments and a reduction in the efficient equalisation of Western Australia’s (WA) mining royalties (Murphy also agrees with Albouy’s 2012 analysis that it is efficient to fully equalise mining revenues).
There are two key conclusions to be drawn from the research. The first is that there is general agreement that an economically efficient equalisation system must fully equalise revenues, particularly so-called “source-based” revenues, which include mineral royalties, land taxes and conveyance duties. The second is that while there are differences of view about the economic efficiency of some elements of cost equalisation, the overall impact of the Australian HFE system on economic efficiency is insignificant; either a small positive or a small negative effect. The estimated quantum of welfare losses and gains is in the order of 0.02 per cent of Australia’s GDP ($1.66 trillion in 2015-16) or 0.8 per cent of the gross state product of the ACT in 2015-16 ($36 billion).
Hence, this submission contends that there is no concrete evidence available to date to suggest that the current HFE process has any significant impact on economic welfare. There is broad agreement among economists that revenue equalisation is efficient, especially full equalisation of all mining revenues, but division on the issue of whether cost equalisation leads to efficiency losses. However, quantitative analyses of systems such as Australia’s, which include comprehensive cost equalisation, at worst show only small economic welfare losses. As outlined at the start of this submission, the ACT contends that equity is the sole objective of HFE and on the basis of the considerations outlined here, that it achieves that objective without any adverse impact on economic welfare.
The ACT has based its conclusions on available research by independent economists. The timeframe for submissions to this inquiry does not allow for State Governments to commission new research or modelling, though the Commission may have some capacity to carry out such work.
24

4.3 HFE and State Reform
In addition to arguments about the impact of HFE on economic welfare, another key point of disagreement between States and among commentators is the issue of whether HFE creates perverse incentives or unintended consequences for economic reform at the State level, with particular emphasis on State tax reform. Changes in State tax policies can cause changes in the GST revenue distribution by altering the assessed average revenue raising capacity of States. These effects can be categorised as either first order effects: changes in a State’s assessed revenue capacity from policy decisions which do not affect underlying tax bases, or second order effects: changes in a State’s assessed revenue capacity from policy decisions which do affect underlying tax bases. As a result of these effects, there are theoretical incentives for States to either reduce their revenue from sources that they have a higher-than-average assessed capacity for, or increase their revenue from sources that they have a lower-than-average assessed capacity for.
4.3.1 State Reform – First Order Effects
First order effects arise from the influence that individual State expenditure and revenue policies have on the national average assessed by the CGC. As noted by Dahlby and Warren (2003), States that increase or decrease their effective tax rates on a given tax base can put upward or downward pressure respectively on the national average, in proportion with the tax base’s relative exposure to the tax policies of the State that is changing its effective rate:
“The rate effect arises because an increase in a state’s tax rate will increase the standard tax rate for that base in proportion to that state’s share of the tax base”
- Fiscal Incentive Effects of the Australian Equalisation System, Dahlby and Warren, 2003, The Economic Record, Vol. 79, No. 247, p 434.
Consequently, first order effects only arise for States which have a high proportion of the national tax base. Apart from mineral resources, State tax bases are distributed fairly closely in accordance with population and hence the first order effects have only a minor impact even for large States.
Incentives from first order effects were addressed as part of the GST Distribution Review (Greiner, Brumby and Carter, 2012.), with the final report finding that while there are theoretical incentives and disincentives, there is no definitive evidence of HFE exerting any material influence on State economic and tax reform decisions through first order effects in practice:
25

“The current system creates perverse theoretical incentives in some instances, but there is little evidence that they have any effect in the real world. In particular, there is no evidence that HFE acts as a material disincentive to State tax reform.”
- GST Distribution Review Final Report, Greiner, Brumby and Carter, 2012, p. 140.
The GST Distribution Review’s finding is also corroborated by academic literature, including econometric analysis performed by Dahlby and Warren (2003) which found only weak evidence of a relationship between State tax rates and the GST distribution:
“We interpret the regression results as providing some relatively weak evidence in support of the hypothesis that the equalisation grant formula has affected the tax policy decisions of Australian state governments. However, the estimated model is very simplistic and does not include other variables, that might affect the fiscal choices of the state governments.”
- Fiscal Incentive Effects of the Australian Equalisation System, Dahlby and Warren, 2003, The Economic Record, Vol. 79, No. 247, p 444.
The GST Distribution Review’s Second Interim Report provided a State-by-State numeric analysis of the first-order impact of a unilateral tax increase on a series of different tax bases (Attachment A). This analysis clearly established that, apart from mineral royalties, the first order effect of tax rate changes on States’ GST entitlements is minimal.
In light of the information presented above, the ACT continues to support the GST Distribution Review’s finding that there is no definitive evidence that HFE creates material first order incentives or disincentives to the economic and tax policy decisions of State governments. However, the position in relation to second order effects is quite different and is addressed below.
Critics of the current HFE system have also often claimed that the current HFE system incentivises States to provide services inefficiently:
“The GST formula is partly to blame, though. It discourages states from reforms that make their economies grow faster or their administrations run more efficiently. It’s no surprise that South Australia and Tasmania, the two states that are most subsidised by the GST carve-up, have 6.8 and 7.3 public sector workers for every 100 citizens, the largest rates of any state. Northern Territory, which receives almost five times its per capita share, employs more than 10.”
- Rethink needed to fight states’ need for funds, Creighton, The Australian, 2017
26

This argument has been addressed numerous times, in particular in the CGC’s 2012 Update Report, which clarified that the current system of HFE, being based on average expenses and average State policies, means that any efficiency gains in service delivery are almost entirely kept by the States that initiate such efficiencies:
“Differences between a State’s actual service delivery efficiency and the average efficiency do not affect the GST shares. States which are more efficient than the average keep the benefits of their extra efficiency to use as they see fit, while less efficient States bear the costs.”
- Report on GST Revenue Sharing Relativities – 2012 Update, CGC, 2012, p. 31.
This argument was also clearly endorsed by the GST Distribution Review in its Second Interim Report (p.30). Again, the ACT supports the findings of the Distribution Review.
Other critics have claimed that the current system of HFE creates perverse incentives with regard to the provision of public services. This is exemplified by the so-called “flypaper effect”, which describes the tendency of State government recipients of Federal grants to spend more on service provision than if their tax incomes increased by an amount equal to the size of the grant. Allegedly, this leads to State and local governments that are net recipients of grants, such as the GST distribution, to have overly large and therefore inefficient public services.
The flypaper effect was also addressed in the GST Distribution Review, which found that there was no particular evidence that it was a material source of public service inefficiency on the part of net grant recipient States. Rather, the Review Panel argued that grants are given to State and local governments with conditions that they are spent on specific purposes and, with particular regard to the GST distribution that States that are net recipients of Commonwealth grants have above average expenditure needs and therefore need to spend more on public services than net donor States:
“The obvious explanation for [the flypaper effect] is that grants are generally given to State and local government with the explicit purpose of being used to fund public services... Moreover, as the Commonwealth Treasury noted in its submission to the Review, it is not true that recipient States as a whole have larger public sectors. Instead, those States that spend more are the ones that are assessed to have above average spending needs.”
- GST Distribution Review Final Report, Greiner, Brumby and Carter, 2012, p. 140.
27

It is likely that the alleged inefficient staffing levels of recipient states are at least partly due to what the CGC describes as administrative scale effects, that is the requirement for all States to maintain a minimum level of government resourcing for functions such as policy, legislation and budgeting, which are not related to the size of populations to which services are provided. Consequently, smaller States will have higher per capita expenditure needs for these functions.
4.3.2 State Reform – Second Order Effects
Although the GST Distribution Review’s analysis found that there was little evidence of material first order effects influencing State economic and tax policy decisions, the current implementation of HFE may pose indirect incentives or disincentives for State economic and tax reform through second order effects; State economic and tax policy decisions may cause effects in the wider economy that change the underlying drivers of its assessed revenue capacity and expense needs, thereby creating incentives or disincentives to economic and tax reform. For this reason, the ACT’s submission is focussed on these second order effects.
Tax Elasticity Effects
One of the key second order effects that may induce incentives and disincentives for State tax reform is tax elasticity. Under the current HFE framework, the CGC assesses each State’s revenue capacity assuming an average tax policy is being applied to each of its assessed tax bases. If any given State’s tax policy differs from this average, the relative size of the relevant tax base may be affected and therefore impact the State’s GST distribution. Tax elasticity means that States that impose above average effective tax rates would see their tax bases reduce over time. Conversely, States that impose below average effective tax rates would see their tax bases increase over time. Consequently, States that shift their taxes away from tax bases with high levels of elasticity and towards tax bases with low levels of elasticity would see their revenue raising capacity increase over time, lowering their share of the GST and therefore disincentivising such tax reforms.
The CGC is currently engaged in a consultancy with the Australian National University’s Tax and Transfer Policy Institute on the impact of tax elasticity on State revenue bases as part of the 2020 Review. Prior to 2004, the CGC incorporated tax elasticity adjustments into their calculations for business franchise fees and mining royalties, but discontinued this practice from 2004 due to data availability concerns:
28

“The Commission is aware that tax policies, especially tax rates, may affect the size of a tax base and that State tax rates differ across States and from the average... Elasticity adjustments were made for State business franchise fees prior to their abolition and for mining royalties up to 2004. However, they were not extended to other taxes or continued beyond 2004 due to a lack of reliable data to measure them”
- CGC submission to the GST Distribution Review, CGC, 2011, p 4.
Research on the tax elasticity effect in a HFE system is scarce, however research performed in 2003 indicates that the impact of the effect may be substantial, with States being estimated to be able to generate between an additional 22.9 cents to 48 cents for each additional dollar rose through land taxes:
“However, the base effect for state land taxes can be measured reasonably accurately if, as a number of econometric studies suggest, land taxes are capitalised in land values. Because equalisation grants are based on the value of land, which declines when land taxes are increased, there is a base effect with respect to land taxes1. Our calculations indicate that New South Wales can collect an additional 22.9 cents in grants for every additional dollar of land tax revenue imposed by the state through the equalisation base effect. This effect is around 28 cents for the smaller states and as high as 48 cents for the Northern Territory.”
- Fiscal Incentive Effects of the Australian Equalisation System, Dahlby and Warren, 2003, The Economic Record, Vol. 79, No. 247, p 435.
The ACT believes that there is a strong conceptual basis for incorporating tax elasticity effects into the HFE system. It proposes that the tax elasticity effect should be integrated into the HFE system as an adjustment to each State’s assessed tax bases that are either undergoing significant reform or that have effective tax rates that are significantly different from the national average. The ACT proposed such an adjustment in its submission to the CGC for the 2015 Review; however the CGC rejected the idea on the grounds that the adjustment would not cause a material impact on the GST distribution. However, the ACT disagrees with the methodology used by the CGC to calculate the elasticity effect and proposes an alternative approach that it considers to more accurately capture the impact of tax elasticity on States’ assessed revenues.
The CGC’s approach in the 2015 Review to calculating possible elasticity effects was based on the absolute difference between State tax rates and the national tax rate.
1 Although land taxes are generally regarded as inelastic, that is a function of land being in fixed supply. From the viewpoint of tax elasticity, it is the value of the land rather than the quantity which determines the taxable base.
29

This method produces very small differences between the State and national average rates, which the ACT considers to substantially underestimate the impact of tax elasticity on each State’s revenue capacity. The ACT’s alternative approach is to use a proportional difference between the State and national average rates. This approach considerably increases the relative differences between the State and national average rates. Analysis of an example of the results of this change show that the per capita difference between the ACT’s conveyance duty assessed revenue and the elasticity adjusted assessment in 2011-12 increases from $4.75 to $41.46, which would make the elasticity adjustment clearly above the CGC’s $30 materiality threshold2. For further analysis of the two approaches, as well as an explanation of the mathematical logic of using a proportional difference rather than an absolute difference, please refer to Attachment B.
In summary, a proportional calculation for the elasticity impact shows that State tax policy setting with regard to their tax mix of low and high elasticity tax bases can have a material impact on a State’s GST distribution share through a second order effect of changing the value of its tax bases. This creates incentives for States to avoid taxing low elasticity tax bases and instead target high elasticity tax bases, leading to possible efficiency losses in the State’s economy. The implementation of an elasticity adjustment to the GST distribution to mitigate such second order effects and thus eliminate any possible perverse incentives that arise through it should be considered further.
HFE and Economic Development
Another key second order effect that may indirectly influence State economic and tax reforms in the current HFE system is economic development, that is direct State expenditures which have the effect of increasing a State’s revenue bases. Improvements in a State’s economic capacity increase the ability of the State government to raise its own revenues, such as higher payroll tax from increased wages or higher mining royalties from an increase in the amount of mining activity in the State.
Because of this, some States have argued that the current system of HFE disincentivises States from pursuing economic and tax reforms that enhance economic development. From this perspective, policies that promote economic development increase a State’s own capacity to generate revenue, which places downward pressure on the State’s GST distribution and therefore limits the benefit to the State government of economic development:
“Notwithstanding that State governments have other incentives to develop their economies (e.g. to enhance the income and wellbeing of the State population by generating
2 The materiality threshold requires that a differential assessment of a category of revenue or expenditure produces a difference of at least $30 per capita compared with an equal per capita distribution for at least one State.
30

employment opportunities), the impact of fiscal equalisation is to dull the incentive of State governments to promote economic and social development”.
- WA Submission to the GST Distribution Review, Western Australian Government, 2011, p 26.
The issue of second order effects of the HFE system on economic development was considered by the GST Distribution Review. The Review Panel acknowledged the possibility of such perverse incentives, however concluded that despite these possible incentives, States have more reasons than not to pursue economic development of their fiscal capacities. The Review Panel did however argue that some costs related to the development of mining industries may not be equalised sufficiently:
“However, increases in a State’s tax base are generally the result of economic growth, and a State has many reasons to pursue economic development beyond the potential fiscal gains. Nonetheless, the Panel has recognised that some of the costs associated with pursuing mining related activity may not be adequately recognised in the HFE system. Ensuring adequate recognition of these industry support costs will remove a potential discouragement from promoting mining related activity.”
- GST Distribution Review Final Report, Greiner, Brumby and Carter, 2012, p. 138.
As a matter of principle, the ACT supports the concept of making adjustments for the effects of economic development policies pursued by States on the size of their tax bases, to ensure that any perverse incentive effects are minimised. Such an approach must recognise however that economic development is a broad concept which covers a range of industries, though it is perhaps most relevant to those where government intervention may be required to address market deficiencies, such as lack of depth in capital markets and free rider problems. All State governments have policies which, to varying degrees and across a wide range of industries, support economic development. A key issue for equalisation is the degree to which the levels of government investment and support vary across States.
Economic (business) development expenses are classified within the services to industry category of expenditure in the CGC’s assessments, with total expenditure by States on business development in 2013-14 of $3.623 billion, or $155.44 average per capita nationally (CGC, 2015, p. 378 and 558.). Although business development expenses are currently assessed equal per capita by the CGC, the relatively small size of this expenditure category suggests that even a substantial differential assessment of need between States would not have a significant effect on the overall distribution of the GST.
Much of State expenditure related to economic development is likely to be addressed already through the infrastructure expenditure category in the CGC’s assessment, which already captures the capital costs of economic development. The CGC’s infrastructure
31

assessment incorporates and equalises State expenditure on critical infrastructure, including roads (CGC, 2015, p. 409).
An alternative approach of discounting relevant revenue lines to allow for economic development costs would be less transparent than an expenditure assessment and would in any case rely on the same data to quantify the effects. The ACT does not support such an approach.
There also appears to be little empirical evidence that second order effects of HFE are a material disincentive to States promoting economic development. As stated by the GST Distribution Review, States have and continue to pursue policies to enhance the productiveness of their economies and improve the opportunities and well-being of their citizens.
Critics of the current HFE system have claimed that it acts as a disincentive for State governments to pursue policies which are favourable to mining development and that this can have the effect of deterring otherwise productive investments. However, international comparisons of the favourability of jurisdictional mining prospects do not support this contention. The Fraser Institute Annual Survey of Mining Companies identifies the interactions of prospectivity and policy to determine the most promising jurisdictions in the world to invest in mining projects or build new mines. These influences on mining investment decisions are summarised into a series of indices; the Policy Perception Index, which captures mining companies’ perceptions towards jurisdictional policies that impact the mining industry, the Best Practice Mineral Potential Index, which captures the physical mineral potential or prospectivity of each jurisdiction and the Investment Attractiveness Index, which effectively collates the other two indices into an overall score for mining investment attractiveness in each jurisdiction.
In the 2016 Survey’s Investment Attractiveness Index, two Australian States; WA (3rd) and Queensland (QLD) (10th) were ranked in the top 10 and two more, South Australia (SA) (13th) and the Northern Territory (NT) (20th), were ranked in the top 20 (Fraser Institute, 2016, p. 9.). Moreover, WA (9th), SA (21st) and the NT (22nd) all rank in the top 25 jurisdictions in the Policy Perception Index (Fraser Institute, 2016, p. 17.). The discrepancy in the rankings indicates that policy decisions of State governments are not the sole driver of the attractiveness of mining investment in their jurisdictions and that the prospectivity of minerals is as much, if not more of, a factor in the decisions of mining companies to invest in the States. This observation is of particular pertinence when considering QLD which, despite ranking only 36th in the Policy Perception Index, is considered to be among the most attractive jurisdictions for mining investment in the world.SA is an example of a State which has pursued the expansion of mining development, through investments in geological mapping and regulatory reforms, despite any consequent increases in mining revenue putting downward pressure on SA’s GST share:
32

“In practice the South Australian Government has actively pursued expansion of mining through investments in geological mapping and regulatory certainty and efficiency – even though additional royalties would be shared with other States through HFE.”
- South Australian Government Submission to the GST Distribution Review Panel, South Australian Government, 2011, p. 11
In summary, given the above analysis of State expenditure policy and global comparisons, it is the ACT’s view that while there may be second order effects on assessed tax bases associated with economic development; these effects are unlikely to cause a material impact on State policy decisions. The second order effects of equalisation in particular are intrinsically complex and difficult to measure, making it inherently unlikely that they can be readily accounted for in States’ overall policy making processes.
4.3.3 Overall Incentive Effects of the HFE System
There is evidence from the spread of the GST relativities that HFE does not promote State policies that increase dependence on Commonwealth grants, as argued by critics such as Robert Carling in 2016:
“In practice, it is impossible to disentangle intrinsic from policy induced advantages and disadvantages, and mismanagement ends up being rewarded while good policies are penalised to some extent.”
- There needs to be a better way to share Australia’s GST revenue, Carling, Business Insider Australia, 2016.
If this were the case, it would be expected that more GST per capita in real terms would be redistributed over time, as net recipient States of GST would be incentivised to implement policies that would drive increases in their relativity, thereby increasing their GST share and thus dependence on GST grants. However, a 2016 CGC information paper on trends in HFE shows that the amount of fiscal redistribution decreased markedly from 1993 to 2010, declining from $298 per capita, or 11.9 per cent of the GST pool, to $198 per capita, or 7.9 per cent of the GST pool. Although the amount of redistribution has increased since 2010 to $320 per capita in 2016, it is the ACT’s view that this is solely a result of the mining boom and would not have occurred in the absence of such a large increase in the value of mineral royalties (CGC, 2016, p. 7.). There is evidence in the two most recent Updates by the CGC that the effects of the boom are starting to wash out of the system, with a progressive decline in the spread of relativities between States in these two updates.
Moreover, analysis of the relativity of the most dependent State in the Commonwealth, the NT, shows that its relativity has decreased considerably (from 5.42252 to 4.66024) between 1993 and 2017 and that the difference between the NT’s relativity and the second most reliant State in each given year has also decreased by 26.47 per cent (from 3.88355 to
33

2.85547) over the same time period (see Attachment C). Between this analysis and the analysis of the proportion of the GST pool that has been redistributed above, there is no clear evidence that HFE has created incentives for States to become more dependent on GST grants.
4.4 HFE and State Fiscal Management
As estimated in the ACT Budget 2017-18 (p. 255), GST funding accounts for 9% of overall budget funding at the least (for WA), to 50% at the maximum (for the NT), with the other States lying within the 22% to 42% band. Hence, for most States the GST grants play a significant role in their budget funding. Thus, it is not a surprise that states prefer stability and predictability with regard to GST grants.
This has been a consistent theme and multiple papers by the CGC and multiple submissions to the CGC, have discussed this concept. A key challenge in the context of stability is the trade-off between contemporaneity (i.e. using data on revenues, expenses and grants as close to the application year of GST as possible) and availability of reliable data. It can be argued that the CGC’s current approach, which is based on data for a period starting four years before the financial year in which it is to be applied, places too heavy an emphasis on reliability as against contemporaneity.
On the other hand, if contemporaneity is given priority, apart from the challenge of data-reliability, another aspect that comes into play is that GST grants will reflect the current economic scenario more closely and hence, can be more volatile. Key revenue drivers like mining revenues and stamp duty conveyance are known to be significantly volatile (see Attachment D for significant analysis and commentary on this topic).
This submission takes into account the contemporaneity and data reliability issues and tries to strike a middle path. The ACT’s contention is that there are options to improve contemporaneity within the framework of the current HFE process. One option worthy of consideration has been explained in the paper titled Contemporaneity – A Fresh Approach (see Attachment E). The ACT stresses that this is a refinement of the current system and is not intended to be a radically new approach for calculating relativities in the HFE process.
From a predictability perspective, while there is some degree of predictability associated with the overall GST pool, the key challenge lies in being able to predict future relativities. Especially for small states like the ACT, the NT, Tasmania and SA, too many levers are possible (e.g. changes in mining royalties in WA and QLD for all the relevant minerals; changes in property prices and land values in Melbourne, Sydney, Brisbane and Perth; changes in payroll tax policies across NSW, QLD, Victoria (VIC) and WA; changes in their own State). Generally speaking, the large States will have the best data about their own revenue
34

sources, as well as the greatest resource capacity to analyse this information. In comparison, the small States will have lesser access to the required data and less capacity to analyse it. This makes it extremely difficult for the small States to be able to predict their relativities with any degree of accuracy.
Nevertheless, irrespective of their size, some of the States do make an attempt at predicting their relativities over the forward years, in their budget statements. However, the key point is that there is absolutely no consensus in approach among them. The ACT’s stand is that predicting future relativities for a small State like the ACT is an exercise in futility. Hence, while preparing its budget the ACT keeps its relativity constant while estimating GST grants in the forward years. As some sort of a corroboration of the ACT’s stance, of late the Commonwealth Government has also changed its approach from attempting to predict relativities for States and has adopted the ACT’s approach of holding relativities constant across the Commonwealth Budget forward estimates.
The CGC’s policy of not releasing indicative relativities in its Update and Review reports also makes it difficult for State Treasuries to advise their Governments, as it is difficult to anticipate the practical effect of proposed changes to methodology.
35

5 PART II – OPTIONS TO REPLACE THE CURRENT HFE SYSTEM
This submission canvasses four significant changes which lie broadly within the current HFE framework and three options for fundamental change to the HFE framework. While the ACT remains a strong supporter of the current HFE system, preferably enhanced by the changes proposed here, the ACT believes it essential that serious alternatives be considered and analysed, to establish clearly what the impacts on the Australian Federation would be of any major alteration to the current HFE framework. For completeness the commentary also suggests that the Commission consider the implications of a federal financial relations framework without equalisation.
5.1 Options for Change within the Current HFE Framework
5.1.1 Adjustments for Second Order Effects of Reform
The modification the ACT propose within the current HFE framework is, as indicated above, that the assessment approach be altered to explicitly account for the second order effects of State reforms which have a significant effect in either increasing revenue raising capacity or reducing expenditure needs. This is particularly relevant to removing disincentives to State tax reform which are inherent in the current approach to revenue assessments. It is also relevant to assessment of expenditure relating to State economic development, such as investment in infrastructure and in human capital which supports the growth of State tax bases, including mineral resources, tourism, agriculture and education.
The analysis in Part I of this submission deals in more detail with the significance of these concerns and how they might be addressed. Adjustments to State tax bases to account for the effect of significant differences in tax rates between States can be done as part of the current assessment framework. This is an approach previously followed by the CGC (e.g. in the 2004 Review) in relation to some tax bases. Similarly, a differential approach can be applied to the assessment of economic development costs, provided the drivers of State differences can be clearly identified.
5.1.2 Reform Infrastructure Funding
The current equalisation treatment of infrastructure funding is one of the most significant areas of weakness in the system as, unlike the other assessment categories, it is characterised by fundamental inequities.
36

The fundamental causes of these inequities are the politicisation of Commonwealth decisions on allocation of payments to States for infrastructure and the quarantining from equalisation of a major proportion of those payments.
Current year and budgeted Commonwealth infrastructure spending over the next four years (see Attachment F) shows enormous variability of per capita funding across States, with the NT and QLD receiving amounts around 4 to 5 times the payments received by the ACT and VIC. In the context of relativities or category factors assessed by the CGC, this represents a range of 0.378 to 1.999. While the infrastructure category assessment in the CGC’s 2016 Update had a reasonably similar range of 0.693 to 2.347, their assessment of relative needs by state differed hugely from the Commonwealth Budget allocations. It would be very difficult to argue that the Commonwealth Budget distribution of funding is in any way reflective of need.
The ability of the equalisation process to correct these anomalies is severely limited by two factors. The first is the exclusion from equalisation by specific terms of reference of a substantial portion of these funds. The second is the exclusion from equalisation of 50% of the funds within the category for national network roads and rail. An analysis of this undertaken by ACT Treasury in October 2014 (Attachment G) showed an average exclusion of 50% of total Commonwealth infrastructure payments from equalisation over the period 2013-14 to 2017-18.
Terms of reference are commonly used by the Commonwealth Treasurer to prevent equalisation of grants for specific projects which the Commonwealth Government considers are achieving some desirable objective which they do not wish to see unwound by the CGC process. The exclusion of 50% of national network funding from equalisation is based on an estimate of assumed benefits to other States and the Commonwealth, but the 50% is an arbitrary figure applied by the CGC to all such projects, with no attempt made to quantify the actual distribution of benefits across jurisdictions. Despite various efforts, the ACT has been unable to get a more rational and data-informed approach to the treatment of this funding.
It is clear that the equalisation process as it currently stands cannot provide fair treatment of State infrastructure needs and therefore the ACT proposes that Commonwealth infrastructure funding to States be removed from equalisation and provided through an independent mechanism (as outlined above). This would provide for national priority setting for economic infrastructure projects, based on robust and transparent cost-benefit assessments.
However, removal from equalisation can only be done if the Commonwealth funding is itself removed from the current allocation process and put into a pool under independent governance and priority setting processes. It is essential that such a mechanism be based on legislated provisions and not on inter-governmental agreements.
37
The latter can be repudiated unilaterally and do not give the certainty required for such investment. In the absence of such an independent structure, equalisation provides the only means of injecting some element of equity into the process.
State-sourced infrastructure expenditure could remain within the equalisation system under this model, at least as far as it relates to social infrastructure, such as schools and hospitals, for which impacts on other jurisdictions would be negligible. In any case, Commonwealth funding to States is largely confined to economic infrastructure such as roads and rail.
5.1.3 Extend Equalisation to Other Commonwealth Government Transfers
The ACT has long argued that the principle of equalisation could and should be extended into the sector of Commonwealth Government transfers outside the current framework of the State general government sector. There are many unmeasured yet significant factors that affect States’ prosperity that are not currently included in the current equalisation framework. For example, Commonwealth recurrent and capital grants paid as subsidies to specific industries such as to the agriculture, defence, automotive and textile, clothing and footwear manufacturing industries. These grants are not evenly distributed among the States and, as they are often direct to industry, do not appear in State Government budgets, but nonetheless provide valuable economic stimulus to some jurisdictions.
Consideration should be given to the Commonwealth reviewing its Commonwealth Own Purpose Expenses (COPE) structures (via the Department of Finance) to identify a quantum of funding that might be untied and allocated to the States. Alternatively, the funds could be directed into the infrastructure funding pool proposed above. Such a review would also be consistent with the Commission of Audit recommendation to rationalise and reduce Commonwealth grant programs.
5.2 Options for Change outside the Current HFE Framework
5.2.1 National Needs-Based Funding – Replacing Expenditure Equalisation
The current HFE system contains very considerable complexity and potential for inconsistency in its treatment of State needs in some of the major categories of expenditure. This is because it is a mixture of explicit equalisation through the determination of the GST distribution and implicit equalisation through needs-based allocation of some of the largest Commonwealth tied grants – in particular those for public hospitals and school education. Although the HFE process largely acts as a complement to needs-based funding allocation, it can potentially operate to unwind some aspects of those allocation models, as well as adding a further layer of substantial complexity and uncertainty.
38

There would be considerable merit in rationalising needs-based funding allocations to achieve greater simplicity and clearer accountability for outcomes. Attachment H sets out the issues involved, including a discussion of whether needs-based funding models and equalisation are in conflict. It describes two alternative models. The first model is one in which tied grants are allocated by population share, with the whole task of needs-based assessment falling to the equalisation process. The second model involves the allocation of tied grants by a comprehensive needs-based model. If this is implemented through a single jointly funded Commonwealth-State scheme then there is no requirement for equalisation at all (if State funds are allocated on a different basis from Commonwealth funds, then equalisation of the State own-source funded expenditure is still required).
Therefore, one possible option for significant reform of HFE is to replace equalisation of State expenditure with national needs-based funding models for all major State expenditure responsibilities, such as Health, Education, Housing and Disability. The National Disability Insurance Scheme (NDIS) provides a template for such reform, involving the establishment of a national funding pool, to which both Commonwealth and States contribute and the determination of individual entitlements according to a national set of rules. The reforms adopted in recent years for funding of hospitals and schools have both moved in that direction, with individual needs-based funding arrangements governing Commonwealth funding. If this were extended to mandate the adoption of common needs-based funding models across States, then equalisation would no longer be required. Similarly, the mooted extension of Commonwealth Rent Assistance to public housing tenants would offer a pathway to an individual needs-based approach to funding social housing.
This approach would also imply replacement of standards based on the average of what States do with a nationally established benchmark (in Health, the National Efficient Price and associated Diagnosis Related Group (DRG) weightings; in Education, the Schooling Resource Standard). Under a single national model, these benchmarks would in effect represent what States do, with a constraint that services are delivered efficiently.
Some categories of State expenditure may be less amenable to such an approach, as the determination of needs would not be on an individual basis but relate to broader geographic divisions (e.g. for Roads and Transport). However, alternative methodologies could be developed for these categories, with existing CGC assessment methods providing some guidance. The adoption of genuine user charging for roads would assist in at least reducing the scope for equalisation in this category and could, in the longer term, completely replace it.
There are a couple of major elements of State expenditure which would not be as readily catered for by the existence of effective needs-based funding models.
39

The first is capital (infrastructure) requirements, as generally the funding models only cover recurrent expenditure. However, the models could potentially be extended to include infrastructure, particularly given that the CGC already has a comprehensive assessment method for infrastructure which is closely linked to service delivery needs.
One overarching consideration that would be warranted under this approach to expense equalisation is what the CGC calls “administrative scale”, which refers to the cost of State Government functions which are unrelated to service delivery populations. This factor includes policy, legislation and budgeting functions which have a minimum necessary level of resourcing not dependent on the size of the population being serviced. It is particularly significant for the small States because it means their expenditure needs in this aspect are significantly higher than those of the large States on a per capita basis. The existence of this need, or disability in the CGC’s terms, contributes to the false perception of “bloated” bureaucracies in the smaller States, when it is essentially driven by the constitutionally determined size of the individual States.
If a comprehensive needs-based system of funding allocation could be developed, the result would be an HFE system focused on the equalisation of revenue raising capacity, giving a much simpler equalisation system with much lesser burdens on administration and greater transparency to the public. Of course, appropriate additional effort would need to be devoted to development of needs-based funding models, though for the biggest categories of State expenditure they are already present and would need only some refinement. The bigger task would be to gain States’ agreement to operate under single funding models.
5.2.2 Remove Minerals and Energy Resources from Equalisation
The treatment of minerals and energy resources under equalisation is, of late, the principal source of controversy and division over the fairness of the current system. It has served to create doubts in many minds over the validity and credibility of equalisation itself. In a previous submission to the CGC (Attachment D), the ACT pointed out that the fundamental cause of the problem was not the HFE system but the very uneven distribution of these non-renewable resources across States.
Very unequal distribution of tax bases across States creates a situation in which assessments of these bases closely resembles what is known as an actual per capita assessment, meaning that a State’s capacity is assessed as equal to the revenue it actually raises. This situation raises significant issues of policy non-neutrality and possible perverse incentives.
The problem with minerals and energy resources is compounded by the volatility of international commodity prices, which are a major factor driving the size of assessable tax bases. This makes mining revenue more than twice as volatile as any other State revenue head (see Tables in Attachment D).
40

An equitable and efficient treatment of revenue from non-renewable resources ideally requires the adoption of a national taxation regime along the lines recommended by the Henry Review of the Australian tax system. This regime should be on a resource rent basis and replace current State-based royalty regimes. Recognising the historic right of States to onshore mineral resources, it should be operated under joint Commonwealth-State governance, with an agreed formula for distribution of the revenue among States.
Part of the revenue from this taxation regime could be paid into a sovereign wealth fund, recognising that it results from the exploitation of non-renewable resources and should not be used solely to fund current expenditures. This component of the revenue would be removed from equalisation. It would then allow the funding of current Commonwealth contributions for economic infrastructure under a decision-making process overseen by an independent board.
This would remove the highly politicised and inequitable approach which is currently taken with Commonwealth infrastructure funding, a problem which is not effectively addressed by the equalisation process (see further discussion of this issue below). Revenues from Commonwealth taxation of minerals and energy resources, such as the PRRT, could also be incorporated in this funding pool.
Simply excluding mineral resources, either wholly or in part, from equalisation can only operate to the detriment of equitable treatment of Australia’s citizens wherever they live. In the assessment years of the CGC’s 2017 Update WA earned mining revenues around five times the national per capita average, whereas those earned by QLD, the other large mining State, were only slightly above the average. Given that royalty income constituted 22% of WA’s revenue in 2014-15 (the middle assessment year of the 2017 Update), such a disparity in State economic circumstances can only be associated with a very large difference in capacity to fund State services.
It is worthwhile noting that, following a specific request for advice from the Commonwealth Treasurer as part of the 2015 Review, the CGC canvassed with States a so-called “absorption” option which would have combined GST revenues and State mining (iron ore in the specific example mooted) royalties into a single pool for the purposes of equalisation. The CGC described this option in the following terms:
“States would be entitled to their relativity weighted population share of the pool of GST revenue and total iron ore royalties in the application year. A State’s GST revenue would be calculated as its share of the pool less its actual iron ore royalties in the application year...”
- CGC email to State Treasuries – Options for Improving the Contemporaneity of Assessments, CGC, 2015.
41

There is also broad consensus among the researchers in this field supporting equalisation of sub-national government revenues as contributing not just to equity but to economic efficiency.
5.2.3 Reduce VFI through Federation Reform and Tax Sharing
During the Federation Reform White Paper process initiated by the Abbott Government which ran from 2014 to 2016, a range of options were under consideration for changes to the roles and responsibilities of the Commonwealth and State Governments. These considerations were also informed by the report of the Commission of Audit of 2014 which made recommendations for major changes to the allocation of functions between the Commonwealth and the States.
A major objective of these two processes was to obtain a clearer distinction between the Commonwealth and State spheres of responsibility, with the primary aims of greater clarity about which level of government was responsible for which functions and as a consequence improved accountability of each level to its citizens. A further benefit would have been reduced duplication and greater efficiency in policy making and delivery of government services.
A central theme in these considerations was the issue of vertical fiscal imbalance (VFI) and to what extent it could be reduced. Broadly, the belief was that a closer alignment, in fiscal terms, of the revenue and expenditure requirements of each level of government would enhance accountability and improve the efficiency of their operations. At present, Australia has a very high level of VFI in international terms, with the Commonwealth raising 74% of the total revenue of Commonwealth and States combined, but carrying out only 55% of the combined expenditure. This gap represents some $100 billion. In essence, this amount is transferred by the Commonwealth to the States, through GST payments and tied grants, with the former constituting around 53% of the total and the latter 47%.
The large transfer payments from the Commonwealth to the States also enable the funding of the equalisation system, which is a fundamental objective of the GST distribution. In 2017-18, about $8 billion out of a total estimated GST pool of $62 billion will be required to achieve equalisation among the States, compared with an equal per capita distribution. Alternatively, looked at from a zero starting point, with the strongest State (currently WA), receiving no equalisation grant, $23 billion3 would be required by all other States combined to achieve equalisation on the current basis.
The ACT notes that VFI can only be altered through transfers of Commonwealth and State taxation and expenditure responsibilities. Given this, the GST does not address VFI as it is a
3 Figure calculated on the basis of CGC 2015-16 assessment year data.42

Commonwealth tax, not a State tax, with common national rates set by the Commonwealth parliament. It is largely coincidental that the GST is the means currently used to achieve equalisation between the States.
It would equally be open to the Commonwealth to simply use consolidated revenue to fund equalisation grants, as was the case before the introduction of the GST. This would remove the fallacious interpretation of the GST as somehow belonging to the State in which it is paid. There is an argument to say that if the GST were to be distributed solely on an equal per capita basis, as called for by some States, then the Commonwealth might as well keep the revenue and use it to directly fund additional expenditure responsibilities taken over from the States. The alternative is that the Commonwealth would be required to find substantial additional funds to assist States with specific disadvantages.
5.2.4 Federal Financial Relations without Equalisation
The ACT considers that an evaluation could be made of the implications of maintaining a federal financial relations framework without equalisation, as a useful means of clarifying the relative benefits and costs of the current system. Such an evaluation would also help to clarify the implications of simply distributing the GST revenue to States on an equal per capita basis, as has been advocated by some critics of the present system.
In an “equalisation-free” environment4, the Federation would resemble a collection of independent countries bound together by a single currency, a single monetary policy, a customs union and free movement of labour and capital, but with fiscal autonomy of the independent entities – analogous to the Eurozone within the European Union. The problems associated with such an arrangement where the members of the union have widely differing economic capacities need hardly be detailed. Without the ability to flexibly adjust through exchange rate and monetary policies, the weaker members of the union – those with lower productivity and lower growth rates - face ongoing declines in their economic position through migration of capital and labour to the richer members of the union. This in turn results in pressure to lower their wages and other business costs, including taxes, which requires labour market flexibility, as well as reduction in the level of public services. The risk is that of a downward spiral of reducing incomes and fiscal capacity. No functioning federation in the world operates under such a system.
The contrasting comparison which can be made is with unitary countries, which do not have sovereign sub-national governments. In these countries, citizens are generally entitled to expect the same tax rates and service provision wherever they live – perhaps with the exception of those living in remote regions. Such polities also commonly operate systems of
4 This assumes that any tied grant funding from the national to sub-national governments is not allocated on the basis of need.
43

national government grants to regional and local authorities which include equalising elements to compensate for fiscal disadvantage. The design of unitary systems of government thus inherently incorporates features of equalisation between regions.
A logical extension of this option would be to adopt a similar approach within States, rather than the process currently carried out by States Grants Commissions which operate under similar principles to the CGC in relation to the distribution of Financial Assistance Grants to Local Governments. There is no case for needs-based distribution at local level if equalisation grants are not paid to States.
5.3 Overseas Experience – Federal Polities
Many federations have equalization of some sort, at different levels of government. Belgium, Canada, Germany and Switzerland equalise at the state-level, like Australia, while the USA does it at the Local Government level. This submission looked at the equalisation process in play at the aforementioned four countries and found some commonalities and differences. Refer to Attachment I for a quick snapshot of the information.
A key point which stands out is that among the countries analysed - Belgium, Germany and Canada do revenue equalisation only while Switzerland, like Australia, equalises both revenues and costs.
It is worth noting that Canada does not include its northern territories in the purview of equalisation. They are funded separately through a Territorial Formula Financing (TFF) program (Department of Finance, Canada).
Moreover, while Canada, Germany and Switzerland apply revenues emanating from both personal income taxes and business taxes (apart from other sources specific to each), Belgium applies revenues from personal income tax only, for equalisation purposes. Of course, Australia is different from all these federations in that it uses only revenues from a consumption tax (GST), as the revenue source for equalisation.
Last but not the least, among the countries analysed, Germany, Canada and Switzerland have an element of state-to-state transfer of funds (along with Federal Government to states) while for Australia and Belgium, HFE is achieved through funds transfer from the Federal Government to the states only.
To conclude this comparison across countries and to reiterate the effectiveness of Australia’s world leading HFE system:
44

“Despite shortcomings such as a high degree of complexity, the Australia system has become the model for an ideal equalisation system. The basic approach is sound, complete, feasible, and reasonably transparent…the unique benchmark against which all equalisation mechanisms have to be compared in terms of their vulnerability to manipulation and perverse incentives.”
- Equity and Efficiency Aspects of Interagency Transfers in a Multigovernment Framework, Spahn, 2007, p. 93.
45

6 REFERENCE LIST
Albouy, D. 2012, “Evaluating the efficiency and equity of federal fiscal equalization”, Journal of Public Economics, vol.96, pp.824-839.
Beland, D. and Lecours, A. 2012, “Equalization and the Politics of Natural Resources: Balancing Provincial Autonomy and Territorial Solidarity”, Canada: the State of the Federation, edited by Loleen Berdahl, Andre Juneau and Carolyn Hughes Tuohy, pp. 99-115. McGill-Queen’s University Press.
Blochliger, H. and Charbit, C. 2008, “Fiscal Equalisation”, OECD Economic Studies, No.44, 2008/1.
Buchanan, J.M. 1950, “Federalism and Fiscal Equity”, The American Economic Review,vol.40, no.4, pp.583-599.
Buchanan, J.M. and Wagner, R.E. 1970 “An Efficiency Basis for Federal Fiscal Equalisation” The Analysis of Public Output, edited by Julius Margolis, pp.139-162. NBER.
Dahlby, B. and Warren, N. 2003, “Fiscal Incentive Effects of the Australian Equalisation System”, The Economic Record, vol.79, no.247, pp.434-445.
Dixon, P.B., Picton, M.R. and Rimmer, M.T. 2005, “Efficiency Effects of Changes in Commonwealth Grants to the States: A CGE Analysis”, Australian Economic Papers, March 2005, pp.82-104.
Greiner, N. Brumby J. and Carter B. 2012. “GST Distribution Review Final Report”, 2012.
Greiner, N. Brumby J. and Carter B. 2012. “GST Distribution Second Interim Report”, 2012.
Greiner, N. Brumby J. and Carter B. 2012. “GST Distribution Interim Report”, 2012.
Henry, K., Harmer, J., Piggott, J., Ridout, H. and Smith, G. 2010, “Australia’s Future Tax System”, Commonwealth of Australia.
Independent Economics 2012, “Horizontal Fiscal Equalisation: Modelling the welfare and efficiency effects”, Report for the South Australian Department of Treasury and Finance.
Independent Economics 2015, “Horizontal Fiscal Equalisation: Modelling Update and Scenarios”, Report for the South Australian Department of Premier and Cabinet.
46

Murphy, C. 2015, “Fiscal Equalisation of Australian States and Territories: Policy Options and Welfare Maximisation.”
Petchey, J.D. 2011, “Fiscal Capacity Equalisation of the Australian States”, The Australian Economic Review, vol.44, no. 2, pp.207-214.
Shah, A. 2012, “Public Services and Expenditure Need Equalization: Reflections on Principles and Worldwide Comparative Practices”, Policy Research Working Paper 6006. World Bank.
Warren, N. 2012, “Fiscal Equalisation and State Incentive for Policy Reform”, EJournal of Tax Research, vol.10, no.1, pp. 165-181.
47

7 ATTACHMENTS
A. Effect on GST payments of a unilateral tax increase relative to change in tax amount.
B. Calculations of impact of a tax elasticity adjustment for stamp duty.
C. CGC Relativities and NT comparison.
D. ACT Comments on the Impact of Volatile Revenue Bases on Horizontal Fiscal Equalisation.
E. Contemporaneity – A Fresh Approach.
F. Commonwealth Budgeted Infrastructure Funding 2016-17 to 2020-21.
G. Equalisation of Commonwealth Infrastructure Funding 2013-14 to 2019-20.
H. Needs-based funding models and equalisation.
I. Summary of HFE systems in other federal countries.
48
THIS PAGE LEFT INTENTIONALLY BLANK
49

7.1 ATTACHMENT A
Effect on GST payments of a unilateral tax increase relative to change in tax amount, 2010-11 (a)
% NSW VIC QLD WA SA TAS ACT NT
Mining revenue
18.58 24.28 -8.30 -41.84 4.27 1.65 1.61 -0.27
Payroll tax -1.58 0.01 2.00 -3.28 1.78 0.73 0.17 0.16
Stamp duties
-1.75 -3.77 2.41 -0.07 2.35 1.01 -0.40 0.22
Land tax 0.80 -0.86 -1.35 -3.49 2.72 1.22 0.65 0.31
Motor taxes 3.65 -0.93 -0.26 -2.57 -0.06 -0.11 0.20 0.08
Insurance tax
-3.38 1.68 0.73 0.13 0.02 0.50 0.16 0.15
Other revenue (b)
0.00 0.00 0.00 0.00 0.00 0.00 0.00 0.00
Notes: These figures show a one year GST effect and ignore any potential elasticity effects or the impact ofvalue distribution adjustments within assessment categories.
(a) If States decrease their tax rates or coverage the size of the effect would be the same, but the signs reversed.(b) Where any source of revenue is not differentially assessed, increasing revenue collected from thatsource will have no impact on any State’s GST share.
Source: CGC 2012 Update, Secretariat calculations.
50

THIS PAGE LEFT INTENTIONALLY BLANK
51

7.2 ATTACHMENT B
CALCULATIONS ON IMPACT OF A TAX ELASTICITY ADJUSTMENT FOR STAMP DUTY
National Actual ACT ActualACT Elasticity Adjustment
National Elasticity
Adjustment
Population 22,482,217 370,729 370,729 22,482,217
Revenue ($m) 10,517 239 221 10,499
Revenue ($pc) 468 644 595 467
Tax Rate 3.50% 4.17% 4.17% 3.50%
Tax Base ($m) 300,486 5,728 5,290 300,048
Elasticity factor -0.4
Assessed Revenue 200 185
Assessed Difference ($m) -15
Assessed Difference ($pc) -41.46
Diff from avg rate 1.19
Source: CGC data for 2011-12 (from 2013 Update)
The CGC’s current elasticity calculation, for a particular tax base, can be summarised as follows:
RE = RAdj - RAct
Where:
RE = Elasticity effect on assessed revenue base
52

RAct = Actual assessed revenue base (i.e. actual assessed revenue for that base obtained by multiplying this amount with the average tax rate)
RAdj = Elasticity adjusted assessed revenue base
And:
RAdj= RAct(1+(E((TN–TS)/100))
Where:
E = Elasticity factor
TN = National average tax rate
TS = State tax rate
Therefore, RE is driven by the expression (E((TN–TS)/100). Keeping in mind that the output of the expression has to be a pure number (i.e. without any units associated with it), it implies that E must have a difference in tax rates as its denominator. Since TN–TS is going to be a fairly small number (in few-hundredths), even if the numerator of E is unity (i.e. 1), then the resultant value of E would be in tens or hundreds (or even more). Hence, an E value of 1 is extremely low and unrealistic. Also, keeping in mind that E has to be unit-less and it has a difference of tax-rates as its denominator, it is not clear what the numerator should be, for E to be unit-less.
Alternatively, the ACT proposes using a proportional approach, summarised as follows:
RE = RAdj - RAct
And:
RAdj = RAct(1+(E((TN/TS)-1)))
Using this approach, E will have the difference in proportion of tax rates as the denominator. With a similar proportionate change as the numerator, it is indeed possible for it to have values around +/-1 or less than that (in absolute value). Purely from the perspective of construct of E, this also makes intuitive sense. For the purposes of the calculation in the table above, an E value of -0.4 was used as it is consistent with academic literature on the tax elasticity of stamp duty (Leigh, 2013, p. 402.).
53

7.3 ATTACHMENT C
NSW Vic Qld WA SA Tas ACT NT Max non-NT relativity
Difference between Max and NT
R1993 0.79844 0.80587 1.14009 1.16392 1.27997 1.53897 0.94204 5.42252 1.53897 3.88355 Difference - NT relativity in 1993 and in 2017 0.76228U1994 0.85117 0.79708 1.06904 1.12942 1.26083 1.63558 0.73149 5.62222 1.63558 3.98664 Difference - NT to second place in 1993 and in
2017Value 1.02808
U1995 0.8595 0.81791 1.08894 1.11058 1.08241 1.71648 0.72621 5.8891 1.71648 4.17262 Percent 26.47%U1996 0.84258 0.82469 1.07765 1.04376 1.24074 1.72075 0.70526 5.79195 1.72075 4.0712U1997 0.84514 0.81757 1.07875 1.02096 1.24845 1.73984 0.69749 5.94504 1.73984 4.2052U1998 0.84159 0.81353 1.06022 1.0101 1.30036 1.73541 0.81509 5.88675 1.73541 4.15134
R1999 0.88394 0.80925 1.03071 0.91827 1.23721 1.81617 1.00072 5.93271 1.81617 4.11654U2000 0.89543 0.83771 1.03509 0.97505 1.19927 1.63899 1.08404 4.80772 1.63899 3.16873U2001 0.90659 0.84782 1.01194 0.96943 1.1927 1.61763 1.1718 4.61118 1.61763 2.99355U2002 0.88659 0.84044 1.01989 0.97336 1.21241 1.69064 1.19686 4.91305 1.69064 3.22241U2003 0.86632 0.84207 1.02717 0.96269 1.23759 1.75772 1.2069 5.1383 1.75772 3.38058
R2004 0.83474 0.83645 1.06971 1.03819 1.2305 1.71446 1.21415 5.00336 1.71446 3.2889U2005 0.83571 0.849 1.057 1.03303 1.22712 1.7037 1.22837 5.00537 1.7037 3.30167U2006 0.84193 0.87451 1.03271 1.00778 1.20839 1.69599 1.22918 5.06502 1.69599 3.36903U2007 0.8638 0.88206 1.01143 0.93616 1.23141 1.68662 1.24724 5.09597 1.68662 3.40935U2008 0.88743 0.91347 0.96196 0.85797 1.23192 1.66348 1.25603 5.25758 1.66348 3.5941U2009 0.93186 0.91875 0.91556 0.78485 1.24724 1.6204 1.27051 5.25073 1.6204 3.63033
R2010 0.95205 0.93995 0.91322 0.68298 1.28497 1.62091 1.15295 5.07383 1.62091 3.45292U2011 0.95776 0.90476 0.92861 0.71729 1.2707 1.59942 1.11647 5.35708 1.59942 3.75766U2012 0.95312 0.92106 0.98477 0.55105 1.28472 1.58088 1.19757 5.52818 1.58088 3.9473U2013 0.96576 0.90398 1.05624 0.44581 1.26167 1.61454 1.22083 5.31414 1.61454 3.6996U2014 0.975 0.88282 1.07876 0.37627 1.28803 1.63485 1.236 5.66061 1.63485 4.02576
R2015 0.94737 0.89254 1.12753 0.29999 1.35883 1.81906 1.10012 5.57053 1.81906 3.75147U2016 0.90464 0.90967 1.17109 0.30331 1.41695 1.77693 1.15647 5.28452 1.77693 3.50759U2017 0.87672 0.93239 1.18769 0.34434 1.43997 1.80477 1.19496 4.66024 1.80477 2.85547
54

7.4 ATTACHMENT D
AUSTRALIAN CAPITAL TERRITORY
2015 Methodology Review
ACT Comments on the Impact of Volatile Revenue Bases on Horizontal Fiscal Equalisation
January 2015
Chief Minister, Treasury and Economic Development Directorate
55
HFE IMPACT OF VOLATILE REVENUE BASES
Introduction
On 23 December 2014 the Federal Treasurer wrote to the Chairperson of the Commonwealth Grants Commission (Commission) seeking advice on the treatment in assessments of revenue sources which are a large and volatile proportion of a State’s revenue base. This advice was to include a set of GST relativities which would mitigate the negative effects of revenue volatility and ensure that States’ GST shares in any given year would be appropriate to their fiscal circumstances in that year. The Treasurer’s letter made particular reference to the challenges currently faced by Western Australia with regard to GST distribution.
As a result of this request, Commission staff have now sought State comments on the issues raised by the Treasurer’s letter, in particular in relation to whether there should be greater contemporaneity between assessment and application years, and, if so, how this objective could be achieved.
The ACT has previously provided its view that this issue is worthy of examination, but given its substance and potential complexity could not reasonably be addressed within the remaining timeframe for the 2015 Review. We proposed that it be addressed after the 2015 Review, as part of the rolling program of review outlined in our Rejoinder and Final Submissions to the 2015 Review.
Given our views about timing, our previous submissions did not address the substantive issues involved in contemporaneity. While we continue to stand by our previously stated position, this short submission aims to satisfy your request for comments regarding this late development.
Background
The GST Distribution Review addressed the contemporaneity issue in its First Interim Report, issued in March 2012, which stated that problems with available data would probably make a fully contemporary model unattainable. The Report also canvassed the so-called “advances and completions” approach as being a means of achieving full contemporaneity, noting that it would, however, have negative effects on predictability and simplicity.
56

The Review noted that the advances and completions approach had been considered by the Commission in the 2010 Review but not adopted. The Review Panel agreed with the Commission on this point, but sought State views on how such an approach “could be implemented without a negative effect on either predictability or simplicity” (GST Distribution Review, Interim Report, Chapter 2). However, the Review did not return to this issue in its subsequent reports, and it appears that it was only addressed again indirectly, in the submission made by the larger States arguing for an equal per capita distribution of GST, which they characterised as being contemporaneous as it would respond only to population estimates for the application year.
We note that the contemporaneity proposal now put forward implies support for the prevailing objective of fiscal equalisation, which aims to give States an equal capacity to deliver an average level of services. An equal per capita approach to GST distribution manifestly cannot deliver such an objective.
Is Greater Contemporaneity Desirable?
In its Final Submission to the 2015 Review, Western Australia raised the proposal for replacing the current lagged approach to assessments with a fully contemporaneous approach. This was a reversal of WA’s previous strongly held view that equalisation could only be achieved over time through a lagged approach. Indeed in its Rejoinder Submission to the 2004 Review Western Australia argued that “(i)t is not clear that equalisation is compromised by the time lags in application year relativities” and that “(i)t could equally be argued that application year relativities aim to address past equalisation requirements, and that present equalisation requirements will be addressed by future application year relativities” (Western Australia’s Rejoinder Submission to the Commonwealth Grants Commission 2004 Review, March 2003).
Scope
While the primary motivation driving this reversal is the volatility of iron ore prices, the proposal has been put in quite general terms, clearly indicating that it should apply to all revenues (e.g. noting that it would spread the effect of volatility in conveyance duty bases), and carrying the implication that it could also be applied to expense assessments (e.g. in the section on Contemporaneity the WA submission refers to high costs in regional areas and provision of infrastructure to meet future demand). Thus, the issue of scope is a key one to be addressed.
If the fully contemporary approach is to be adopted for revenue assessments, then logically it should also be applied to expense assessments.
57

If that is not done then the two sides of the overall assessment do not represent capacity and needs for the same time period, and moreover will have been constructed using a different methodology. This would clearly diminish equalisation. Although Commonwealth payments are less of a concern, given the Commission’s existing approach to backcasting, logic would suggest that all Commonwealth payments to States, not just those involving major changes to Commonwealth-State financial relations, should be treated on a contemporary basis.
Impact on State Budgets
The WA proposal is obviously designed to reduce uncertainty and risk in constructing the WA State Budget, as the GST payments would act as a kind of automatic stabiliser, offsetting fluctuations in other revenue sources. However, it would also increase uncertainty and risk for virtually all other States. This is acknowledged by WA in their Final Submission: “HFE without lags is also more equitable, ensuring that other States share in the volatility costs as well as revenue benefits from Western Australia’s royalties” (Western Australia’s Submission to the CGC’s 2015 Methodology Review, September 2014, p.21).
The negative impact on other States’ budgeting increases with lower shares of Australia’s mineral endowments. Thus the ACT, with 0% of own-source revenue coming from mining royalties and VIC, with 0.2% of own-source revenue from mining, will experience the greatest budget fluctuations from changes in royalty revenue in the large mining States – the ACT currently gaining $473 per capita and VIC $454 per capita from the mining revenue assessment (see Attachment A). This position is driven by other States’ circumstances, not by their own circumstances in relation to their own revenue sources – hence, the GST payments are as likely to operate in a destabilising as a stabilising fashion for these States. On the other hand, while WA experiences by far the largest movement of GST as a result of the mining assessment (minus $1,825 per capita), that is driven largely by its own circumstances, and a fully current assessment approach would act as a substantial stabiliser for that State.
Significance of Volatility
Volatility itself is not a problem for the GST distribution if it reflects national (or international) economic conditions which apply broadly to all States. In that scenario, it will have little impact on relative differences between States. However, a problem arises where volatility has a significantly different impact between States.
58

The fundamental driver of these differences is the variation between States in the weighting of different revenue types within their own-source revenue bases. This is illustrated in the attached tables (Attachment B), drawn from the 2014 Update Adjusted Budget:
the yellow shaded boxes highlight the volatility over time for each State and nationally for each tax type; and
the green shaded boxes highlight the variation between States in the significance of each tax in their own-source revenue base.
These tables show that mining revenue is by far the most volatile type of own-source revenue, being a bit more than twice as volatile as the average for all revenue. Conveyance duty is the second most volatile revenue source, but only about half as volatile as mining revenue.
This would not be a problem if mining royalty revenue was distributed fairly equally between the States. However, as the green shaded boxes show, the significance of different types of revenue across State tax bases varies much more than revenue from particular taxes/royalties over time. In particular, mining revenue ranges from 0% of the ACT’s own-source revenue and 0.22% of VIC’s own source revenue to 31% of WA’s own-source revenue. WA’s mining royalties constitute a massive revenue source, at $5.5 billion in 2012-13, compared with $2.1 billion for QLD, with nearly double the population, and only $1.3 billion for NSW, which has three times the population. Even though WA has taken royalty write-downs of $7.1 billion over four years in its recent Mid-Year Update, it still expects to earn an average of $5.3 billion a year from mineral and energy royalties over this period.
Our conclusion is that the fundamental problem is not the volatility of particular revenue sources, but the very uneven distribution of mineral resources between States in Australia. Given that royalties are a State tax and that the Commonwealth Government has, so far, been unable to impose an effective tax on on-shore mineral resource production, the problem is not one within the power of the Commission to resolve. However, it is also not in any way fair or reasonable for the Commission to exclude this form of revenue from its equalisation considerations. Hence, it must, as it always does, balance the interests of different States to achieve the most equitable outcome within these unavoidable constraints.
What is to be Gained from Change?
It is clear that WA would gain significant short-term benefits from the proposed change, as its GST share would rise more quickly to adjust to the fall in the iron ore price.
59

This would add to the benefit WA has already gained from the lagged system, when its GST share was falling more slowly in response to the rising iron ore price of earlier years than it would have been under a contemporaneous system. WA is also likely to gain a longer term benefit from the automatic stabilisation effect of a contemporaneous system.
The only other State which may gain from a more contemporaneous system is QLD, which currently earns about $2.5 billion a year from mineral royalties. However, this would depend on whether international coal prices move in concert with iron ore prices or diverge from them. In the scenario of the immediate past, both iron ore and coal prices have been falling, meaning under the contemporaneous system a double hit for QLD through reduced own royalties from coal and reduced GST share due to the fall in WA’s iron ore royalties (though partly offset by some GST gain through the reduced coal royalty take).
Although the NT receives 16% of its own source revenue in the form of mining royalties, a contemporaneous system would have little benefit for it because this revenue is dwarfed by the huge per capita amounts it receives in GST through the expense assessments, particularly driven by Indigeneity and population dispersion. Putting aside other possible methodology changes, these factors are not likely to be subject to significant short-term volatility, assuming that expenses are to be included in the contemporaneous approach.
For all other States the more contemporaneous system is likely to be disadvantageous. In the immediate term, all States other than WA will lose GST, given the current reduction in that State’s mining royalties. Beyond that, as argued above, the contemporaneous approach is likely to increase other States’ budget instability, particularly for States with little mining activity. It would also cause greater problems for larger mining States if mineral prices move in concert, given the widely varying geographic distribution of different minerals between States. The volatility of other revenue sources is much lower, and these tax bases are much more evenly distributed across States, meaning much lower stabilisation benefits for these States.
The radical nature of the change to a system of estimates and adjustments should not be underestimated. It fundamentally alters implementation of the principle of “what States do”, in basing assessments on estimates rather than actual data, and then in a later application year adjusting for what actually happened. The greater the divergence between estimates and actuals, the less contemporaneous is the equalisation process – if that divergence is too great, any benefit of the estimates-based system is completely nullified.
60

The irony is that the very volatility which the contemporaneous system is designed to address also makes estimation much more difficult and likely to be subject to larger errors than for less volatile factors – so one could expect that the subsequent adjustments required for mining revenue will be much larger than those for the less volatile revenue sources. We note that the QLD Budget papers for 2014-15 state that: “Royalties are a very difficult revenue source to forecast because commodity prices are extremely volatile and prevailing market conditions can change quickly” (Queensland Government, Budget Strategy and Outlook 2014-15, p.49). Forecasting of mineral royalties is further complicated by the need to take account of exchange rates and changes in the volume of production, though at some stages these may moderate the impact of commodity price changes.
Finally, the system of horizontal fiscal equalisation is explicitly addressed in the Terms of Reference for the White Paper on Reform of the Federation. This is the focus of a yet to be released Issues Paper titled COAG and Federal Financial Relations, which is subject to final comments by States and Territories. In light of this reference, the ACT’s view is that no radical changes to the current equalisation system should be considered prior to completion of the White Paper process. The proposed move to a fully contemporaneous system is, in our view, a radical change, and thus should not be implemented in advance of the White Paper. Following this, it can be addressed through the rolling review program we have proposed, in a known context for equalisation going forward.
How can Greater Contemporaneity be Achieved?
Options for Implementation
The most obvious method for achieving full contemporaneity is the use of estimates and adjustments (or “advances and completions”), the features of which have been well canvassed already by the Commission and some States. We do not propose to restate the arguments so far put forward. Suffice it to say that any estimates used must be independent of State Governments, to avoid the possibility of gaming of the system, and that to the extent that estimates differ from actual outcomes contemporaneity will be diminished. Therefore, even this approach has significant weaknesses.
An alternative approach is to further reduce the number of assessment years, to one or two rather than three, while retaining the use of actual data rather than estimates. However, this would simply reduce the degree of lagging while not achieving full contemporaneity. The ACT does not support this option.
61

Transitional Arrangements
WA have claimed, in their submission on issues arising from their October 2014 meeting with the Commissioners, that the Commission has “in effect...already been making forecasts of the circumstances in the application year – by (with some exceptions) assuming that those circumstances will be the same as the historical data years”. On this basis they claim that the Commission has already been following an approach of contemporaneous equalisation, and that consequently transitional arrangements are not appropriate.
The ACT does not accept this proposition. Our view is that, other than for significant changes in Commonwealth-State financial relations, the Commission makes no assumptions about circumstances in the application year, rather intending to achieve equalisation over time through the lagged approach.
In any case, we consider that whether or not transitional arrangements should be employed is not a question of principle but a practical issue, which should take into account impacts on individual States and Territories of any large changes in GST entitlement occurring in a single year. The Commission has in the past (2004 Review, Final Report, Chapter 7) acknowledged that “States face practical budget management difficulties if confronted with large changes against the assumptions they have made about revenue” and expressed the view that a way to deal with this would be to phase in the recommended relativities over a period. The ACT agrees with that view.
ACT Reaction to Additional Terms of Reference
The ACT Chief Minister/Treasurer is in the process of writing to the Federal Treasurer expressing his concern about the request to the Grants Commission for provision of an alternative set of relativities which would reflect a better method of dealing with revenue volatility.
The ACT’s very strong view is that these alternative relativities should not override the Commission’s recommendations in its Final Report for the 2015 Review. If the intention is to smooth the way for consideration of reforms through the Tax and Federation White Paper processes, then the alternative relativities could best be used simply as an illustration of alternative approaches and their indicative outcomes, which parties could address in their opening submissions to the White Papers.
62

If the Commission, through its Final Report, decided to recommend a more contemporaneous approach to the treatment of mining revenues, the ACT as a supporter of the process would accept in principle the recommendations. However, in doing so, we would note the critical importance of an implementation approach that manages any significant adverse impact on States and Territories – including a transitional phase-in, as discussed above.
Attachments
A. Drivers of Illustrative Difference from EPC Distribution of GST, 2014-15 (based on 2014 Update Report).
B. Own Source Revenue by State (from 2014 Update Adjusted Budget).
63

Drivers of illustrative difference from EPC distribution of GST, 2014-15
Attachment A
NSW Vic Qld WA SA Tas ACT NT Redist
$pc $pc $pc $pc $pc $pc $pc $pc $pc
Effects on revenue raising capacity
Mining production 261.66 454.50-
138.78-
1,824.80 280.24 353.40 473.42 -49.18 231.56
Payrolls paid -20.55 39.80 45.43 -332.57 217.11 335.92 27.85 118.85 43.53
Property sales -57.93 -19.56 51.47 -87.98 215.34 283.50 -17.72 135.25 33.36
Motor taxes 47.32 -9.19 -18.13 -92.91 2.36 -9.71 58.23 28.69 16.49
Land values 4.51 -16.33 -2.92 -96.70 107.37 155.34 121.52 90.16 15.39
Insurance taxes -14.45 7.48 6.04 6.83 -6.49 36.89 10.13 24.59 5.06
Total revenue raising capacity 220.44 456.54 -57.10-
2,427.76 815.93 1,153.40 673.42 348.36 281.58
Effects on expense requirements
Indigeneity -50.11-
288.99 139.61 204.40-
120.35 71.84-
159.49 4,500.00 98.82
Population dispersion -73.97-
152.58 76.27 289.72 68.44 -201.94-
478.48 2,057.38 73.73
Interstate wage levels 55.81-
112.77-
101.06 315.51-
110.32 -219.42 243.04 401.64 61.07
64

Non-State service provision-
102.07 -62.09 53.14 214.64 -66.67 211.65 53.16 1,213.11 52.60
Population growth (a) -80.59 -0.85 49.39 273.80-
136.87 -248.54 78.48 -69.67 41.76
Socio-economic status 32.87 -4.25 -10.63 -215.40 244.84 390.29-
546.84 -12.30 36.44
Diseconomies of scale -55.41 -44.91 -33.97 16.31 64.90 411.65 572.15 1,040.98 35.64
Other effects on expenses -46.66 -97.13 87.93 -28.82 35.99 209.71 -60.76 1,774.59 43.15
Total expense requirements (b)-
320.25-
763.57 260.26 1,070.53 -20.65 625.24-
296.2010,909.8
4 297.61
Effects on Commonwealth payments (c) 53.15 54.60 -18.34 -25.79
-143.36 -351.46 159.49 -836.07 33.07
Total -46.66-
252.42 185.04-
1,383.01 651.92 1,427.18 536.7110,422.1
3 231.26
Source: 2014 Update Report, Table 5-5, p.72 - recast on per capita basis.
65

THIS PAGE LEFT INTENTIONALLY BLANK
66

Own Source Revenue by StateAttachment B
Table 1 PAYROLL TAX
NSW Vic Qld WA SA Tas ACT NT Total
$ $ $ $ $ $ $ $ $
2007-08 6,209,000,000 3,845,000,000 2,493,000,000 1,936,000,000 904,000,000 250,000,000 248,000,000 141,000,000 16,026,000,000
2008-09 6,359,000,000 3,980,000,000 2,754,000,000 2,240,000,000 914,000,000 259,000,000 270,000,000 151,000,000 16,927,000,000
2009-10 6,158,000,000 4,056,000,000 2,687,000,000 2,298,000,000 900,000,000 271,000,000 273,000,000 152,000,000 16,795,000,000
2010-11 6,399,000,000 4,354,000,000 3,023,000,000 2,523,000,000 951,000,000 286,000,000 286,000,000 164,000,000 17,986,000,000
2011-12 6,728,000,000 4,696,000,000 3,462,000,000 3,092,000,000 1,010,000,000 304,000,000 316,000,000 171,000,000 19,779,000,000
2012-13 6,945,881,000 4,750,900,000 3,751,000,000 3,415,000,000 1,076,700,000 304,092,000 319,170,000 205,460,000 20,768,203,000
Mean 6,466,480,167 4,280,316,667 3,028,333,333 2,584,000,000 959,283,333 279,015,333 285,361,667 164,076,667 18,046,867,167
Standard Deviation 308,473,464 382,015,499 487,584,112 560,781,954 70,779,670 22,841,222 27,809,366 22,846,866 1,860,904,923
Std Dev/Mean (%) 4.77% 8.92% 16.10% 21.70% 7.38% 8.19% 9.75% 13.92% 10.31%
% of Own Source Revenue 21.00% 18.56% 14.42% 19.42% 13.88% 17.28% 12.87% 17.40% 18.08%
Mean (Own Source) 16.85%
Std Dev (Own Source) 2.87%
Std Dev/Mean (Own
Source) 17.05%
67

68
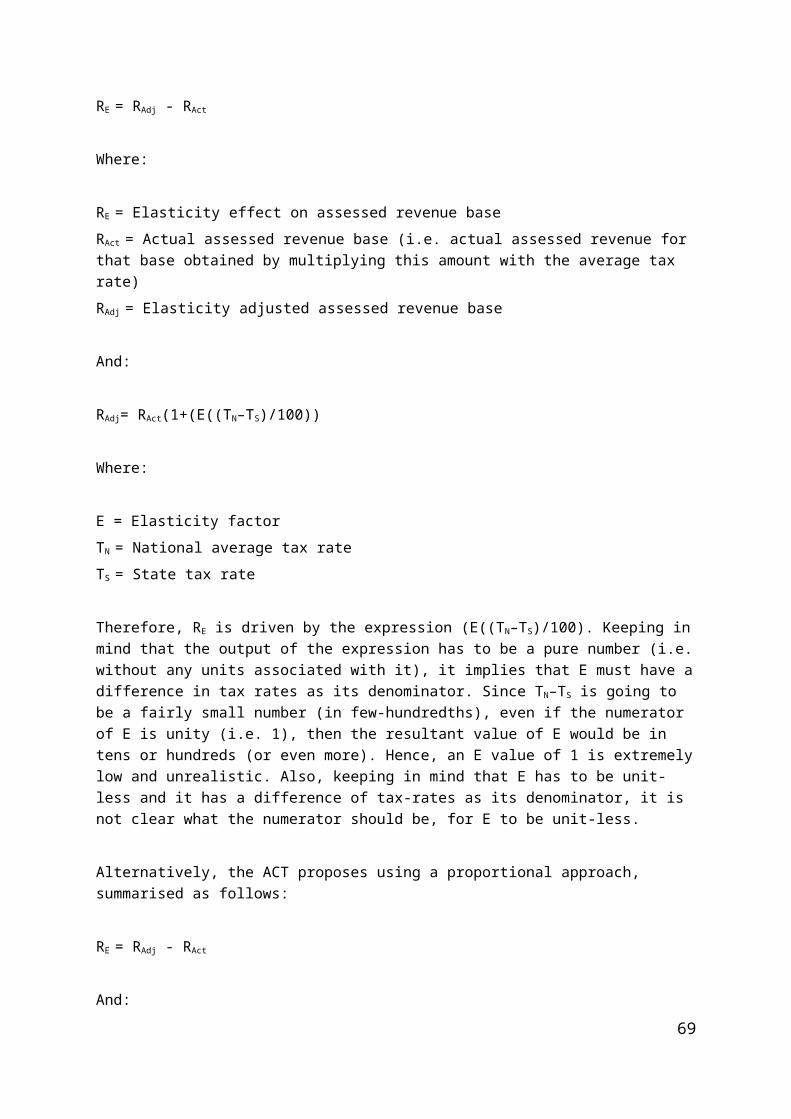
Table 2 LAND TAX
NSW Vic Qld WA SA Tas ACT NT Total
$ $ $ $ $ $ $ $ $
2007-08 1,937,000,000 968,000,000 610,000,000 491,000,000 245,072,759 71,000,000 73,000,000 0 4,395,072,759
2008-09 2,252,000,000 1,345,000,000 838,000,000 644,000,000 360,837,987 80,000,000 86,000,000 0 5,605,837,987
2009-10 2,296,000,000 1,300,000,000 1,033,000,000 597,000,000 389,120,000 91,000,000 98,000,000 0 5,804,120,000
2010-11 2,289,000,000 1,594,000,000 1,042,000,000 594,000,000 390,960,000 75,000,000 110,000,000 0 6,094,960,000
2011-12 2,350,000,000 1,605,518,000 1,013,000,000 632,000,000 395,130,000 88,000,000 115,000,000 0 6,198,648,000
2012-13 2,332,581,000 1,782,400,000 990,000,000 644,000,000 380,870,000 88,524,000 70,773,000 0 6,289,148,000
Mean 2,242,763,500 1,432,486,333 921,000,000 600,333,333 360,331,791 82,254,000 92,128,833 0 5,731,297,791
Standard Deviation 153,698,029 289,627,429 169,717,412 58,002,299 57,765,876 8,163,032 18,635,911 0 702,624,202
Std Dev/Mean (%) 6.85% 20.22% 18.43% 9.66% 16.03% 9.92% 20.23% #DIV/0! 12.26%
% of Own Source Revenue 7.28% 6.21% 4.39% 4.51% 5.21% 5.09% 4.15% 0.00% 5.74%
Mean (Own Source)* 5.27%
Std Dev (Own Source)* 1.12%
Std Dev/Mean (Own
Source)* 21.34%
Note: * Excludes NT
69

Table 3 STAMP DUTY ON CONVEYANCES
NSW Vic Qld WA SA Tas ACT NT Total
$ $ $ $ $ $ $ $ $
2007-08 3,938,000,000 3,594,581,000 2,912,000,000 2,243,000,000 908,968,000 204,066,000 272,000,000 112,000,000 14,184,615,000
2008-09 2,725,947,000 2,663,982,000 1,806,000,000 1,008,000,000 678,590,000 151,000,000 196,000,000 108,000,000 9,337,519,000
2009-10 3,714,910,000 3,368,100,000 1,978,000,000 1,615,000,000 745,294,000 163,000,000 283,000,000 126,000,000 11,993,304,000
2010-11 4,036,669,000 3,763,000,000 1,933,000,000 1,240,000,000 771,500,232 145,000,000 272,000,000 102,000,000 12,263,169,232
2011-12 3,761,807,000 3,158,153,500 2,023,000,000 1,340,000,000 674,580,000 136,000,000 239,000,000 93,000,000 11,425,540,500
2012-13 4,567,444,000 3,158,871,000 1,887,000,000 1,785,000,000 766,320,000 139,087,000 228,647,000 125,980,000 12,658,349,000
Mean 3,790,796,167 3,284,447,917 2,089,833,333 1,538,500,000 757,542,039 156,358,833 248,441,167 111,163,333 11,977,082,789
Standard Deviation 604,285,877 387,011,652 409,690,330 441,105,316 85,402,394 25,261,106 33,272,724 13,147,170 1,593,168,327
Std Dev/Mean (%) 15.94% 11.78% 19.60% 28.67% 11.27% 16.16% 13.39% 11.83% 13.30%
% of Own Source Revenue 12.31% 14.24% 9.95% 11.56% 10.96% 9.68% 11.20% 11.79% 12.00%
Mean (Own Source) 11.46%
Std Dev (Own Source) 1.43%
Std Dev/Mean (Own
Source) 12.48%
70

Table 4 INSURANCE TAX
NSW Vic Qld WA SA Tas ACT NT Total
$ $ $ $ $ $ $ $ $
2007-08 794,049,000 754,000,000 449,000,000 372,000,000 302,000,000 41,000,000 33,106,000 25,000,000 2,770,155,000
2008-09 841,116,000 799,000,000 491,000,000 397,000,000 327,000,000 43,000,000 37,078,000 27,000,000 2,962,194,000
2009-10 879,156,000 865,000,000 508,000,000 428,000,000 347,000,000 47,000,000 43,364,000 29,000,000 3,146,520,000
2010-11 918,449,000 912,000,000 546,000,000 468,000,000 371,000,000 49,000,000 45,000,000 33,000,000 3,342,449,000
2011-12 930,877,000 985,000,000 610,000,000 508,000,000 399,000,000 53,000,000 50,000,000 35,000,000 3,570,877,000
2012-13 1,009,367,000 1,055,800,000 670,000,000 576,000,000 429,390,000 69,658,000 47,826,000 42,162,000 3,900,203,000
Mean 895,502,333 895,133,333 545,666,667 458,166,667 362,565,000 50,443,000 42,729,000 31,860,333 3,282,066,333
Standard Deviation 75,181,026 113,351,253 81,669,252 75,552,410 46,988,289 10,336,919 6,464,417 6,263,373 412,769,897
Std Dev/Mean (%) 8.40% 12.66% 14.97% 16.49% 12.96% 20.49% 15.13% 19.66% 12.58%
% of Own Source Revenue 2.91% 3.88% 2.60% 3.44% 5.25% 3.12% 1.93% 3.38% 3.29%
Mean (Own Source) 3.31%
Std Dev (Own Source) 0.98%
Std Dev/Mean (Own
Source) 29.55%
71

Table 5 MOTOR TAXES
NSW Vic Qld WA SA Tas ACT NT Total
$ $ $ $ $ $ $ $ $
2007-08 2,210,834,000 1,391,036,000 1,374,168,000 868,160,000 412,161,500 123,272,000 102,469,600 44,272,000 6,526,373,100
2008-09 2,200,340,000 1,372,609,000 1,478,748,000 849,984,000 426,766,000 119,250,000 106,458,000 43,250,000 6,597,405,000
2009-10 2,369,809,000 1,499,271,000 1,657,824,000 897,852,000 443,421,000 130,359,000 114,359,000 46,359,000 7,159,254,000
2010-11 2,565,842,000 1,568,391,000 1,775,256,000 949,032,000 473,307,000 139,382,000 119,382,000 47,382,000 7,637,974,000
2011-12 2,690,393,000 1,656,073,000 1,904,957,000 1,022,325,000 487,965,000 139,419,000 122,419,000 50,419,000 8,073,970,000
2012-13 2,868,277,000 1,897,745,000 2,002,204,000 1,112,010,000 523,008,000 144,398,000 131,040,000 60,663,000 8,739,345,000
Mean 2,484,249,167 1,564,187,500 1,698,859,500 949,893,833 461,104,750 132,680,000 116,021,267 48,724,167 7,455,720,183
Standard Deviation 270,217,271 195,253,239 243,264,484 100,895,406 41,448,008 10,019,030 10,541,866 6,365,405 866,189,946
Std Dev/Mean (%) 10.88% 12.48% 14.32% 10.62% 8.99% 7.55% 9.09% 13.06% 11.62%
% of Own Source Revenue 8.07% 6.78% 8.09% 7.14% 6.67% 8.22% 5.23% 5.17% 7.47%
Mean (Own Source) 6.92%
Std Dev (Own Source) 1.22%
Std Dev/Mean (Own
Source) 17.62%
72

Table 6 MINING REVENUE
NSW Vic Qld WA SA Tas ACT NT Total
$ $ $ $ $ $ $ $ $
2007-08 574,000,000 38,100,000 1,345,598,000 2,524,488,000 143,000,000 37,000,000 0 98,155,000 4,760,341,000
2008-09 1,279,000,000 46,400,000 3,341,923,000 3,219,028,000 153,000,000 30,000,000 0 228,360,000 8,297,711,000
2009-10 985,000,000 47,000,000 2,015,402,000 3,176,569,000 126,000,000 39,000,000 0 160,602,000 6,549,573,000
2010-11 1,240,000,000 58,000,000 2,698,464,000 5,203,797,000 157,000,000 49,000,000 0 159,000,000 9,565,261,000
2011-12 1,464,000,000 66,000,000 2,766,447,000 5,334,957,000 177,000,000 54,000,000 0 147,695,000 10,010,099,000
2012-13 1,318,332,000 44,600,000 2,108,000,000 5,524,993,000 188,740,000 29,475,000 0 117,347,000 9,331,487,000
Mean 1,143,388,667 50,016,667 2,379,305,667 4,163,972,000 157,456,667 39,745,833 0 151,859,833 8,085,745,333
Standard Deviation 319,503,178 10,126,483 700,422,268 1,331,210,855 22,712,007 9,973,846 0 44,882,900 2,044,849,374
Std Dev/Mean (%) 27.94% 20.25% 29.44% 31.97% 14.42% 25.09% N/A 29.56% 25.29%
% of Own Source Revenue 3.71% 0.22% 11.33% 31.30% 2.28% 2.46% 0.00% 16.11% 8.10%
Mean (Own Source) 8.43%
Std Dev (Own Source) 10.85%
Std Dev/Mean (Own
Source) 128.81%
73

Table 7 OTHER REVENUE
NSW Vic Qld WA SA Tas ACT NT Total
$ $ $ $ $ $ $ $ $
2007-08 11,220,113,000 9,649,091,000 7,206,691,000 2,543,462,000 3,485,408,741 846,479,000 1,343,789,400 471,489,000 36,766,523,141
2008-09 12,216,450,000 10,364,274,000 9,306,898,000 2,342,196,000 3,577,504,013 900,316,000 1,194,219,000 394,999,000 40,296,856,013
2009-10 13,234,600,000 10,855,370,000 10,165,387,000 2,693,287,000 3,894,228,000 752,468,000 1,307,406,000 420,164,000 43,322,910,000
2010-11 14,385,065,000 11,485,494,000 11,200,750,000 3,352,421,000 3,864,779,768 842,745,000 1,469,062,000 429,810,000 47,030,126,768
2011-12 14,920,766,000 12,859,842,500 11,780,399,000 3,404,496,000 3,862,638,000 903,994,000 1,675,886,000 436,648,000 49,844,669,500
2012-13 16,623,118,000 14,138,284,000 12,351,796,000 3,722,997,000 4,429,972,000 1,000,766,000 1,605,544,000 458,222,000 54,330,699,000
Mean 13,766,685,333 11,558,725,917 10,335,320,167 3,009,809,833 3,852,421,754 874,461,333 1,432,651,067 435,222,000 45,265,297,404
Standard Deviation 1,951,659,715 1,668,563,312 1,885,642,931 555,908,401 330,408,068 82,661,746 184,831,560 27,277,286 6,433,571,640
Std Dev/Mean (%) 14.18% 14.44% 18.24% 18.47% 8.58% 9.45% N/A 6.27% 14.21%
% of Own Source Revenue 44.71% 50.11% 49.22% 22.62% 55.75% 54.15% 64.61% 46.16% 45.34%
Mean (Own Source) 48.42%
Std Dev (Own Source) 12.17%
Std Dev/Mean (Own
Source) 25.13%
74

Table 8 TOTAL ASSESSED REVENUE
NSW Vic Qld WA SA Tas ACT NT Total
$ $ $ $ $ $ $ $ $
2007-08 26 882 996 000 20 239 808 000 16 390 457 000 10 978 110 000 6 400 611 000 1 572 817 000 2 072 365 000 891 916 000 85 429 080 000
2008-09 27 873 853 000 20 571 265 000 20 016 569 000 10 700 208 000 6 437 698 000 1 582 566 000 1 889 755 000 952 609 000 90 024 523 000
2009-10 29 637 475 000 21 990 741 000 20 044 613 000 11 705 708 000 6 845 063 000 1 493 827 000 2 119 129 000 934 125 000 94 770 681 000
2010-11 31 834 025 000 23 734 885 000 22 218 470 000 14 330 250 000 6 979 547 000 1 586 127 000 2 301 444 000 935 192 000
103 919 940
000
2011-12 32 845 843 000 25 026 587 000 23 559 803 000 15 333 778 000 7 006 313 000 1 678 413 000 2 518 305 000 933 762 000
108 902 804
000
2012-13 35 665 000 000 26 828 600 000 23 760 000 000 16 780 000 000 7 795 000 000 1 776 000 000 2 403 000 000 1 009 834 000
116 017 434
000
Mean 30,789,865,333 23,065,314,333 20,998,318,667 13,304,675,667 6,910,705,333 1,614,958,333 2,217,333,000 942,906,333 99,844,077,000
Standard Deviation 3,291,777,969 2,600,604,173 2,785,054,078 2,529,814,042 506,773,745 98,275,240 232,421,227 38,454,415 11,749,091,854
Std Dev/Mean (%) 10.69% 11.27% 13.26% 19.01% 7.33% 6.09% N/A 4.08% 11.77%
Source: 2014 Update, Adjusted Budget
75

THIS PAGE LEFT INTENTIONALLY BLANK
76
7.5 ATTACHMENT E
CONTEMPORANEITY – A FRESH APPROACH
At present, there are time lags in the manner in which HFE works.
Reason: The Commonwealth Grants Commission (CGC), in line with its principle of ‘Practicality’, wants to use reliable data in its models associated with determination of relativity for each State (the term includes the territories of ACT and NT).
Implication: For the 2017 update, which is applicable for distributing GST in the financial year 2017-18, the CGC calculated relativities for each of the years 2013-14, 2014-15 and 2015-16 and took an average of these relativities to arrive at the final figure for each State.
Note that 2015-16 is two years back from the application year, which can be a long time in today’s fast-changing economic scenario.
Proposals:
Replace the farthest year with estimates of the current year (which is the year closest to application-year) so that a temporally closer period can be taken into account to distribute GST.
E.g., for the 2017 Update, instead of using data for 2013-14, the proposal is to use estimates for 2016-17. The source for such data could be as the CGC deems fit – independent sources the Commission already reaches out to with regard to States’ data, expertise internally available within the CGC, etc.
While averaging relativities, use weights to decide the average relativity for each State. A suggested weighting of relativities for the 2018 Update (for which data for 2015-16, 2016-17 and 2017-18 would be used under the current proposal) and beyond is: 20% for 2015-16 (this is the farthest year, hence the least weight, though data-reliability is high), 40% for 2016-17 (two years away from the application-year, though data-reliability is high) and 40% for 2017-18 (closest to the application-year, though data-reliability is relatively lower).
77

Rationale:
HFE aims to provide States with the same capacity of providing services to its people, after taking into account relevant material differences.
‘Practicality’ principle guides the CGC into considering only those years for which ‘sound and reliable data’ is available5.
However, considering today’s fast-changing economic scenario, the manner in which the current system works, it appears that in a trade-off between accuracy and contemporaneity, the former is winning hands-down.
Just because highly reliable data for the current year is not available, ignoring the economic realities of the current year is proving to be disadvantageous to States. In fact, in a Staff discussion paper associated with the 2010 Review, the CGC itself declared that one of the principles of equalisation should be ‘proximate (consistent with the quality of the available data and analysis and the materiality guidelines) rather than precise’6.
Example: In spite of knowing that WA’s revenues are going to take a hit in the application-year because of a fall in iron-ore prices, which in turn would impact its ability to provide average services to the people in WA in the application-year, taking data from 4 years back (which happened to be a relative boom-time) and using that data to calculate GST shares does not uphold the principle of HFE.
Note that by the time the relativities are calculated in January, more than 50% of the current financial year has already passed. So, any estimates would be based on reasonable data-points and would not be a complete shot in the dark.
One can argue that even a forecast for the application-year itself can be considered for calculation purposes. However, such a forecast could be prone to heavy changes and data-reliability could be a big issue there. Hence, the current proposal seems to be a nice middle-path in terms staying true to the HFE principles and using reliable data to calculate the relativities.
5 Quoted from 2017-02-S Staff Discussion Paper, ‘The Principle of HFE and its implementation’, section ‘Supporting principles and the HFE Principle – the 2015 Review Approach’, page 9, paragraph 33.
6 Quoted from information paper CGC 2007_12, Principles Interpretation and Scope of HFE, page 11, paragraph 70
78

Proposed Method of Calculation (using 2017 Update as an example)
1. Use data for 2014-15 and 2015-16 to calculate relativities for those two years (business as usual)
2. For 2016-17, use data-estimates from sources that the CGC deems fit in order to calculate relativity.
3. Final relativity for a State = 20% of relativity2014-15 + 40% of relativity2015-16 + 40% of relativity2016-17.
Reality Check
1. For all states, obtained the following data from their budget review documents between 2011-12 and 2015-16 (this is a proxy for the current year estimate that would go into the CGC’s calculations; the CGC should source this data from independent sources or develop the expertise themselves).
a. Mining revenuesb. Payroll tax revenuesc. Land tax revenuesd. Stamp duty conveyance revenuese. Commonwealth paymentsf. Private sector WPI (if available)
2. For all states, obtained data for the above heads from their Final Budget Outcomes (FBOs)/annual financial statements published by State Treasuries.
3. Checked for the degree of variation each year between the budget review estimate and the FBO.
4. Recommendations.
Results of Reality Check
The calculations associated with reality check are available in Appendix 1. Two thresholds were considered for the purpose of the analysis, a 5% threshold and a 10% threshold. ‘Threshold’ in this context refers to the percentage difference between forecasted revenue/expense and the final outcome, using the former as the base.
63% of the forecasts could predict the final outcomes within a ±5% threshold while about 81% of the forecasts could predict the final outcomes within a ±10% threshold.
Number of values underestimated were almost equal to the number of values over-estimated (97 vs. 93, or a split of 51%-49%).
Key areas of failure in estimation were mining revenues and stamp duty conveyance revenues, irrespective of threshold.
79

Conclusions
1. The reality check shows that quality of mid-year review estimate needs to be better! Nevertheless, the CGC would anyway have to reach out to independent sources’ to get States’ data-estimates or develop the expertise themselves. Considering the volatility of mining and stamp duty conveyance revenues, the CGC would need to find a suitable mechanism to predict such revenues with more accuracy (variations due to natural disasters understandable).
2. Queensland Treasury seems to be pretty adept at forecasting stamp duty conveyance revenues since their estimates crossed the 5% threshold only once out of 5 years. The CGC can take some cues from Queensland on how they predict their stamp-duty conveyance revenues so accurately and prepare accordingly.
3. Western Australia Treasury seems to be good in predicting mining revenues; with the maximum difference between their estimate and actual being only 9%. The CGC can take some cues from WA Treasury on this topic and prepare accordingly.
4. Considering that actual relativity calculations associated with the 2020 Methodology Review are still quite some time away, inputs from QLD and WA can be taken into account in the interim to improve estimates of mining revenue and stamp duty conveyance revenue. Once done, this proposal can be put into action.
-------x------
80

State/Territory Revenue/Expense Head Budget Rvw FBO Variation Variation % Budget Rvw FBO Variation Variation % Budget Rvw FBO Variation Variation % Budget Rvw FBO Variation Variation % Budget Rvw FBO Variation Variation %Mining revenues NA NA NA NA NA NA NA NA NA NA NA NA NA NA NA NA NA NA NA NA
Payroll tax revenues 311.348 316 4.652 1% 329.7 320.0 -9.68 -3% 334.8 330.0 -4.847 -1% 358.9 358.0 -0.908 0% 422.3 422.0 -0.25 0%Land tax revenues 114.996 115 0.004 0% 66.5 71.0 4.512 7% 75.8 79.0 3.222 4% 89.1 98.0 8.935 10% 94.1 101.0 6.931 7%
Stamp duty conveyance revenues 274.81 320 45.19 16% 266.4 310.0 43.561 16% 232.2 291.0 58.822 25% 226.4 273.0 46.572 21% 276.2 331.0 54.82 20%Commonwealth payments 1535.207 1605 69.793 5% 1603.3 1713.0 109.721 7% 1781.6 1840.0 58.393 3% 1920.4 1992.0 71.594 4% 1886.0 1886.0 -0.002 0%
Private sector WPI (if available) NA NA NA NA NA NA NA NA NA NA NA NA NA NA NA NA NA NA NA NAMining revenues 1768 1464 -304 -17% 1378.0 1318.0 -60 -4% 1440.0 1338.0 -102 -7% 1350.0 1254.0 -96 -7% 1302.0 1189.0 -113 -9%
Payroll tax revenues 6623 6721 98 1% 7059.0 6946.0 -113 -2% 7164.0 7083.0 -81 -1% 7454.0 7461.0 7 0% 7854.0 7924.0 70 1%Land tax revenues 2482 2350 -132 -5% 2438.0 2333.0 -105 -4% 2525.0 2335.0 -190 -8% 2497.0 2467.0 -30 -1% 2764.0 2747.0 -17 -1%
Stamp duty conveyance revenues 5221 5338 117 2% 6189.0 5269.0 -920 -15% 6884.0 6765.0 -119 -2% 7290.0 8093.0 803 11% 8704.0 9581.0 877 10%Commonwealth payments 26887 26043 -844 -3% 24578.0 24466.0 -112 0% 25885.0 27306.0 1421 5% 27483.0 28067.0 584 2% 28769.0 29172.0 403 1%
Private sector WPI (if available) NA NA NA NA NA NA NA NA NA NA NA NA NA NA NA NA NA NA NA NAMining revenues 162.3 145.764 -16.536 -10% 117.7 112.0 -5.671 -5% 113.3 154.4 41.058 36% 164.1 162.3 -1.812 -1% 167.7 196.3 28.619 17%
Payroll tax revenues 164 171.447 7.447 5% 191.0 205.5 14.46 8% 215.0 250.2 35.162 16% 259.0 268.7 9.706 4% 283.0 289.6 6.59 2%Land tax revenues NA NA NA NA NA NA NA NA NA NA NA NA NA NA NA NA NA NA NA NA
Stamp duty conveyance revenues 78 93.192 15.192 19% 131.0 128.4 -2.589 -2% 130.0 144.6 14.583 11% 150.0 265.1 115.143 77% 138.0 136.0 -1.984 -1%Commonwealth payments 3790.959 3985.489 194.53 5% 3846.3 3779.2 -67.184 -2% 3850.3 3891.3 40.97 1% 4275.0 4394.1 119.025 3% 4594.4 4682.6 88.247 2%
Private sector WPI (if available) NA NA NA NA NA NA NA NA NA NA NA NA NA NA NA NA NA NA NA NAMining revenues 3257 2795 -462 -14% 2426.0 2139.0 -287 -12% 2686.0 2378.0 -308 -11% 2506.0 2058.0 -448 -18% 2350.0 2122.0 -228 -10%
Payroll tax revenues 3492 3462 -30 -1% 3715.0 3751.0 36 1% 3976.0 3914.0 -62 -2% 3955.0 3782.0 -173 -4% 3795.0 3712.0 -83 -2%Land tax revenues 1047 1013 -34 -3% 1012.0 990.0 -22 -2% 980.0 986.0 6 1% 995.0 977.0 -18 -2% 996.0 1010.0 14 1%
Stamp duty conveyance revenues 1960 2023 63 3% 1968.0 1887.0 -81 -4% 2320.0 2403.0 83 4% 2883.0 3082.0 199 7% 3117.0 3005.0 -112 -4%Commonwealth payments 21898 22749 851 4% 18506.0 18295.0 -211 -1% 20330.0 21755.0 1425 7% 23037.0 23594.0 557 2% 24869.0 23740.0 -1129 -5%
Private sector WPI (if available) NA NA NA NA NA NA NA NA NA NA NA NA NA NA NA NA NA NA NA NAMining revenues 195.75 203.69 7.94 4% 204.6 171.9 -32.7 -16% 281.8 312.3 30.5 11% 293.1 238.5 -54.6 -19% 248.7 201.4 -47.3 -19%
Payroll tax revenues 1039 1010 -29 -3% 1105 1077 -28 -3% 1139 1079 -60 -5% 1147 1096 -51 -4% 1139 1111 -28 -2%Land tax revenues 601 588 -13 -2% 576 562 -14 -2% 572 565 -7 -1% 564 559 -5 -1% 581 570 -11 -2%
Stamp duty conveyance revenues 817 764 -53 -6% 807 894 87 11% 936 874 -62 -7% 1002 1026 24 2% 1023 1007 -16 -2%Commonwealth payments 7622 7636 14 0% 6865 6655 -210 -3% 6806 6731 -75 -1% 7190 7210 20 0% 8095 7995 -100 -1%
Private sector WPI (if available) NA NA NA NA NA NA NA NA NA NA NA NA NA NA NA NA NA NA NA NAMining revenues 50 54 4 8% 41 29 -12 -29% 34.6 36 1.4 4% 29 27 -2 -7% 28 15 -13 -46%
Payroll tax revenues 302.4 304 1.6 1% 305.7 275 -30.7 -10% 298.6 300 1.4 0% 310.1 312 1.9 1% 321.5 325 3.5 1%Land tax revenues 90 88 -2 -2% 89.8 89 -0.8 -1% 86.6 86 -0.6 -1% 90.7 83 -7.7 -8% 90.4 97 6.6 7%
Stamp duty conveyance revenues 137.5 136 -1.5 -1% 131.5 139 7.5 6% 153.6 154 0.4 0% 174.1 193 18.9 11% 194.4 216 21.6 11%Commonwealth payments 2895.3 3016 120.7 4% 2861.7 2937 75.3 3% 2881.5 2976 94.5 3% 3071.7 3133 61.3 2% 3477.4 3510 32.6 1%
Private sector WPI (if available) NA NA NA NA NA NA NA NA NA NA NA NA NA NA NA NA NA NA NA NAMining revenues 4579 4343 -236 -5% 4366 4425 59 1% 6089 6025 -64 -1% 4368 4603 235 5% 3788 4126 338 9%
Payroll tax revenues 3032 3096 64 2% 3584 3476 -108 -3% 3730 3566 -164 -4% 3737 3602 -135 -4% 3697 3502 -195 -5%Land tax revenues 549 552 3 1% 569 568 -1 0% 662 661 -1 0% 750 744 -6 -1% 949 948 -1 0%
Stamp duty conveyance revenues 1291 1362 71 5% 1624 1870 246 15% 2047 1969 -78 -4% 1882 1699 -183 -10% 1546 1756 210 14%Commonwealth payments 8599 8633 34 0% 7693 7781 88 1% 7583 7498 -85 -1% 7533 7810 277 4% 6748 7038 290 4%
Private sector WPI (if available) NA NA NA NA NA NA NA NA NA NA NA NA NA NA NA NA NA NA NA NAMining revenues 45.7 65.6 19.9 44% 46.3 45.1 -1.2 -3% 47.5 52.4 4.9 10% 51.4 44.3 -7.1 -14% 51.2 49 -2.2 -4%
Payroll tax revenues 4659.8 4695.8 36 1% 4868.5 4750.9 -117.6 -2% 4910 4949.1 39.1 1% 5148.4 5135 -13.4 0% 5394.2 5365 -29.2 -1%Land tax revenues 1360.1 1401.4 41.3 3% 1587.3 1589.2 1.9 0% 1566.4 1658.7 92.3 6% 1750.9 1753 2.1 0% 1740.6 1771 30.4 2%
Stamp duty conveyance revenues 3650.6 3307 -343.6 -9% 3162 3276.1 114.1 4% 3908.6 4167.5 258.9 7% 4472 4938 466 10% 5418 5839 421 8%Commonwealth payments 19728.3 19818.4 90.1 0% 19113.4 19155.9 42.5 0% 20539 22440.6 1901.6 9% 21448.3 21010.3 -438 -2% 22343.6 22309 -34.6 0%
Private sector WPI (if available) NA NA NA NA NA NA NA NA NA NA NA NA NA NA NA NA NA NA NA NA
2014-15 ($ amounts in $mn) 2015-16 ($ amounts in $mn)
WA
VIC
ACT
NSW
NT
QLD
SA
TAS
2011-12 ($ amounts in $mn) 2012-13 ($ amounts in $mn) 2013-14 ($ amounts in $mn)
81
Appendix 1- Results of Reality Check

7.6 ATTACHMENT F
Commonwealth Budgeted Infrastructure Funding 2016-17 to 2020-21
$million
NSW VIC QLD WA SA TAS ACT NT Total
Total Payments (exc FAGs) Non-allocated Component
2016-17 3,616.401 599.463 1,840.163 615.973 619.245 145.486 28.661 96.378 7,561.771
2017-18 3,058.684 792.897 2,049.140 696.838 921.169 173.650 45.110 223.873 7,961.361
2018-19 2,240.607 568.542 1,874.978 784.526 473.867 115.175 21.528 140.860 6,220.083
2019-20 1,264.576 606.252 1,866.708 670.505 349.381 53.477 10.839 80.984 5,102.722 200.000National Rail Program
2020-21 859.972 280.687 1,652.625 812.834 95.159 61.645 18.443 20.766 4,202.131 400.000National Rail Program
Local Govt Payments (C'W Own Purpose Expense)
2016-17 237.413 166.776 177.800 117.836 72.427 26.226 14.465 23.452 836.395
2017-18 197.566 143.938 144.900 102.400 62.960 22.800 9.666 20.400 704.630
2018-19 87.324 75.969 88.384 63.339 32.559 11.221 1.461 9.259 369.516
2019-20 111.489 81.382 81.360 58.487 35.939 13.020 6.375 11.627 399.679
2020-21 111.489 81.382 81.36 58.487 35.939 13.02 6.375 11.627 399.679
State Govt Payments
2016-17 3,378.988 432.687 1,662.363 498.137 546.818 119.260 14.196 72.926 6,725.376
2017-18 2,861.118 648.959 1,904.240 594.438 858.209 150.850 35.444 203.473 7,256.731
2018-19 2,153.283 492.573 1,786.594 721.187 441.308 103.954 20.067 131.601 5,850.567
2019-20 1,153.087 524.870 1,785.348 612.018 313.442 40.457 4.464 69.357 4,703.043
2020-21
State Govt Payments per capita
2016-17 434.14 70.60 341.10 189.44 319.27 229.35 35.56 297.71 276.86
2017-18 362.04 103.83 385.33 222.83 496.79 288.93 87.63 826.17 294.24
2018-19 268.24 77.25 356.47 266.42 253.19 198.27 48.96 531.27 233.58
2019-20 141.34 80.65 351.17 222.74 178.17 76.83 10.75 278.26 184.81
2020-21
82

Average per capita 301.44 83.08 358.52 225.36 311.85 198.35 45.72 483.35 247.37
FAGs - Local Roads Comp
2016-17 309.619 220.010 199.948 163.171 58.648 56.552 34.220 24.999 1,067.167
2017-18 105.532 74.990 68.151 55.617 19.990 19.275 11.663 8.520 363.738
2018-19 219.001 155.620 141.428 115.415 41.483 40.001 24.204 17.682 754.834
2019-20 229.732 163.245 148.358 121.071 43.516 41.961 25.390 18.548 791.821
2020-21 231.133 164.242 149.263 121.809 43.781 42.217 25.545 18.661 796.651
FAGs - Local Roads Component per capita
Non-allocated Component
2016-17 39.78 35.90 41.03 62.05 34.24 108.76 85.71 102.05 43.93
2017-18 13.35 12.00 13.79 20.85 11.57 36.92 28.83 34.59 14.75
2018-19 27.28 24.41 28.22 42.64 23.80 76.29 59.06 71.38 30.14
2019-20 28.16 25.08 29.18 44.06 24.74 79.68 61.12 74.41 31.11
2020-21 27.87 24.72 28.94 43.67 24.65 79.81 60.67 74.38 30.80
Average per capita 27.29 24.42 28.23 42.65 23.80 76.29 59.08 71.37 30.15
State Govt+FAGs Roads per capita
Average per capita 328.73 107.50 386.75 268.01 335.65 274.64 104.80 554.72 277.52
"Relativity" 1.185 0.387 1.394 0.966 1.209 0.990 0.378 1.999 1.000CGC Infrastructure Category factor 0.932 0.957 1.007 1.326 0.890 0.693 0.786 2.347 1.000
State Populations NSW VIC QLD WA SA TAS ACT NT Total
2016-17 7,783,143 6,128,689 4,873,561 2,629,495 1,712,732 519,981 399,268 244,959 24,291,828
2017-18 7,902,664 6,250,329 4,941,791 2,667,621 1,727,517 522,100 404,485 246,285 24,662,792
2018-19 8,027,329 6,376,500 5,011,848 2,706,954 1,742,982 524,300 409,855 247,708 25,047,476
2019-20 8,158,090 6,507,990 5,084,020 2,747,678 1,759,255 526,595 415,403 249,251 25,448,282
2020-21 8,294,112 6,644,058 5,157,784 2,789,486 1,776,157 528,941 421,082 250,881 25,862,501
83
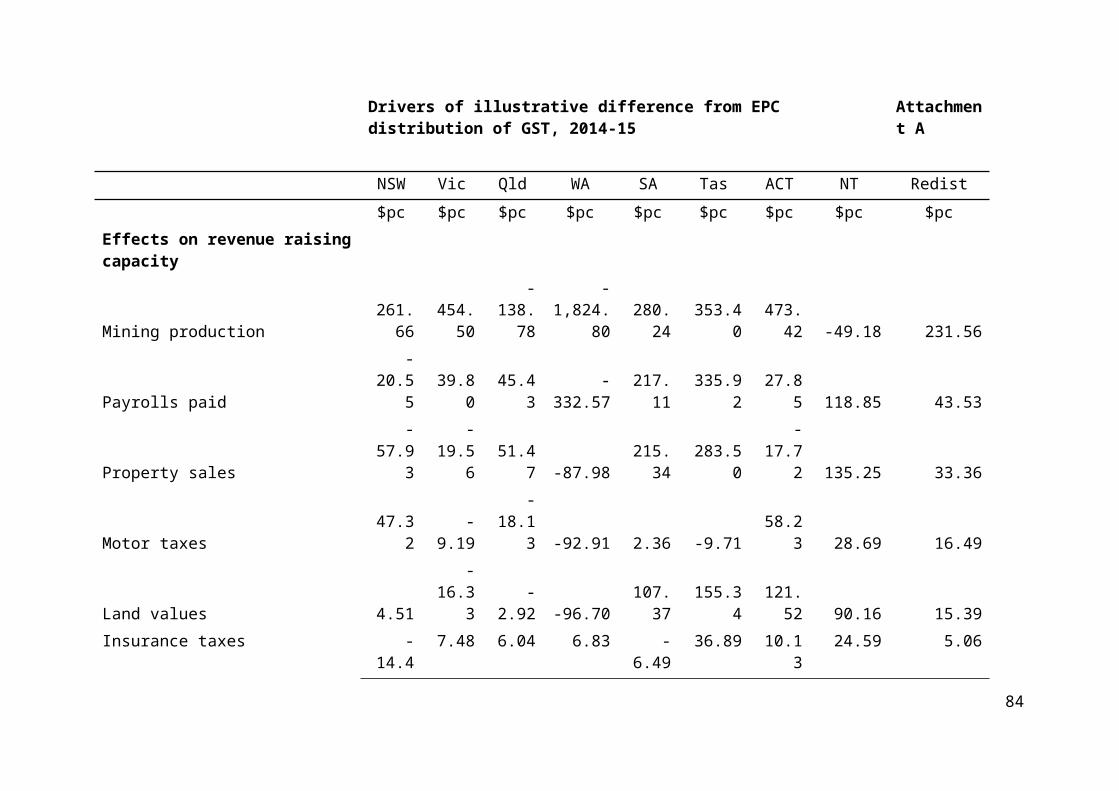
7.7 ATTACHMENT G
National Partnership Payments ($million) 2013-14 2014-15 2015-16 2016-17 2017-18 2018-19 2019-20 Equalisation - Current
Infrastructure Investment ProgrammeBlack Spot projects 64.5 60.0 60.0 60.0 60.0 State roads 100% EQ (a)Bridges renewal programme 60.0 60.0 60.0 60.0 State roads 100% EQ (a)Heavy vehicle safety and productivity 40.0 48.0 40.0 40.0 40.0 100% EQImproving the national network 0.8Investment Rail 332.7 353.7 124.2 23.5 24.6 100% EQ Road 4,279.6 3,005.9 3,973.4 5,311.6 2,780.0 50% EQ - NNR (b)Off-network projects Rail 89.6 115.9 219.0 160.1 3.0 100% EQ Road 404.8 556.4 354.3 395.4 222.6 100% EQ Supplementary 7.5Roads to Recovery 373.2 349.8 349.8 349.8 349.8 State roads 100% EQ (a)
Infrastructure Growth PackageAsset Recycling Fund Asset Recycling Initiative 335.0 1,278.0 1,285.0 1,007.0 0% EQ - ToR New investments 201.7 1,010.1 969.2 519.3 50% EQ - ToR Western Sydney Infrastructure Plan 103.0 210.2 351.6 530.9 50% EQ - ToR
Other ProjectsBuilding Australia Fund Rail 1,128.0 331.0 232.1 100% EQ Road 72.0 48.1 50% EQ - NNR (b)Community Infrastructure Grants - Glenbrook precinct upgrade 0.8 100% EQInterstate road transport 77.0 77.0 77.0 77.0 77.0 100% EQLatrobe Valley economic diversification 2.4 5.4 3.1 State roads 100% EQ (a)Liveable communities 9.5 State roads 100% EQ (a)Local Government and Regional Development - infrastructure employment projects 1.6 0% EQ - LocalManaged motorways 20.8 9.4 100% EQMurray-Darling Basin regional economic diversification programme 10.0 32.5 30.5 24.7 100% EQTownsville Convention and Entertainment Centre 5.0 0% EQ - Local
Total 6,919.8 5,692.8 8,021.7 9,107.9 5,674.2
84

2013-14 2014-15 2015-16 2016-17 2017-18 2018-19 2019-20
Category Totals - All Other States100% EQ Total (CGC Approach) 2,559.0 1,990.1 1,534.2 1,180.3 828.4100% EQ Total (ACT Proposal) 6,775.3 4,946.5 5,494.5 6,489.7 3,607.350% EQ Total (CGC Approach) 4,288.3 3,308.4 5,172.6 6,627.0 3,828.550% EQ Total (ACT Proposal) 0.0 303.9 1,212.3 1,317.6 1,049.70% EQ Total 6.6 325.0 1,278.0 1,285.0 1,007.0
Redistributed to ACT ($m)CGC Approach2013-14 payments 25.9 25.9 25.92014-15 payments 20.0 20.0 20.02015-16 payments 22.7 22.7 22.72016-17 payments 24.7 24.72017-18 payments 15.1Total - CGC Approach 0.0 0.0 25.9 45.9 68.6 67.4 62.5
ACT Proposal2013-14 payments 37.3 37.3 37.32014-15 payments 28.0 28.0 28.02015-16 payments 33.6 33.6 33.62016-17 payments 39.3 39.32017-18 payments 22.7Total - ACT Proposal 0.0 0.0 37.3 65.3 98.9 100.9 95.6
Notes:(a) All payments for State roads equalised, but any for local roads will be excluded.(b) ACT proposal is 100% EQ for NNR.
85

7.8 ATTACHMENT H
NEEDS-BASED FUNDING MODELS AND EQUALISATION
Needs-Based Funding Models
Major reforms in recent years to Health and Education funding from the Commonwealth have changed the basis of distribution of tied (section 96) grants to States in the form of Specific Purpose Payments (SPPs). The National Health Reform Agreement (NHRA) and National Education Reform Agreement (NERA) moved the basis of allocation to States from equal per capita to an individual needs basis. The individual needs basis of allocation is represented by the Activity Based Funding (ABF) method in Health and the Schooling Resource Standard (SRS) in Education.
Although there was a change in Federal Government in 2013, the fundamental basis of these reforms has not changed. In relation to Health, the Commonwealth and States signed an agreement in April 2016 to extend the current funding arrangements, including ABF and the National Efficient Price, for three years to June 2020. In relation to Education, the Commonwealth Government has maintained the current SRS-based funding to the end of 2017, and has proposed a revised version of this model (“Gonski 2.0”) to commence from the 2018 school year.
Activity Based Funding Model - Health
Allocation of funding to States under the ABF model is determined by the actual number of hospital-based services delivered by each State, weighted according to the resource impact of each type of service. The weighted number of services is multiplied by a national efficient price (NEP) set by an independent body, the Independent Hospital Pricing Authority (IHPA).
The NEP includes loadings (adjustments) which are designed to take account of legitimate and unavoidable variations in the costs of delivering health care services, including remoteness, indigeneity, private contributions and patient complexity.
Schooling Resource Standard - Education
Allocation of funding to States under the SRS model is determined by the actual number of students enrolled at each public school, with student-based loadings for disability, indigeneity, low socio-economic status (SES), and low English proficiency; and school-based loadings for school location and school size.
86

Per student funding for non-government schools is also adjusted according to each school’s capacity to contribute, which takes into account parents’ ability to contribute, based on the average SES of their residential area, and other sources of private income.
Alternative Funding Models
The other main sectors of Commonwealth SPP funding to States are Disability Services, Skills and Workforce Development, and Housing.
Following the Intergovernmental Agreement on Federal Financial Relations of 2008, these three SPPs progressively transitioned to an equal per capita (EPC) allocation over a five-year period, ending in July 2014. While the Skills and Housing SPPs continue to be allocated on an EPC basis, the Disability SPP is now being phased out during the transition to the National Disability Insurance Scheme (NDIS).
NDIS represents a different model again, with EPC contributions from States, which are in the nature of insurance premiums for all their citizens, and allocation of funds to individual participants on a needs basis.
Equalisation by the Commonwealth Grants Commission
The horizontal fiscal equalisation (HFE) process carried out annually by the Commonwealth Grants Commission (CGC) aims to give all States the capacity to deliver services at the same standard, after allowing for material factors affecting expenditures, and assuming that each State operates at the same level of efficiency. This is achieved through allocation of the Goods and Services Tax (GST) revenue on a differential basis between States.
The “material factors affecting expenditures” refers to key drivers of expenditure differences which are not under the policy control of State governments. The most common drivers across a range of expenditure categories are socio-demographic factors, including socio-economic status, indigenous status and remoteness; wage costs; service delivery scale; administrative scale; population growth; urban centre size; impact of natural disasters; and impact of the non-State sector.
87

Are Needs-Based Funding Models and Equalisation in Conflict ?
Needs-based funding models delivered through tied grants in the form of SPPs determine needs of broad populations groups which are considered to differ significantly in the amount of funding per person required to deliver an equivalent outcome. This is very similar to the HFE assessment process, and in both cases leads to an aggregation and allocation of funding at State level. In theory at least, there is significant potential for overlap or conflict.
NDIS differs significantly in that needs are determined for each individual, in accordance with a set of criteria, and funding is allocated to the individual as a “package”. In conventional economic terms this can be characterised as a “voucher” system. Voucher systems have been most commonly advocated and used (in the US) for funding schools, and potentially the SRS could have been converted into a voucher system.
As a national scheme with State contributions on an EPC basis, NDIS has removed the need for CGC involvement via HFE. Once Full Scheme NDIS is in place, there will be no equalisation required for the disability sector (except to the extent that some residual State funded services may remain).
However, funding in other sectors does not, and is not likely to, operate under a national contributory scheme, so the CGC will continue to be involved for the foreseeable future. So far, a range of different models have been applied to the interaction of needs-based funding and HFE in the main sectors of Commonwealth funding, with no particular logic to explain why the different approaches have been adopted. The Skills/Housing model represents one end of a spectrum, giving the whole task of needs-based assessment to the CGC. The Education and Health models represent two variants in the middle of the spectrum, with hybrid approaches combining needs-based elements in the Commonwealth funding arrangements with complementary needs-based elements in the CGC’s assessments.
NDIS could be considered as representing the other end of the spectrum, where the Commonwealth funding model reflects all relevant needs and there is no redistributive role for the CGC.
The Education Model
The Education model operates on the principle that the SRS funding model defines needs for all Commonwealth government funding of public schools, with terms of reference to the CGC requiring that there be “no unwinding” of the SRS model.
88

However, the CGC does apply equalisation for drivers of expenses which lie outside the scope of the SRS model, principally wage costs. The logic underlying this distinction is that the needs-based funding models focus (largely) on the needs of users, while HFE takes account both of these “use disabilities” and of expense factors related to service inputs or “cost disabilities”.
HFE for Schools Education is complicated by the application of a conventional approach to the rest of public school expenditure which is funded by State governments’ own source revenue. This approach uses the CGC’s model to assess the impact of socio-demographic composition and other drivers (as mentioned above) to determine each State’s needs. Although the assessment of this stream of expenditure is based on what States actually do, to the extent that any State’s funding model for schools differs from the CGC’s methodology in its assessment of needs, the CGC’s model will override the State model.
The Skills/Housing Model
The Skills/Housing model operates on an EPC basis, with no attempt to differentiate between States or their user populations on the basis of need. This leaves the field clear for the CGC to apply its standard assessment process to determine needs and equalise differences between States through the GST allocation. Thus there is no issue of overriding or conflict between the allocation methods.
The Health Model
The Health model has one component of the Commonwealth funding, that relating to cross-border services, which is specifically constrained by provisions of the NHRA and associated terms of reference to the CGC. These provisions require that the arrangement for direct cross-border payments to the States where the services are provided do not result in any “adverse GST distribution effects”. This is achieved in practice by the CGC assessing Commonwealth payments according to the State of residence of the patient, not the State of provision.
For all other expenditure funded both by the Commonwealth and by the State Governments, the HFE process has free reign, as the NHRA provides that the IHPA, which sets the price (NEP) for hospital services, should not seek to duplicate the work of the Commonwealth Grants Commission in determining relativities.
However, the CGC in its assessment uses relevant NEP loadings in the determination of socio-demographic composition factors.
89

Thus, the NEP loadings for indigeneity and remoteness are used, while for age and socio-economic status, which are not covered by NEP loadings, the CGC uses the National Hospital Cost Data Collection to determine the appropriate weightings for differential use and costs. This means that the CGC assessment complements the NEP loadings. In similar fashion to the Schools Education assessment, the CGC also adjusts for location cost differences, in particular wage costs, as these are outside the scope of the NEP.
A key difference between the Health and Education models is that under the Health model the CGC applies a uniform approach to its assessment of expenditure needs, regardless of the funding source for the expenditure, whereas the Education model involves two different approaches to the assessment of expenditure needs, depending on the source of the funding.
How Does Overriding/Unwinding Operate ?
The CGC’s conventional process involves a comprehensive assessment of State expenditure needs in each category, based on drivers of expenditure which are not susceptible to influence by State government policy. Needs cover both use and cost disabilities. Once needs have been assessed in dollar terms for each State, the Commonwealth payments actually received by each State are then deducted from its assessed needs to give a net outcome for GST distribution. This amounts to what is called an “actual per capita” treatment of the Commonwealth payments as revenue.
The consequence is that any State which receives a share of Commonwealth payments greater than the share determined by the CGC’s assessment of expenditure needs will incur an equal offsetting loss in GST compared with an EPC assessment. Similarly, any State which receives a share of Commonwealth payments less than the share determined by the CGC’s assessment of expenditure needs will receive an equal offsetting gain in GST compared with an EPC assessment.
This constitutes overriding or unwinding of any needs-based factors in the Commonwealth funding model, to the extent that the latter determination of needs differs from the CGC’s assessment of needs. If the two assessments of need are very similar, the degree of unwinding will be minimal; if they diverge substantially, the degree of unwinding will be large.
90
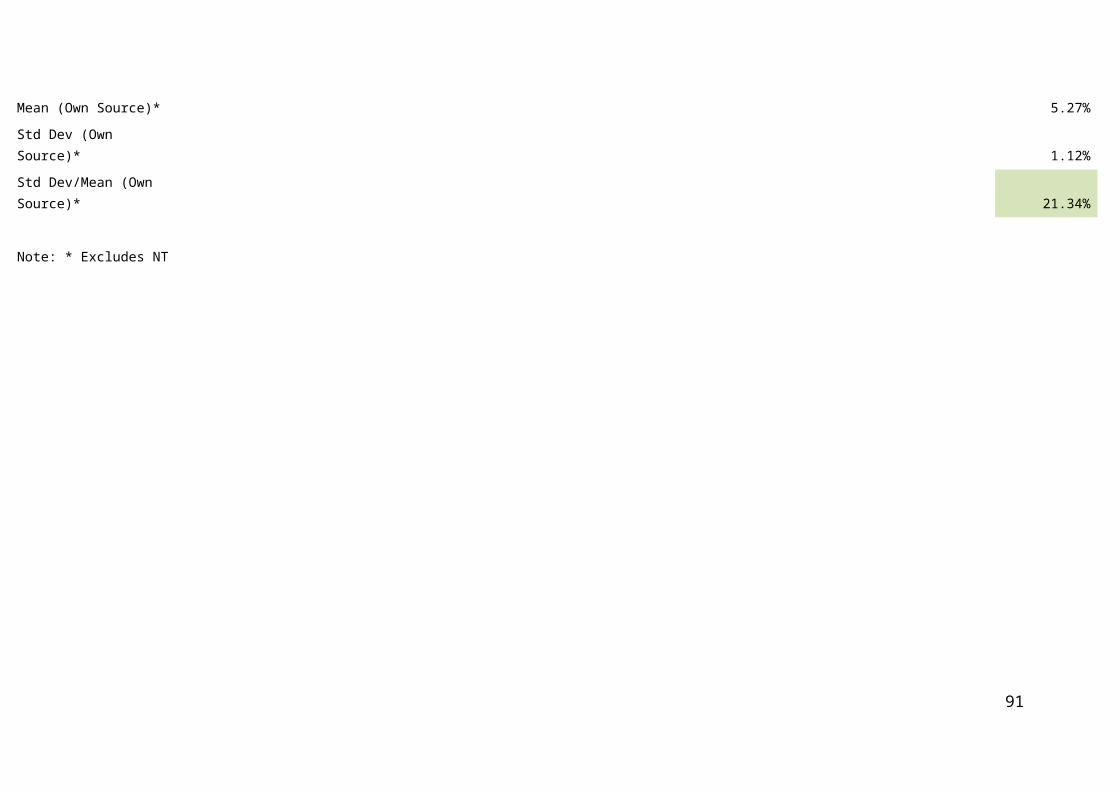
Options for Change
In the future development of new, or revision of existing, Commonwealth funding models in major sectors of State service delivery it would make sense to deliberately consider for each model whether a needs-based allocation of funding should be the objective and, if so, how the role of the CGC and the HFE process fits into that. Commonwealth Treasury should as a matter of course seek the advice of the CGC early in the development of such models.
A major option for change would be to adopt an EPC method of allocating the Commonwealth funds to States and then allow the HFE process to determine the relevant needs and allocate GST accordingly. This approach has the advantage of avoiding duplication and unwinding, and ensures a consistent and comprehensive approach to needs. However, it places a heavier reliance on the GST than other approaches, requiring a larger amount of GST to achieve equalisation and increasing the spread of relativities between States. It could also be seen as less transparent than other options, because of the generally low profile of the CGC and lack of widespread understanding of the equalisation process.
The main alternative to the above approach would be to apply a comprehensive needs-based approach to allocation of the Commonwealth funding and then quarantine expenditure of this funding, through terms of reference to the CGC, from redistribution or unwinding via the HFE process. CGC advice could still be drawn on in the development of the parameters of such funding models. This approach would also avoid duplication and unwinding in relation to the Commonwealth funding allocation, though there is the issue of whether it is desirable for expenditure funded by State-own revenue to then be assessed by the CGC on a different needs basis from the assessment of the Commonwealth-funded expenditure.
This alternative would require a lesser reliance on the GST to achieve equalisation than the first option and would reduce the spread of relativities between States. It would also mean that States with higher per capita expenditure needs would receive more of their funding as tied grants compared with the first option, which would give higher needs States a relatively greater share of untied funds (GST revenue).
Federal Financial Relations
ACT Treasury
15 June 2017
91
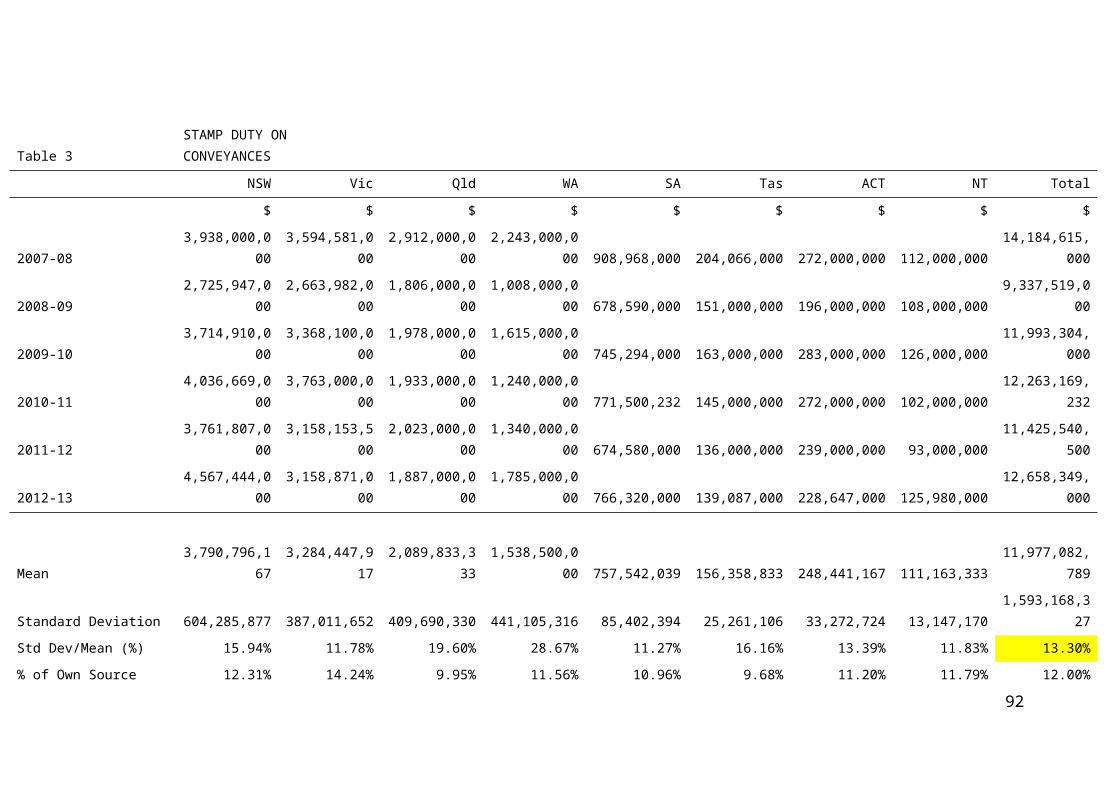
S No Country Features of Equalization
1 Belgium
1. Calculate per-capita personal income tax for the region2. Calculate average per-capita personal income tax for the nation3. Wherever there's a shortfall, fund transfer from the federation to the state.4. Weights: i) An indexing factor using CPI and population growth ii) Amounts received by beneficiaries when the system was introduced
2 Canada
Why? Equalization payments enable less prosperous provincial governments to provide their residents with public services that are reasonably comparable to those in other provinces, at reasonably comparable levels of taxation.1. Equalization entitlements decided by taking into account fiscal capacity, i.e. ability to raise revenues.2. Before any adjustments, a province's per capita Equalization entitlement is equal to the amount by which its fiscal capacity is below the average fiscal capacity of all provinces – known as the "10 province standard"3. Provinces get the greater of the amount they would receive by fully excluding natural resource revenues, or by excluding 50 per cent of natural resource revenues.4. Equalization is also adjusted to keep the total program payout growing in line with the economy. The growth path is based on a three-year moving average of gross domestic product (GDP) growth. This helps to ensure stability and predictability while still being responsive to economic growth.
Territories are not included in equalization and are funded separately through Territorial Formula Financing (TFF) program.1. Drivers of TFF: high cost of providing public services in the North as well as high cost of servicing small and isolated communities.2. TFF takes into account a proxy for expenses thru Gross Expenditure Base and capacity to generate revenues (eligible revenues).
3 Germany
While spirit of equalization is the same as in Aus, Germany has more of an 'implicit' system of equalization, using taxation on the basis of residence and place of work.1. Again, a fiscal capacity based system, does not take any expenditure into account.2. Lots of checks put in place to ensure that federal grants can make up for shortfall in differences with average tax revenue (in terms of EPC). Not very relevant to our discussion or the PC's review. However, the system works in a way that the range is limited to 90.5% to 105.5% of the national average. Again, potentially not applicable for Australia given the significant disparity that exists in NT.
4 Switzerland
Federal system of National Fiscal Equalisation based on availability of financial resources and cost of service delivery, much like Australia.Financial resource availability is calculated based on availability of taxable incomes from individuals and businessesTarget for financial resource availability of at least 85% of national average to every canton (State)Funds to weaker cantons given from both strong cantons (horizontal resource equalisation) and the confederation government (vertical resource equalisation)Relatively recently changed the NFE system (2008). System change included a temporary (maximum of 28 years) cohesion fund for compensating financially weaker cantons that lost out on the system change. The pool for the fund continually decreases by 5% per annum from 2016 (8 years after introduction)
7.9 ATTACHMENT I
Fiscal Equalisation across Countries
92