submicrosecond speed optical coherence tomography system design and analysis by use of...
TRANSCRIPT

Submicrosecond speed optical coherencetomography system design and analysis by use ofacousto-optics
Nabeel A. Riza and Zahid Yaqoob
A novel high-speed no-moving-parts optical coherence tomography �OCT� system is introduced thatacquires sample data at less than a microsecond per data point sampling rate. The basic principle of theproposed OCT system relies on use of an acousto-optic deflector. This OCT system has the attractivefeatures of an acousto-optic scanning heterodyne interferometer coupled with an acousto-optic �AO�variable optical delay line operating in a reflective mode. Fundamentally, OCT systems use a broad-band light source for high axial resolution inside the sample or living tissue under examination. In-herently, AO devices are Bragg-mode wavelength-sensitive elements. We identify that two beamsgenerated by a Bragg cell naturally have unbalanced and inverse spectrums with respect to each other.This mismatch in spectrums in turn violates the ideal autocorrelation condition for a high signal-to-noiseratio broadband interferometric sensor such as OCT. We solve this fundamental limitation of Bragg celluse for OCT by deploying a new interferometric architecture where the two interfering beams have thesame power spectral profile over the bandwidth of the broadband source. With the proposed AO basedsystem, high �e.g., megahertz� intermediate frequency can be generated for low 1�f noise heterodynedetection. System issues such as resolution, number of axial scans, and delay-path selection time areaddressed. Experiments described demonstrate our high-speed acousto-optically tuned OCT systemwhere optical delay lines can be selected at submicrosecond speeds. © 2003 Optical Society of America
OCIS codes: 110.0110, 110.4500, 230.0040, 230.1040.
1. Introduction
Optical coherence tomography �OCT� is a vital non-invasive biomedical tool for high-resolution subsur-face tissue diagnostics. OCT systems are based onlow-coherence interferometry and therefore usebroadband sources with an optical heterodyne ar-rangement. The broadband source provides a coher-ence gate inside the tissue under examination toachieve path-length selectivity and hence high reso-lution along the optical axis.1,2 So far, OCT systemshave deployed mechanical means for varying the op-tical path lengths between the interfering beams toimplement imaging of a sample along the optical
The authors are with the Photonic Information Processing Sys-tems Laboratory, School of Optics, Center for Research and Edu-cation in Optics and Lasers, University of Central Florida, 4000Central Florida Boulevard, Orlando, Florida 32816-2700. Thee-mail address for N. A. Riza is [email protected].
Received 31 August 2002; revised manuscript received 28 Octo-ber 2002.
0003-6935�03�163018-09$15.00�0© 2003 Optical Society of America
3018 APPLIED OPTICS � Vol. 42, No. 16 � 1 June 2003
beam axis.3,4 Because dynamic tissue analysis withreal-time measurements can lead to advanced diag-nostics, it would be highly desirable if this variableoptical delay line in OCT could be implemented witha high-speed no-moving-parts mechanism. Using anovel acousto-optic �AO� scanning heterodyne inter-ferometer5 and acousto-optically switched high-speedoptical delay lines,6 we introduce such a high-speedOCT system. In our first AO-based OCT system7 weused a narrowband source at 786 nm with a 0.29-Åspectral width. As a next step, we extended andimproved the high-speed AO-based OCT system con-cept in light of the experimental realities of using abroadband source.8 In this paper we present a sys-tematic theoretical analysis of an AO Bragg deviceused with a broadband laser source. Our analysisshows that an acousto-optic deflector �AOD� can be anattractive choice in the design of a high-speed OCTsystem if the system is designed to counter the un-balanced spectral spoiling in Bragg diffraction. Ex-perimental results are also provided to support thetheoretical discussion and study the basic operationof our AO-based OCT system. Specifically, we use asuperluminescent diode �SLD�9 with a 1553.7-nm
center wavelength and a 51.4-nm full width at half-maximum �FWHM� spectral width.
2. Acousto-Optic Bragg Cell Filter Response andOptical Coherence Tomography Requirements
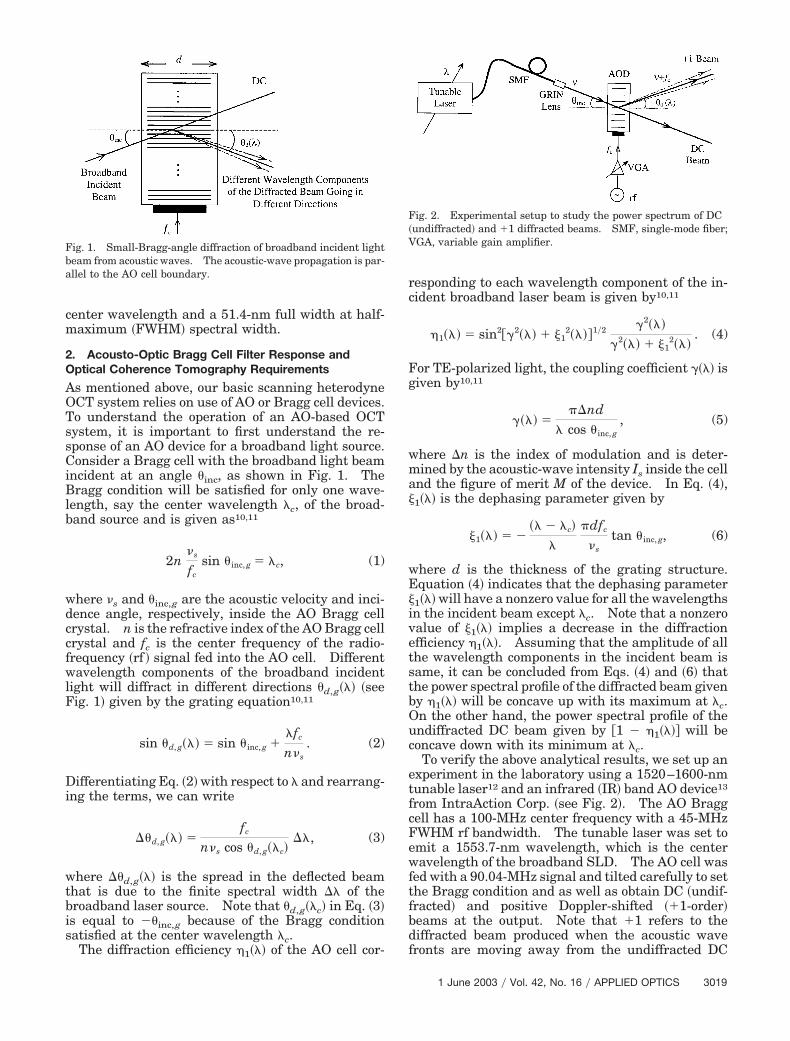
As mentioned above, our basic scanning heterodyneOCT system relies on use of AO or Bragg cell devices.To understand the operation of an AO-based OCTsystem, it is important to first understand the re-sponse of an AO device for a broadband light source.Consider a Bragg cell with the broadband light beamincident at an angle �inc, as shown in Fig. 1. TheBragg condition will be satisfied for only one wave-length, say the center wavelength �c, of the broad-band source and is given as10,11
2n�s
fcsin �inc, g � �c, (1)
where �s and �inc,g are the acoustic velocity and inci-dence angle, respectively, inside the AO Bragg cellcrystal. n is the refractive index of the AO Bragg cellcrystal and fc is the center frequency of the radio-frequency �rf � signal fed into the AO cell. Differentwavelength components of the broadband incidentlight will diffract in different directions �d,g��� �seeFig. 1� given by the grating equation10,11
sin �d, g��� � sin �inc, g ��fc
n�s. (2)
Differentiating Eq. �2� with respect to � and rearrang-ing the terms, we can write
��d, g��� �fc
n�s cos �d, g��c���, (3)
where ��d,g��� is the spread in the deflected beamthat is due to the finite spectral width �� of thebroadband laser source. Note that �d,g��c� in Eq. �3�is equal to ��inc,g because of the Bragg conditionsatisfied at the center wavelength �c.
The diffraction efficiency �1��� of the AO cell cor-
responding to each wavelength component of the in-cident broadband laser beam is given by10,11
�1��� � sin22��� � �12����1�2 2���
2��� � �12���
. (4)
For TE-polarized light, the coupling coefficient ��� isgiven by10,11
��� � �nd
� cos �inc, g, (5)
where �n is the index of modulation and is deter-mined by the acoustic-wave intensity Is inside the celland the figure of merit M of the device. In Eq. �4�,�1��� is the dephasing parameter given by
�1��� � ��� � �c�
�
dfc
�stan �inc, g, (6)
where d is the thickness of the grating structure.Equation �4� indicates that the dephasing parameter�1��� will have a nonzero value for all the wavelengthsin the incident beam except �c. Note that a nonzerovalue of �1��� implies a decrease in the diffractionefficiency �1���. Assuming that the amplitude of allthe wavelength components in the incident beam issame, it can be concluded from Eqs. �4� and �6� thatthe power spectral profile of the diffracted beam givenby �1��� will be concave up with its maximum at �c.On the other hand, the power spectral profile of theundiffracted DC beam given by 1 � �1���� will beconcave down with its minimum at �c.
To verify the above analytical results, we set up anexperiment in the laboratory using a 1520–1600-nmtunable laser12 and an infrared �IR� band AO device13
from IntraAction Corp. �see Fig. 2�. The AO Braggcell has a 100-MHz center frequency with a 45-MHzFWHM rf bandwidth. The tunable laser was set toemit a 1553.7-nm wavelength, which is the centerwavelength of the broadband SLD. The AO cell wasfed with a 90.04-MHz signal and tilted carefully to setthe Bragg condition and as well as obtain DC �undif-fracted� and positive Doppler-shifted ��1-order�beams at the output. Note that �1 refers to thediffracted beam produced when the acoustic wavefronts are moving away from the undiffracted DC
Fig. 1. Small-Bragg-angle diffraction of broadband incident lightbeam from acoustic waves. The acoustic-wave propagation is par-allel to the AO cell boundary.
Fig. 2. Experimental setup to study the power spectrum of DC�undiffracted� and �1 diffracted beams. SMF, single-mode fiber;VGA, variable gain amplifier.
1 June 2003 � Vol. 42, No. 16 � APPLIED OPTICS 3019

beam. The rf peak voltage was adjusted to set theAO Bragg cell to 50% diffraction efficiency at a1553.7-nm wavelength. The tunable laser was thentuned from 1520 to 1600 nm, and power in both theDC and the �1-order beams was measured. Figure3�a� shows plots of both the DC and the �1-orderbeams versus the wavelength of the tunable source.The angular tilt of the AO device was then set togenerate DC and negative Doppler-shifted ��1-order�beams at the output with 50% diffraction efficiencyfor the center wavelength 1553.7 nm. Here �1 re-fers to the diffracted beam produced when the acous-tic wave fronts are moving toward the undiffractedDC beam. The tunable laser was tuned again from1520 to 1600 nm to measure power in both the DCand the �1-order beams. Figure 3�b� shows plots ofboth the DC and the �1-order beams versus thewavelength of the tunable source. The two plots aresimilar, which shows that an AO device behaves in asimilar fashion whether it is set to generate a �1-order beam or a �1-order beam. The two plots alsoindicate that, for a broadband source �with a uniform
power spectral profile�, the power spectrum of thedc beam is exactly opposite of that of the �1 or �1beam. If s��� is the light source spectrum of thebroadband source, the power spectrum of the DCbeam will be s���1 � �1���� and that of the �1 or �1beam will be s����1���. Since heterodyne detectionideally has the highest signal-to-noise ratio whentwo optical beams are mixed with an identical spec-tral profile, i.e., the autocorrelation condition, wecan conclude that the DC and single-diffraction ��1or �1� beams are limited in operations for the for-mation of an OCT system where a Bragg cell is usedfor such functions as beam scanning and beamDoppler shift.
Since OCT systems have a reflective design thatcollects the scattered light carrying useful informa-tion from a tissue under study and our OCT systemis designed to implement this reflective mode, itwould be desirable to see the power spectrums ofthe two beams �DC and �1� when they pass throughthe AO cell for the second Bragg diffraction afterretroreflection. As shown in Fig. 4, after retrore-flection the DC beam passes through the Bragg celland generates two beams, namely, the �DC, DC�and �DC, �1� beams. Similarly, the �1 diffractedbeam after retroreflection passes through the Braggcell and generates two beams, namely, the ��1, DC�and ��1, �1� beams. Note that the �DC, DC� beamis collinear with the ��1, �1� beam and the ��1,DC� beam is collinear with the �DC, �1� beam. Itis extremely important to note that the wavelength-dependent diffraction efficiencies �of the AO device�for the �1-order and �1-order diffracted beams areidentical only when all the spectral components ofthe incident broadband beam are collinear or par-allel. However, if the spectral components are spa-tially dispersed in space such as in the case of theretroreflected �1-order beam incident on the AOcell for second diffraction �see Fig. 4��, the expres-sion for diffraction efficiency will also be affected bythe Bragg-angle mismatch for different wavelengthcomponents of the broadband beam. The diffrac-
Fig. 3. Plots showing the measured power spectrum of �a� DC and�1 order and �b� DC and �1-order diffracted beams.
Fig. 4. Schematic to show various beams generated by a Braggcell operating in reflective mode. Note that the ��1, DC� and �DC,�1� beams are not angularly separated. The angular separationindicated is due to the fact that different wavelengths within thebroadband source beam are deflected at different angles.
3020 APPLIED OPTICS � Vol. 42, No. 16 � 1 June 2003

tion efficiency for the retroreflected �1-order beamwill be10,11
�2��� � sin22��� � �22����1�2 2���
2��� � �22���
, (7)
where ��� is given by Eq. �5� and the dephasingparameter �2��� is modified as
�2��� � dfc
�s���d, g��� �
�� � �c�
�tan �inc, g� . (8)
Substituting Eq. �3� in Eq. �8�, we obtain
�2��� � dfc
�s� fc
n�s cos �d, g��c��
tan �inc, g
� ��� � �c�.
(9)
Therefore, if s��� is the input broadband light sourcespectrum, the power spectrum of the �DC, DC� and��1, �1� beams will be s���1 � �1����2 ands����1����2����, respectively. On the other hand,the power spectrum of the �DC, �1� and ��1, DC�beams will be s����1���1 � �1���� and s����1���1 ��2����, respectively. Now there are four beams, a�DC, DC� beam collinear with a ��1, �1� beam and a�DC, �1� beam collinear with a ��1, DC� beam, avail-able for signal processing. To figure out which of thepairs to use for heterodyne detection, we define
�1��� � 1 � �1����2
�2��� � �1����2���
�3��� � �1���1 � �1����
�4��� � �1���1 � �2����� . (10)
For the four beams available for signal processing,the power spectrums can now be written as
DC, DC3 s����1��� or s����1���
�1, �13 s����2��� or s����2���
DC, �13 s����3��� or s����3���
�1, DC3 s����4��� or s����4���
� . (11)
To see the resultant intensity at the detector, werepresent the four nonmonochromatic optical signalsby complex signals as follows14:
DC, DC: u1�t� � 2 �0
�
s����1���exp��j2 �t�d�,
�1, �1: u2�t� � 2 �0
�
s����2���exp��j2 �t�d�,
(12)
DC, �1: u3�t� � 2 �0
�
s����3���exp��j2 �t�d�,
�1, DC: u4�t� � 2 �0
�
s����4���exp��j2 �t�d�.
(13)
For any two complex optical fields uI�t� and uII�t�, theresultant intensity at the detector in an interferomet-ric setup can be written as14
Idet � ��uI�t� � uII�t � ���2�
� ��uI�t��2� � ��uII�t � ���2� � 2 Re�uI*�t�
� uII�t � ����. (14)
The first two terms in Eq. �14� are the autocorrelationterms, whereas the third term is the cross-correlationterm. However, if uI�t� is similar to uII�t�, the cross-correlation term changes to an autocorrelation term,an optimal condition for high-sensitivity heterodynedetection. With this notion in mind, we study theprofiles of �m���, m � 1, . . . , 4, to determine whichpair of the complex optical fields given by Eqs. �12�and �13� should be used for heterodyne detection.Figure 5�a� shows the profiles of �1��� and �2��� for50% diffraction efficiency of the AO cell at the centerwavelength �c. It can be seen that the �1��� and�2��� have inverse spectrums with respect to eachother. The third term in Eq. �14� will therefore re-main a cross-correlation term, which is not an opti-mal condition for heterodyne detection. Figure 5�b�shows the profiles of �3��� and �4��� for 50% diffrac-tion efficiency of the AO cell at the center wavelength�c. As expected, �3��� and �4��� have spectrums sim-ilar to that of each other. The profiles of �m��� �m �1, . . . , 4� were also studied for the TM case under thesame conditions as that for the TE case. For the TMcase, the coupling parameter ��� in the expressionfor diffraction efficiency is modified as follows:
���TM � �nd
� cos �inc, gcos�2�inc, g�. (15)
As �inc,g is small, �m��� m � 1, . . . , 4, �for the TMcase� have similar spectral profiles as that for the TEcase. The study thus concludes that the power spec-trums of �DC, �1� and ��1, DC� beams will be similarand thus should be used for heterodyne detection inour OCT system. This fundamental result that isdue to balanced signal processing by a single Braggcell now allows a Bragg cell to be optimally used forOCT.
To verify the above discussion, we set up an exper-iment in the laboratory using a 1520–1600-nm tun-able laser and two similar AO devices as shown inFig. 6. The AO cells were used to generate �DC, DC�,��1, �1�, �DC, �1�, and ��1, DC� beams and thussimulate a Bragg cell operating in reflective mode.The two AO cells were set to satisfy the Bragg con-dition at 1553.7-nm wavelength for a 90.15-MHz rfdrive signal. First, the �1 beam was blocked some-where in the middle of the two imaging lenses �lettingthe DC beam go through�, and the �DC, DC� and �DC,�1� beams that are not collinear were detected.
1 June 2003 � Vol. 42, No. 16 � APPLIED OPTICS 3021

Next, the DC beam was blocked �letting the �1 beamgo through�, and the ��1, DC� and ��1, �1� beamsthat are not collinear were detected. In this man-ner, the four beams �two of which are collinear withthe other two� were individually detected. Figure7�a� shows plots of both �DC, DC� and ��1, �1� beams
versus the wavelength of the tunable source. Theplot indicates that the two beams have different �in-verse� power spectral profiles. On the other hand,the power spectral profiles of �DC, �1� and ��1, DC�beams are almost the same as expected see Fig. 7�b��.The experimental results therefore show that �DC,�1� and ��1, DC� beams, which have similar powerspectrums, should be used for optimal heterodynedetection in our OCT system. The experimentallyobtained power spectral profiles shown in Fig. 7�b� donot match exactly with the theoretical curves shownin Fig. 5�b�. The most common reason for this mis-match could be a slight Bragg mismatch for one orboth AO devices used in the setup �see Fig. 6�. In thefuture we will carry out more research in this direc-tion to see whether this anomaly is attributable to thetheory that assumes a perfect AO diffraction model orwhether this spectral behavior is typical of the spe-cific AO device used in our experimentation. How-ever, as long as the power spectrums of the �DC, �1�and ��1, DC� are similar, the autocorrelation condi-tion for high-sensitivity heterodyne detection holds.
Fig. 5. Profiles of �a� �m����m � 1, 2� and �b� �p����p � 3, 4� for50% diffraction efficiency of the AO cell �in the TE case� at thecenter wavelength �c.
Fig. 6. Experimental setup to simulate a Bragg cell operating inreflective mode. The �DC, DC� beam is collinear with the ��1, �1�beam whereas the ��1, DC� beam is collinear with the �DC, �1�beam. SMF, single-mode fiber; VGA, variable gain amplifier.
Fig. 7. Plots of the power spectrum for �a� DC, DC and �1, �1beams and �b� DC, �1 and �1, DC beams.
3022 APPLIED OPTICS � Vol. 42, No. 16 � 1 June 2003

Hence, our proposed AO-based OCT system will workoptimally even under slight Bragg mismatch condi-tions.
3. Acousto-Optic Deflector-Based Optical CoherenceTomography System
Figure 8 shows our proposed no-moving-parts AOD-based OCT system. The AO device is fed with a rfdrive signal of frequency fn, where the index n � 1,2, . . . , N. Here, N represents the total number ofindependent delays provided by the AO delay line.N is then equivalent to the number of image slicesthat the OCT system can acquire along the opticalaxis. The AO Bragg cell simultaneously does the jobof both delay-path selection and output beam realign-ment. The light from the low-coherence light sourceis Bragg matched to the AO cell for center wavelength�c, with the spherical lens S1 used for beam align-ment. When AOD driven, the incident broadbandlight splits into a DC beam that strikes the test sam-ple and a deflected �1-order, positive Doppler-shifteddiffracted beam. Depending on the frequency fn,this deflected beam enters one of the delays in theN-element delay array. Hence, the deflected lightbeam travels through an electrically chosen opticalpath of length Ln and acquires a time delay of �n ��2Lnnf ��c, where nf is the refractive index for thedelay medium and c is the speed of light in free space.Note that �n should be more than the coherence timeof the laser source.
Optical media such as a stepped mirror can befabricated with current microfabrication methods toact as the distributed delay-path array in our OCTsystem �see Fig. 8�. Microelectromechanical sys-tems technology is another attractive approach tofabricate the distributed delay-path array. Withcurrent microelectromechanical systems technology,several micromirrors can be used to make one mac-romirror to reflect the selected portion of the Gauss-ian optical beam. This will avoid reflection from theneighboring macropixels of the stepped mirror to ob-tain a clean heterodyne signal at the output. Theoutput signal therefore will correspond only to theselected slice of the test sample, defined by the path-length difference of the interfering optical beams andthe coherence length of the broadband source.
After retroreflection, the signal and the referencebeams pass through the AOD for a second Bragg dif-fraction. The second Bragg diffraction with the lightpropagation in a reversed direction generates the re-aligned DC, �1 and �1, DC output beams for theinterference and heterodyne signal generation at 2fn.Spherical lenses S2 and S3 create an imaging system�magnification of �F3�F2� that allows us to obtain sta-tionary interfering beams on the photodetector.
4. Experimental Results
Figure 9 shows the laboratory setup to test the basicoperational principles of our AO-based OCT system.The test sample and the stepped mirror were simu-
Fig. 8. Our proposed high-speed AO-based OCT system. Si, spherical lenses; �, optical frequency; Fi, focal length of the ith lens; OMC,optical microelectromechanical system chip; SMF, single-mode fiber; VGA, variable gain amplifier. Note that the ��1, DC� and �DC, �1�beams are collinear. The angular separation indicated is due to the fact that different wavelengths within the broadband source beamare deflected at different angles for these two beams.
1 June 2003 � Vol. 42, No. 16 � APPLIED OPTICS 3023

lated by two flat mirrors M1 and M2, respectively,mounted on translation stages. A SLD having a1553.7-nm center wavelength and a 51.4-nm FWHMspectral width was used with a flint glass Bragg cell�from IntraAction Corp.� having a 45-MHz FWHM rfbandwidth and a 100-MHz center frequency. TheAO Bragg cell was driven with a 7.25-V �peak value�rf signal at fn � 90 MHz for 50% diffraction efficiencyat the center wavelength. Spherical lens S1 of100-mm focal length was used to align the signal �DC�and reference ��1-order� beams �see Fig. 9�.
The reflected signal and reference beams propagat-ing in the reversed direction undergo a second Braggdiffraction to generate collinear �DC, �1� and ��1,DC� output beams for the interference and hetero-dyne signal generation at 2fn. A 50-mm focal-lengthspherical lens at 25 cm from the AO cell was used tofocus the interfering beams on a 800-MHz bandwidthhigh-speed optical receiver from New Focus, Inc.Figure 10 shows the 180-MHz heterodyne-detectedsignal expected at the output for a 90-MHz Bragg cell
drive, when both mirrors M1 and M2 are at the sameposition. We simulated the stepped mirror assem-bly �shown in Fig. 8� by moving mirror M2 with re-spect to mirror M1. Figure 11�a� shows theoscilloscope trace of the output heterodyne signalwhen both mirrors M1 and M2 are at the same posi-tion. Figures 11�b� and 11�c� show the oscilloscopetraces of the output heterodyne signal when the ref-erence mirror M2 is moved by 12 and 17 �m, respec-tively, with respect to mirror M1. The amplitude ofthe heterodyne-detected signal reduces as expectedwhen reference mirror M2 is moved away from mirrorM1 in either direction. The output heterodyne sig-nal diminishes almost completely when the path dif-ference between the two interfering beams becomesequal to the coherence length of the optical source.Note that in our case the unbalanced spectral spoil-ing in the �DC, DC� and ��1, �1� beams as depictedin Figs. 5�a� and 7�a�� reduces the signal-to-noise ra-tio so much that the heterodyne signal �with twice thefrequency of the rf signal fed into the AO cell� couldnot be generated by the PD.
As mentioned above, we generated differentscanned beams for our OCT system by varying theBragg cell drive frequency. The rf drive frequencycan be changed in discrete steps such that thescanned beams hit specific steps or portions of thestepped mirror. Figure 12 shows an experimentalplot for the scan distance xn measured against fre-quency fn for our laboratory OCT system. A scandistance of 2.7174 mm was measured correspondingto a 40-MHz rf bandwidth around a 100-MHz centerfrequency. Because an AO cell causes a spread inthe scanning reference beam due to the broadbandnature of the light used, a beam spot size of 0.246 mmwas measured in the back focal plane of lens S1.This indicates N � 11 distinct delay lines possiblewith our current AOD-based OCT system, which cor-
Fig. 9. Experimental setup to test the basic operational principlesof our AO-based OCT system. Si, spherical lenses; �, optical fre-quency; SMF, single-mode fiber; VGA, variable gain amplifier.Note that the ��1, DC� and �DC, �1� beams are collinear �fordetails, see the caption of Fig. 4�.
Fig. 10. Oscilloscope traces showing �a� the 90-MHz reference signal from the rf signal generator and �b� the 180-MHz heterodyne signalfrom our laboratory OCT system setup when both mirrors M1 and M2 are at the same position.
3024 APPLIED OPTICS � Vol. 42, No. 16 � 1 June 2003

responds to the imaging of 11 distinct layers of sam-ple tissue with an axial resolution15 of �z � 2 ln�2�� ���c
2���� � 20.72 �m.With our present OCT system, a beam switching
speed �1 �s is possible. The AO-based OCT systemallows us to generate optical delay paths at submi-crosecond speeds and fulfills an important require-ment for a high-speed heterodyne detection of theinterfering optical beams. The switching speed ofour OCT system depends on the access time of theAOD used, which is defined as the time taken by thesound waves to cross the Gaussian optical beam spot.Our laboratory OCT setup uses a 5100 seriesgradient-index �GRIN� lens �manufactured by Light-Path Technologies� to produce a collimated beam ofbroadband light. The GRIN lens has a working dis-tance of 25 cm in which the 1�e2 beam size is �x �0.98 mm. The response time �t of the OCT systemtherefore can be determined as �x��s � 0.389 �s.
5. Conclusion
AO Bragg cells can be highly effective in the forma-tion of high-speed scanning OCT systems if the sys-tem is designed to counter the unbalanced spectralspoiling in Bragg diffraction. A Bragg cell operating
in reflective mode generates four beams for signalprocessing, namely, the �DC, DC� beam collinear witha ��1, �1� beam and the �DC, �1� beam collinearwith a ��1, DC� beam. The theoretical analysis thatwe performed shows that the �DC, DC� and ��1, �1�beams have inverse spectral profiles. On the otherhand, the �DC, �1� and ��1, DC� beams have similarpower spectral profiles and thus provide the optimalcondition, i.e., the autocorrelation condition for high-sensitivity heterodyne detection in an AO Bragg-cell-based OCT system. We have experimentally built aproof-of-concept Bragg-cell-based OCT system thatvalidates the novel concept of matched spectral beamspoiling to deliver a high signal-to-noise ratio sensoroutput. Our future research relates to increasingthe inside tissue scan depth and extensions of ourbasic AO-based OCT system using fiber optics.
References1. R. C. Youngquist, S. Carr, and D. E. N. Davies, “Optical
coherence-domain reflectometry: a new optical evaluationtechnique,” Opt. Lett. 12, 158–160 �1987�.
2. D. Huang, E. A. Swanson, C. P. Lin, J. S. Schuman, W. G.Stinson, W. Chang, M. R. Hee, T. Flotte, K. Gregory, C. A.Puliafito, and J. G. Fujimoto, “Optical coherence tomography,”Science 254, 1178–1181 �1991�.
3. W. Drexler, U. Morgner, F. X. Kartner, C. Pitris, S. A. Boppart,X. D. Li, E. P. Ippen, and J. G. Fujimoto, “In vivo ultrahigh-resolution optical coherence tomography,” Opt. Lett. 24, 1221–1223 �1999�.
4. A. M. Rollins and J. A. Izatt, “Optimal interferometer designs foroptical coherence tomography,” Opt. Lett. 24, 1484–1486 �1999�.
5. N. A. Riza, “Scanning heterodyne optical interferometers,”Rev. Sci. Instrum. 67, 2466–2476 �1996�.
6. N. A. Riza, “Acousto-optically switched optical delay lines,”Opt. Commun. 145, 15–20 �1998�.
7. N. A. Riza and Z. Yaqoob, “High-speed no-moving-parts opticalcoherence tomography system,” in Photon Migration, DiffuseSpectroscopy, and Optical Coherence Tomography: Imagingand Functional Assessment, S. Andersson and J. G. Fujimoto,eds., Proc. SPIE 4160, 37–42 �2000�.
8. N. A. Riza and Z. Yaqoob, “Submicrosecond speed optical coher-ence tomography system design and analysis using acousto-optics,” in Coherence Domain Optical Methods in BiomedicalScience and Clinical Applications VI, V. V. Tuchin, J. A. Izatt,and J. G. Fujimoto, eds., SPIE Proc. 4619, 26–35 �2002�.
Fig. 11. Oscilloscope traces of the output heterodyne signal when �a� both mirrors M1 and M2 are at the same position, �b� M2 is movedby 12 �m with respect to M1, �c� M2 is moved by 17 �m with respect to M1.
Fig. 12. Experimental and theoretical plots for the scan distancexn against frequency fn for our laboratory OCT system.
1 June 2003 � Vol. 42, No. 16 � APPLIED OPTICS 3025

9. Product SLD-761-MP3-DIL-SM �Superlum Diodes Ltd., P.O.Box 70, B-454, Moscow 117454, Russia, November 2001�.
10. A. Yariv and P. Yeh, Optical Waves in Crystals: Propagationand Control of Laser Radiation �Wiley, New York, 1984�.
11. H. Kogelnik, “Coupled wave theory of thick hologram grat-ings,” Bell Syst. Tech. J. 48, 2909–2945 �1969�.
12. Product TSL-210-155 �Santec Photonics Laboratories,Komaki, Japan, 1998�, http:��www.santec.com.
13. Product ACM-1002 AA1–2 �IntraAction Corp., 3719 WarrenAve., Bellwood, Ill. 60104, 1999�, http:��www.intraaction.com.
14. J. W. Goodman, Statistical Optics �Wiley, New York, 1985�.15. I. Hartl, X. D. Li, C. Chudoba, R. K. Ghanta, T. H. Ko, J. G.
Fujimoto, J. K. Ranka, and R. S. Windler, “Ultrahigh-resolution optical coherence tomography using continuum gen-eration in an air–silica microstructure optical fiber,” Opt. Lett.26, 608–610 �2001�.
3026 APPLIED OPTICS � Vol. 42, No. 16 � 1 June 2003