submerged batch fermentation of critic … files/publications/nast transactions/nast... ·...
TRANSCRIPT
SUBMERGED BATCH FERMENTATION OF CRITIC ACID PRODUCTION USING Aspergillus "iger: OPTIMIZA TJON
AND KINETIC MODELLING
CHA Y B. PHAM, RAQUEL B. MARQUEZ and
JOCELYN T. DE GUZMAN National Institute of Molecular Biology and Biotechnology (BIOTECH)
University of the Philippines Los Banos, College, 4031 Laguna
ABSTRACT
The demand of citric acid requirement in the cOllntry is met by importa· tioll. It is used in food. pharmaceutical, feed and medical indu.~tries. This stlldy was carried out to optimize the effect of initial ammonium (1.0. 2.0 alld 3.0 gil) and glucose (50, 100 and 150 gil) concellIratioll.~ alld pH (3.0. 4.0 alld 5.0) using the multiple regression equation, and to model the killelics of submerged batch fermentation of citric acid productioll by A..fpergillu.\· niger.
Initial ammonium concentration eifects on glucose, biomass and citric acid concelllrations are .~hown by ANOVA (P > F = 0.0001). The highest citric acid concentration. 84.11 gil was obtained from 1.0 gIl illitial ammollium concentration at 3OVC, 3.5 pH. 0.8 wm aeration and 40() rpm agitatioll rate.
The fermentatioll kinetics related to growth model. product formutiull, substrate uptake were used to determille the killetic parameters (m. qm, k. C, D) using Leudeking-Piret equations. At the optimum fermelllation C'Onditions. the specific growth rate, m for I gil initial ammonium cOllcentration was 0.071 h- I
The non-growth related parameter, qm (0.0095 g.productlg.biomaH.h) was obtained at 1.0 gIl initial ammonium concentration indicaling that product formation is growth related. Substrale consumptioll was al.<o growth related sillce higher value of growth related parameter (' (1.6558 g. suhstratelg.biomass) was obtained compared to the nOll-growth related parameter D (0. 0458 g.substratelg.biomass.h).
Computed parameters were used to predict biomas.~. glucose and citric acid concentration usillg the model. The model satisfactorily represented the
glucose concentration at J gil initial ammollium concentration.
INTRODUCTION
Citric acid is the most widely used organic acid of biological origin in the food, feed, pharmaceutical, medicinal and chemical industries. A greater demand for citric acid production could be the result of a large increase in citric acid
166
Chay B. Pham. el al. 167
consumption among industrialized countries (Sassi et al. 1991). Worldwide sales of citric acid are divided among the principal fields of use. Approximately 75% of citric in the market is used for food and feed, the remaining 10% for pharmaceutical and medicinal purposes and 15% for industrial applications (Milson et al. 1983).
The most important source of citric acid is the fungal fermentation of carbohydrates which is attained either in surface or in submerged process. Submerged process is advantageous because less manpower is required, higher product formation rate is attained, and low level of usable concentration of sugar is needed (Tuompo 1985). Although citric acid can be obtained by chemical synthesis, the cost is much higher than fermentation (Prescott and Dunn 1982). There are many microorganisms, including fungi, yeasts and bacteria that can produce the acid by fermentation. Among them, Aspergillus niger is the most well-known and mediabased on either purified glucose syrups or beet or cane molasses were utilized as substrate (Milson et al. 1983)
Many researchers have been conducted on the fermentation kinetics of the bioprocess specifically in submerged culture. These resulted in larger variations in the conditions recommended for a successful fermentation and a large number of models developed in describing and understanding the process. Variations include the type of microorganism used, incubation, temperature, pH, aeration, medium composition, etc. (Kristiansen and Sinclair 1978). Citric acid fermentation is characterized by a lot of nutrient limitations such as trace metals, phosphate and ammonium known to change the kinetics of the process through growth of the microorganisms. This study was conducted to optimize the fermentation conditions of glucose and ammonium concentrations and pH of medium on the kinetics of citric acid production, and to establish the fermentation model as well as compare with the experimental data.
Fermentation Kinetics
Many researches have dealt with fermentation kinetics and the knowledge of kinetics of such process is essential in understanding of the bioconversion. Different kinetic models which describe growth, product formation and substrate consumption can be used in process control to obtain the maximum yield of fermentation (Roehr et al. 1981).
Biosynthesis
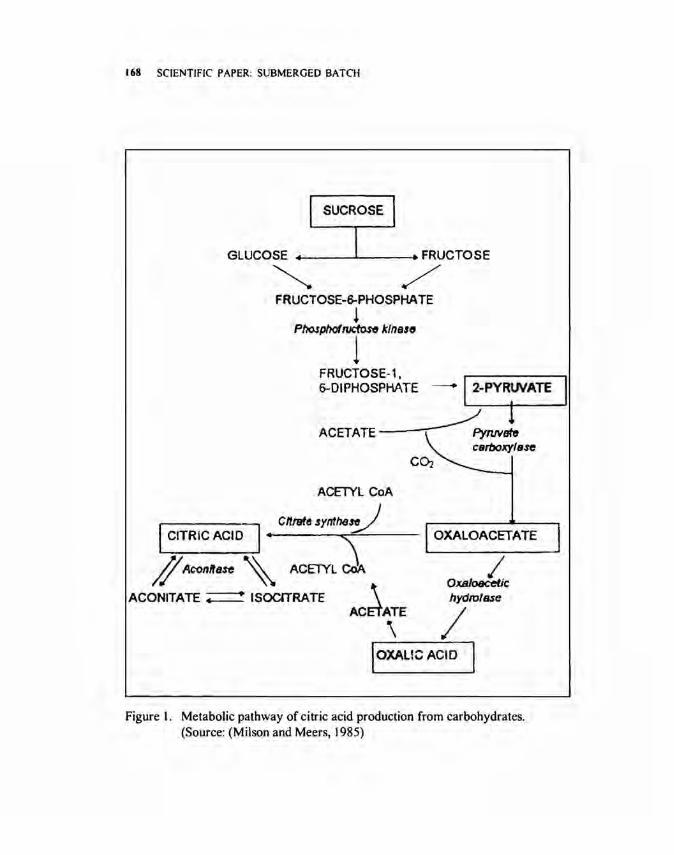
Three main metabolic processes are involved in citric acid accumulation by Aspergillus niger namely: I) breakdown of carbohydrates by the glycolytic pathway to produce pyruvate; 2) anaplerotic formation of oxaloacetate from pyruvate, and 3) accumulation of citric acid within the tricarboxylic acid cycle (Fig. I) (Milson 1983). The net reaction is as follows:
C6H 1206 + 1.5 02 > C6Hg07 + 2 H20
168 SCIENTIFIC PAPER: SUBMERGED BATCH
I SUCROSE I GLUCOSE +----..1.~---FRUCTOSE ~ / FRUCTOSE-6-PHOSPHA TE
! Phosphofllldoso klnestJ
1 FRUCTOSE-1, 6-DIPHOSPHATE --12-PYRlNATE I ~1
ACETATE fYnN~ carboxy/sse
-ACElYL CoA
Cn/'9te synthe~ I CITRICACID , .. ·----~...-=---1 OXALOACETATE
//Aconitase \.\ ACElYL eM / // . '\\. Oxsloacet1c
ACONITATE ~ ISOCITRATE \ hydrolase
ACEl\E I joXAuc Acro I
Figure I. Metabolic pathway of citric acid production from carbohydrates. (Source: (Milson and Meers, 1985)
I
COOy B. Pham. el al. 169
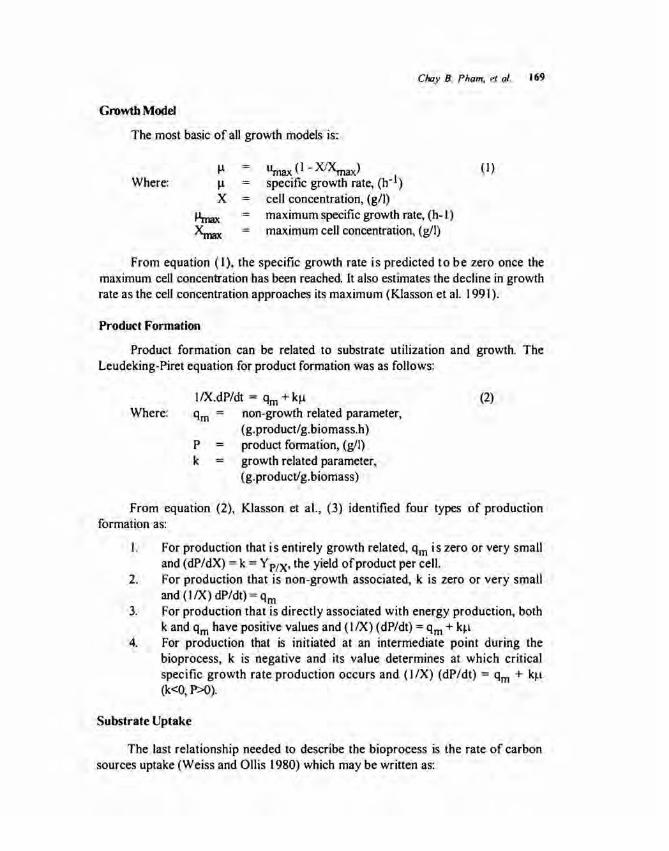
Growth Model
The most basic of all growth models is:
Where: "max (I -~ax) specific growth rate, (h- 1) cell concentration, (gil) maximum specific growth rate, (h-I) maximum cell concentration, (gil)
(I)
From equation (I), the specific growth rate is predicted to be zero once the maximum cell concentration has been reached. It also estimates the decline in growth rate as the cell concentration approaches its maximum (Klasson et al. 1991).
Product Formation
Product formation can be related to substrate utilization and growth. The Leudeking-Piret equation for product formation was as follows:
Where: I/X.dP/dt = qrn + kf.l qrn non-growth related parameter,
(g.product/g.biomass.h) P product formation, (gil) k growth related parameter,
(g.product/g.biomass)
(2)
From equation (2), Klasson et aI., (3) identified four types of production formation as:
1. F or production that is entirely growth related, qrn is zero or very small and (dP/dX) = k = Y PIX' the yield of product per cell.
2. For production that is non-growth associated, k is zero or very small and (I IX) dP/dt) = qrn
3. For production that is directly associated with energy production, both k and qrn have positive values and (I IX) (dP/dt) = qrn + kp
4. For production that is initiated at an intermediate point during the bioprocess, k is negative and its value determines at which critical specific growth rate production occurs and (I/X) (dP/dt) = qrn + k~l (k<O, P>O).
Substrate Uptake
The last relationship needed to describe the bioprocess is the rate of carbon sources uptake (Weiss and Ollis 1980) which may be written as:
170 SCIENTIFIC PAPER: SUBMERGED BATCH
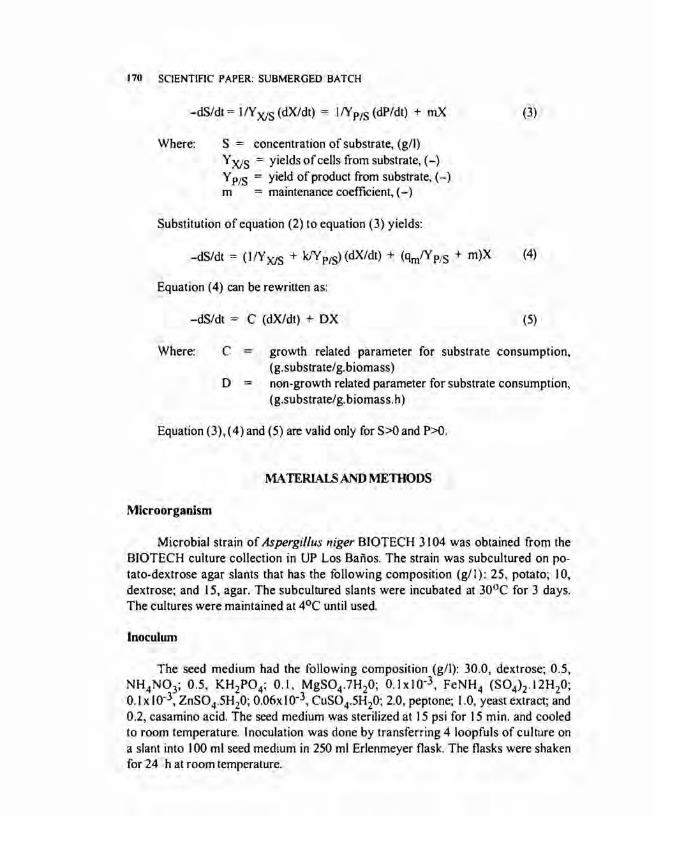
-dS/dt = I/Y XIS (dX/dt) = IlYp/S (dP/dt) + mX
Where: S = concentration of substrate, (gil)
Y XIS = yields of cells from substrate, (-) Y PIS = yield of product from substrate, (-) m = maintenance coefficient, (-)
Substitution of equation (2) to equation (3) yields:
(3)
-dS/dt = (11Y XIS + kN PIS) (dX/dt) + (qrnlY PIS + m)X (4)
Equation (4) can be rewritten as:
-dS/dt = C (dX/dt) + DX (5)
Where: C
D
growth related parameter for substrate consumption, (g.substrate/g.biomass) non-growth related parameter for substrate consumption, (g.substrate/g.biomass.h)
Equation (3), (4) and (5) are valid only for S>O and P>O.
MATERIALS AND METIIODS
Microorganism
Microbial strain of Aspergillus niger BIOTECH 3104 was obtained from the BIOTECH culture collection in UP Los Banos. The strain was subcultured on potato-dextrose agar slants that has the following composition (gil): 25, potato; 10, dextrose; and 15, agar. The subcultured slants were incubated at 30°C for 3 days. The cultures were maintained at 4°C until used.
Inoculum
The seed medium had the following composition (gil): 30.0, dextrose; 0.5, NH4N03; 0.5, KH2P04; 0.1, MgS04.7H20; 0.lxI0-3, FeNH4 (S04h.12H20; 0.1 x 10⁻³, ZnS04.5H20; 0.06xI0-3, CuS04.5H20; 2.0, peptone; 1.0, yeast extract; and 0.2, cas amino acid. The seed medium was sterilized at 15 psi for 15 min. and cooled to room temperature. Inoculation was done by transferring 4 loopfuls of culture on a slant into 100 ml seed medium in 250 ml Erlenmeyer flask. The flasks were shaken for 24 h at room temperature.
Chay B. Pham. et a/. 171
Experimental Design
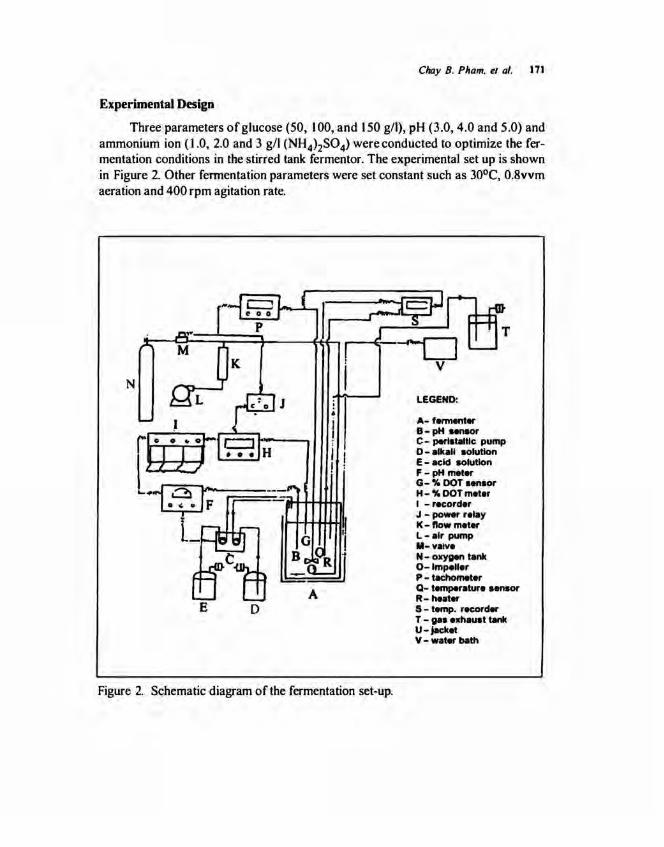
Three parameters of glucose (50, 100, and 150 g/1), pH (3.0, 4.0 and 5.0) and ammonium ion ( 1.0, 2.0 and 3 g/1 (NH4)2SO 4) were conducted to optimize the fermentation conditions in the stirred tank fermentor. The experimental set up is shown in Figure 2. Other fennentation parameters were set constant such as 30°C, 0.8vvm aeration and 400 rpm agitation rate.
N
I
j!llr~ --~1 -~8 r;~;;;;
I
l_
E D A
. •
I 1 ! :
Figure 2. Schematic diagram of the fermentation set-up.
LEGEND:
A- fennenter B-pH sensor C- peristaltic pump D- alkali solution E- acid solution F- pH meter G-% DOT sensor H- % DOT meter I -recorder J - po-r relay K-tlowmeter L-air pump 11-vaive N- oxygen tank 0-lmpeller P- tachometer Q- temperature "nsor R-huter S- temp. recorder T - gas exhaust tank u- jacket V- water bath
172 SCIENTIFIC PAPER: SUBMERGED BATCH
Fermentation Process
The fermentation medium had the composition as follows (gil: 50-150, glucose; 0.5, NH4N03 or 1.0 -3.0, (NH4)2S04; 1.0, KH2P04; 1.0, K2HP04; 0.5, MgS04.7H20; 0.06, MnS04.H20; 0.01, FeS04.7H20; 3.0 peptone; 2.0, yeast extract and 1.0, NaCI. The pH of medium was adjusted to 5 using 2N HCl. The medium was sterilized at 15 psi for 15 minutes and cooled to room temperature. The inoculation rate was 10% (volume ofseedlvolume of fermentation medium).
Analytical Methods
Biomass determination. The cells concentration was determined by dry weight in the oven at 100°C overnight.
Glucose determination. Sugar concentration was analyzed by the colorimetric method of Somogyi (1952).
Citric acid determination. The concentration of citric acid was assayed using the improved pyridine-acetic anhydride method (Marier and Boulet 1958).
Determination of ammonium ion. The concentration of ammonium ion was analyzed using the colorimetric method (AOAC 1985).
Statistical Analysis
Data of the effect of ammonium ion concentration on citric acid production were subjected to statistical analysis. The analysis of variance (ANOY A) was carried out to test the treatment difference. Duncan's Multiple Range Test (DMRT) was used to determine the degree of differences among means.
RESUL TS AND DISCUSSION
Optimization of Fermentation Conditions
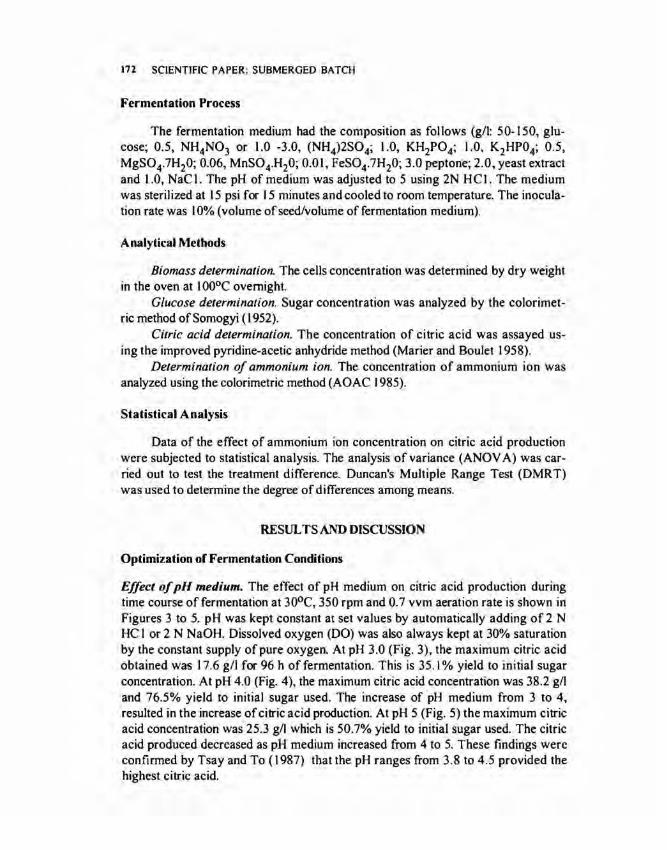
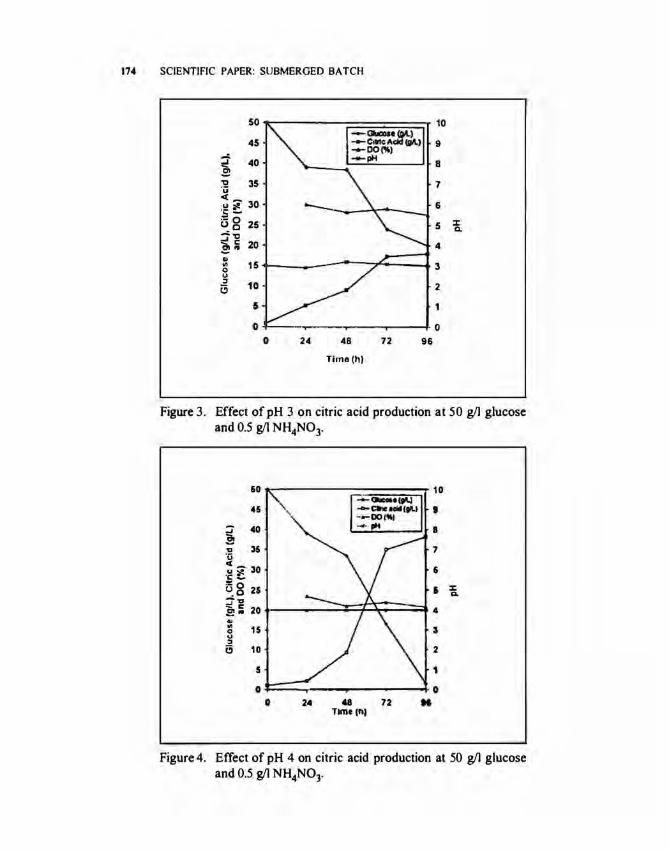
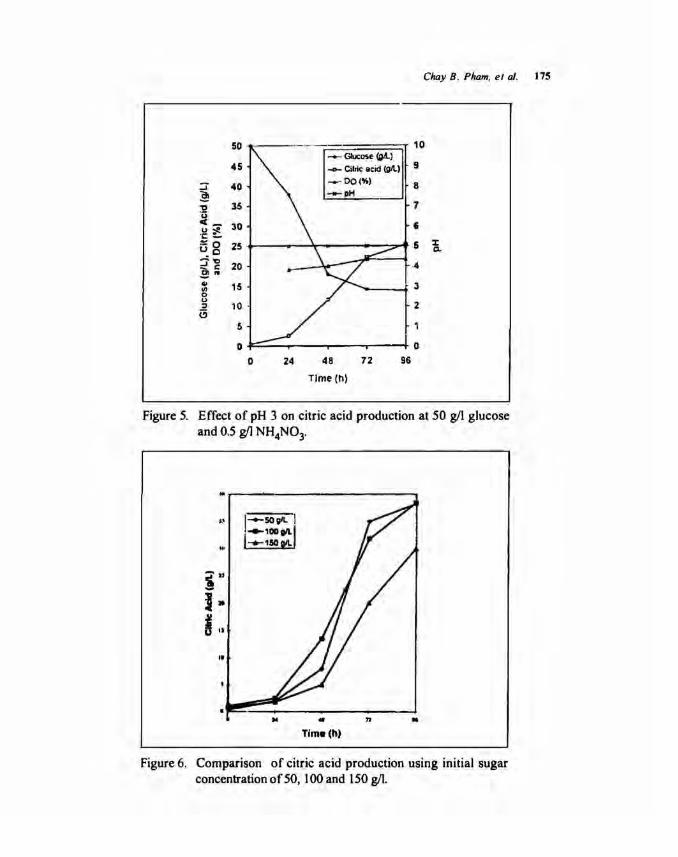
Effect of pH medium. The effect of pH medium on citric acid production during time course of fermentation at 30°C, 350 rpm and 0.7 vvm aeration rate is shown in Figures 3 to 5. pH was kept constant at set values by automatically adding of 2 N HC I or 2 N NaOH. Dissolved oxygen (DO) was also always kept at 30% saturation by the constant supply of pure oxygen. At pH 3.0 (Fig. 3), the maximum citric acid obtained was 17.6 gil for 96 h of fermentation. This is 35.1 % yield to initial sugar concentration. At pH 4.0 (Fig. 4), the maximum citric acid concentration was 38.2 gil and 76.5% yield to initial sugar used. The increase of pH medium from 3 to 4, resulted in the increase of citric acid production. At pH 5 (Fig. 5) the maximum citric acid concentration was 25.3 gil which is 50.7% yield to initial sugar used. The citric acid produced decreased as pH medium increased from 4 to 5. These findings were confirmed by Tsay and To (1987) that the pH ranges from 3.8 to 4.5 provided the highest citric acid.

Chay B. Pham, el al. 173
The negative relationship between glucose consumption and citric acid production was also obtained. The highest sugar which remained was 19.2 gil at pH 3.0 (Fig. 3), while at pH 4.0 (Fig. 4), the glucose which remained was 1.6 gil.
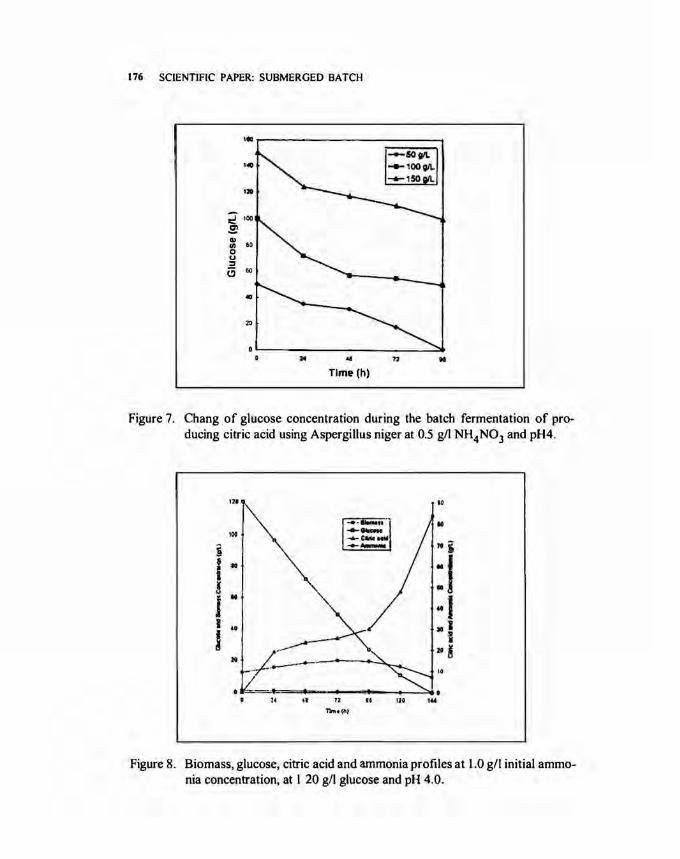
Effect of sugar concentration. Figure 6 shows data obtained from varying of the initial sugar concentrations in the fermentation medium at pH 4.0. The citric acid concentration was 38.2, 38.6 and 31.3 gil with the initial substrate concentration of 50, 100 and 150 gil, respectively, after 96 h of fermentation. It is worthy to note that the fermentation time was short, so that citric acid concentration did not reach the maximum values at stationary phase. These facts are supported by the findings of Choe and Yoo (1991). In their experiments, the fermentation process was carried out for 144 to 168 h in order to obtain the maximum citric acid production. This suggestion is also supported by the remaining glucose concentration after 96 h of fermentation (Fig. 7) which will ably maintain the growth and metabolism of A. niger to produce higher citric acid.
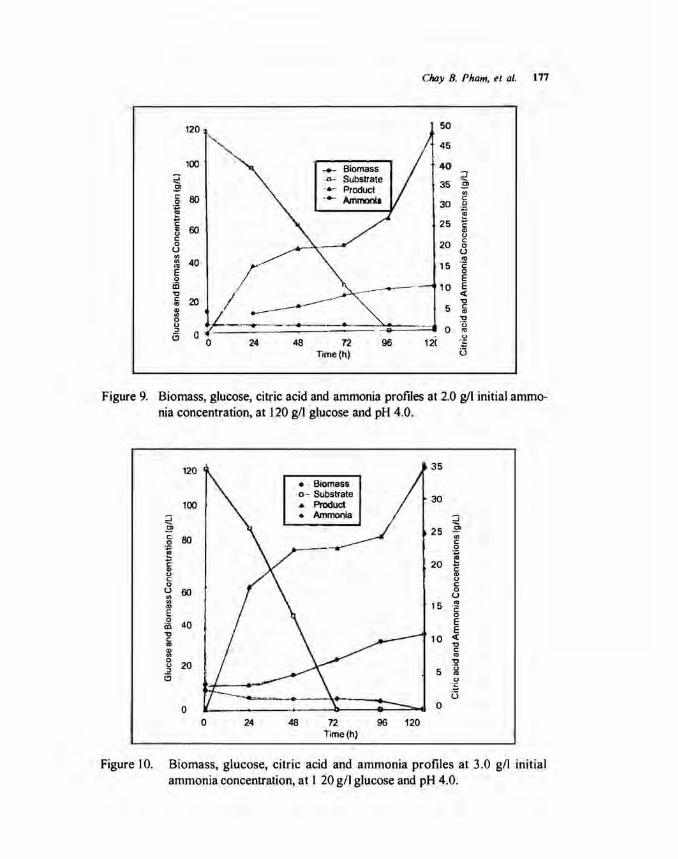
Effect of ammonium concentration. Figures 8 to 10 show the effect of ammonium concentration on citric acid and biomass during time course of fermentation. The drastic increase of citric acid was obtained after 96 h of fermentation, while glucose as substrate was depleted. The increase of ammonium concentration trom I gil to 3 gil in the fermentation medium resulted in decreasing of citric acid concentration from 84.1 gil to 34.6 gil, while biomass concentration was increased from 16.5 gil to 37.0 gil for 120 h offermentation.
The highest yield of 70.1 % (Fig. 8) was achieved in I gil ammonium concentration, followed by 40.6% (Fig. 9) in 2 gil and 29.5% (Fig. 10) in 3 gil initial ammonium concentration. These results agreed with the findings by Kristiansen and Sinclair (1978). They stated that the effect of ammonium nitrate concentration on production of citric acid may be described by considering streaming of cytoplasms. The streaming may lead to rearrangement of the cell material and the transformation into a storage or citric acid producing cell. Accordingly if streaming is too pronounced due to osmotic pressure by high concentration of ammonium, mitochondria will move toward the nonproducing tip of the hyphase and result in reduced citric acid production. The drastic increase of biomass cells was obtained as the ammonium ion was increased. It could probably be the environmental conditions that affected the cells preferably towards the synthesis of new cells rather than production of citlic acid.
The ammonium concentration was constant decreased and depleted after 120 h offermentation (Figs. 8 and 10).
ANOVA was carried out to determine the significance of treatments (Table I). Results showed that the initial ammonium concentration significantly affects biomass, glucose and citric acid concentrations P > F = 0.000 I. DMRT was also used to detennine the degree of difference among means at 5% level of significance. For biomass, glucose, citric acid and ammonium concentrations, significant differences among means were observed in 1.0 gil and 3.0 gil initial ammonium concentrations.
174 SCIENTIFIC PAPER: SUBMERGED BATCH
50 10
45 9
~ 40 8 ~ '0 35 7 ·u <_ .!::! ~ 30 6 ,__ .-::o
25 ::z: Uc 5 c. ....:'0 -'c 20 4 ~ .. ..
15 Ill 3 0 u :I 10 2 i3
6
0 0 24 48 72 96
Timo(h)
Figure 3. Effect of pH 3 on citric acid production at 50 gil glucose and 0.5 g/1 NH4N03.
60 10
45 ' ;:j 40 8 £! ... 35 7 ·u c(-
-~ ::. 30 6 :!::0
25 5 ::z: u_c a. ;r~ .E!• 20 4 .. .. 15 :J 0 u :I c; 10 2
5 1
24 48 72 Tlmelhl
Figure 4. Effect of pH 4 on citric acid production at 50 gil glucose and 0.5 g/1 NH4N03•
50
45
::J 40 ~ l'! 35 u c_
30 ·~ :!. !::O Uc 25 ....::"C ~ c: 20 ~1'1 Ill 15 "' 0 <>
10 . :I (;
5
-·-··-·-··---
24
-- Glucose (QA..l ....,_ Cilric acid (giL)
..... -00(~)
--pM
48
Tlme(h)
72
Chay B. Pham, eta/. 175
10
9
8
7
6
5 :l: a.
4
• 3
2
96
Figure 5. Effect of pH 3 on citric acid production at 50 g/1 glucose and 0.5 gil NH4N03.
" •.
,.
1--SOgiL I :_,ooDILI 1-+-,SOpiL
.. .. Time (h)
Figure 6. Comparison of citric acid production using initial sugar concentration of 50, 100 and 150 gil.
176 SCIENTIFIC PAPER: SUBMERGED BATCH
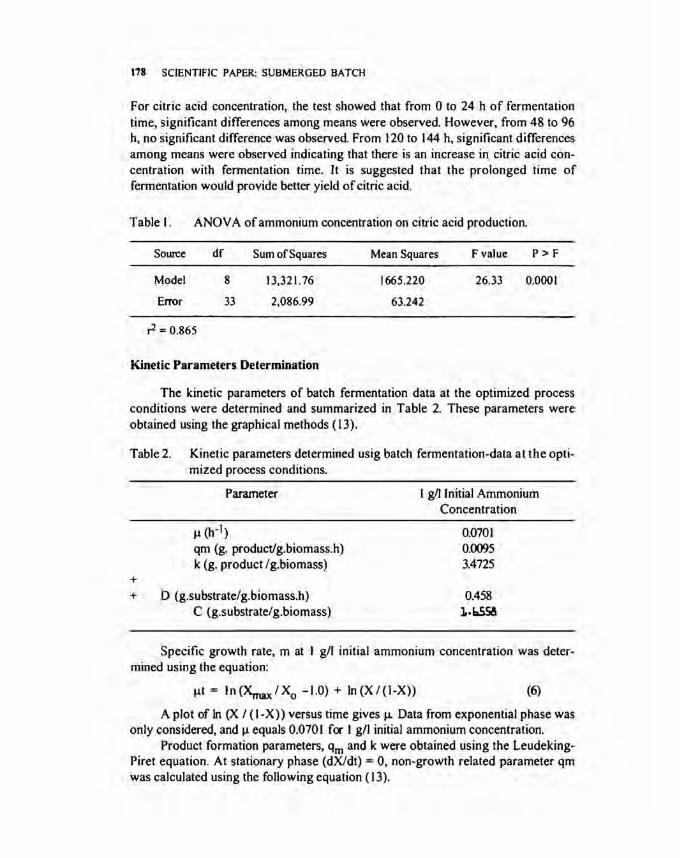
.. .. Time (h)
Figure 7. Chang of glucose concentration during the batch fermentation of producing citric acid using Aspergillus niger at 0.5 g/1 NH4N03 and pH4.
Uf .. 10
100
i "' 5 10 :I i ! j 10
.. J
~ I •• .1 I ·J
:If~ :If ---- 10
24 .. 12 .. 120
Tlm•t"}
Figure 8. Biomass, glucose, citric acid and ammonia profiles at 1.0 g/1 initial ammonia concentration, at I 20 g/1 glucose and pH 4.0.
., ., •• E 0 iii "C
120 .
100
80
60
40
~ 20 3l 0 0
" i3
... '"
--n-- 6---
24 48 72 Time(h)
Chay B. Pham, el a/. 177
~50 45
40 ::J
35 :§ ., c
30 .9 ~
25 E ., 0
20 c 0 u .,
15 ·c: 0 E
10 E <( "C
5 c "' "C
0 ·c:;
"' 96 12( ·S
u
Figure 9. Biomass, glucose, citric acid and ammonia profiles at 2.0 g/1 initial ammonia concentration, at 120 g/1 glucose and pH 4.0.
120 35
• · Biomass -o- Substrate
30 100 • Product
::J • Ammonia ::J :§ 25 :§ c 80 Ul 0 c . ., ---- 0 t'!
. ., E 20 ~ ., E 0 "' c 0 0 c u 60 0 ., u ..
15 "' .. ·c: E 0 0
40 E iii E "C
10 <( c
"' "C
"' c ., ., 0
20 "C 0 ·c:; " 5 i3
.. ·E u
0 0
0 24 48 72 96 120 Time(h)
---
Figure 10. Biomass, glucose, citric acid and ammonia profiles at 3.0 g/1 initial ammonia concentration, at I 20 g/1 glucose and pH 4.0.
178 SCIENTIFIC PAPER: SUBMERGED BATCH
For citric acid concentration, the test showed that from 0 to 24 h of fermentation time, significant differences among means were observed. However, from 48 to 96 h, no significant difference was observed. From 120 to 144 h, significant differences among means were observed indicating that there is an increase in citric acid concentration with fermentation time. It is suggested that the prolonged time of fermentation would provide better yield of citric acid.
Table I. ANOV A of ammonium concentration on citric acid production.
Source
Model
Error
,.2 = 0.865
df
8
33
Sum of Squares
13,321.76
2,086.99
Kinetic Parameters Determination
Mean Squares
1665.220
63.242
F value P > F
26.33 0.0001
The kinetic parameters of batch fermentation data at the optimized process conditions were determined and summarized in Table 2. These parameters were obtained using the graphical methods (13).
Table 2. Kinetic parameters determined usig batch fermentation-data at the optimized process conditions.
+ +
Parameter
f.1 (h-1)
qm (g. product/g.biomass.h) k (g. product lg.biomass)
D (g.substratelg.biomass.h) C (g.substratelg.biomass)
1 gil Initial Ammonium Concentration
0.0701 0.0095 3.4725
0.458 1-1:.5.56
Specific growth rate, m at I gil initial ammonium concentration was determined using the equation:
Jlt = In ("max I X0
-1.0) + In (X I (I-X)) (6)
A plot of In (X I (I-X)) versus time gives fl. Data from exponential phase was only considered, and f.1 equals 0.0701 for I g/1 initial ammonium concentration.
Product formation parameters, qm and k were obtained using the LeudekingPiret equation. At stationary phase (dX/dt) = 0, non-growth related parameter qm was calculated using the following equation ( 13).
ehay B. Pham. et al. 179
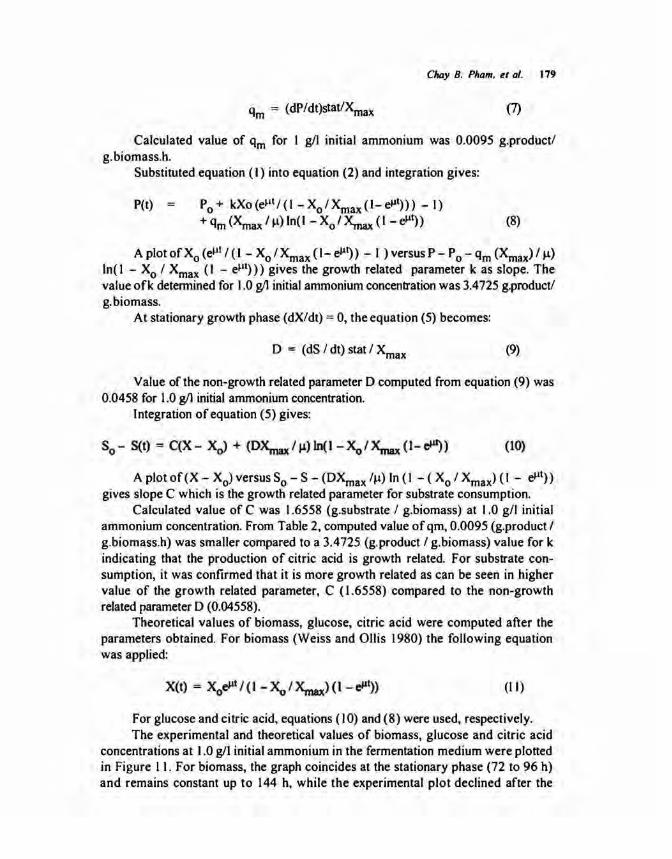
qm = (dP/dt)stat/Xmax (7)
Calculated value of qm for I gil initial ammonium was 0.0095 g.productl g. biomass.h.
Substituted equation (I) into equation (2) and integration gives:
P(t) = Po + kXo (e~lt I (I - Xo I Xmax (1- eJ.lt») - I) + qm (Xmax I I!) In(1 - Xol ~ (I - eJ.lt» (8)
A plot of Xo (ell! I (I - Xo I Xmax (1- eJ.lt» - I ) versus P - Po - qm (Xmax) I I!) In( I - Xo I Xmax (I - e~It») gives the growth related parameter k as slope. The value ofk determined for 1.0 gil initial ammonium concentration was 3.4725 g.productl g.biomass.
At stationary growth phase (dX/dt) = 0, the equation (5) becomes:
D = (dS / dt) stat I Xmax (9)
Value of the non-growth related parameter D computed from equation (9) was 0.0458 for 1.0 gil initial ammonium concentration.
Integration of equation (5) gives:
A plot of (X - Xo) versus So - S - (DXmax II!) In (I - ( Xo I Xmax) (I - e~lt» gives slope C which is the growth related parameter for substrate consumption.
Calculated value of C was 1.6558 (g.substrate / g.biomass) at 1.0 gil initial ammonium concentration. From Table 2. computed value of qm. 0.0095 (g. product I g.biomass.h) was smaller compared to a 3.4725 (g. product I g.biomass) value for k indicating that the production of citric acid is growth related. For substrate consumption, it was confirmed that it is more growth related as can be seen in higher value of the growth related parameter. C (1.6558) compared to the non-growth related parameter D (0.04558).
Theoretical values of biomass, glucose, citric acid were computed after the parameters obtained. For biomass (Weiss and Ollis 1980) the following equation was applied:
(II)
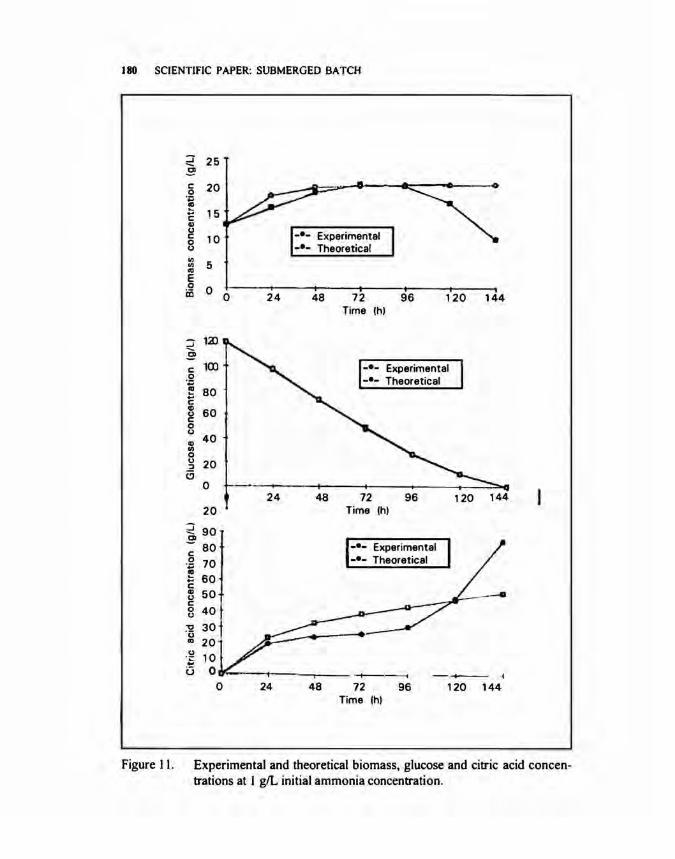
For glucose and citric acid, equations (10) and (8) were used. respectively. The experimental and theoretical values of biomass, glucose and citric acid
concentrations at 1.0 gil initial ammonium in the fermentation medium were plotted in Figure II. For biomass, the graph coincides at the stationary phase (72 to 96 h) and remains constant up to 144 h. while the experimental plot declined after the
180 SCIENTIFIC PAPER: SUBMERGED BATCH
Figure II.
~ 25 ~ c 20
~ 0 ·;::; ~
1 5 E Gl u -·- Experimental c 10 0 u -·- Theoretical Cl)
5 Cl)
"' E 0 0 iii 0 24 48 72 96 120 144
Time (h)
~ 1.:iD ~ c 100 -·- Experimental 0 -·- Theoretical ·;::; ~ 80 .... c ~ 60 u c 0 u ~
40 Cl)
0 u 20 :I a
0 24 48 72 96 120 144
20 Time (h)
~ 90 C)
- 80 -•- Experimental c 0 70 -•- Theoretical ·;::; ~ 60 .... c CD 50 u c 0 40 · u "C 30 'ij
"' 20 u 10 ·;::: .. u 0 ---,--- ·--T-----; --+---- . j
0 24 48 72 96 120 144 Time (h)
Experimental and theoretical biomass, glucose and citric acid concentrations at I giL initial ammonia concentration.
CIuJy B. Pham. el al. 181
stationary phase. This could be due to tendency growth up of mycelia pellets when the fermentation was prolonged. This resulted the error in getting of the samples for biomass determination. For substrate consumption, the experimental data fitted very well the theoretical plot. It shows that the parameters, C and D satisfactorily represented substrate consumption at 1.0 gil initial ammonium concentration. There was the deviation for citric acid plot from 24 to 120 h. It could be possible that the secreted citric acid was entrapped in mycelia pellets and subsequently attributed to low citric acid concentration in the fermentation broth. However, after 120 h of fermentation, large deviation of experimental values for citric acid was obtained. This increase could be attributed to another factor such as streaming of cytoplasms (Kristiansen Sinclair 1978) which would be further studied in the next experiment.
CONCLUSION
Bioconversion of glucose into citric acid by Aspergillus niger in a batch fermentation process was greatly affected by pH medium, substrate and ammonium concentration. The optimal growth and production of citric acid was at a pH range of 4.0 to 4.5. At high substrate concentration (150 gil glucose), A. niger strain exhibited slight inhibition at beginning of fermentation. This inhibition was overcome after 24 h and provided high concentration of citric acid in fermentation broth if the fermentation time was prolonged up to 7 or 8 days. The ammonium concentration was also responsible in the growth and production of citric acid. At the optimized ammonium sulfate concentration (I gil), the highest yield (70.1 % is obtained.
Kinetic parameters (m, qm' k, C and D) of fermentation were determined. The values of C and D indicated that the production of citric acid is growth related. The model was also established to use in the process control for large scale production.
REFERENCES
AOAC 1985. Official Methods of Analysis, 14th ed. Association of Official Analytical Chemist, Washington, DC.
Choe, J. and Young J.E. Yoo. 1981. Effect of ammonium ION concentration and appli· cation to fed-batch culture for overproduction of citric acid. J. Ferment. Bloeng. 72: 106-109.
Klasson, K.T., M. Ackerson, E. Clansen and J. Gaddy. 1991. Modelling lysine and citric acid production in terms of initial limiting nutrient concentrations. J. Biolechnol. 21: 271-282.
Kristiansen B. and C.G. Sinclair. 1978. Production of citric acid in batch culture. Biotechnol. and Bioeng. 20: 1711-1722.
Marler, J.R. and M. Boulet. 1958. Direct determination of citric acid in milk with an improved pyridine-acetic anhydride method. J. Dairy Sci. 41: 1683-1692.
Milson, P.E. and J.L. Meers. 1983. Organic acids. In "Advances Comprl:'hensive Biotechnology", Vol. 3 1st ed., Muray Moo-Young, Oxford, Pergamon Press. Canada.