subjective well-being in china: how much does commuting matter… · commuting time was also found...
TRANSCRIPT

Subjective well-being in China: how much doescommuting matter?
Zhenjun Zhu1 • Zhigang Li2 • Hongsheng Chen3 • Ye Liu3 •
Jun Zeng1
Published online: 28 December 2017� The Author(s) 2017. This article is an open access publication
Abstract With rapidly increasing urbanization and motorization in China, the effect of
commuting on residents’ subjective well-being (SWB) is likely growing. We used 13,261
individual, 124 city, and 401 neighbourhood samples from the 2014 China Labour-Force
Dynamics Survey (CLDS 2014) and applied multilevel mixed-effects ordered probit
regressions to investigate the relationship between commuting and SWB. We found huge
differences between urban and rural areas in relation to commuting. Urban respondents’
daily average commuting time was 0.56 h while rural respondents’ daily average com-
muting time was 0.41 h. Further, the daily average commute time for residents living in
cities with high urbanization rates ([ 70%) was longer than for those living in cities with
low urbanization rates (\ 70%). The subjective well-being of residents who commute by
walking or cycling was significantly lower than that of those who commute by other
transportation modes. The regression results indicated that the longer the commute time,
the lower the subjective well-being. Among residents who live in rural areas or cities with
low urbanization, subjective well-being was more easily affected by commuting time.
& Hongsheng [email protected]
Zhenjun [email protected]
Zhigang [email protected]
1 School of Transportation, Southeast University, Si Pai Lou No. 2, Nanjing 210096, China
2 School of Urban Design, Wuhan University, Ba Yi Road No. 299, Wuhan 430072, China
3 School of Geography and Planning, Sun Yat-Sen University, Xingang Xi Road,Guangzhou 510275, China
123
Transportation (2019) 46:1505–1524https://doi.org/10.1007/s11116-017-9848-1

Commuting time was also found to influence residents’ job satisfaction and family life
satisfaction, which in turn influence SWB. China’s current development mode ignores the
traffic needs of vulnerable groups. Therefore, future traffic construction should increase its
prioritization of these vulnerable transportation groups.
Keywords Commuting time � Commuting mode � Subjective well-being � Urbanization �Migrants � China
Introduction
Commuting is an important aspect of urban lives. An increasing amount of research has
focused on the relationship between commuting and urban residents’ subjective well-being
(SWB) (Kroesen 2014; Dickerson et al. 2014), or how people experience their quality of
life, including life satisfaction and emotional responses (Diener 1984; Liu et al. 2017).
Every weekday, hundreds of millions of employed Chinese travel to work, especially in
China’s big cities (Zhao et al. 2011a, b; Sun et al. 2016). In recent years, with rapidly
increasing urbanization and motorization in China, traffic congestion has worsened. With
population growth in the cities and the expansion of the urban spatial structure, workplaces
and residences are becoming increasingly distant, and commuting times are increasing
accordingly (Yang and Gakenheimer 2007; Lin et al. 2015; Sun et al. 2016). It has been
calculated that costs related to traffic congestion in Beijing reduce the municipal gross
domestic product by 4–7% (Creutzig and He 2009). Increased commute times not only
increase costs for commuters but also affect their SWB (Ettema et al. 2011; Ferenchak and
Katirai 2015). For example, Ye and Titheridge (2015), using specially designed web-based
and paper-based surveys, gathered data from Xi’an showing that commuting characteristics
(e.g. commuting mode choice), significantly influence commuting satisfaction, which in
turn significantly affects SWB. In addition, although leisure travel has a significant effect
on residents’ SWB (Mccabe and Johnson 2013; Mccabe et al. 2010), leisure activities
mainly occur during the holidays, and compared with leisure activities, most city residents
need to commute every day. Thus, workday commutes have a constant impact on resi-
dents’ SWB. Investigating the relationship between commuting and SWB in China will
help to deepen our understanding of the impact of commuting on the lives of Chinese
residents.
Although many studies have found a significant correlation between commuting and
SWB (Abou-Zeid et al. 2012; Olsson et al. 2013; Ferenchak and Katirai 2015), there are
still some research gaps. First, most previous studies on this relationship have been con-
ducted in developed countries. As we know, there is a big difference in urban environments
between developed and developing countries; in particular, many developing countries are
still in a stage of rapid urbanization with the concurrent rapid development of urban traffic.
Especially in China, the traffic problem is becoming increasingly serious (Wang et al.
2014; Linn et al. 2016). Most urban residents or workers are facing traffic problems and
being forced to adapt to ever-increasing congestion. Second, the conclusion reached by
previous studies that a significant correlation exists between commuting and SWB has
been mostly based on surveys of single cities (Abou-Zeid and Ben-Akiva 2011; Ettema
et al. 2010). Few studies have compared the relationship between commuting and SWB in
different types of cities (e.g. by urbanization rate). In China, different cities with different
urbanization rates have different transport facilities and spatial structures (Chen et al.
2008). There are also large differences in residents’ commute times (Wang and Chai 2009;
1506 Transportation (2019) 46:1505–1524
123
Zhao et al. 2011a, b). For instance, Yang and Gakenheimer (2007) noted that China’s
current urban development mode tends to lengthen trips and lead to increased congestion in
the context of growth and motorization. Zhao et al. (2010) found that sprawling expansion
with a low degree of self-contained development and low-density land use tends to
increase the need for long-distance commuting from the city outskirts to the central urban
area of Beijing. In general, residents’ daily commute times and distances are longer in
cities with higher urbanization rates than those with lower urbanization rates. As a result,
residents’ acceptance of commute times and distances differs in cities with different
urbanization rates. Moreover, the happiness of residents in cities with different urbaniza-
tion rates has also been shown to differ significantly. For example, Gunatilaka (2011)
found that happiness has not increased along with China’s recent rapid urbanization and
economic growth, and residents living in rural areas report higher SWB than their richer
urban counterparts. Further, the SWB of people living in big cities with high urbanization
rates may be lower than that of people living in small cities with low urbanization rates.
Therefore, to better analyse the impact of commuting on urban residents’ SWB, this study
divided the sampled cities into three urbanization rates—50, 50–70, and 70%—which
represent low, medium, and high urbanization rates, respectively. Third, it is well known
that there are significant differences in the commuter patterns of different groups (e.g.
those with different incomes and those living in different neighbourhoods). However, there
no previous study has compared the relationship between commuting and SWB between
such groups (e.g. between locals and migrants).
To fill these knowledge gaps, this study used Chinese national survey data to investigate
the relationship between commuting and residents’ SWB in cities with different urban-
ization rates and among groups with different hukou (locals with local hukou and migrants
without local hukou). Hukou is one of the main factors affecting China’s social inequalities
(Chan and Zhang 1999). Zhao and Howden-Chapman (2010) found that the hukou system
can reduce migrant families’ chances of finding employment and increase their time spent
commuting. Residents with different hukou will have different job–housing relationships
(Na et al. 2017; Li and Liu 2016). The rest of this paper is organized as follows. ‘‘Rela-
tionship between commuting and subjective well-being’’ section provides a brief overview
of the literature on the relationship between commuting and SWB (worldwide). In
‘‘Methods’’ section, we introduce the data and statistical models used in this study; then,
‘‘Results’’ section presents the results. ‘‘Discussion and Conclusion’’ sections discuss these
results and give a conclusion, respectively.
Relationship between commuting and subjective well-being
Subjective well-being (SWB) refers to how people experience the quality of their own life
and includes life satisfaction and emotional reactions (Diener 1984; Veenhoven 2015; Liu
et al. 2017). Increasingly, studies have regarded SWB as a valid proxy for personal
objective welfare (Frey and Stutzer 2002a, b; Layard 2010; Kahneman and Krueger 2006;
Tella and MacCulloch 2006; Clark et al. 2008a, b; Stutzer and Frey 2010; MacKerron
2012; Crespo and Mesurado 2015). Many studies have investigated the impact of
socioeconomic and built-environment factors on SWB. Regarding personal-level factors, it
has been shown that low income, limited education, poor health, separation, unemploy-
ment, and lack of social contact are strongly negatively associated with SWB (Dolan et al.
2008; Kahneman and Deaton 2010). For regional- and national-level factors, many studies
Transportation (2019) 46:1505–1524 1507
123

have examined the ‘Happiness-Income Paradox’ or the ‘Easterlin paradox’ (Easterlin and
Angelescu 2009; Stevenson and Wolfers 2008). Easterlin and Angelescu’s (2009) ‘Hap-
piness-Income Paradox’ suggests that no significant relationship exists between improved
happiness and GDP growth per capita. Further, many scholars have argued that a person’s
SWB depends to a large degree on relative income (Mcbride 2001). Neighbourhoods and
built environments also have direct and indirect effects on SWB. For example, Tella and
Macculloch (2005) found that, between 1975 and 1997, environmental degradation and
crime were negatively correlated with people’s happiness in OECD countries. Ludwig
et al. (2012) found that moving from high-poverty to low-poverty neighbourhoods
improved residents’ SWB. Many studies have found that local air pollution and noisy
living environments significantly diminish residents’ SWB (Welsch 2006; MacKerron and
Mourato 2009). Other findings have highlighted the effects of physical neighbourhood
environments (e.g. housing price and quality) as well as neighbourhoods’ social envi-
ronments (e.g. sense of community) on SWB (Farrell et al. 2004).
However, in the existing literature, the relationships of commuting time and commuting
mode with SWB are controversial (Choi et al. 2013; Dickerson et al. 2014; Morrow 2010;
Morris 2011; Munford 2014; Kroesen 2014; Sweet and Kanaroglou 2016; Kroesen, 2014).
Although some studies have concluded that commuting time has no effect on SWB, we
might nevertheless consider it a common sentiment that commuting on congested roads is
unpleasant. There are also research findings to support this. Choi et al. (2013), using
Gallup-Healthways survey data for the United States, found a significant negative relation
between commute time and SWB. Kahneman et al. (2004) used a day reconstruction
method and found that the most disliked and least popular activity among 16 major human
activities was commuting. Stutzer and Frey (2008), using panel data from the German
Socioeconomic Panel Study, found that people with longer commuting time have lower
SWB. Roberts et al. (2011), using annual data from the British Household Panel Survey,
found that commuting has a considerable detrimental impact on the well-being of women,
which may be due in part to their shorter working hours. Wheatley (2014), again using
British Household Panel Survey data, found that longer commutes generated dissatisfac-
tion among men and women, as did shorter commuting among women due to inequality in
household division of labour; this is consistent with conclusions obtained by Roberts et al.
(2011), and Smith (2013). Part of understanding these findings is appreciating that the
relationship between commuting time and well-being varies depending on both location
and respondent features. For instance, Morris (2011) put forward that variables at the
regional level, such as traffic congestion, transfer frequency, and car cost are not signifi-
cantly related to SWB, while variables at the individual level, such as income, are.
Besides commuting time, previous studies have found that the commuting mode is
another important factor that affects residents’ SWB. For example, Gatersleben and Uzzell
(2007), using data from a survey done at the University of Surrey, found that car com-
muting is more stressful than other commuting modes, at least partly because public
transport commuting is boring. Duarte et al. (2010), using data from several European
cities, again found that commuting mode choice has a significant impact on well-being:
subway commuters are happier than private car commuters. Abou-Zeid and Ben-Akiva
(2011), using a web-based cross-sectional survey conducted with a convenience sample of
commuters, found that commuters travelling by non-motorized modes are happier than
those travelling by car or public transport. Smith (2013), using data from a web-based
survey of workers in Portland, Oregon, United States, found that walking and cycling
commuters have significantly higher commute well-being than transit and car commuters.
Zhao and Lee (2013), surveying 2000 North Americans who commute to work or school,
1508 Transportation (2019) 46:1505–1524
123

found that most measures of commuting happiness and satisfaction are heavily dependent
on comfort and reliability ratings of commuting modes. Abou-Zeid and Fujii (2016), using
the results of an experiment conducted by the Massachusetts Institute of Technology
requiring temporary use of public transport to commute to work by habitual car drivers,
observing an increase in the average level of satisfaction with the commute among those
participants.
In addition, scholars have increasingly used the life-oriented approach to better
understand travel behaviour and daily life (Zhang and Acker 2017; Zhang 2017; Beige and
Axhausen 2017). For example, Gerber et al. (2017) found that residents had higher life
satisfaction after relocating from Luxembourg to neighbouring countries with lower real
estate prices, despite increased commute times. Sascha et al., using data from the Dutch
GeluksWijzer (Happiness Indicator), found that people typically feel less well when
commuting than at home; this negative difference was largest when commuting using
public transportation and smallest when commuting by bike. Wang et al. (2017) analysed
holiday travel behaviour dynamics using IMTI (Integrated Multimodal Travel Informa-
tion), based on the life-oriented approach, and found that life biography is affected not only
by personal life course but also by the external background of the times. Delbosc and
Nakanishi (2017) found that among many millennials in Australia, few showed a strong
preference for cars, but as they approached adult milestones (e.g. having children, finding
suitable housing near public transit), they came to feel they had no choice but to own a car.
Yu et al. (2017) developed the DU-DCLH model to describe mobility over the course of
life and confirmed the influence of time-constant and time-varying preferences for resi-
dential neighbourhoods. In travel behaviour analysis using life-oriented approaches, travel
behaviours not only result from life choices but also affect people’s lives.
This study aims to fill the research gap in commuter-happiness relations in China under
rapid urbanization. On the one hand, this study compares the commuting-SWB relationship
in cities with different levels of urbanization, which will improve our understanding of the
real impact of urban transport development on the daily lives of people in China. On the
other hand, this study compares the commuting-SWB relationship among different hukou
holders, which will help us to better understand differences in the commuting patterns and
effects of different groups in China’s specific social context.
Methods
Data
The data used for this study were obtained from the 2014 China Labour-Force Dynamics
Survey (CLDS 2014), conducted by the Centre for Social Science Surveys at Sun Yat-Sen
University, in Guangzhou. The CLDS 2014 was a nationwide cross-sectional survey
covering 29 mainland provinces and municipalities (excluding Tibet and Hainan), with
multistage clustering and a stratified probability sampling strategy. The CLDS 2014
established a tracking database with three levels: individual, neighbourhood, and city. The
CLDS 2014 questionnaires covered individual socioeconomic status, commuting situation,
working conditions, and other demographic information, all of which were used in the
analysis. Additionally, data collection was conducted in a community-based manner, using
a random sampling method. The professional staff went to the interviewees’ homes with
their consent, using face-to-face surveys, to reduce the impact of other potential factors on
Transportation (2019) 46:1505–1524 1509
123

respondents’ SWB (e.g. the weather). Due to the hierarchical structure of the CLDS 2014
data, three-level mixed-effects ordered probit regressions were performed to investigate the
association between commuting and SWB. In the data analysis, samples with missing data
or unemployed respondents were excluded. This left 13,710 individual samples, 124 city
samples, and 401 neighbourhood samples for regression analysis.
Models and variables
In the regression model, the dependent variable was SWB. In the CLDS 2014, respondents
were asked to rate their SWB on a five-point Likert-type scale ranging from very unhappy
(1) to very happy (5). In the CLDS 2014 survey, respondents gave seven main commuting
modes: walk, bicycle, motorcycle, bus, subway, taxi, and private car. In this study, we
grouped bus, subway, and taxi as public transport. The independent variables were daily
commute time (continuous variable), public transport mode (ref: other transportation
modes), and walking/bicycling (ref: other transport modes). Most existing studies have
focused on the impact of socioeconomic factors on residents’ SWB while failing to con-
sider that commute time might also be an important factor affecting SWB. Especially in
China’s large cities (e.g. Beijing), with high levels of urbanization, some residents spend as
much as 4–6 h a day commuting (see http://bj.jjj.qq.com/a/20160926/016439.htm). Long
commute times make people feel greater pressure in urban life, which could negatively
influence SWB. Moreover, suitable commute times differ for different transport modes.
However, there are few comparative studies on the effect of the commute times of different
transport modes on SWB. For example, since private cars are more comfortable than public
transport, does commute time have no significant effect on the SWB of those who use
private transport? What is a reasonable commute time for public transport? These ques-
tions require further investigation. Therefore, we chose those variables as the explanatory
variables. The controlled variables include age (continuous variable), gender (ref: female),
marital status (ref: single, divorced, or widowed), educational attainment (ref: primary
school and below), logarithm of annual personal income (continuous variable), and hukou
status (ref: non-local hukou status).
Some existing studies have shown that city/neighbourhood characteristics are closely
related to residents’ SWB (Liu et al. 2017). Therefore, to control city/neighbourhood
factors, this study used a multilevel mixed-effects ordered probit regression to analyse the
relationship between commuting and SWB. We divided the 124 cities in China into three
types: cities with urbanization rate\ 50%, cities with 50%\ urbanization rate\ 70%, and
cities with urbanization rate[ 70%. In this study, urbanization rate is the proportion of the
population living in urban areas to the total population. In China, cities with higher
urbanization rate tend to have a higher level of economic development (e.g. Beijing,
Shanghai, Shenzhen). In addition, we analysed the relationship between commuting and
SWB for residents with different hukou (‘local people’, who own a local hukou, and
‘migrants’, who do not). The lifestyles and SWB of local residents in a given city are
generally higher than those of migrants (Wong et al. 2007); therefore, the impact of
commuting on their SWB may be different as well.
1510 Transportation (2019) 46:1505–1524
123

Results
Descriptive statistics
According to the CLDS 2014, there are huge differences between urban and rural areas in
relation to commuting (see Table 1). Urban respondents’ daily average commute time is
0.56 h, while rural respondents’ daily average commute time is 0.41 h. The daily average
commute time of urban respondents who live in cities with high urbanization rates
([ 70%) is longer than for those living in cities with low urbanization rates (\ 70%). For
rural respondents, those living in cities with medium urbanization rates (50–70%) have
shorter commutes than their counterparts. Walking is the main commuting mode for urban
and rural respondents, accounting for 33.00 and 57.46%, respectively. As urbanization rate
increases, the proportion of residents commuting by walking gradually decreases. The
proportion of commuters using motorcycles is much smaller in cities with high urban-
ization rates than in those with medium and low urbanization rates. This is mainly because
government motorcycles are still very common in China’s small and medium-sized cities
but are forbidden in large cities because of the increasingly serious traffic problems they
cause (Deng et al. 2009). The proportion of commuters using private cars is much larger in
urban areas than in rural areas (13.74 vs 3.46%). As urbanization rate increases, private car
use increases as well. Additionally, commuting mode also varies widely by urbanization
rate: the higher the urbanization rate, the greater the proportion of public transport modes
(bus, subway, taxi) used for commuting.
Table 2 shows the relationship between transportation modes and respondents’ SWB. In
urban areas, the SWB of respondents commuting by private car is higher than for those
commuting by other transportation modes. In rural areas, the SWB of respondents com-
muting by subway and walking is lower than for those commuting by other transportation
modes. Table 3 shows the relationship between commuting time and respondents’ SWB by
different transportation modes. In urban areas, for commuters using private cars and taxis,
respondents with low levels of SWB commute longer than those with high levels of SWB.
In rural areas, for commuters who walk, use bicycles, or ride motorcycles, the commuting
time of respondents with low levels of SWB is significantly longer than those with high
levels of SWB.
The impact of commuting on residents’ SWB
Table 4 shows the multilevel mixed-effects ordered probit regression results for com-
muting impact on residents’ SWB. Model 1 gives the results for commuting variables and
SWB for respondents living in urban areas, and model 2 for respondents living in rural
areas. In model 1, traffic variables are not significantly related to the respondents’ SWB. In
model 2, the results show that the longer one’s commute time, the lower one’s SWB
(coefficient = - 0.108, p\ 0.01); further, the SWB of respondents commuting by
walking and bicycle is more likely to be lower than that of those commuting by other
means (coefficient = - 0.090, p\ 0.01). In addition, for urban respondents, married
(coefficient = 0.381, p\ 0.01) and higher-income (coefficient = 0.091, p\ 0.01)
respondents, respectively, have higher SWB than unmarried and lower-income respon-
dents. Compared to respondents with a primary school education or less, respondents with
more education (junior high school: coefficient = 0.132, p\ 0.05; senior high school:
coefficient = 0.188, p\ 0.01; college and above: coefficient = 0.376, p\ 0.01) have
Transportation (2019) 46:1505–1524 1511
123

Table
1B
reak
do
wn
of
resp
on
den
ts’
dai
lyco
mm
uti
ng
tim
ean
dtr
ansp
ort
atio
nm
od
esin
the
CL
DS
20
14
All
sam
ple
sC
itie
sw
ith
urb
aniz
atio
nra
te\
50
%C
itie
sw
ith
urb
aniz
atio
nra
te5
0–
70
%C
itie
sw
ith
urb
aniz
atio
nra
te[
70
%
Urb
anar
eaR
ura
lar
eaU
rban
area
Ru
ral
area
Urb
anar
eaR
ura
lar
eaU
rban
area
Rura
lar
eaM
ean
/p
rop
ort
ion
Mea
n/
pro
port
ion
Mea
n/
pro
port
ion
Mea
n/
pro
port
ion
Mea
n/
pro
po
rtio
nM
ean
/p
rop
ort
ion
Mea
n/
pro
port
ion
Mea
n/
pro
po
rtio
n
Dai
lyav
erag
eco
mm
uti
ng
tim
e(h
ou
r)0
.56
0.4
10
.50
0.4
50
.50
0.3
40
.67
0.4
5
Tra
nsp
ort
atio
nm
odes
(%)
Wal
kin
g3
3.0
05
7.4
63
6.8
06
7.8
23
3.4
14
7.9
82
9.3
84
1.9
4
Bic
ycl
e9
.34
6.6
19
.91
4.3
87
.80
9.4
69
.96
7.6
9
Mo
torc
ycl
e1
8.7
92
9.3
62
1.3
82
3.6
92
2.7
83
5.2
11
3.6
83
5.9
3
Bus
21
.41
2.7
01
8.1
11
.54
21
.18
3.6
42
4.4
54
.72
Su
bw
ay2
.64
0.1
81
.13
0.0
90
.53
0.0
35
.47
0.9
3
Tax
i1
.08
0.2
31
.82
0.2
50
.61
0.2
30
.76
0.1
9
Pri
vat
eca
r1
3.7
43
.46
10
.85
2.2
31
3.6
93
.45
16
.30
8.6
0
1512 Transportation (2019) 46:1505–1524
123

higher SWB. Male urban respondents have lower SWB than female urban respondents
(coefficient = - 0.139, p\ 0.01). For rural respondents, the results for the control vari-
ables are almost the same as those in the urban respondent model. Beyond that, for rural
respondents, being older and having a local hukou are associated with higher SWB.
Next, we analysed the results after dividing the 124 cities surveyed in CLDS 2014 into
three types by urbanization rate, as described earlier. The results in Table 5 show that it is
only in less urbanized cities (urbanization rate \ 70%) that commuting time has a sig-
nificant and negative effect on residents’ SWB—the longer the commute time, the less
likely residents are to have a higher level of SWB (urbanization rate \ 50%: coeffi-
cient = - 0.118, p\ 0.01; 50% \ urbanization rate \ 70%: coefficient = - 0.079,
p\ 0.10). This is probably because in big cities with high levels of urbanization, people
are more accustomed to long commutes since there are more traffic jams and longer
commuting distances. Thus, SWB does not change rapidly as commuting time increases.
However, in small and medium-sized cities with lower levels of urbanization, commuting
distance and time are relatively short; thus, if commuting time increases, SWB is more
likely to be affected. In cities with medium urbanization rates (50–70%), the SWB of
commuters who walk or ride bicycles is significantly lower than that of commuters who
use motor vehicles (coefficient = - 0.093, p\ 0.05). This could be related to the
unfriendly walking and cycling environments of such cities (e.g. the imperfect walking
systems and the mix of bike lanes and motorways).
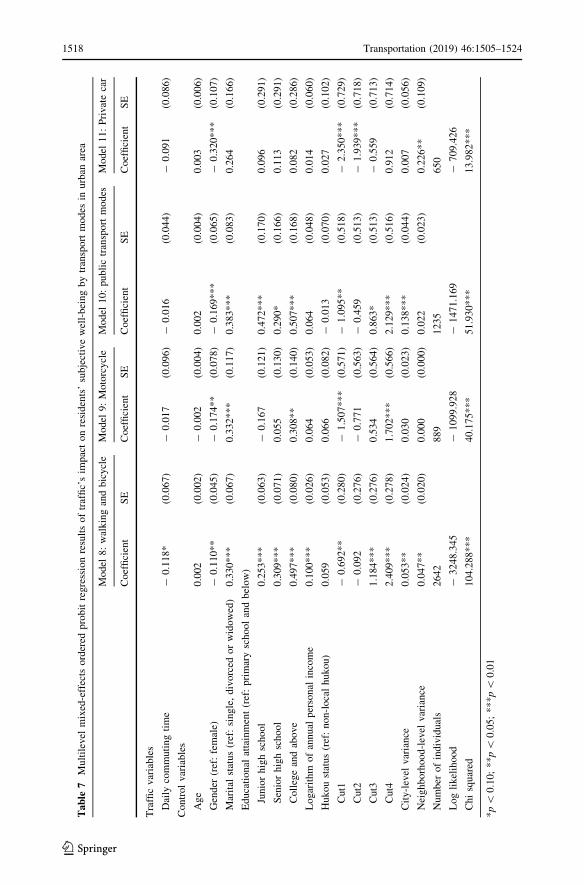
We conducted a regression analysis of the impact of commuting on the SWB of
migrants (without local hukou) and local residents (with local hukou), as shown in Table 6.
For both migrants and local people, commuting time is significantly and negatively
associated with SWB (coefficient = - 0.079, p\ 0.10; coefficient = - 0.081, p\ 0.01).
It is only for local people that commuting by walking/cycling makes it less likely to have a
higher level of SWB (coefficient = - 0.062, p\ 0.05). We also performed a multilevel
mixed-effects ordered probit regression on traffic’s impact on residents’ SWB by transport
mode (see Tables 7 and 8). For respondents in urban areas, only commuting time has a
negative effect on the SWB of those who walk or ride bicycles (coefficient = - 0.118,
p\ 0.10). For respondents in rural areas, commuting time has a negative effect on the
SWB of those who walk/ride bicycles (coefficient = - 0.086, p\ 0.05) or ride motor-
cycles (coefficient = - 0.280, p\ 0.01).
Table 2 The relationshipbetween transportation modesand respondents’ subjective well-being
Transportation modes Subjective well-being
Urban area Rural area
Walking 3.79 3.58
Bicycle 3.80 3.72
Motorcycle 3.72 3.73
Bus 3.82 3.75
Subway 3.84 3.47
Taxi 3.90 3.80
Private car 4.07 3.93
Transportation (2019) 46:1505–1524 1513
123

Table
3T
he
rela
tio
nsh
ipb
etw
een
com
mu
tin
gti
me
and
resp
on
den
ts’
sub
ject
ive
wel
l-bei
ng
by
dif
fere
nt
tran
spo
rtat
ion
mo
des
Tra
nsp
ort
atio
nm
od
esU
rban
area
Rura
lar
ea
Res
po
nden
tsw
ith
low
lev
elo
fsu
bje
ctiv
ew
ell-
bei
ng
(1–
3)
Res
po
nden
tsw
ith
hig
hle
vel
of
sub
ject
ive
wel
l-b
ein
g(4
–5
)
Tes
tst
atis
tics
pv
alu
eR
espo
nd
ents
wit
hlo
wle
vel
of
sub
ject
ive
wel
l-b
eing
(1–
3)
Res
po
nd
ents
wit
hh
igh
lev
elo
fsu
bje
ctiv
ew
ell-
bei
ng
(4–
5)
Tes
tst
atis
tics
pv
alue
Mea
nv
alue
of
com
muti
ng
tim
eS
DM
ean
val
ue
of
com
muti
ng
tim
eS
DM
ean
val
ue
of
com
mu
tin
gti
me
SD
Mea
nv
alu
eo
fco
mm
uti
ng
tim
eS
D
Wal
kin
g0
.26
0.2
60
.27
0.0
1-
0.7
88
0.4
31
0.3
80
.42
0.3
50
.39
2.6
77
0.0
08
Bic
ycl
e0.5
10.0
30.5
10.0
3-
0.1
52
0.8
80
0.4
20
.40
0.3
30
.25
3.4
22
0.0
01
Mo
torc
ycl
e0
.47
0.4
00
.48
0.3
8-
0.3
27
0.7
44
0.4
90
.41
0.4
00
.35
5.5
28
0.0
00
Bu
s0
.94
0.6
90
.93
0.7
40
.158
0.8
75
1.0
20
.94
1.0
10
.88
0.0
53
0.9
57
Su
bw
ay1
.48
0.7
11
.39
0.8
00
.600
0.5
50
1.1
10
.55
1.8
01
.28
-1
.223
0.2
43
Tax
i0
.67
0.5
80
.44
0.4
01
.650
0.1
05
0.8
51
.06
0.7
40
.84
0.2
42
0.8
12
Pri
vat
eca
r0
.77
0.6
60
.70
0.5
61
.162
0.2
46
0.5
60
.51
0.5
30
.64
0.4
26
0.6
70
1514 Transportation (2019) 46:1505–1524
123

Discussion
We found that commuting time and commuting mode both affected the well-being of urban
residents in China. Existing studies mainly focus on the influence of individual social-
economic characteristics on SWB (Mcbride 2001; Steele and Lynch 2013), and the impact
of urban life, especially commuting, on SWB has received insufficient attention in
developing countries. In the past 30 years, with the rapid development of the Chinese
economy, urban traffic congestion is getting more and more serious and people’s com-
muting times are getting longer and longer. In addition, most jobs in Chinese cities are
located in the city centre; but with increasing housing prices in recent years, many wage
earners cannot afford homes close to their workplaces and choose to live in suburbs and
rural areas that have lower housing prices but are far away from workplaces. The SWB of
residents living in urban areas is significantly higher than that of residents living in rural
areas. Moreover, longer commute times not only make residents feel physically exhausted
but also reduce their SWB. We also found that residents who walk or ride a bike to work
Table 4 Multilevel mixed-effects ordered probit regression results of the impact of commuting on resi-dents’ subjective well-being
Model 1: urban area Model 2: rural area
Coefficient SE Coefficient SE
Traffic variables
Daily commuting time - 0.043 (0.033) - 0.108*** (0.030)
Public transport means (ref: Other transport means) - 0.047 (0.048) 0.001 (0.075)
Walk/bicycle (ref: Other transport means) - 0.017 (0.042) - 0.090*** (0.031)
Control variables
Age - 0.001 (0.002) 0.003** (0.001)
Gender (ref: female) - 0.139*** (0.034) - 0.045* (0.026)
Marital status (ref: single, divorced or widowed) 0.381*** (0.048) 0.176*** (0.042)
Educational attainment (ref: primary school and below)
Junior high school 0.132** (0.061) 0.072** (0.029)
Senior high school 0.188*** (0.065) 0.247*** (0.043)
College and above 0.376*** (0.068) 0.305*** (0.073)
Logarithm of annual personal income 0.091*** (0.022) 0.086*** (0.012)
Hukou status (ref: non-local hukou) 0.032 (0.037) 0.107** (0.054)
Cut1 - 1.042*** (0.240) - 1.171*** (0.154)
Cut2 - 0.392* (0.237) - 0.383** (0.151)
Cut3 0.899*** (0.237) 0.898*** (0.151)
Cut4 2.143*** (0.238) 2.164*** (0.152)
City-level variance 0.063*** (0.020) 0.049*** (0.016)
Neighborhood-level variance 0.045*** (0.014) 0.073*** (0.013)
Number of individuals 4731 8530
Log likelihood - 5679.488 - 10,483.653
Chi squared 166.895*** 165.768***
*p\ 0.10; **p\ 0.05; ***p\ 0.01
Transportation (2019) 46:1505–1524 1515
123

have significantly less sense of happiness than commuters using motor vehicles, which
may be related to the imperfect walkways and bicycle lanes in China, where many cities
give priority to motor vehicles in road construction (Thomas and Deakin 2008; Pucher
et al. 2007). Motorway and pedestrian/bike lanes are often mixed, which reduces the safety
and pleasure of people walking or cycling. In addition, traffic pollution has become a major
source of urban pollution in China (Fu et al. 2001); therefore, frequent walking or cycling
commuting may damage to the health of pedestrians or cyclists. Any of these issues may
reduce SWB in urban life.
Table 5 Multilevel mixed-effects ordered probit regression results of commuting impact on residents’subjective well-being based on city urbanization level
Model 3:urbanization rate\ 50%
Model 4: 50%\ urbanization rate\ 70%
Model 5:urbanization rate[ 70%
Coefficient SE Coefficient SE Coefficient SE
Traffic variables
Daily commuting time - 0.118*** (0.033) - 0.079* (0.045) - 0.019 (0.040)
Public transport means (ref:Other transport means)
- 0.020 (0.068) 0.006 (0.069) - 0.098 (0.066)
Walk/bicycle (ref: Othertransport means)
- 0.055 (0.037) - 0.093** (0.042) - 0.032 (0.056)
Control variables
Age 0.002 (0.001) 0.004** (0.002) - 0.003 (0.002)
Gender (ref: female) - 0.058* (0.031) - 0.067* (0.036) - 0.142*** (0.043)
Marital status (ref: single,divorced or widowed)
0.196*** (0.049) 0.187*** (0.056) 0.444*** (0.060)
Educational attainment (ref: primary school and below)
Junior high school 0.058 (0.037) 0.114*** (0.043) 0.138** (0.067)
Senior high school 0.193*** (0.050) 0.286*** (0.058) 0.188** (0.075)
College and above 0.345*** (0.065) 0.452*** (0.070) 0.339*** (0.084)
Logarithm of annual personalincome
0.082*** (0.015) 0.095*** (0.019) 0.104*** (0.026)
Hukou status (ref: non-localhukou)
0.070 (0.049) 0.017 (0.056) 0.030 (0.050)
Cut1 - 1.183*** (0.181) - 1.105*** (0.220) - 0.988*** (0.296)
Cut2 - 0.388** (0.178) - 0.415* (0.216) - 0.278 (0.293)
Cut3 0.842*** (0.178) 0.933*** (0.216) 1.050*** (0.293)
Cut4 2.074*** (0.179) 2.246*** (0.217) 2.275*** (0.294)
City-level variance 0.057*** (0.018) 0.035* (0.018) 0.054** (0.024)
Neighborhood-level variance 0.059*** (0.013) 0.091*** (0.019) 0.040*** (0.015)
Number of individuals 5998 4355 2908
Log likelihood - 7478.809 - 5159.533 - 3510.556
Chi squared 117.435*** 120.874*** 126.124***
*p\ 0.10; **p\ 0.05; ***p\ 0.01
1516 Transportation (2019) 46:1505–1524
123

Commute time not only directly affects the SWB of residents but also has an indirect
impact on their SWB through job satisfaction, family life satisfaction, residence, and other
socioeconomic factors. For example, many people have to travel long distances because of
the high housing prices in locations close to workplaces (Logan et al. 2009; Wang and Chai
2009). In this study, we used job satisfaction and family life satisfaction as mediating
variables to verify this mediating effect, using Sobel-Goodman mediation tests in Stata
(results available upon request). Table 4 shows that only for rural respondents does
commuting time significant affect SWB. Therefore, we used the samples of rural
respondents to perform the mediation test. We used SWB as the dependent variable,
commuting time as the independent variable, and job satisfaction and family life satis-
faction as the mediator variables. The results show that commuting time influences resi-
dents’ job satisfaction and family life satisfaction, which in turn influence their SWB. The
mediating effect of job satisfaction is statistically significant, with approximately 54.6% of
the total effect (of commuting time on SWB) being mediated; the mediating effect of
family life satisfaction is statistically significant, with approximately 53.4% of the total
Table 6 Multilevel mixed-effects ordered probit regression results of traffic’s impact on residents’ sub-jective well-being by hukou status
Model 6: migrants Model 7: local people
Coefficient SE Coefficient SE
Traffic variables
Daily commuting time - 0.079* (0.048) - 0.081*** (0.025)
Public transport means (ref: Other transport means) - 0.020 (0.072) - 0.043 (0.046)
Walk/bicycle (ref: Other transport means) - 0.071 (0.058) - 0.062** (0.028)
Control variables
Age - 0.002 (0.002) 0.003** (0.001)
Gender (ref: female) - 0.180*** (0.048) - 0.057** (0.023)
Marital status (ref: single, divorced or widowed) 0.446*** (0.070) 0.210*** (0.035)
Educational attainment (ref: primary school and below)
Junior high school 0.125* (0.075) 0.087*** (0.028)
Senior high school 0.157* (0.081) 0.243*** (0.037)
College and above 0.325*** (0.087) 0.407*** (0.047)
Logarithm of annual personal income 0.084*** (0.029) 0.092*** (0.011)
Cut1 - 1.101*** (0.320) - 1.166*** (0.132)
Cut2 - 0.413 (0.316) - 0.400*** (0.129)
Cut3 0.835*** (0.316) 0.895*** (0.129)
Cut4 1.960*** (0.317) 2.185*** (0.130)
City-level variance 0.063** (0.025) 0.056*** (0.013)
Neighborhood-level variance 0.059*** (0.023) 0.064*** (0.010)
Number of individuals 2397 10,864
Log likelihood - 3012.558 - 13,158.518
Chi squared 92.136*** 265.302***
*p\ 0.10; **p\ 0.05; ***p\ 0.01
Transportation (2019) 46:1505–1524 1517
123
Table
7M
ult
ilev
elm
ixed
-eff
ects
ord
ered
pro
bit
regre
ssio
nre
sult
so
ftr
affi
c’s
imp
act
on
resi
den
ts’
sub
ject
ive
wel
l-b
ein
gb
ytr
ansp
ort
mo
des
inu
rban
area
Mo
del
8:
wal
kin
gan
db
icycl
eM
odel
9:
Mo
torc
ycl
eM
odel
10
:p
ub
lic
tran
spo
rtm
od
esM
odel
11
:P
riv
ate
car
Co
effi
cien
tS
EC
oef
fici
ent
SE
Co
effi
cien
tS
EC
oef
fici
ent
SE
Tra
ffic
var
iab
les
Dai
lyco
mm
uti
ng
tim
e-
0.1
18
*(0
.06
7)
-0
.01
7(0
.09
6)
-0
.016
(0.0
44)
-0
.091
(0.0
86)
Co
ntr
ol
var
iab
les
Ag
e0
.002
(0.0
02
)-
0.0
02
(0.0
04
)0
.002
(0.0
04)
0.0
03
(0.0
06)
Gen
der
(ref
:fe
mal
e)-
0.1
10
**
(0.0
45
)-
0.1
74
**
(0.0
78
)-
0.1
69
**
*(0
.06
5)
-0
.320
**
*(0
.10
7)
Mar
ital
stat
us
(ref
:si
ng
le,
div
orc
edo
rw
ido
wed
)0
.330
**
*(0
.06
7)
0.3
32
**
*(0
.11
7)
0.3
83
**
*(0
.08
3)
0.2
64
(0.1
66)
Ed
uca
tio
nal
atta
inm
ent
(ref
:p
rim
ary
sch
ool
and
bel
ow
)
Jun
ior
hig
hsc
ho
ol
0.2
53
**
*(0
.06
3)
-0
.16
7(0
.12
1)
0.4
72
**
*(0
.17
0)
0.0
96
(0.2
91)
Sen
ior
hig
hsc
ho
ol
0.3
09
**
*(0
.07
1)
0.0
55
(0.1
30
)0
.290
*(0
.16
6)
0.1
13
(0.2
91)
Coll
ege
and
abo
ve
0.4
97
**
*(0
.08
0)
0.3
08
**
(0.1
40
)0
.507
**
*(0
.16
8)
0.0
82
(0.2
86)
Lo
gar
ith
mo
fan
nu
alp
erso
nal
inco
me
0.1
00
**
*(0
.02
6)
0.0
64
(0.0
53
)0
.064
(0.0
48)
0.0
14
(0.0
60)
Hu
ko
ust
atu
s(r
ef:
no
n-l
oca
lh
uk
ou
)0
.059
(0.0
53
)0
.06
6(0
.08
2)
-0
.013
(0.0
70)
0.0
27
(0.1
02)
Cut1
-0
.69
2*
*(0
.28
0)
-1
.50
7*
**
(0.5
71
)-
1.0
95
**
(0.5
18)
-2
.350
**
*(0
.72
9)
Cut2
-0
.09
2(0
.27
6)
-0
.77
1(0
.56
3)
-0
.459
(0.5
13)
-1
.939
**
*(0
.71
8)
Cut3
1.1
84
**
*(0
.27
6)
0.5
34
(0.5
64
)0
.863
*(0
.51
3)
-0
.559
(0.7
13)
Cut4
2.4
09
**
*(0
.27
8)
1.7
02
**
*(0
.56
6)
2.1
29
**
*(0
.51
6)
0.9
12
(0.7
14)
Cit
y-l
evel
var
ian
ce0
.053
**
(0.0
24
)0
.03
0(0
.02
3)
0.1
38
**
*(0
.04
4)
0.0
07
(0.0
56)
Nei
gh
bo
rhoo
d-l
evel
var
ian
ce0
.047
**
(0.0
20
)0
.00
0(0
.00
0)
0.0
22
(0.0
23)
0.2
26
**
(0.1
09)
Nu
mb
ero
fin
div
idual
s2
64
28
89
12
35
65
0
Lo
gli
kel
ihoo
d-
32
48
.34
5-
10
99
.92
8-
14
71.1
69
-7
09
.42
6
Chi
squ
ared
10
4.2
88
**
*4
0.1
75
***
51
.93
0*
**
13
.98
2*
**
*p\
0.1
0;
**p\
0.0
5;
**
*p\
0.0
1
1518 Transportation (2019) 46:1505–1524
123

Table
8M
ult
ilev
elm
ixed
-eff
ects
ord
ered
pro
bit
regre
ssio
nre
sult
so
ftr
affi
c’s
imp
act
on
resi
den
ts’
sub
ject
ive
wel
l-b
ein
gb
ytr
ansp
ort
mo
des
inru
ral
area
Mo
del
12
:w
alk
ing
and
bic
ycl
eM
odel
13
:M
oto
rcy
cle
Mo
del
14
:p
ub
lic
tran
spo
rtm
od
esM
od
el1
5:
Pri
vat
eca
r
Coef
fici
ent
SE
Coef
fici
ent
SE
Coef
fici
ent
SE
Coef
fici
ent
SE
Tra
ffic
var
iab
les
Dai
lyco
mm
uti
ng
tim
e-
0.0
86
**
(0.0
39)
-0
.28
0*
**
(0.0
63
)-
0.0
77
(0.0
66)
-0
.063
(0.1
25)
Co
ntr
ol
var
iab
les
Ag
e0
.004
**
*(0
.00
1)
-0
.00
2(0
.00
2)
0.0
08
(0.0
06)
-0
.006
(0.0
08)
Gen
der
(ref
:fe
mal
e)-
0.0
35
(0.0
30)
-0
.11
5*
*(0
.05
0)
-0
.15
0(0
.11
4)
0.1
52
(0.1
78)
Mar
ital
stat
us
(ref
:si
ng
le,
div
orc
edo
rw
ido
wed
)0
.158
**
*(0
.04
9)
0.2
61
**
*(0
.08
2)
0.2
03
(0.1
46)
0.3
92
(0.2
52)
Ed
uca
tio
nal
atta
inm
ent
(ref
:p
rim
ary
sch
ool
and
bel
ow
)
Jun
ior
hig
hsc
ho
ol
0.0
53
(0.0
35)
0.0
99
*(0
.05
3)
0.2
62
(0.1
80)
-0
.120
(0.2
41)
Sen
ior
hig
hsc
ho
ol
0.2
20
**
*(0
.05
3)
0.2
92
**
*(0
.07
3)
0.3
01
(0.2
00)
-0
.050
(0.2
71)
Coll
ege
and
abo
ve
0.3
31
**
*(0
.08
8)
0.3
12
**
(0.1
28
)0
.648
**
*(0
.20
7)
-0
.027
(0.2
90)
Lo
gar
ith
mo
fan
nu
alp
erso
nal
inco
me
0.0
94
**
*(0
.01
4)
0.1
00
**
*(0
.02
8)
0.0
12
(0.0
68)
0.2
11
**
*(0
.07
9)
Hu
ko
ust
atu
s(r
ef:
no
n-l
oca
lh
uk
ou
)0
.078
(0.0
60)
0.0
54
(0.0
91
)-
0.1
78
(0.1
35)
0.1
31
(0.2
20)
Cut1
-0
.973
**
*(0
.17
2)
-1
.35
5*
**
(0.3
21
)-
1.9
55
**
*(0
.74
2)
-0
.458
(0.9
42)
Cut2
-0
.178
(0.1
69)
-0
.59
3*
(0.3
17
)-
1.1
73
(0.7
21)
0.6
25
(0.9
12)
Cut3
1.1
03
**
*(0
.16
9)
0.7
32
**
(0.3
17
)0
.154
(0.7
19)
1.8
42
**
(0.9
15)
Cut4
2.3
54
**
*(0
.17
0)
2.0
18
**
*(0
.31
8)
1.5
21
**
(0.7
25)
3.2
08
**
*(0
.92
4)
Cit
y-l
evel
var
ian
ce0
.051
**
*(0
.01
5)
0.0
90
**
*(0
.03
4)
0.1
51
**
(0.0
76)
0.0
00
(0.0
00)
Nei
gh
bo
rhoo
d-l
evel
var
ian
ce0
.051
**
*(0
.01
2)
0.0
86
**
*(0
.02
8)
0.0
33
(0.0
73)
0.3
65
**
(0.1
43)
Nu
mb
ero
fin
div
idual
s5
98
22
50
44
52
29
6
Lo
gli
kel
ihoo
d-
74
39.8
25
-3
02
8.7
61
-5
38
.69
4-
35
1.0
22
Chi
squ
ared
10
8.4
51
**
*7
0.0
06
***
20
.09
7*
**
11
.80
6*
**
*p\
0.1
0;
**p\
0.0
5;
**
*p\
0.0
1
Transportation (2019) 46:1505–1524 1519
123

effect of commuting time on SWB. This result aligns with existing studies using life-
oriented approaches (Zhang and Acker 2017).
Looking at differences by urbanization rate, we found that commute time significantly
affects SWB in cities with urbanization rates less than 70%. This is related first and
foremost to fact that the more urbanized cities in China tend to be those with higher public
revenues, which allows for the establishment of multiple transport channels, more frequent
and improved public transit service, and better general transportation infrastructure
(making commutes more pleasant and traffic less congested). These cities may also feature
more jobs and amenities, which might help residents feel more sanguine about enduring
their commutes. This latter point is also an important reason why the traffic factors in
Table 6 have a less significant impact on the well-being of migrants than of local people—
migrants generally move from economically backward (often rural) areas to more eco-
nomically developed (often urban) areas to seek prosperity, and they may be more affected
by these urban socioeconomic factors than by traffic factors. Tables 7 and 8 show that the
SWB of commuters who walk/ride bikes or ride motorcycles is more affected by com-
muting time and the transportation environment. During China’s rapid development, local
governments pursued economic growth based on urban expansion (Wu 2015; Xiao et al.
2006), while ignoring liveability and accessibility. The transportation rights of walkers and
cyclists are always neglected in transportation construction. Future traffic construction
should give more priority to these vulnerable groups.
To improve commuting efficiency and well-being among residents in Chinese cities, we
put forward the following policy suggestions. First, it is necessary to improve job–housing
balance and shorten the distance between employment and residence locations. Second,
improving the pedestrian/bike lane system and avoiding mixing bike and car lanes will
improve satisfaction with walking and bicycling. Third, it is urgent to reduce traffic pol-
lution in order to increase the willingness of residents to commute by bicycle. Before we
conclude, several limitations of this study should be registered. First, scholars from dif-
ferent fields (psychology, economics, etc.) have constructed many different SWB scales
(Schuur and Kruijtbosch 1995). For instance, Diener (1994) proposed that SWB comprises
longer-term levels of pleasant affect, a lack of unpleasant affect, and life satisfaction.
However, in this study, due to data limitations, we just used the five-point Likert-type scale
to rate respondents’ SWB. The CLDS 2014 data provide a rare instance of large-scale
national data. It is more accurate to show the relationship between commuting and SWB
using data with a large-scale sample size. Therefore, those data were worth using to
conduct this research. In future research, SWB can be redefined and reconstructed based on
the needs of transportation studies; such a new SWB measure could be more relevant and
effective for the field of transportation. Second, as explained in the literature review, SWB
is a comprehensive assessment of the current lives of residents. Their SWB could be
affected by other socioeconomic factors besides traffic factors, such as housing prices,
work pressures, public service availability and quality, and so on. Further, although this
study shows that traffic factors (especially commuting time) have a significant impact on
SWB, we do not demonstrate that the impact of traffic factors on SWB is stronger than that
of other socioeconomic factors, such as health, income, environmental pollution, etc. The
impact of traffic on SWB is likely to occur during a short period of time or at a particular
time (such as at the time of traffic congestion). Aside from commuting time and transport
modes, other traffic factors might have an impact on SWB, such as having a driver’s
license, auto ownership, length of stay in the residence, proximity to transit options around
the neighbourhood, and so forth (Engels and Liu 2011; Bergstad et al. 2011). Third, this
study used cross-sectional data, meaning that the relationship between commuting time and
1520 Transportation (2019) 46:1505–1524
123

well-being could not be compared between different years within a given same city.
Fourth, although traffic factors did not have a significant impact on residents’ well-being in
cities with a high urbanization rate, we cannot ignore traffic problems in large cities. For
instance, in Beijing, due to high housing price, most working-class people are living far
away from their work, and even in other, neighbouring locations (such as Hebei Province,
Tianjin, and so on). These people have to spend several hours going to their workplace
every day, and irrespective of the results found here that may mitigate perception of its
effect on SWB, commuting is still a major urban problem in big cities (with high
urbanization rates) in China.
Conclusion
Commuting negatively affects Chinese people’s subjective well-being, especially for
residents living in rural areas and walkers/cyclists. Residents commuting by public
transport are less subjectively well than those commuting by private car, and those com-
muting by walking or cycling are less well than others. We also found that residents of
cities with high urbanization rates may endure longer commute times than residents of
cities with low urbanization rates. In addition, commuting has a greater impact on the SWB
of residents with local hukou than on that of migrants.
Open Access This article is distributed under the terms of the Creative Commons Attribution 4.0 Inter-national License (http://creativecommons.org/licenses/by/4.0/), which permits unrestricted use, distribution,and reproduction in any medium, provided you give appropriate credit to the original author(s) and thesource, provide a link to the Creative Commons license, and indicate if changes were made.
Authors’ contributions H. Chen: conceived and designed the study; Z. Zhu and Z. Li: performed thestatistical analysis; H. Chen and Z. Zhu: manuscript writing and editing; Y. Liu and J. Zeng: literature searchand review, manuscript writing.
References
Abou-Zeid, M., Ben-Akiva, M.: The effects of social comparisons on commute well-being. Transp. Res.Part A Policy Pract. 45(4), 345–361 (2011)
Abou-Zeid, M., Fujii, S.: Travel satisfaction effects of changes in public transport usage. Transportation43(2), 301–314 (2016)
Abou-Zeid, M., Witter, R., Bierlaire, M., Kaufmann, V., Ben-Akiva, M.: Happiness and travel modeswitching: findings from a Swiss public transportation experiment. Transp. Policy 19(1), 93–104(2012)
Beige, S., Axhausen, K.W.: The dynamics of commuting over the life course: swiss experiences. Transp.Res. Part A Policy Pract. 104, 179–194 (2017)
Bergstad, C.J., Gamble, A., Garling, T., et al.: Subjective well-being related to satisfaction with daily travel.Transportation 38(1), 1–15 (2011)
Chan, K.W., Zhang, L.: The hukou system and rural-urban migration in China: processes and changes.China Q. 160, 818–855 (1999)
Chen, H., Jia, B., Lau, S.S.Y.: Sustainable urban form for Chinese compact cities: challenges of a rapidurbanized economy. Habitat Int 32(1), 28–40 (2008)
Choi, J., Coughlin, J., D’Ambrosio, L.: Travel time and subjective well-being. Transp. Res. Rec. J. Transp.Res. Board 2357, 100–108 (2013)
Clark, A.E., Diener, E., Georgellis, Y., Lucas, R.E.: Lags and leads in life satisfaction: a test of the baselinehypothesis. Econ. J. 118(529), F223–F243 (2008a)
Clark, A.E., Frijters, P., Shields, M.A.: Relative income, happiness and utility: an explanation for theEasterlin paradox and other puzzles. J. Econ. Lit. 46(1), 95–144 (2008b)
Transportation (2019) 46:1505–1524 1521
123
Crespo, R.F., Mesurado, B.: Happiness economics, eudaimonia and positive psychology: from happinesseconomics to floruishing economics. J. Happiness Stud. 16(4), 931–946 (2015)
Creutzig, F., He, D.: Climate change mitigation and co-benefits of feasible transport demand policies inBeijing. Transp. Res. Part D Transp. Environ. 14(2), 120–131 (2009)
Delbosc, A., Nakanishi, H.: A life course perspective on the travel of Australian millennials. Transp. Res.Part A Policy Pract. 104, 319–336 (2017)
Deng, X., Jianmin, X.U., Bo, W.: Traffic countermeasures research for Guangzhou City in traffic modetransferring period after ‘‘Motorcycle Forbidden Ban’’ effect. J. Transp. Syst. Eng. Inf. Technol. 9(4),145–150 (2009)
Dickerson, A., Hole, A.R., Munford, L.A.: The relationship between well-being and commuting revisited:does the choice of methodology matter? Work. Pap. 49, 321–329 (2014)
Diener, E.: Subjective well-being. Psychol. Bull. 95(3), 542–575 (1984)Diener, E.: Assessing subjective well-being: progress and opportunities. Soc. Indic. Res. 31(2), 103–157
(1994)Dolan, P., Peasgood, T., White, M.: Do we really know what makes us happy? A review of the economic
literature on the factors associated with subjective well-being. J. Econ. Psychol. 29(1), 94–122 (2008)Duarte, A., Garcia, C., Giannarakis, G., et al.: New approaches in transportation planning: happiness and
transport economics. Netnomics Econ. Res. Electron. Netw. 11(1), 5–32 (2010)Easterlin, R.A., Angelescu, L.: Happiness and Growth the World Over: Time Series Evidence on the
Happiness-Income Paradox. Iza Discussion Papers (4060) (2009)Engels, B., Liu, G.J.: Social exclusion, location and transport disadvantage amongst non-driving seniors in a
Melbourne municipality, Australia. J. Transp. Geogr. 19(4), 984–996 (2011)Ettema, D., Garling, T., Eriksson, L., et al.: Satisfaction with travel and subjective well-being: development
and test of a measurement tool. Transp. Res. Part F Traffic Psychol. Behav. 14(3), 167–175 (2011)Ettema, D., Garling, T., Olsson, L.E., Friman, M.: Out-of-home activities, daily travel, and subjective well-
being. Transp. Res. Part A Policy Pract. 44(9), 723–732 (2010)Farrell, S.J., Aubry, T., Coulombe, D.: Neighborhoods and neighbors: do they contribute to personal well-
being? J. Commun. Psychol. 32(1), 9–25 (2004)Ferenchak, N.N., Katirai, M.: Commute mode and mental health in major metropolitan areas. Transp. Lett.
Int, J. Transp. Res. 7(2), 92–103 (2015)Frey, B.S., Stutzer, A.: Happiness and Economics: How the Economy and Institutions Affect Human Well-
being. Princeton University Press, Princeton (2002a)Frey, B.S., Stutzer, A.: What can economists learn from happiness research? J. Econ. Lit. 40(2), 402–435
(2002b)Fu, L., Hao, J., He, D., et al.: Assessment of vehicular pollution in China. J. Air Waste Manag. Assoc. 51(5),
658–668 (2001)Gatersleben, B., Uzzell, D.: Affective appraisals of the daily commute comparing perceptions of drivers,
cyclists, walkers, and users of public transport. Environ. Behav. 39(3), 416–431 (2007)Gerber, P., Ma, T.Y., Klein, O., Schiebel, J., Carpentier-Postel, S.: Cross-border residential mobility, quality
of life and modal shift: a Luxembourg case study. Transp. Res. Part A Policy Pract. 104, 238–254(2017)
Gunatilaka, R.: Does economic growth raise happiness in China? Oxf. Dev. Stud. 39(1), 1–24 (2011)Kahneman, D., Deaton, A.: High income improves evaluation of life but not emotional well-being. Proc.
Natl. Acad. Sci. U.S.A. 107(38), 16489 (2010)Kahneman, D., Krueger, A.B.: Developments in the measurements of subjective well-being. J. Econ. Per-
spect. 20(1), 3–24 (2006)Kahneman, D., Krueger, A.B., Schkade, D.A., Schwarz, N., Stone, A.A.: A survey method for characterizing
daily life experience: the day reconstruction method. Science 306(5702), 1776–1780 (2004)Kroesen, M.: Accessing mediators in the relationship between commute time and subjective well-being.
Transp. Res. Rec. J. Transp. Res. Board 2452, 114–123 (2014)Layard, R.: Measuring subjective well-being. Science 327(5956), 534–535 (2010)Li, S.M., Liu, Y.: The jobs-housing relationship and commuting in Guangzhou, China: hukou and dual
structure q. J. Transp. Geogr. 54, 286–294 (2016)Lin, D., Allan, A., Cui, J.: The impact of polycentric urban development on commuting behaviour in urban
China: evidence from four sub-centres of Beijing. Habitat Int. 50, 195–205 (2015)Linn, J., Wang, Z., Xie, L.: Who will be affected by a congestion pricing scheme in Beijing? Transp. Policy
47, 34–40 (2016)Liu, Y., Zhang, F., Wu, F., Liu, Y., Li, Z.: The subjective wellbeing of migrants in Guangzhou, China: the
impacts of the social and physical environment. Cities 60, 333–342 (2017)
1522 Transportation (2019) 46:1505–1524
123

Logan, J.R., Fang, Y., Zhang, Z.: Access to housing in urban China. Int. J. Urban Reg. Res. 33(4), 914–935(2009)
Ludwig, J., Duncan, G.J., Gennetian, L.A., Katz, L.F., Kessler, R.C., Kling, J.R., Sanbonmatsu, L.:Neighborhood effects on the long-term well-being of low-income adults. Science 337(6101),1505–1510 (2012)
Mackerron, G.: Happiness economics from 35000 feet. J. Econ. Surv. 26(4), 705–735 (2012)MacKerron, G., Mourato, S.: Life satisfaction and air quality in London. Ecol. Econ. 68(5), 1441–1453
(2009)Mcbride, M.: Relative-income effects on subjective well-being in the cross-section. J. Econ. Behav. Organ.
45(3), 251–278 (2001)Mccabe, S., Johnson, S.: The happiness factor in tourism: subjective well-being and social tourism. Ann.
Tour. Res. 41(1), 42–65 (2013)Mccabe, S., Joldersma, T., Li, C.: Understanding the benefits of social tourism: linking participation to
subjective well-being and quality of life. Int. J. Tour. Res. 12(6), 761–773 (2010)Morris, E.A.: Access and Outcomes: Transportation, Location, and Subjective Well-being. University of
California, Los Angeles (2011)Morrow, S.L.: The psychological Costs of Commuting: Understanding Relationships between Time, Con-
trol, Stress, and Well-being. University of Connecticut, Storrs (2010)Munford, L.A.: Driving My Life Away? Essays Examining the Impact of Commuting on Income and Well-
being. University of Sheffield, Sheffield (2014)Na, T., Chai, Y., Zhang, Y., Sun, D.: Understanding job-housing relationship and commuting pattern in
Chinese cities: past, present and future. Transp. Res. Part D Transp. Environ. 52, 562–573 (2017)Newbold, K.B., Scott, D.M., Burke, C.: Immigrant status and commute distance: an exploratory study based
on the greater Golden Horseshoe. Transportation 44(1), 181–198 (2017)Olsson, L.E., Garling, T., Ettema, D., et al.: Happiness and satisfaction with work commute. Soc. Indic. Res.
111(1), 255–263 (2013)Pucher, J., Peng, Z., Mittal, N., et al.: Urban transport trends and policies in China and India: impacts of
rapid economic growth. Transp. Rev. 27(4), 379–410 (2007)Roberts, J., Hodgson, R., Dolan, P.: It’s driving her mad: gender difference in the effects of commuting on
psychological health. J. Health Econ. 30(5), 1064–1076 (2011)Schuur, H.V., Kruijtbosch, M.: Measuring subjective well-being. Science 327(5965), 534–535 (1995)Schwanen, T., Mokhtarian, P.L.: What affects commute mode choice: neighborhood physical structure or
preferences toward neighborhoods? J. Transp. Geogr. 13(1), 83–99 (2005)Smith, O.B.: Peak of the Day or the Daily Grind: Commuting and Subjective Well-being. Portland State
University, Portland (2013)Steele, L.G., Lynch, S.M.: The pursuit of happiness in China: individualism, collectivism, and subjective
well-being during China’s economic and social transformation. Soc. Indic. Res. 114(2), 441–451(2013)
Stevenson, B., Wolfers, J.: Economic growth and subjective well-being: reassessing the Easterlin paradox.In: National Bureau of Economic Research, working paper, no. 14282, August (2008)
Stutzer, A., Frey, B.S.: Recent advances in the economics of individual subjective well-being. Soc. Res.77(2), 679–714 (2010)
Stutzer, A., Frey, B.S.: Stress that doesn’t Pay: the commuting paradox. Scand. J. Econ. 110(2), 339–366(2008)
Sun, B., He, Z., Zhang, T., et al.: Urban spatial structure and commute duration: an empirical study of China.Int. J. Sustain. Transp. 10(7), 638–644 (2016)
Sweet, M., Kanaroglou, P.: Gender differences: the role of travel and time use in subjective well-being.Transp. Res. Part F Traffic Psychol. Behav. 40, 23–34 (2016)
Tella, R.D., Macculloch, R.: Some uses of happiness data in economics. J. Econ. Perspect. 20(1), 25–46(2006)
Tella, R.D., Macculloch, R.: Gross national happiness as an answer to the Easterlin paradox? Macroeco-nomics 86(1), 22–42 (2005)
Thomas, A., Deakin, E.: Land use challenges to implementing transit-oriented development in China: casestudy of Jinan, Shandong Province. Transp. Res. Rec. J. Transp. Res. Board 2077, 80–86 (2008)
Veenhoven, R.: Informed Pursuit of Happiness: what we should know, do know and can get to know.J. Happiness Stud. 16(4), 1035–1071 (2015)
Wang, B., Shao, C., Ji, X.: Dynamic analysis of holiday travel behaviour with integrated multimodal travelinformation usage: a life-oriented approach. Transp. Res. Part A Policy Pract. 104, 255–280 (2017)
Wang, D., Chai, Y.: The jobs–housing relationship and commuting in Beijing, China: the legacy of Danwei.J. Transp. Geogr. 17(1), 30–38 (2009)
Transportation (2019) 46:1505–1524 1523
123
Wang, L., Xu, J., Qin, P.: Will a driving restriction policy reduce car trips? The case study of Beijing, China.Transp. Res. Part A Policy Pract. 67, 279–290 (2014)
Welsch, H.: Environment and happiness: valuation of air pollution using life satisfaction data. Ecol. Econ.58(4), 801–813 (2006)
Wheatley, D.: Travel-to-work and subjective well-being: a study of UK dual career household. J. Transp.Geogr. 39, 187–196 (2014)
Wong, D.F.K., Li, C.Y., Song, H.X.: Rural migrant workers in urban China: living a marginalised life. Int.J. Soc. Welf. 16(1), 32–40 (2007)
Wu, F.: Planning for Growth: Urban and Regional Planning in China. Routledge, London (2015)Xiao, J., Shen, Y., Ge, J., Tateishi, R., Tang, C., Liang, Y., Huang, Z.: Evaluating urban expansion and land
use change in Shijiazhuang, China, by using GIS and remote sensing. Landsc. Urban Plan. 75(1–2),69–80 (2006)
Yang, J., Gakenheimer, R.: Assessing the transportation consequences of land use transformation in urbanChina. Habitat Int. 31(3–4), 345–353 (2007)
Ye, R., Titheridge, H.: Impact of individuals’ commuting trips on subjective well-being evidence fromXi’an, China. J. Transp. Health 2(2), S59 (2015)
Yu, B., Zhang, J., Li, X.: Dynamic life course analysis on residential location choice. Transp. Res. Part APolicy Pract. 104, 281–292 (2017)
Zhang, J., Acker, V.V.: Life-oriented travel behavior research: An overview. Transp. Res. Part A PolicyPract. 104, 167–178 (2017)
Zhang, J.: Life-Oriented Behavioral Research for Urban Policy. Springer, Berlin (2017)Zhao, J., Lee, J.: Experience or Memory: Happiness of Commuting. Transportation Research Board 92nd
Annual Meeting, Washington DC (2013)Zhao, P., Howden-Chapman, P.: Social inequalities in mobility: the impact of the hukou system on
migrants’ job accessibility and commuting costs in Beijing. Int. Dev. Plan. Rev. 32(3), 363–384 (2010)Zhao, P., Lu, B., Roo, G.D.: Impact of the jobs-housing balance on urban commuting in Beijing in the
transformation era. J. Transp. Geogr. 19(1), 59–69 (2011a)Zhao, P., Lu, B., Roo, G.D.: The impact of urban growth on commuting patterns in a restructuring city:
evidence from Beijing. Papers Reg. Sci. 90(4), 735–754 (2011b)Zhao, P., Lu, B., Roo, G.D.: Urban expansion and transportation: the impact of urban form on commuting
patterns on the city fringe of Beijing. Environ. Plan. A 42(42), 2467–2486 (2010)
Zhenjun Zhu is a PhD. student in the School of Transportation at Southeast University. His current researchinterests include transportation modeling and travel demand modeling.
Zhigang Li is a professor in the School of Urban Design at Wuhan University. His research focuses onChina’s urban development.
Hongsheng Chen is a postdoctor in the School of Geography and Planning at Sun Yat-Sen University. Hisresearch focuses on the impact of China’s urbanization.
Ye Liu is a professor in the School of Geography and Planning at Sun Yat-Sen University. His researchfocuses on mobility and urbanization in China.
Jun Zeng is a PhD. student in the School of Transportation at Southeast University. Her current researchinterests include transportation modeling and simulation.
1524 Transportation (2019) 46:1505–1524
123