subjective evaluation of critical success factors for a qoe aware adaptive system
TRANSCRIPT
Computer Communications 36 (2013) 1608–1620
Contents lists available at ScienceDirect
Computer Communications
journal homepage: www.elsevier .com/ locate/comcom
Subjective evaluation of critical success factors for a QoE aware adaptivesystem
0140-3664/$ - see front matter � 2013 Elsevier B.V. All rights reserved.http://dx.doi.org/10.1016/j.comcom.2013.07.005
⇑ Corresponding author. Tel.: +34 985182295; fax: +34 985181986.E-mail addresses: [email protected] (A. Alvarez), pozuecolaura.uo@
uniovi.es (L. Pozueco), [email protected] (S. Cabrero), [email protected] (X.G.Pañeda), [email protected] (R. Garcia), [email protected] (D. Melendi),[email protected] (G.D. Orueta).
1 Spanish Distance University (UNED), Spain.
Alberto Alvarez ⇑, Laura Pozueco, Sergio Cabrero, Xabiel G. Pañeda, Roberto Garcia, David Melendi,Gabriel Díaz Orueta 1
Informatics department, University of Oviedo, Gijon, Spain
a r t i c l e i n f o
Article history:Available online 6 August 2013
Keywords:Subjective quality assessmentScalable Video Coding (SVC)Adaptive systemsQuality of experience (QoE)
a b s t r a c t
For many years video content delivery has established itself as the killer application. Improving QoE onadaptive streaming is focusing many efforts in the quest for optimized methods and metrics to allow aQoE driven adaptation. Questions such as whether adaptive systems based on Scalable Video Codingimprove subjective quality and in which situations or to what degree are still open issues. Toleranceand indifference thresholds for each type of content, conditions or viewer category, with regard to adap-tive systems are critical success factors that are yet unresolved. We compare the performance of a com-plete adaptive system with the traditional, i.e. non-adaptive, approach in subjective terms. Results ofsurveying 75 participants show that the adaptation improves QoE under most of the evaluated condi-tions. Tolerance thresholds for triggering adaptation events have been identified. Users accustomed toInternet video are more critical than users that only watch TV. The under 35 year old subset amongthe available population is generally more satisfied with the adaptive system than the older subset.
� 2013 Elsevier B.V. All rights reserved.
1. Introduction
The ever-growing portfolio of video oriented services on theInternet threatens the overall performance of the network. In abest effort environment, the Scalable Video Coding (SVC) technol-ogy has been shown to be a prominent alternative to implementtruly adaptive and QoE aware streaming services. The possibilityto dynamically adapt contents to network conditions while maxi-mizing QoE is a must. In this sense, SVC has been the seed thathas led to the construction of efficient and resilient video services,from videoconferencing to VoD services.
These services are able to vary content features not only by pro-filing users but also by dynamically adapting to their current net-work performance. SVC content adaptation is complementary toQoS dynamic adaptation strategies such as those proposed in [1].
In the construction of adaptation decision taking strategies theadequate preferences on scalability decisions are still questioned[2]. Subjective studies are being carried out to support algorithmimplementations and seek optimized methods and metrics to al-low a QoE driven adaptation [3]. However, most subjective studies
are inherited from codec performance evaluations which evolvedto evaluate different layer qualities [4]. The work in [5] providesa good review of the state-of-the-art of subjective and objectivestudies with scalable streaming in general, including SVC, provid-ing general conclusions. In the light of the current state-of-the-art, many situations still lack subjective judgment.
Questions such as whether adaptive systems improve subjec-tive quality and in which situations or to what degree are still openissues. Tolerance and indifference thresholds with regard toadaptive systems are yet to be determined for each type of content,conditions or viewer category. The unanswered critical success fac-tors of adaptation decisions are important clues for the design andoptimization of Content Distribution Networks [6]. We have de-fined 5 different targets designed to answer matching critical suc-cess factors. Relation between targets and critical success factors isdetailed later in the paper.
While other works mostly focus on evaluating the quality of dif-ferent layers separately, we compare the performance of a com-plete adaptive system with the traditional, i.e. non-adaptive,approach in subjective terms. The subjective evaluation methodol-ogy used (using SCACJ, i.e. a type of Comparison Category Ratingmethod) allows us to test system comparative performance in dif-ferent situations, these ranging from bandwidth availability situa-tions to high constrained bandwidth situations. For all theseconditions, the subjective comparisons give valuable insight intothe construction and improvement of adaptive decision takingalgorithms.
A. Alvarez et al. / Computer Communications 36 (2013) 1608–1620 1609
Besides obtaining a valuable database of subjective scores, com-paring an adaptive system with a traditional streaming system,this work accomplishes several additional achievements. A meth-odology specific software tool was produced and made available.A large set of population was included in the study, up to 75 userswith ages ranging from 23 to 66. Results show that, as somewhatexpected, the adaptive system improves QoE as perceived by usersin the majority of situations. However several indifference or toler-ance regions have been detected. Under certain circumstances theadaptation algorithm adds no improvement over the standardfixed layer system, which fuels detractors of adaptive streaming[7]. Nevertheless, our subjective results show that users accus-tomed to Internet video are more critical than users that onlywatch TV. Experienced users evaluate more positively the adaptivesystem in most situations. Conversely, the young populationamong the available population are more satisfied with the adap-tive system than the older subset (>35), who profile themselvesas more indifferent towards adaptation.
The rest of the paper is organized as follows. Section 2 reviewsrelated works in the field of this study. Section 3 explains the moti-vation and outlines the challenges addressed in this work. Section 4provides a description of the subjective experiments performed,including details of hardware, software, content, population andmethodology aspects. Section 5 discusses results, according tothe targets identified in Section 3. Finally, concluding remarksand future work are summarized in Section 6.
2. Related work
Subjective evaluations are the key for capturing perceived qual-ity of new codecs, distribution systems or in general, the effect ofdegradations on video. However, SVC codec and scalability strate-gies have been the core of a few subjective studies.
Oelbaum et al. [8] present a subjective study with at least 20users and 12 different sequences. The methodologies they followedwere SSMM (Single Stimulus MultiMedia) and DSUR (Double Stim-ulus Unknown Reference). Results show that SVC offers a qualitycomparable to AVC quality with a slight increase on the overheadand the complexity of the decoder. Thus, SVC was projected to bethe first Scalable Video Coding standard accepted by the market.Niedermeier et al. [9] also carried out a subjective performanceanalysis of SVC codec and compared it with Xvid and AVC codecs.SAMVIQ (Subjective Assessment Methodology for Video QualityEvaluation) was the selected subjective methodology to assessthe subjective quality of 5 different source sequences with a pop-ulation of 21 people. Also using SAMVIQ, authors in [10] evaluated4 different source contents in subjective experiments with 15 par-ticipants comparing the performance of SVC with AVC in a mobilescenario. Instead, we compare exclusively SVC encoded sequenceswhich include adaptations in quality and temporal dimensions toevaluate more the adaptation decisions than the coding process.
Also in the mobile context, Eichhorn and Ni [11] present a sub-jective study investigating the effects of SVC multi-dimensionalscalability with 6 source sequences and 30 users. They adoptedthe DSCQS (Double Stimulus Continuous Quality Evaluation) meth-odology. As we have corroborated with our results, they state thatscaling preferences and selected scalability dimensions are contentdependant.
Lee et al. [12] performed a subjective evaluation of two scalablecodecs with SSCQS and the proposed Paired Comparison (PC)methodology with Paired Evaluation via Analysis of Reliability(PEAR), a new method to interpret results of paired comparisonstudies. They declare that Paired Comparison methodologies aresimpler when comparing different impairment types or scalabilitydimensions. In their study they include three types of scalability
and compare different scalability options for similar bitrates. Inthe first target of our study we include a similar comparison result-ing in preference towards adaptive strategy. They use 3 differentsequences that are evaluated by 16 users. Authors in [13] per-formed a subjective study with 28 users to evaluate the impactof network impairments and coding parameters on visual qualityusing SVC-based error-concealment. They adopted ACR (AbsoluteCategory Rating methodology).
Staelens et al. [14] have proposed a novel methodology to as-sess the impact of impairments on full length movies using SVCand MGS profile (2nd experiment). Their approach includes deliv-ering a DVD to up to 38 households, including more than 100 sub-jects. A questionnaire is taken after the viewing experience torecord the subjective opinions throughout the movie. We use aninline voting system instead, allowing users to vote after each shortsequence.
They also compare this methodology with a standard method-ology (SS ACR). Clear differences in the visibility of impairmentswere found between the artificial laboratory and natural homeenvironments. They state that experienced users of online videoare more tolerant towards visual quality drops in PCs. In our work,we observe that experienced users are more aware of the changesin quality dimension in general. Preference towards quality impair-ments against temporal impairments (or scalability) is detectedequally in their flow experiments or in our study following a stan-dard methodology.
The evaluation presented in this paper goes further than theprevious work, including an important set of contributions. Wehave included an explicit comparison of an adaptive system withthe traditional, i.e. non-adaptive, approach in subjective terms.The selected cases range from bandwidth availability situationsto high constrained bandwidth situations, while the majority ofthe adaptation evaluations were preformed in congested scenariosexclusively. We have included in the experiment a large population(far more than the minimum of 16 participants recommended by[15]) with a wider context, regarding age and video experience.And finally, we have defined an evaluation method where we usedirect answers to short, simple questions, classified as targets.
3. Adaptive streaming services open challenges
Internet video services are very sensitive to situations of con-gestion or losses. For that reason it is necessary to have a systemto adapt the contents format to the transmission conditions [16].Further, adapting contents to a real-time update of bandwidthavailability is a key feature. SVC is among the scalable coding tech-nologies that have made this idea possible. SVC in particular en-ables spatial, temporal and quality scalability, allowing theadaptation of the transmitted video to the available bandwidth.The combination of SVC technology with network congestion esti-mation algorithms permits to build an adaptive system which isable to suit the media content to network conditions at eachmoment.
When a congestion situation is detected, any adaptive system isexpected to decrease the bitrate video transmission. In a layeredtechnology such as SVC, that means enhancement layers are re-moved. On the other hand, when there is no congestion, the bitratemay be increased by increasing the number of layers that are sentto the client. The adaptation decision taking algorithm and its per-formance are crucial issues, as more alternatives appear and allseek to maximize QoE.
Evaluating the QoE of different adaptation decisions with re-spect to a non-adaptive streaming service under varied conditionsis the aim of this study. In the kind of comparisons performed inthis study, the non-adaptive system maintains the same layer for

Fig. 1. Modified categories in CMOS scale.
Fig. 2. Testing procedure.
1610 A. Alvarez et al. / Computer Communications 36 (2013) 1608–1620
the entire sequence length while the adaptive system reacts uponnetwork conditions. After an estimation period, the system variesstream layers up or down. The results of this study serves as a sub-jective database to calibrate thresholds and parameters to buildbetter QoE driven adaptation decision taking algorithms.
Different targets are defined to evaluate matching identifiedcritical success factors related with adaptive systems. Each targetanalyzes a change in a single scalability dimension (temporal orquality). Generated test material is instrumented to answer thekey questions grouped by the targets previously described. Differ-ent source content has been processed to obtain up to 45 differentpaired sequences, non-adaptive (reference) and adaptive versionsfor the same case study. All sequences are shown to the entire pop-ulation set. Table 1 summarizes the targets and critical success fac-tors. Later, a detailed description of each target is provided.
Target I: In order to assess the best direction that any adaptationshould take when facing high degradation in the network, we in-tend to evaluate in which dimension, quality or temporal, thechange produces the best results in subjective terms. Whenchanges are small, it has been documented that it is preferable todecrease quality layers [5] because small changes in quality areless appreciable than reducing the frame rate by half (the mini-mum that can be reduced), although both resulting in the same bi-trate reduction. However in the presence of high congestion, theimpact of the jump in several layers at once (or in a very shorttime) to compensate the congestion, should be evaluated.
Target II: Some adaptation algorithms rely on the losses thresh-old to trigger an adaptation event. We intend to assess the thresh-old inferred from subjective results when a reduction in a temporallayer is offered as an alternative. The subjective threshold definesthe tolerance of viewers against the packet losses with regard toa temporarily adapted sequence (and therefore without packetlosses).
Target III: Performing temporal adaptation is seen as a poor ap-proach regarding QoE. This target seeks to assess what users wouldchoose first between a sequence with a high degree of networkimpairments and a sequence which has been severely adapted inthe temporal dimension.
Target IV: Adaptive services offer the possibility to increase thenumber of layers for those users experimenting sufficient band-width availability. With this target we will evaluate whether add-ing enhancement quality layers when bandwidth availability isdetected is indeed preferable to maintaining the initial quality le-vel. Results might be content dependant and vary with userexperience.
Target V: As happens with quality dimension, adaptive systemsconceive augmenting temporal layers when availability is de-tected. This target has been built to evaluate user’s perception ofincreasing temporal levels dynamically when compared to a non-adaptive system maintaining a constant frame rate.
Table 1Pairing of targets and critical success factors.
Target Type ofscenario
Type of adaptation Number ofsequences
Critical success f
I Congestedscenario
Decreasing quality layersor temporal layers
6 Assess the best dwhen facing hig
II Congestedscenario
Decreasing temporallayers
16 Assess the losses
III Congestedscenario
Decreasing temporallayers
6 Assess what useimpairments and
IV Non-congestedscenario
Increasing quality layers 8 Evaluate whetheindeed preferabl
V Non-congestedscenario
Increasing temporallayers
12 Evaluate user’s padaptive system
Several models of adaptive systems have been proposed in theliterature [17–19]. Although all of them vary in many aspects, theyall share the same attitude towards network availability, decreasevideo layers when there is availability/shortage of network re-sources. The system described in [20] makes estimations of theavailable bandwidth every five seconds. The server updates thetemporal or quality level transmitted to each client in terms of net-work resources. Authors in [20] include trials with different inter-val durations for network adaptation. A five seconds interval wasconsidered right to avoid unnecessary adaptations reacting to cir-cumstantial changes in network capacity and enough to followlong term capacity variations. This system has been selected toserve as a model of an adaptive system.
4. Subjective experiments
4.1. Subjective methodology
ITU-T recommends a pool of methodologies for the subjectiveevaluation of video and multimedia systems [15,21]. Methodolo-gies can be classified according to the configuration of the experi-ment, whether a reference is directly advised, implicitly added ornot used. Another classification refers to the way stimulus is pre-sented. Single Stimulus experiments normally include only
actor
irection (quality or temporal) that any adaptation algorithm should decreaseh degradation in the network
threshold to trigger an adaptation event
rs would choose first between a sequence with a high degree of networka sequence which has been severely adapted in the temporal dimension
r adding enhancement quality layers when bandwidth availability is detected ise to maintaining the initial quality level
erception of increasing temporal levels dynamically when compared to a non-maintaining a constant frame rate
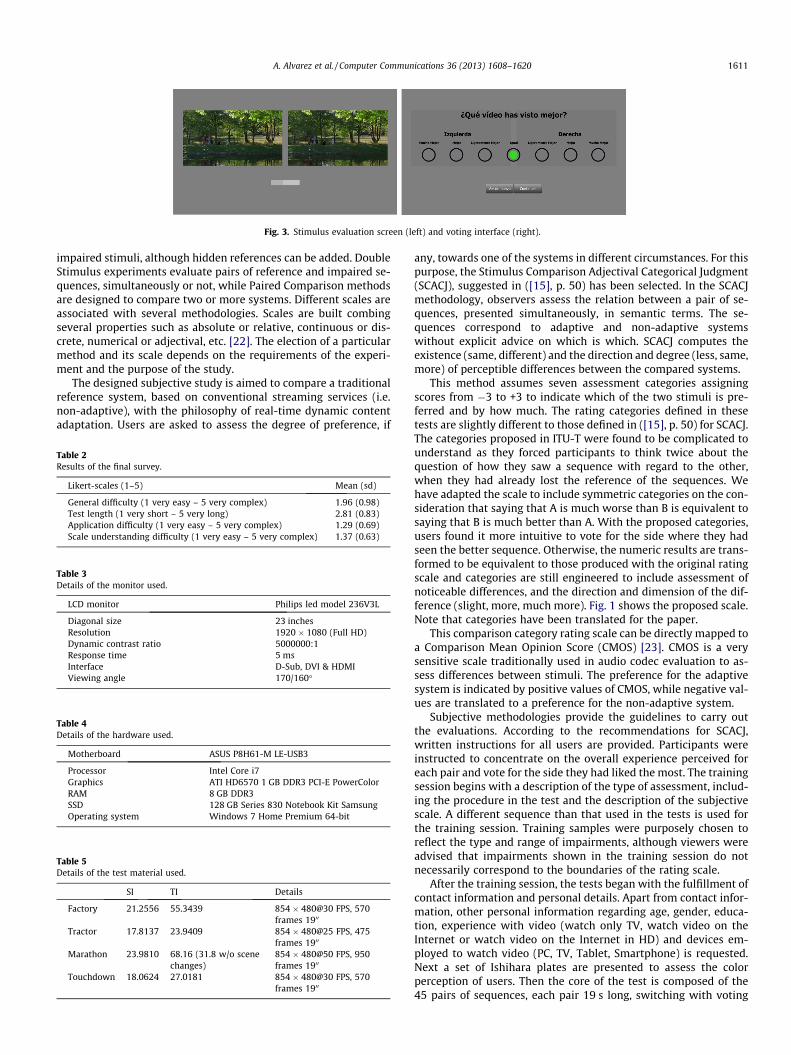
Fig. 3. Stimulus evaluation screen (left) and voting interface (right).
A. Alvarez et al. / Computer Communications 36 (2013) 1608–1620 1611
impaired stimuli, although hidden references can be added. DoubleStimulus experiments evaluate pairs of reference and impaired se-quences, simultaneously or not, while Paired Comparison methodsare designed to compare two or more systems. Different scales areassociated with several methodologies. Scales are built combingseveral properties such as absolute or relative, continuous or dis-crete, numerical or adjectival, etc. [22]. The election of a particularmethod and its scale depends on the requirements of the experi-ment and the purpose of the study.
The designed subjective study is aimed to compare a traditionalreference system, based on conventional streaming services (i.e.non-adaptive), with the philosophy of real-time dynamic contentadaptation. Users are asked to assess the degree of preference, if
Table 2Results of the final survey.
Likert-scales (1–5) Mean (sd)
General difficulty (1 very easy – 5 very complex) 1.96 (0.98)Test length (1 very short – 5 very long) 2.81 (0.83)Application difficulty (1 very easy – 5 very complex) 1.29 (0.69)Scale understanding difficulty (1 very easy – 5 very complex) 1.37 (0.63)
Table 3Details of the monitor used.
LCD monitor Philips led model 236V3L
Diagonal size 23 inchesResolution 1920 � 1080 (Full HD)Dynamic contrast ratio 5000000:1Response time 5 msInterface D-Sub, DVI & HDMIViewing angle 170/160�
Table 4Details of the hardware used.
Motherboard ASUS P8H61-M LE-USB3
Processor Intel Core i7Graphics ATI HD6570 1 GB DDR3 PCI-E PowerColorRAM 8 GB DDR3SSD 128 GB Series 830 Notebook Kit SamsungOperating system Windows 7 Home Premium 64-bit
Table 5Details of the test material used.
SI TI Details
Factory 21.2556 55.3439 854 � 480@30 FPS, 570frames 1900
Tractor 17.8137 23.9409 854 � 480@25 FPS, 475frames 1900
Marathon 23.9810 68.16 (31.8 w/o scenechanges)
854 � 480@50 FPS, 950frames 1900
Touchdown 18.0624 27.0181 854 � 480@30 FPS, 570frames 1900
any, towards one of the systems in different circumstances. For thispurpose, the Stimulus Comparison Adjectival Categorical Judgment(SCACJ), suggested in ([15], p. 50) has been selected. In the SCACJmethodology, observers assess the relation between a pair of se-quences, presented simultaneously, in semantic terms. The se-quences correspond to adaptive and non-adaptive systemswithout explicit advice on which is which. SCACJ computes theexistence (same, different) and the direction and degree (less, same,more) of perceptible differences between the compared systems.
This method assumes seven assessment categories assigningscores from �3 to +3 to indicate which of the two stimuli is pre-ferred and by how much. The rating categories defined in thesetests are slightly different to those defined in ([15], p. 50) for SCACJ.The categories proposed in ITU-T were found to be complicated tounderstand as they forced participants to think twice about thequestion of how they saw a sequence with regard to the other,when they had already lost the reference of the sequences. Wehave adapted the scale to include symmetric categories on the con-sideration that saying that A is much worse than B is equivalent tosaying that B is much better than A. With the proposed categories,users found it more intuitive to vote for the side where they hadseen the better sequence. Otherwise, the numeric results are trans-formed to be equivalent to those produced with the original ratingscale and categories are still engineered to include assessment ofnoticeable differences, and the direction and dimension of the dif-ference (slight, more, much more). Fig. 1 shows the proposed scale.Note that categories have been translated for the paper.
This comparison category rating scale can be directly mapped toa Comparison Mean Opinion Score (CMOS) [23]. CMOS is a verysensitive scale traditionally used in audio codec evaluation to as-sess differences between stimuli. The preference for the adaptivesystem is indicated by positive values of CMOS, while negative val-ues are translated to a preference for the non-adaptive system.
Subjective methodologies provide the guidelines to carry outthe evaluations. According to the recommendations for SCACJ,written instructions for all users are provided. Participants wereinstructed to concentrate on the overall experience perceived foreach pair and vote for the side they had liked the most. The trainingsession begins with a description of the type of assessment, includ-ing the procedure in the test and the description of the subjectivescale. A different sequence than that used in the tests is used forthe training session. Training samples were purposely chosen toreflect the type and range of impairments, although viewers wereadvised that impairments shown in the training session do notnecessarily correspond to the boundaries of the rating scale.
After the training session, the tests began with the fulfillment ofcontact information and personal details. Apart from contact infor-mation, other personal information regarding age, gender, educa-tion, experience with video (watch only TV, watch video on theInternet or watch video on the Internet in HD) and devices em-ployed to watch video (PC, TV, Tablet, Smartphone) is requested.Next a set of Ishihara plates are presented to assess the colorperception of users. Then the core of the test is composed of the45 pairs of sequences, each pair 19 s long, switching with voting

1612 A. Alvarez et al. / Computer Communications 36 (2013) 1608–1620
periods as depicted in Fig. 2. Users can watch the stimulus as manytimes as desired.
To avoid the effects of learning curves, tiredness influencing theresults always in the same sequences, the order of the pairs foreach session is randomized. Also the position of the reference onthe screen for each pair is randomized.
Fig. 4. Screen captures of test material, from the top le
Fig. 5. Summary of CMOS re
Fig. 6. Summary of CMOS results
After finishing the sessions, candidates are surveyed to assessgeneral difficulty, application difficulty, voting scale difficulty, testlength as well as comment on known visual impairments. Thesurvey has 4 Likert-scales, results are summarized in Table 2. Ingeneral, difficulty perception was low while total test length wasslightly worse. The experiment consisted of a single session with
ft corner, tractor, factory, marathon and touchdown.
sults grouped by target.
grouped by target and age.
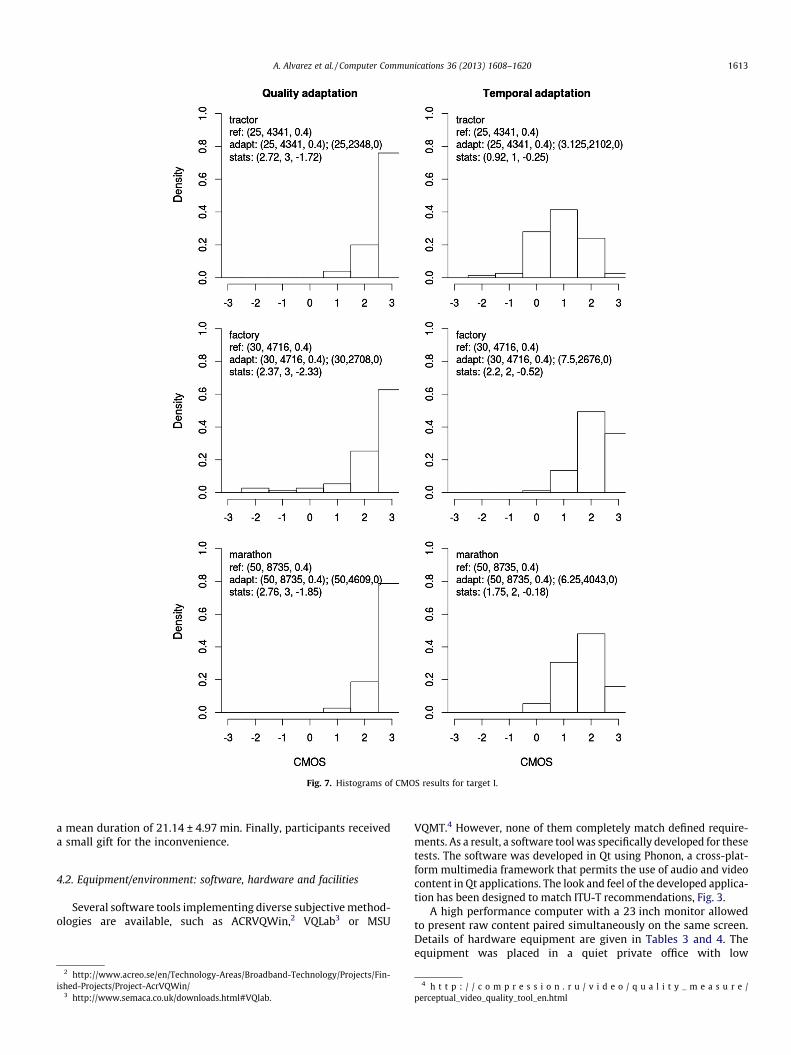
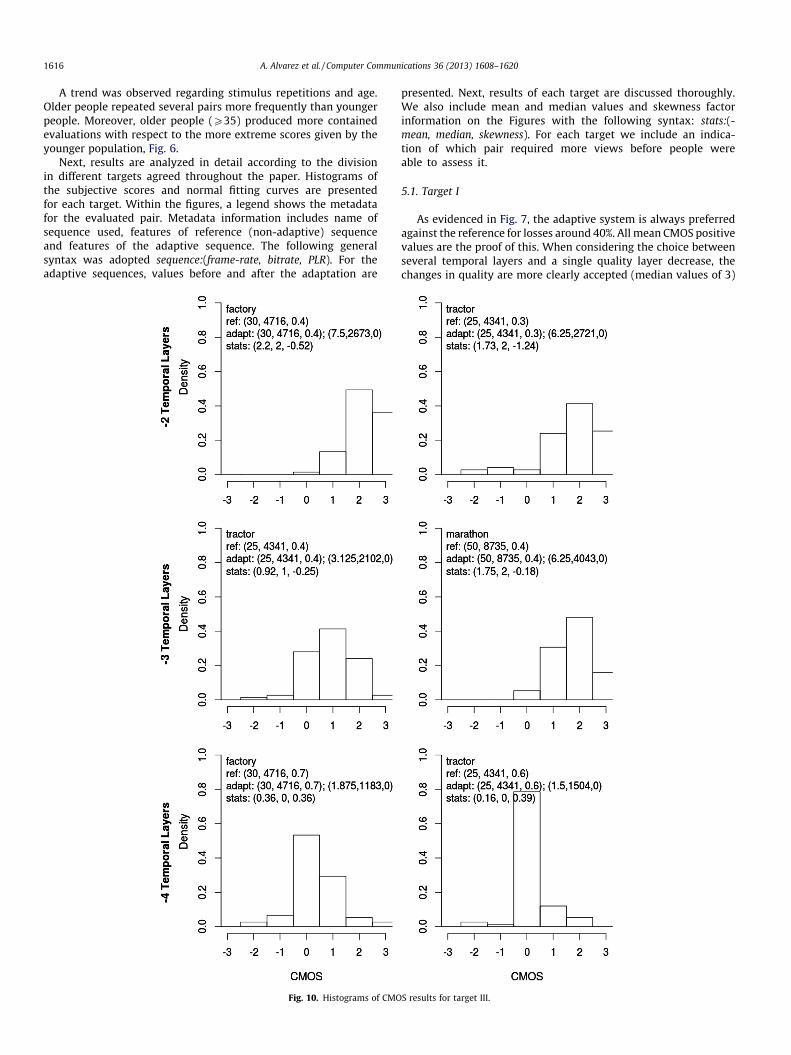
Fig. 7. Histograms of CMOS results for target I.
A. Alvarez et al. / Computer Communications 36 (2013) 1608–1620 1613
a mean duration of 21.14 ± 4.97 min. Finally, participants receiveda small gift for the inconvenience.
4.2. Equipment/environment: software, hardware and facilities
Several software tools implementing diverse subjective method-ologies are available, such as ACRVQWin,2 VQLab3 or MSU
2 http://www.acreo.se/en/Technology-Areas/Broadband-Technology/Projects/Fin-ished-Projects/Project-AcrVQWin/
3 http://www.semaca.co.uk/downloads.html#VQlab.
VQMT.4 However, none of them completely match defined require-ments. As a result, a software tool was specifically developed for thesetests. The software was developed in Qt using Phonon, a cross-plat-form multimedia framework that permits the use of audio and videocontent in Qt applications. The look and feel of the developed applica-tion has been designed to match ITU-T recommendations, Fig. 3.
A high performance computer with a 23 inch monitor allowedto present raw content paired simultaneously on the same screen.Details of hardware equipment are given in Tables 3 and 4. Theequipment was placed in a quiet private office with low
4 h t t p : / / c o m p r e s s i o n . r u / v i d e o / q u a l i t y _ m e a s u r e /perceptual_video_quality_tool_en.html
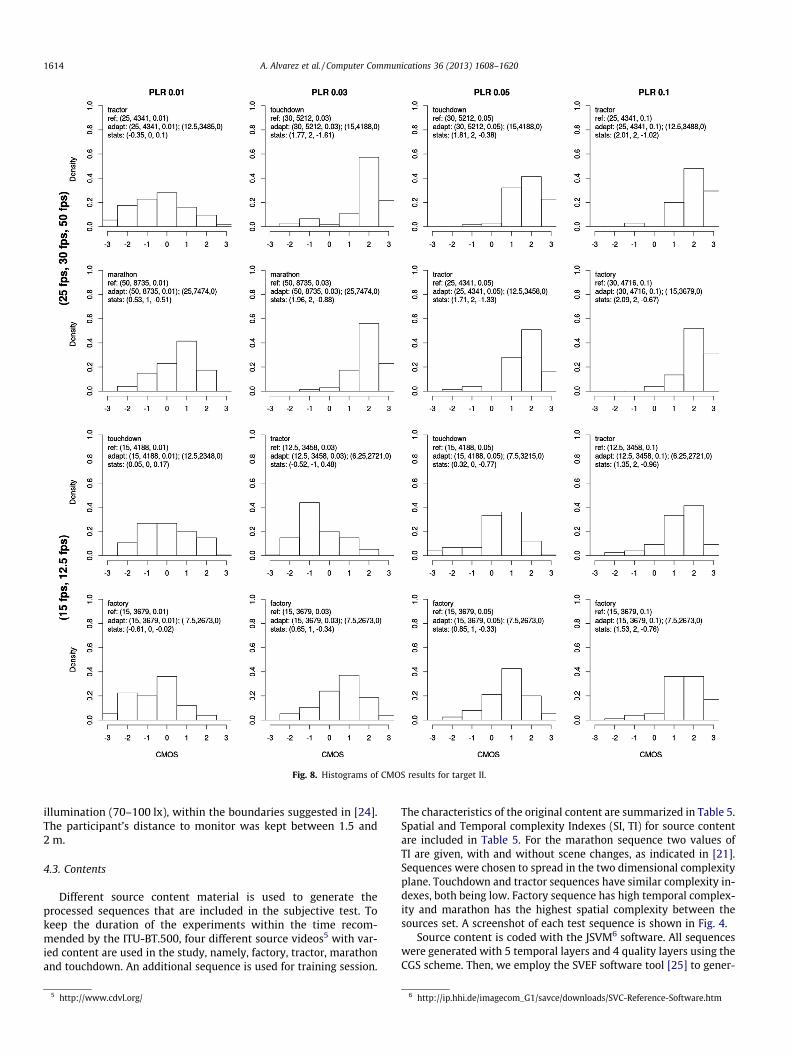
Fig. 8. Histograms of CMOS results for target II.
1614 A. Alvarez et al. / Computer Communications 36 (2013) 1608–1620
illumination (70–100 lx), within the boundaries suggested in [24].The participant’s distance to monitor was kept between 1.5 and2 m.
4.3. Contents
Different source content material is used to generate theprocessed sequences that are included in the subjective test. Tokeep the duration of the experiments within the time recom-mended by the ITU-BT.500, four different source videos5 with var-ied content are used in the study, namely, factory, tractor, marathonand touchdown. An additional sequence is used for training session.
5 http://www.cdvl.org/
The characteristics of the original content are summarized in Table 5.Spatial and Temporal complexity Indexes (SI, TI) for source contentare included in Table 5. For the marathon sequence two values ofTI are given, with and without scene changes, as indicated in [21].Sequences were chosen to spread in the two dimensional complexityplane. Touchdown and tractor sequences have similar complexity in-dexes, both being low. Factory sequence has high temporal complex-ity and marathon has the highest spatial complexity between thesources set. A screenshot of each test sequence is shown in Fig. 4.
Source content is coded with the JSVM6 software. All sequenceswere generated with 5 temporal layers and 4 quality layers using theCGS scheme. Then, we employ the SVEF software tool [25] to gener-
6 http://ip.hhi.de/imagecom_G1/savce/downloads/SVC-Reference-Software.htm
A. Alvarez et al. / Computer Communications 36 (2013) 1608–1620 1615
ate the processed sequences. We have modified the transmissionemulation subsystem of SVEF to include a loss model representedby a simple Bernoulli process with loss probability as an inputparameter [26].As we are modeling the exact moment of adaptation,after the 5 s evaluation period, we assume that the sequence underevaluation is already in a loss state (of the two states in a Gilbertmodel). In this situation, a simple Bernoulli model would be suffi-cient to model the losses in the degraded state, assuming that theloss events inside this state are uncorrelated.
The transmission emulation subsystem imposes losses as indi-cated by the Bernouilli trace to individual packets. In the NALrebuilding process, the NAL affected by one or more packet lossesis discarded. Resulting sequences are decoded with JSVM tools toobtain the raw sequence that will be used in the tests.
The processed sequences were generated considering only com-binations with one type of scalability, either temporal or quality.Each pair of sequences included in the stimulus evaluation is com-posed of a non-adaptive sequence and an adaptive sequence. In theadaptive sequence, the necessary adaptation is performed after 5 s.Thus, during the first 5 s, both sequences are equal. The final 45 se-quences included in the study were chosen according to the targetsformulated in Section 3. Some of the generated sequences serve inseveral targets.
Target I: 6 different pairs of sequences cover this target. Pairsare coupled to assess the difference between decreasing a singlequality layer or several temporal layers at once, for the samecontent.
Target II: For loss threshold detection several pairs compare thenon-adaptive sequence with a sequence adapted reducing a tem-poral layer for different Packet Loss Ratios (PLR) of 1%, 3%, 5%and 10%. The quality level is kept high to avoid its influence inthe results. 16 different sequences were used to evaluate thistarget.
Target III: For this target, we need to assess the difference ofdecreasing several temporal layers at once with a reference whichtries to maintain all layers but with losses throughout its length. Inthis test quality was maintained high. 6 different sequences wereused to evaluate this target.
Target IV: We select pairs where adaptive sequences increasequality levels, between 1 and 3 quality layers while the non-adap-tive sequences are kept at the original quality layer. A high tempo-ral layer is maintained. 8 different sequences were used to evaluatethis target.
Target V: Pairs selected include adaptive sequences which in-crease from 1 to 4 temporal layers while the non-adaptive se-quence is kept at the original temporal layer. Again, the quality ishigh to avoid its influence in the scoring.12 different sequenceswere used to evaluate this target.
For all the targets, selected sequences were chosen to spread inthe range of SI, TI available. In total, 14 pairs of sequences of tractor,8 pairs of touchdown, 13 pairs of factory and 9 of marathon wereused. Since we intended to avoid participant fatigue in the exper-iment, we limited the number of sequences of each one, thus weused more sequences for the most complex targets and less forthe simplest.
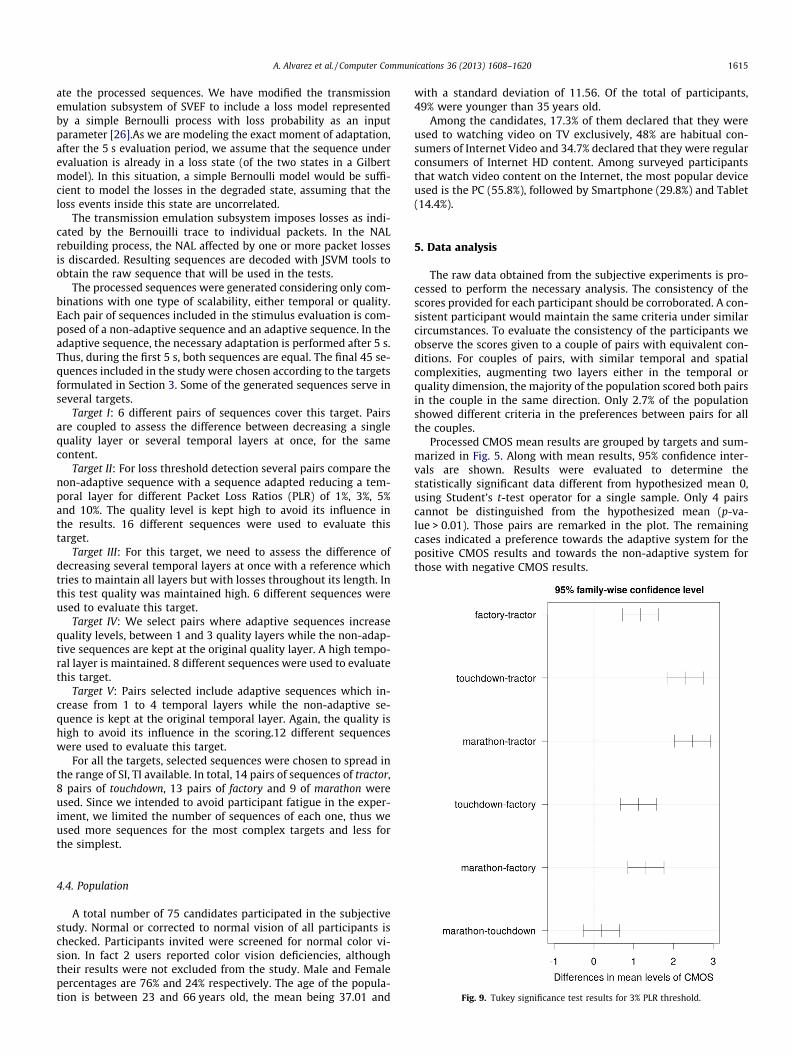
Fig. 9. Tukey significance test results for 3% PLR threshold.
4.4. Population
A total number of 75 candidates participated in the subjectivestudy. Normal or corrected to normal vision of all participants ischecked. Participants invited were screened for normal color vi-sion. In fact 2 users reported color vision deficiencies, althoughtheir results were not excluded from the study. Male and Femalepercentages are 76% and 24% respectively. The age of the popula-tion is between 23 and 66 years old, the mean being 37.01 and
with a standard deviation of 11.56. Of the total of participants,49% were younger than 35 years old.
Among the candidates, 17.3% of them declared that they wereused to watching video on TV exclusively, 48% are habitual con-sumers of Internet Video and 34.7% declared that they were regularconsumers of Internet HD content. Among surveyed participantsthat watch video content on the Internet, the most popular deviceused is the PC (55.8%), followed by Smartphone (29.8%) and Tablet(14.4%).
5. Data analysis
The raw data obtained from the subjective experiments is pro-cessed to perform the necessary analysis. The consistency of thescores provided for each participant should be corroborated. A con-sistent participant would maintain the same criteria under similarcircumstances. To evaluate the consistency of the participants weobserve the scores given to a couple of pairs with equivalent con-ditions. For couples of pairs, with similar temporal and spatialcomplexities, augmenting two layers either in the temporal orquality dimension, the majority of the population scored both pairsin the couple in the same direction. Only 2.7% of the populationshowed different criteria in the preferences between pairs for allthe couples.
Processed CMOS mean results are grouped by targets and sum-marized in Fig. 5. Along with mean results, 95% confidence inter-vals are shown. Results were evaluated to determine thestatistically significant data different from hypothesized mean 0,using Student’s t-test operator for a single sample. Only 4 pairscannot be distinguished from the hypothesized mean (p-va-lue > 0.01). Those pairs are remarked in the plot. The remainingcases indicated a preference towards the adaptive system for thepositive CMOS results and towards the non-adaptive system forthose with negative CMOS results.
1616 A. Alvarez et al. / Computer Communications 36 (2013) 1608–1620
A trend was observed regarding stimulus repetitions and age.Older people repeated several pairs more frequently than youngerpeople. Moreover, older people (P35) produced more containedevaluations with respect to the more extreme scores given by theyounger population, Fig. 6.
Next, results are analyzed in detail according to the divisionin different targets agreed throughout the paper. Histograms ofthe subjective scores and normal fitting curves are presentedfor each target. Within the figures, a legend shows the metadatafor the evaluated pair. Metadata information includes name ofsequence used, features of reference (non-adaptive) sequenceand features of the adaptive sequence. The following generalsyntax was adopted sequence:(frame-rate, bitrate, PLR). For theadaptive sequences, values before and after the adaptation are
Fig. 10. Histograms of CMO
presented. Next, results of each target are discussed thoroughly.We also include mean and median values and skewness factorinformation on the Figures with the following syntax: stats:(-mean, median, skewness). For each target we include an indica-tion of which pair required more views before people wereable to assess it.
5.1. Target I
As evidenced in Fig. 7, the adaptive system is always preferredagainst the reference for losses around 40%. All mean CMOS positivevalues are the proof of this. When considering the choice betweenseveral temporal layers and a single quality layer decrease, thechanges in quality are more clearly accepted (median values of 3)
S results for target III.
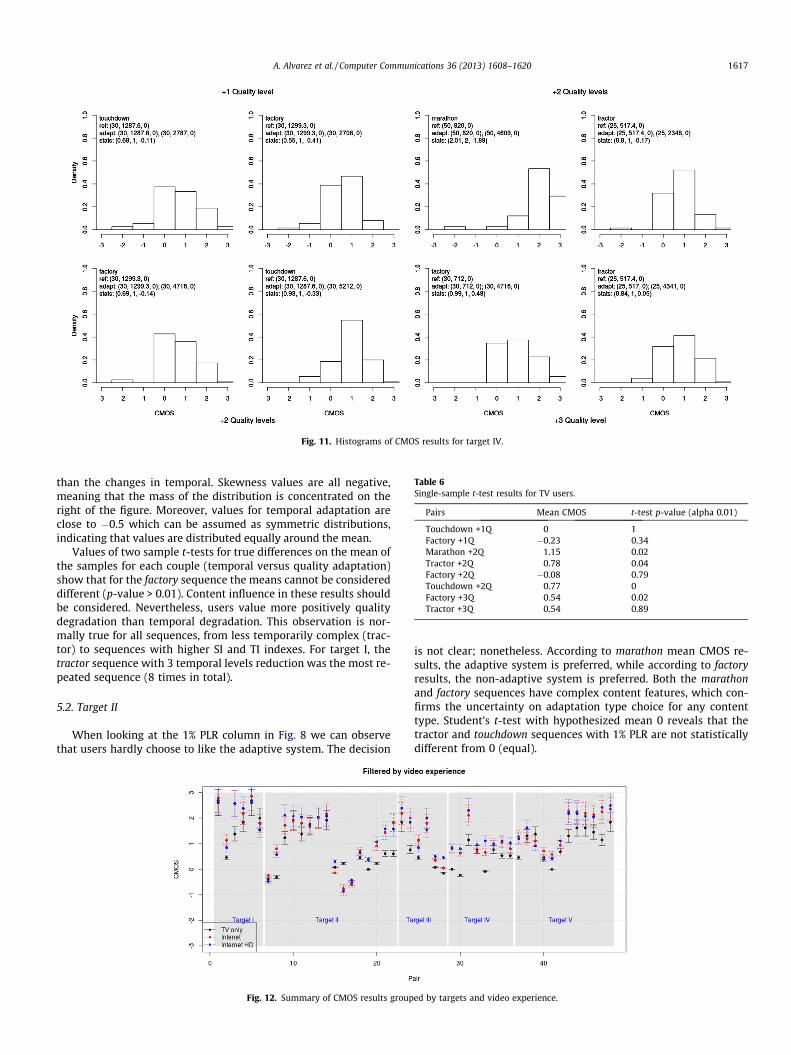
Fig. 11. Histograms of CMOS results for target IV.
Table 6Single-sample t-test results for TV users.
Pairs Mean CMOS t-test p-value (alpha 0.01)
Touchdown +1Q 0 1Factory +1Q �0.23 0.34Marathon +2Q 1.15 0.02Tractor +2Q 0.78 0.04Factory +2Q �0.08 0.79Touchdown +2Q 0.77 0Factory +3Q 0.54 0.02Tractor +3Q 0.54 0.89
A. Alvarez et al. / Computer Communications 36 (2013) 1608–1620 1617
than the changes in temporal. Skewness values are all negative,meaning that the mass of the distribution is concentrated on theright of the figure. Moreover, values for temporal adaptation areclose to �0.5 which can be assumed as symmetric distributions,indicating that values are distributed equally around the mean.
Values of two sample t-tests for true differences on the mean ofthe samples for each couple (temporal versus quality adaptation)show that for the factory sequence the means cannot be considereddifferent (p-value > 0.01). Content influence in these results shouldbe considered. Nevertheless, users value more positively qualitydegradation than temporal degradation. This observation is nor-mally true for all sequences, from less temporarily complex (trac-tor) to sequences with higher SI and TI indexes. For target I, thetractor sequence with 3 temporal levels reduction was the most re-peated sequence (8 times in total).
5.2. Target II
When looking at the 1% PLR column in Fig. 8 we can observethat users hardly choose to like the adaptive system. The decision
Fig. 12. Summary of CMOS results group
is not clear; nonetheless. According to marathon mean CMOS re-sults, the adaptive system is preferred, while according to factoryresults, the non-adaptive system is preferred. Both the marathonand factory sequences have complex content features, which con-firms the uncertainty on adaptation type choice for any contenttype. Student’s t-test with hypothesized mean 0 reveals that thetractor and touchdown sequences with 1% PLR are not statisticallydifferent from 0 (equal).
ed by targets and video experience.
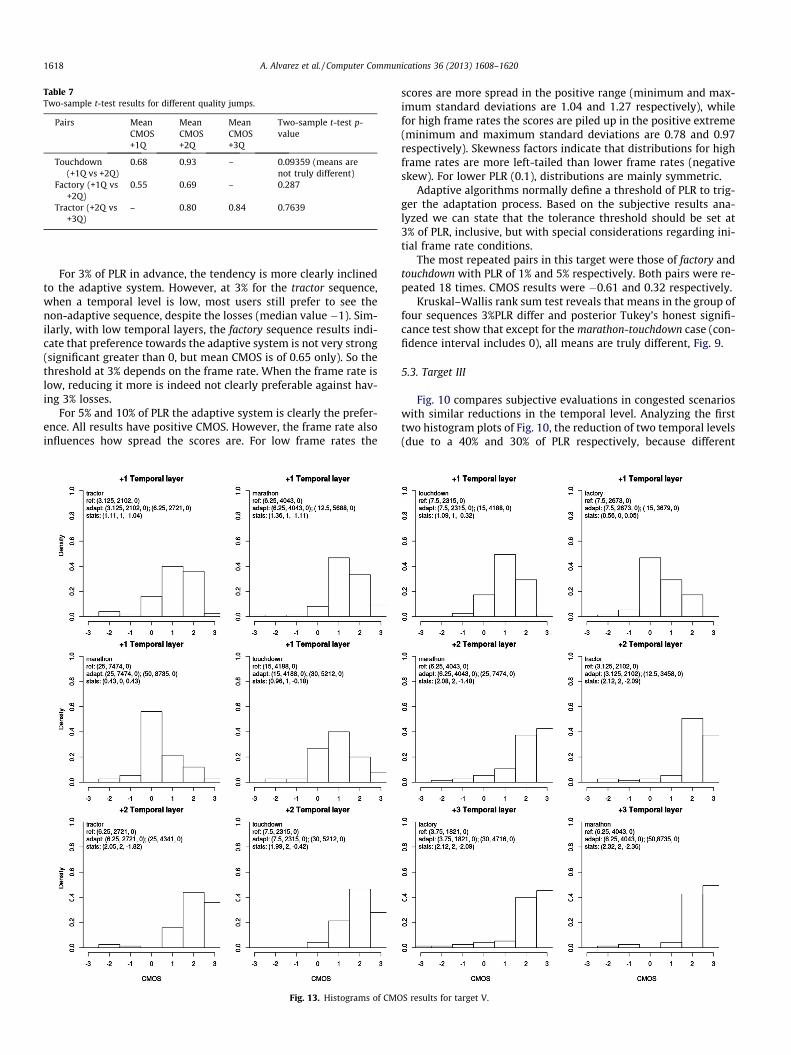
Table 7Two-sample t-test results for different quality jumps.
Pairs MeanCMOS+1Q
MeanCMOS+2Q
MeanCMOS+3Q
Two-sample t-test p-value
Touchdown(+1Q vs +2Q)
0.68 0.93 – 0.09359 (means arenot truly different)
Factory (+1Q vs+2Q)
0.55 0.69 – 0.287
Tractor (+2Q vs+3Q)
– 0.80 0.84 0.7639
1618 A. Alvarez et al. / Computer Communications 36 (2013) 1608–1620
For 3% of PLR in advance, the tendency is more clearly inclinedto the adaptive system. However, at 3% for the tractor sequence,when a temporal level is low, most users still prefer to see thenon-adaptive sequence, despite the losses (median value �1). Sim-ilarly, with low temporal layers, the factory sequence results indi-cate that preference towards the adaptive system is not very strong(significant greater than 0, but mean CMOS is of 0.65 only). So thethreshold at 3% depends on the frame rate. When the frame rate islow, reducing it more is indeed not clearly preferable against hav-ing 3% losses.
For 5% and 10% of PLR the adaptive system is clearly the prefer-ence. All results have positive CMOS. However, the frame rate alsoinfluences how spread the scores are. For low frame rates the
Fig. 13. Histograms of CMO
scores are more spread in the positive range (minimum and max-imum standard deviations are 1.04 and 1.27 respectively), whilefor high frame rates the scores are piled up in the positive extreme(minimum and maximum standard deviations are 0.78 and 0.97respectively). Skewness factors indicate that distributions for highframe rates are more left-tailed than lower frame rates (negativeskew). For lower PLR (0.1), distributions are mainly symmetric.
Adaptive algorithms normally define a threshold of PLR to trig-ger the adaptation process. Based on the subjective results ana-lyzed we can state that the tolerance threshold should be set at3% of PLR, inclusive, but with special considerations regarding ini-tial frame rate conditions.
The most repeated pairs in this target were those of factory andtouchdown with PLR of 1% and 5% respectively. Both pairs were re-peated 18 times. CMOS results were �0.61 and 0.32 respectively.
Kruskal–Wallis rank sum test reveals that means in the group offour sequences 3%PLR differ and posterior Tukey’s honest signifi-cance test show that except for the marathon-touchdown case (con-fidence interval includes 0), all means are truly different, Fig. 9.
5.3. Target III
Fig. 10 compares subjective evaluations in congested scenarioswith similar reductions in the temporal level. Analyzing the firsttwo histogram plots of Fig. 10, the reduction of two temporal levels(due to a 40% and 30% of PLR respectively, because different
S results for target V.

A. Alvarez et al. / Computer Communications 36 (2013) 1608–1620 1619
contents reach the same adaptation level with different loss prob-abilities) is preferred against the non-adaptive system for bothsource sequences evaluated. Skewness factors indicate that thetractor sequence is highly left-tailed, concentrating mass CMOSscores on the positive side of the distribution. In the cases with 3temporal layers reduction (Fig. 10 center) the adaptive system isstill preferred, as mean positive values of CMOS indicate. However,if several temporal layers are decreased at once, due to heavylosses, participants do not really appreciate any advantage inadapting with respect to suffer severe losses. Tests with hypothe-sized mean 0 indicate that the last case (Fig. 10 bottom right) isnot statistically different from 0. Note that these results are condi-tioned by the error concealment and temporal concealment tech-niques used (frame copy technique).
For target 3 the most repeated pair was the last case in Fig. 10,i.e. the tractor sequence. It was repeated 12 times.
5.4. Target IV
According to the results in Fig. 11, in general terms, the prefer-ence is slightly inclined towards the adaptive system. However themajority of users vote between 0 and 1, thus the difference,although statistically different from the hypothesized mean 0, isnot very significant. Skewness factors show that distributions canbe considered symmetric. The cost of increasing quality is disput-able, at least. The cost of duplicating the bitrate for the video mightnot be justified with only a slight increase in QoE. The only excep-tion is the marathon pair (third histogram counting from upperleft) which reveals to be more sensitive to quality changes (medianvalue of 2). This case has a strong left-tailed distribution of scores.It should be noted that the marathon sequence has the highest spa-tial and temporal complexity among the source content set usedand therefore benefits more from the quality enhancements thanthe rest of the sequences.
Participants with experience in Internet video (Standard Defini-tion or High quality Definition) detect more easily and value morepositively quality differences than candidates with TV experienceonly, Fig. 12. For the latter participants, CMOS and p-values ofthe t-test with the hypothesized mean 0 are presented in Table 6.As seen in the values presented, all cases but one are not statisti-cally different from 0 for a significance level of 0.01. The onlyexception corresponds to the touchdown sequence with a two qual-ity layer increase. Furthermore, this pair was the most repeatedpair of this target (14 times).
Now we perform t-test analysis for the same sequence to testwhether means truly differ between increasing 1 or 2 quality lay-ers. As demonstrated with two sample t-tests comparing the samesequence for different quality jumps, the means are not statisti-cally different, Table 7.
5.5. Target V
When increasing temporal levels, the adaptive system is alwayspreferred. Mean CMOS values obtained for the whole populationare always positive and the significance tests reveal that they arestatistically different from mean 0. The CMOS scores grow withthe number of layers increased by the adaptive system, and pro-gressively pile up towards the positive side of the histograms,Fig. 13. The skewness factor calculated for these sequences indi-cates that most of them are highly left-tailed, concentrating mostof CMOS scores to the right of the mean. Exceptions found havesmall positive skewness factors which can be accepted as fairlysymmetric distributions.
For temporal dimension adaptations, participants with experi-ence in TV exclusively, also follow the general trend, only differingin isolated pairs where the mean is not statistically different from 0
for a 0.01 significance level. These pairs are associated with a singlelayer change in the adaptive system.
6. Conclusions and future work
In this paper we have performed extensive subjective testsincluding a varied 75 participant population. An SCACJ methodol-ogy has been thoroughly followed. A software tool for the subjec-tive evaluation has been developed. The 45 different sequencedatabase and associated subjective scores are available for down-load (on request). The subjective tests have allowed us to establishconclusions for each of the critical success factors planned.
Using adaptive systems usually improves perceived quality.When there is available bandwidth in the network, the preferenceis clearly inclined towards the adaptive system. With high networklosses the adaptive systems is perceived to have a better qualitywith respect to fixed layer streaming. However, when the networkhas low congestion the trend is not that clear and may even be in-verted. With low PLR the reference lossy sequence might be pre-ferred to the version that has been adapted to avoid losses.Moreover, the population seems to like more reduction on qualitythan reduction on temporal layers.
Regarding video experience, users that normally only use TV va-lue less positively the adaptive system than other experiencedInternet users. Conversely, young people (<35) show less moderatesubjective scores than the rest. Older people (>35) normally givemore values close to indifference between adaptive or non-adap-tive systems (CMOS = 0).
The objective conclusions of the evaluation, the participant sur-veys and the process itself have opened new research areas we aregoing to face as future work. One of them is to focus on the exten-sion of the evaluation to include new sequences, more participantsand more adaptation situations to reinforce the results and theconclusions we gathered. The second is to define new experimentsituations working with longer sequences and a more complexadaptation process, for instance using Markovian models for pack-et loss generation.
We will also work on several topics suggested by the partici-pants. They were surveyed about possible improvement to subjec-tive tests they would value most. The majority agree on keepingthe duration even more contained, including a larger variety ofsource content and the possibility to add sound or music to makeit more entertaining.
Our final intention of the current and all the future work is thedefinition of a complete benchmark to be used in the user experi-ence evaluation of video adaptation technology.
Appendix A. Supplementary data
Supplementary data associated with this article can be found, inthe online version, at http://dx.doi.org/10.1016/j.comcom.2013.07.005.
References
[1] L. Cruvinel, T. Vazão, Improving performance for multimedia traffic withdistributed dynamic QoS adaptation, Computer Communications 34 (10)(2011) 1222–1234.
[2] N. Cranley, P. Perry, L. Murphy, User perception of adapting video quality,International Journal of Human-Computer Studies 64 (8) (2006) 637–647.
[3] J. Rückert, O. Abboud, T. Zinner, R. Steinmetz, D. Hausheer, Quality adaptationin P2P video streaming based on objective QoE metrics, in: R. Bestak, L. Kencl,L. Li, J. Widmer, H. Yin (Eds.), Networking 2012, vol. 7290, Springer Berlin,Heidelberg, 2012, pp. 1–14.
[4] J.S. Lee, F. De Simone, N. Ramzan, Z. Zhao, E. Kurutepe, T. Sikora, J. Ostermann,E. Izquierdo, T. Ebrahimi, Subjective evaluation of scalable video coding forcontent distribution, in: Proceedings of the International Conference onMultimedia, 2010, pp. 65–72.

1620 A. Alvarez et al. / Computer Communications 36 (2013) 1608–1620
[5] J.S. Lee, F. De Simone, T. Ebrahimi, N. Ramzan, E. Izquierdo, Quality assessmentof multidimensional video scalability, IEEE Communications Magazine 50 (4)(2012) 38–46.
[6] L. Caviglione, C. Cervellera, Design, optimization and performance evaluationof a content distribution overlay for streaming, Computer Communications 34(12) (2011) 1497–1509.
[7] T. Zinner, O. Abboud, O. Hohlfeld, T. Hossfeld, P. Tran-Gia, Towards QoEManagement for Scalable Video Streaming, in: 21st ITC Specialist Seminar onMultimedia Applications-Traffic, Performance and QoE, 2010.
[8] T. Oelbaum, H. Schwarz, M. Wien, T. Wiegand, Subjective performanceevaluation of the SVC extension of H.264/AVC, in: 15th IEEE InternationalConference on Image Processing, ICIP 2008, 2008, pp. 2772–2775.
[9] F. Niedermeier, M. Niedermeier, H. Kosch, Quality assessment of the MPEG-4scalable video CODEC, <arXiv:0906.0667>, 2009.
[10] Y. Pitrey, M. Barkowsky, P. Le Callet, R. Pepion, Subjective quality assessmentof MPEG-4 Scalable Video Coding in a mobile scenario, in: Second EuropeanWorkshop on Visual Information Processing (EUVIP), 2010, pp. 86–91.
[11] A. Eichhorn, P. Ni, Pick your layers wisely – a quality assessment of H.264scalable video coding for mobile devices, in: Proceedings of the IEEEInternational Conference on Communications, Piscataway, NJ, USA, 2009, pp.5446–5451.
[12] J.-S. Lee, F. De Simone, T. Ebrahimi, Subjective quality evaluation via pairedcomparison: application to scalable video coding, IEEE Transactions onMultimedia 13 (5) (2011) 882–893.
[13] Y. Pitrey, U. Engelke, M. Barkowsky, R. Pepion, P. Le Callet, Subjective quality ofSVC-coded videos with different error-patterns concealed using spatialscalability, in: Third European Workshop on Visual Information Processing(EUVIP), 2011, pp. 180–185.
[14] N. Staelens, S. Moens, W. Van den Broeck, I. Mariën, B. Vermeulen, P. Lambert,R. Van de Walle, P. Demeester, Assessing quality of experience of IPTV andvideo on demand services in real-life environments, IEEE Transactions onBroadcasting 56 (4) (2010) 458–466.
[15] International Telecommunication Union, BT. 500–12. Methodology for thesubjective assessment of the quality of television pictures., Geneva,Switzerland, 2009, 53–56.
[16] J. Lloret, A. Canovas, J. Tomas, M. Atenas, A network management algorithmand protocol for improving QoE in mobile IPTV, Computer Communications 35(15) (2012) 1855–1870.
[17] I. Kofler, R. Kuschnig, H. Hellwagner, In-network adaptation of H.264/SVC forHD video streaming over 802.11 g networks, in: Proceedings of the 21stinternational workshop on Network and operating systems support for digitalaudio and video, 2011, pp. 9–14.
[18] D.T. Nguyen, J. Ostermann, Congestion control for scalable video streamingusing the scalability extension of H. 264/AVC, IEEE Journal of Selected Topics inSignal Processing 1 (2) (2007) 246–253.
[19] B. Görkemli, A.M. Tekalp, Adaptation strategies for MGS scalable videostreaming, Signal Processing: Image Communication 27 (6) (2012) 595–611.
[20] L. Pozueco, X.G. Pañeda, R. García, D. Melendi, S. Cabrero, Adaptable systembased on scalable video coding for high-quality video service, Computers &Electrical Engineering 39 (3) (2013) 775–789.
[21] ITU-T Rec. P.910, Subjective video quality assesment methods for multimediaapplications, 2008.
[22] Huynh-Thu Quan, M.-N. Garcia, F. Speranza, P. Corriveau, A. Raake, Study ofrating scales for subjective quality assessment of high-definition video, IEEETransactions on Broadcasting 57 (1) (2011) 1–14.
[23] ITU-T Rec. P.800, Methods for subjective determination of transmissionquality, 1996.
[24] M. Vaahteranoksa, T. Vuori, Threshold value for acceptable video quality usingsignal-to-noise ratio, 2007, p. 649405.
[25] A. Detti, G. Bianchi, C. Pisa, F.S. Proto, P. Loreti, W. Kellerer, S. Thakolsri, J.Widmer, SVEF: an open-source experimental evaluation framework for H.264scalable video streaming, in: IEEE Symposium on Computers andCommunications, ISCC 2009, 2009, pp. 36–41.
[26] S. Salsano, F. Ludovici, A. Ordine, Definition of a general and intuitive lossmodel for packet networks and its implementation in the Netem module inthe Linux kernel, Technical Report, University of Rome, Tor Vergata, 2009, p.60.