subject business economics paper no and title 6
TRANSCRIPT
BUSINESS ECONOMICS
PAPER NO. 6: INDUSTRIAL ECONOMICS
MODULE NO. 9: BARRIERS TO ENTRY AND MARKET STRUCTURE
Subject BUSINESS ECONOMICS
Paper No and Title 6, Industrial Economics
Module No and Title 9, Barriers to entry and Market structure
Module Tag BSE_P6_M9

BUSINESS ECONOMICS
PAPER NO. 6: INDUSTRIAL ECONOMICS
MODULE NO. 9: BARRIERS TO ENTRY AND MARKET STRUCTURE
TABLE OF CONTENTS
1. Learning Outcomes
2. Introduction
3. Market Structures: Various Types
3.1 Perfect Competition and Monopoly: The two Extremes
3.2 Monopolistic Competition and Oligopoly: More realistic structures
3.3 Market structures and their barriers to entry
4. Barriers to entry as determinants of market structures
4.1 Concentration and Natural barriers to entry
4.2 Concentration and Strategic barriers to entry
4.3 Concentration and Legal barriers to entry
4.3.1 Anti-Trust Laws
4.3.2 Regulation and Deregulation
5. Summary

BUSINESS ECONOMICS
PAPER NO. 6: INDUSTRIAL ECONOMICS
MODULE NO. 9: BARRIERS TO ENTRY AND MARKET STRUCTURE
1. Learning Outcomes
After studying this module, you shall be able to
Differentiate between important market structures like perfect competition, monopoly,
monopolistic competition and oligopoly
Learn what is meant by concentration of an industry and how it is measured.
Learn how various entry barriers affect the concentration of an industry and hence
determine the market structure.
2. Introduction
Market structure and Barriers to Entry
A barrier to entry is defined as something that prevents a new entrant from freely entering an
established market. The term entry barrier is related to market structures in a substantive manner.
For example, perfect competition is a kind of market structure that is characterized by a
homogeneous product and a large number of sellers and buyers and implies free entry and exit by
definition. Thus, perfect competition implies no barrier to entry. On the other hand, monopoly is a
kind of market structure that by definition has a single seller of a commodity and therefore
characterized by a lot of barriers that prevent any other firm from entering the industry. In this
lesson, the first section will be a brief introduction of the four types of market structures in
literature which will precede the section on how various types of barriers affect market structure
in terms of concentration of an industry or a market. The last section will deal with each type of
barrier and its impact on industry concentration which will then be followed by a summary of the
lesson.
3. Market Structures: Various types
Before we learn how market structures are determined by the barriers to entry and how different
barriers to entry induce market structures in turn, it would be a good idea to revise the basic
characteristics of the market structures that we all have studied in microeconomic theory. In
microeconomic theory, there are broadly four types of market structures: perfect competition,
monopoly, monopolistic competition and oligopoly. Out of these four types, perfect competition
and monopoly are considered to be two extremes, while monopolistic competition and oligopolies
come somewhere in between the two extremes.
The following sections and subsections will discuss the basic and important features of these four
types of market structures and will also make a comparative analysis.
3.1 Perfect competition & Monopoly: The two extremes
3.1.1 Perfect competition
BUSINESS ECONOMICS
PAPER NO. 6: INDUSTRIAL ECONOMICS
MODULE NO. 9: BARRIERS TO ENTRY AND MARKET STRUCTURE
Perfect competition, as the name suggests is the type of market structure which is characterized
by a very large number of both buyers and sellers who are engaged in selling an absolutely
homogeneous product and have got an identical cost structure. The number of sellers is so large
that none of them has a control over the price of the product which is determined by the forces of
demand and supply in the market. Thus, each seller takes price as given and then decides how
much output to produce and sell in the market. Further, under perfect competition, the entry as
well as exit of firms is absolutely free, i.e., there is no restriction of any kind on the firms to enter
or exit the market.
Thus perfect competition is a market structure where there are zero barriers to entry of any kind. .
However, since perfect competition requires a very large number of firms selling a homogenous
product, there is no product in the world that is characterized by such a type of market structure.
However, it can act as a benchmark for real world situations which can try to converge to it.
3.1.2 Monopoly
Monopoly is another extreme of market structures which is characterized by the existence of sole
producer and seller of a commodity in its market and so by virtue of that is also the maker of
price in the market. Since under monopoly, there is only firm in the industry it may charge any
price depending upon its discretion, so there is no supply function or curve in this market.
Thus, under monopoly there are infinite barriers to entry so that no other firm can enter the
market and it remains a monopoly. Such markets may either be natural, i.e., by virtue of a product
or created by certain strategic decisions of the monopolist. For example, electricity generation in
small countries like New Zealand, is a natural monopoly. Another example of natural monopoly
is Indian Railways that has been owned, managed and controlled by Indian government since
beginning.
3.2 Monopolistic Competition & Oligopoly: More realistic structures
While perfect competition and monopoly are at the two extremes of the market structures,
monopolistic competition and oligopoly are midway between them. We discuss the features of the
two market structures in the subsequent sub-sections.
3.2.1 Monopolistic Competition
Monopolistic competition is the kind of market structure where there are many buyers who all are
selling the same product but the product is not homogeneous or identical. Indeed this is the most
important characteristic of monopolistic competition that here a large number of producers are
competing to sell products that are differentiated either in terms of brand names or ingredients or
quality in a common market. We can find many examples of this around us. For example,
consider the market for tooth pastes or soaps in India. In the toothpaste market, a lot of buyers sell
their products like Babul, Colgate, Neem, Meswak, Dantakranti, etc. Another example could be
the market for airlines where these days a lot of discount airlines have entered the industry and
competing with each other to garner maximum market share. In this type of market structure,
BUSINESS ECONOMICS
PAPER NO. 6: INDUSTRIAL ECONOMICS
MODULE NO. 9: BARRIERS TO ENTRY AND MARKET STRUCTURE
competition is fierce and firms have to continuously keep updating and upgrading their product to
maintain and increase their customer base.
This type of market structure is characterized by free entry and exit of firms and therefore has low
barriers to entry.
3.2.2 Oligopoly
Finally, oligopoly is the kind of market structure where a few firms (two or more, but not many)
are competing in a market for a common product that may or may not be homogeneous. A
distinctive characteristic of an oligopolistic market is that a very small number of firms account
for a very large share of the entire market. Most of the markets in reality should in fact be better
called as oligopolies. For example, market for luxury cars where a few players dominate most of
the market share like Toyota, BMW, and Mercedes-Benz. In an oligopolistic market, since
number of players is small, therefore an action taken by even one player in the market has not
only an influence on its own profits but also on the profits of other players. Hence, the players in
the market make their decisions strategically keeping in mind the potential actions taken by other
players. For instance, recently when the market leader in car industry, Audi announced the launch
of 10 new cars in India, its challengers like Mercedes Benz and BMW also announced the launch
of 15 new models in the market. Thus, after Audi launches its new cars, its profits will not only
depend upon how better that model is from consumers’ point of view over its older models but
also on how better these models are as compared to the models introduced by its challengers
Mercedes Benz and BMW. This is the kind of structure where firms compete intensively to
capture maximum share in the market and hence this market is characterized by a lot of barriers
to entry.
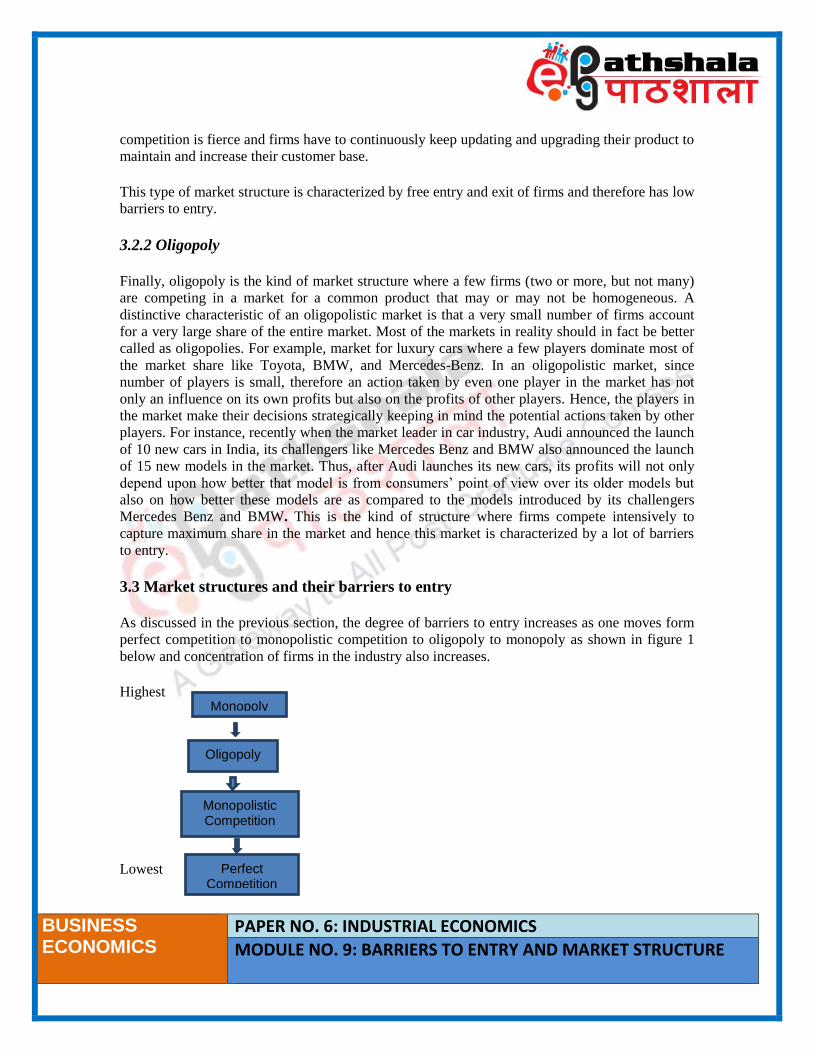
3.3 Market structures and their barriers to entry
As discussed in the previous section, the degree of barriers to entry increases as one moves form
perfect competition to monopolistic competition to oligopoly to monopoly as shown in figure 1
below and concentration of firms in the industry also increases.
Highest
Lowest
Monopoly
Oligopoly
Monopolistic Competition
ic
Perfect Competition
BUSINESS ECONOMICS
PAPER NO. 6: INDUSTRIAL ECONOMICS
MODULE NO. 9: BARRIERS TO ENTRY AND MARKET STRUCTURE
Fig.1: Market Structures in Descending order of Barriers to Entry
Concentration refers to the number and size distribution of firms in a particular industry or
market. If in an industry too few firms serve a large chunk or proportion of total demand for the
product of that industry, we say that the industry is highly concentrated. On the other hand, if an
industry has a very large number of firms each capturing a small share of the market, then we say
that the industry is not concentrated. So, clearly it implies that perfect competition is an industry
which has zero concentration while monopoly has highest concentration. On the other hand,
oligopoly has a very high market concentration. Thus, concentration is a very important feature of
a market structure. Indeed the factors that determine industry concentration would also determine
market structure. Thus, it becomes important to study the concept of concentration and its
determinants which in turn determine market structure. Amongst many determinants of
concentration, we will focus on various barriers to entry as the determinants of concentration.
This is the focus of our subsequent sub-sections.
4. Barriers to entry as determinants of market structures
Concentration of an industry is an indicator of the number and size of firms in a market structure
and hence it is an important way of differentiating between market structures. There are many
ways to define industry concentration. Box 1 clearly sketches the various measures of
concentration as they have evolved in the literature.
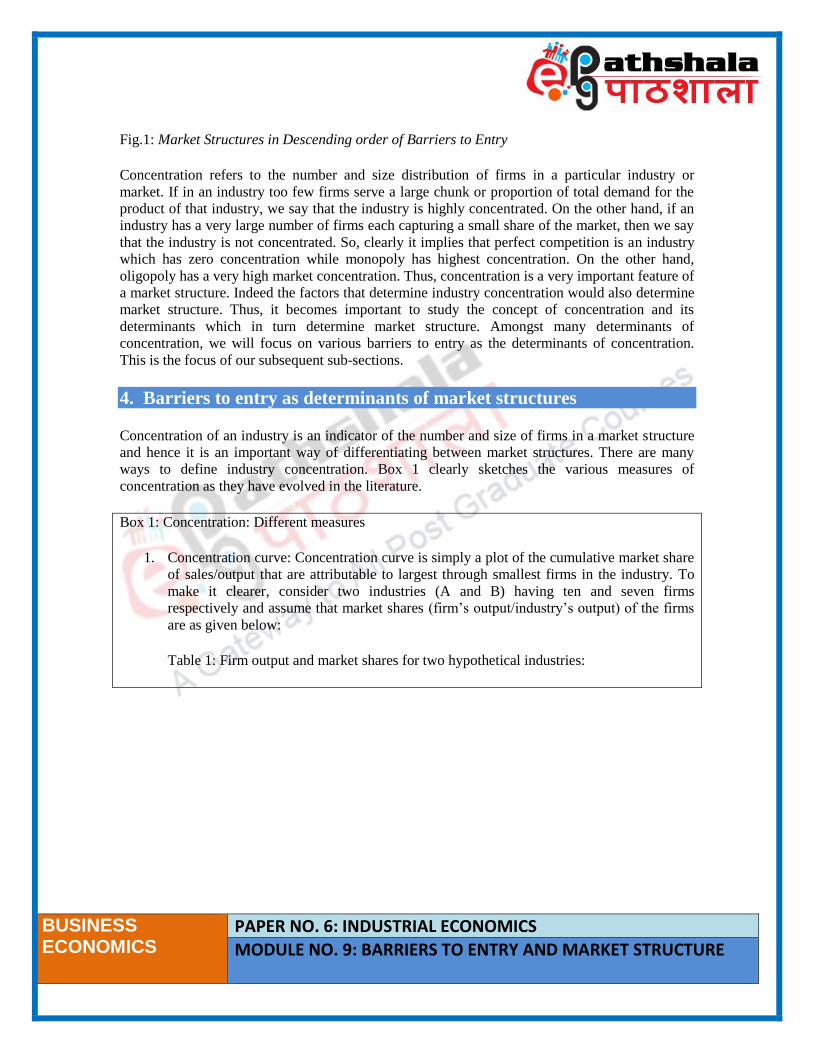
Box 1: Concentration: Different measures
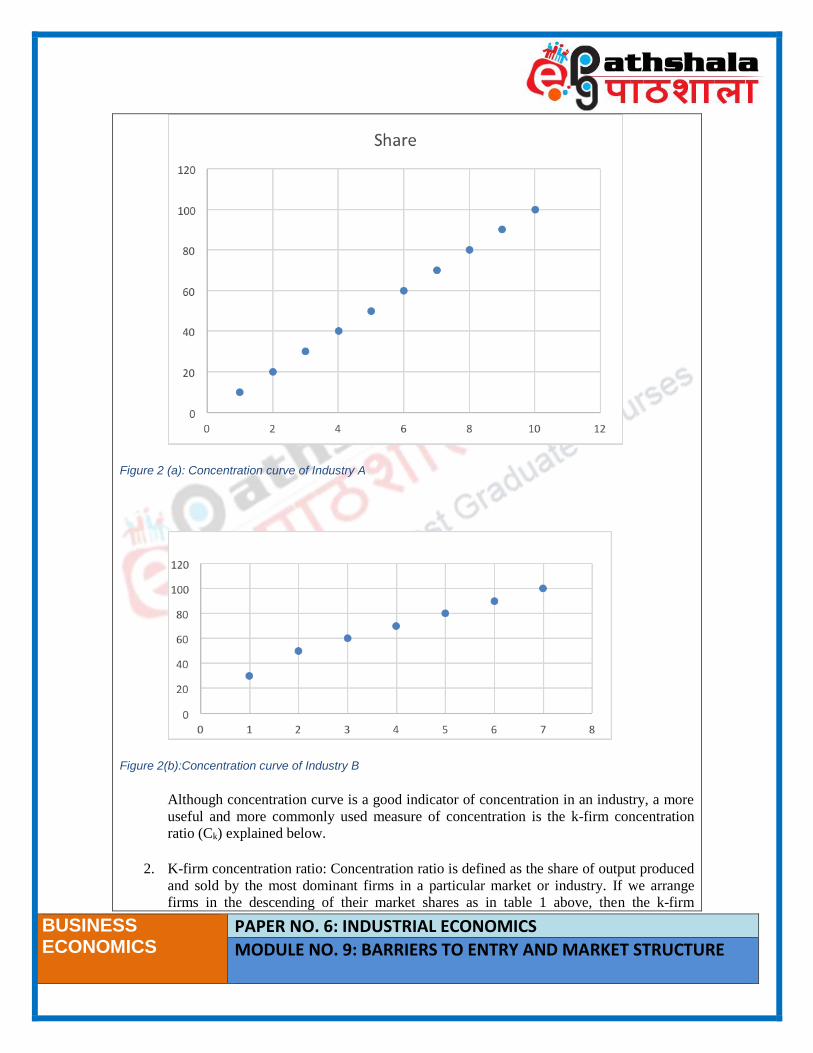
1. Concentration curve: Concentration curve is simply a plot of the cumulative market share
of sales/output that are attributable to largest through smallest firms in the industry. To
make it clearer, consider two industries (A and B) having ten and seven firms
respectively and assume that market shares (firm’s output/industry’s output) of the firms
are as given below:
Table 1: Firm output and market shares for two hypothetical industries:

BUSINESS ECONOMICS
PAPER NO. 6: INDUSTRIAL ECONOMICS
MODULE NO. 9: BARRIERS TO ENTRY AND MARKET STRUCTURE
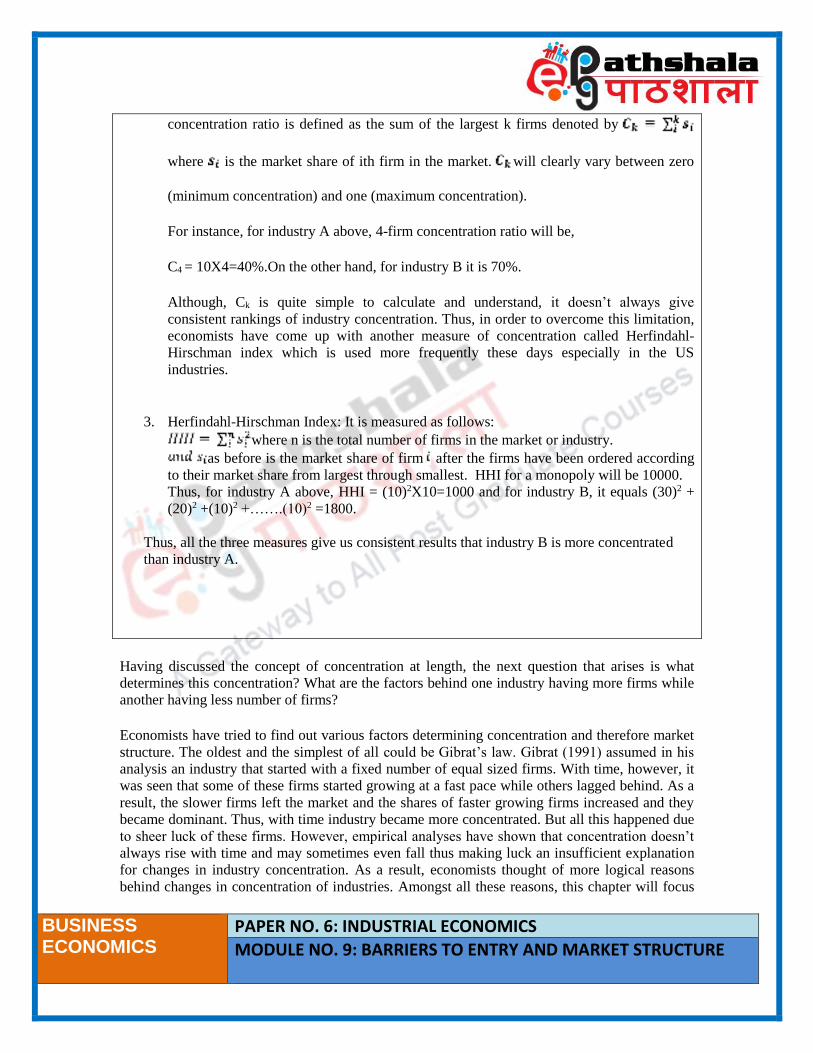
Fig. 2 below shows concentration curves for the two industries A and B. It is clear from
the figure that concentration curve of industry B when superimposed on that of industry
A lies above it as expected.
BUSINESS ECONOMICS
PAPER NO. 6: INDUSTRIAL ECONOMICS
MODULE NO. 9: BARRIERS TO ENTRY AND MARKET STRUCTURE
Figure 2 (a): Concentration curve of Industry A
Figure 2(b):Concentration curve of Industry B
Although concentration curve is a good indicator of concentration in an industry, a more
useful and more commonly used measure of concentration is the k-firm concentration
ratio (Ck) explained below.
2. K-firm concentration ratio: Concentration ratio is defined as the share of output produced
and sold by the most dominant firms in a particular market or industry. If we arrange
firms in the descending of their market shares as in table 1 above, then the k-firm
BUSINESS ECONOMICS
PAPER NO. 6: INDUSTRIAL ECONOMICS
MODULE NO. 9: BARRIERS TO ENTRY AND MARKET STRUCTURE
concentration ratio is defined as the sum of the largest k firms denoted by
where is the market share of ith firm in the market. will clearly vary between zero
(minimum concentration) and one (maximum concentration).
For instance, for industry A above, 4-firm concentration ratio will be,
C4 = 10X4=40%.On the other hand, for industry B it is 70%.
Although, Ck is quite simple to calculate and understand, it doesn’t always give
consistent rankings of industry concentration. Thus, in order to overcome this limitation,
economists have come up with another measure of concentration called Herfindahl-
Hirschman index which is used more frequently these days especially in the US
industries.
3. Herfindahl-Hirschman Index: It is measured as follows:
where n is the total number of firms in the market or industry.
as before is the market share of firm after the firms have been ordered according
to their market share from largest through smallest. HHI for a monopoly will be 10000.
Thus, for industry A above, HHI = (10)2X10=1000 and for industry B, it equals (30)2 +
(20)2 +(10)2 +…….(10)2 =1800.
Thus, all the three measures give us consistent results that industry B is more concentrated
than industry A.
Having discussed the concept of concentration at length, the next question that arises is what
determines this concentration? What are the factors behind one industry having more firms while
another having less number of firms?
Economists have tried to find out various factors determining concentration and therefore market
structure. The oldest and the simplest of all could be Gibrat’s law. Gibrat (1991) assumed in his
analysis an industry that started with a fixed number of equal sized firms. With time, however, it
was seen that some of these firms started growing at a fast pace while others lagged behind. As a
result, the slower firms left the market and the shares of faster growing firms increased and they
became dominant. Thus, with time industry became more concentrated. But all this happened due
to sheer luck of these firms. However, empirical analyses have shown that concentration doesn’t
always rise with time and may sometimes even fall thus making luck an insufficient explanation
for changes in industry concentration. As a result, economists thought of more logical reasons
behind changes in concentration of industries. Amongst all these reasons, this chapter will focus

BUSINESS ECONOMICS
PAPER NO. 6: INDUSTRIAL ECONOMICS
MODULE NO. 9: BARRIERS TO ENTRY AND MARKET STRUCTURE
on entry barriers. The remainder of this lesson is devoted to how
various kinds of entry barriers affect industry concentration and
therefore market structure.
4.1 Concentration and Natural barriers to entry
Barriers to entry are the very basic determinants of market structures. For instance, since entry
and exit is costless under perfect competition, so this structure has lowest concentration while
under monopoly, entry is completely restricted which entails the existence of a single firm in the
market. As we know, one important classification of barriers to entry is between natural barriers
and strategic barriers. Natural barriers to entry are those that arise due to the basic demand and
cost conditions of a market.
The simplest way to think about natural barriers is to think of natural monopoly. Natural
monopoly arises when the average cost of production continuously declines as, more and more
output is produced, thus necessitating the presence of a single firm in the market. In case, there
are many firms and average cost is declining, the firms can merge and converge to a single firm.
4.2 Concentration and Strategic barriers to entry
Strategic barriers to entry are those barriers that are artificially created by the actions of
incumbents in order to prevent the entry of newcomers into a market. In such cases, the
incumbent firm may use particular pricing strategies or even capacity expansion to pose threats to
the potential entrants and therefore deter their entry. This could be understood by considering a
simple two-stage game in which first a potential entrant called challenger decides whether to
enter the market or stay out and in the second stage the incumbent who has a monopoly in the
market decides whether to accommodate the entrant or fight with it. If it decides to fight with the
entrant, then it will lower its price, called predatory pricing and therefore prevent customers from
purchasing from the entrant while if it decides to accommodate it then it may form a cartel with
the entrant and may let it enter.
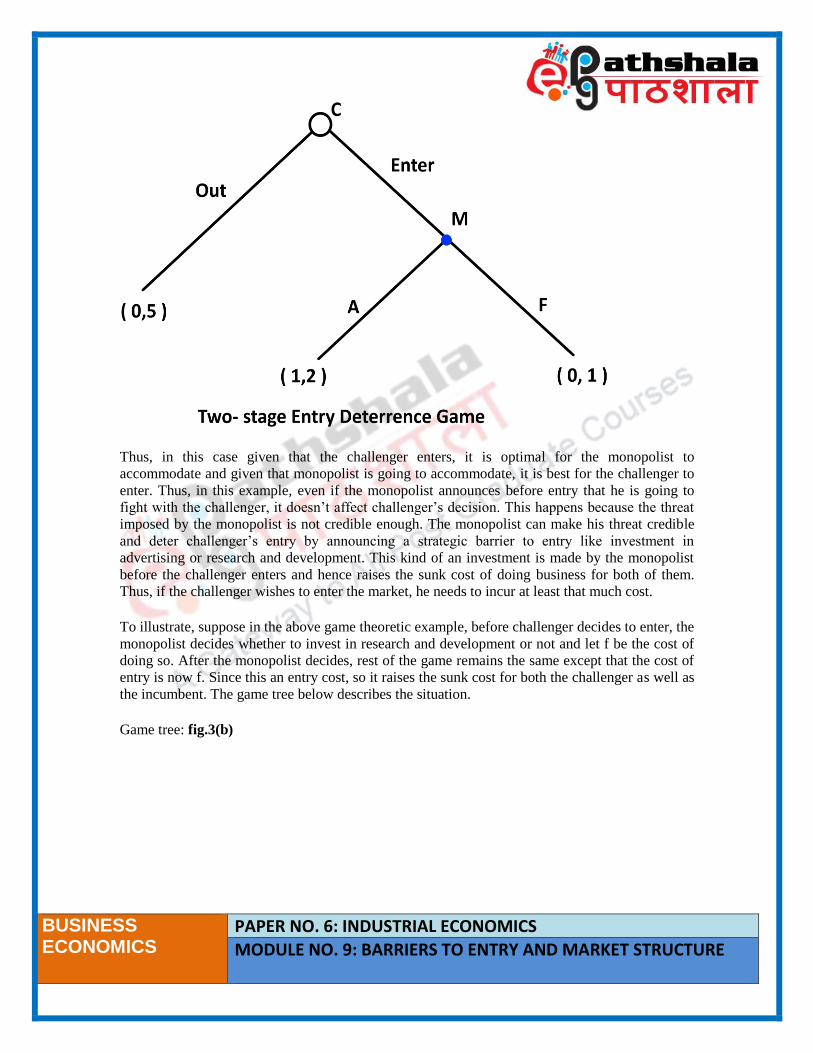
The above situation can be represented in the form of a game tree as follows:
Fig.3 (a)
BUSINESS ECONOMICS
PAPER NO. 6: INDUSTRIAL ECONOMICS
MODULE NO. 9: BARRIERS TO ENTRY AND MARKET STRUCTURE
Thus, in this case given that the challenger enters, it is optimal for the monopolist to
accommodate and given that monopolist is going to accommodate, it is best for the challenger to
enter. Thus, in this example, even if the monopolist announces before entry that he is going to
fight with the challenger, it doesn’t affect challenger’s decision. This happens because the threat
imposed by the monopolist is not credible enough. The monopolist can make his threat credible
and deter challenger’s entry by announcing a strategic barrier to entry like investment in
advertising or research and development. This kind of an investment is made by the monopolist
before the challenger enters and hence raises the sunk cost of doing business for both of them.
Thus, if the challenger wishes to enter the market, he needs to incur at least that much cost.
To illustrate, suppose in the above game theoretic example, before challenger decides to enter, the
monopolist decides whether to invest in research and development or not and let f be the cost of
doing so. After the monopolist decides, rest of the game remains the same except that the cost of
entry is now f. Since this an entry cost, so it raises the sunk cost for both the challenger as well as
the incumbent. The game tree below describes the situation.
Game tree: fig.3(b)

BUSINESS ECONOMICS
PAPER NO. 6: INDUSTRIAL ECONOMICS
MODULE NO. 9: BARRIERS TO ENTRY AND MARKET STRUCTURE
Note that in this game as depicted in game tree in Fig.3(b),first payoff in each cell belongs to the
monopolist(M) while the second one belongs to the challenger(C) unlike the situation in Fig.3(a)
above.
In the above game, it is clear that after the monopolist decides to invest, it is optimal for the
challenger not to enter as long as f >1 but he would always enter if the monopolist does not invest
in the strategic barrier to entry(SBE).Given the optimal strategy of challenger, it is optimal for the
monopolist to invest as long as 5-f > 2,i.e. if f<2.Thus, for 1<f<2, the SPNE of the above game is
that monopolist invests in the SBE and accommodates the challenger if he enters and challenger
stays out if monopolist invests and enters if monopolist doesn’t invest.
Thus, the monopolist succeeds in deterring entry for 1<f<2 and the concentration remains high.
4.3 Concentration and Legal Barriers to Entry
Another determinant of concentration of an industry could be certain legal barriers imposed by
government like license fee, patents etc. According to Sutton (1991, 1999), these types of costs
are sunk costs that have to be incurred by a firm at the time of entry and may play an important
role in determining the industry concentration. Sutton explains this by using the following two-
stage game:
1. In stage I the firms incur this sunk cost and decide whether to enter the industry or not.
2. In stage II the firms compete in output or price once they have entered.
According to Sutton, these sunk costs may be endogenous as well as exogenous but they produce
quite different results. The current section deals with the case of exogenous costs.
BUSINESS ECONOMICS
PAPER NO. 6: INDUSTRIAL ECONOMICS
MODULE NO. 9: BARRIERS TO ENTRY AND MARKET STRUCTURE
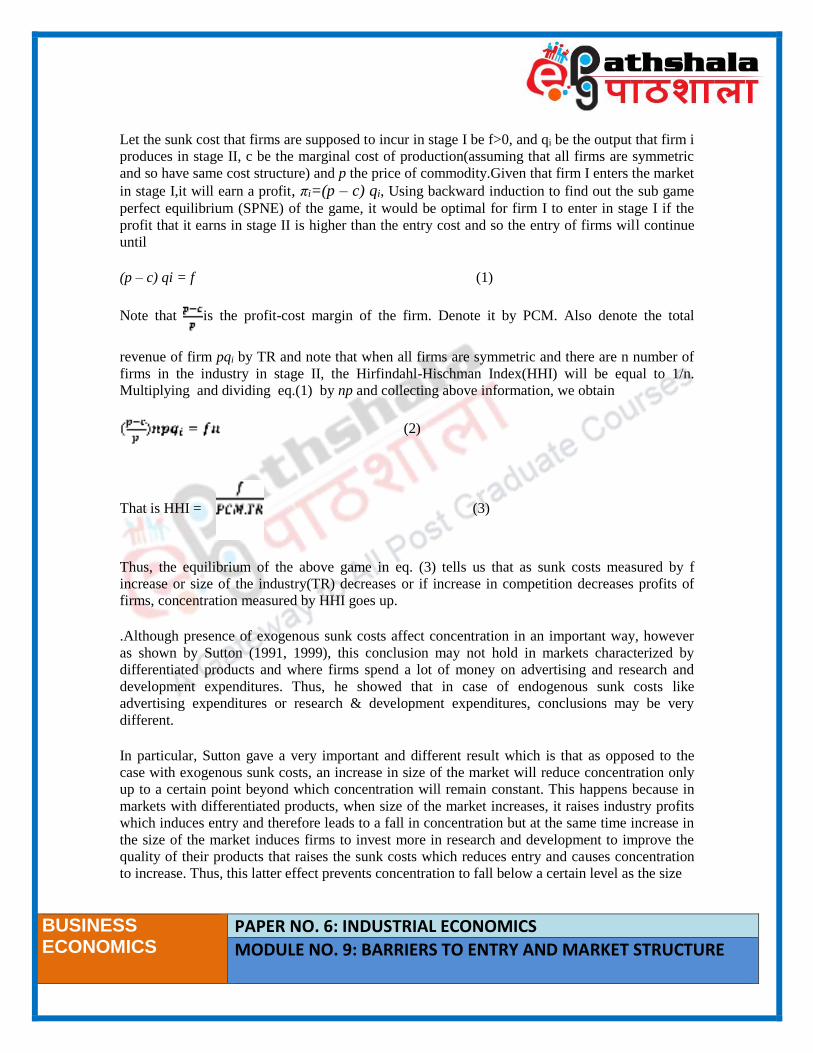
Let the sunk cost that firms are supposed to incur in stage I be f>0, and qi be the output that firm i
produces in stage II, c be the marginal cost of production(assuming that all firms are symmetric
and so have same cost structure) and p the price of commodity.Given that firm I enters the market
in stage I,it will earn a profit, πi=(p – c) qi, Using backward induction to find out the sub game
perfect equilibrium (SPNE) of the game, it would be optimal for firm I to enter in stage I if the
profit that it earns in stage II is higher than the entry cost and so the entry of firms will continue
until
(p – c) qi = f (1)
Note that is the profit-cost margin of the firm. Denote it by PCM. Also denote the total
revenue of firm pqi by TR and note that when all firms are symmetric and there are n number of
firms in the industry in stage II, the Hirfindahl-Hischman Index(HHI) will be equal to 1/n.
Multiplying and dividing eq.(1) by np and collecting above information, we obtain
(2)
That is HHI = (3)
Thus, the equilibrium of the above game in eq. (3) tells us that as sunk costs measured by f
increase or size of the industry(TR) decreases or if increase in competition decreases profits of
firms, concentration measured by HHI goes up.
.Although presence of exogenous sunk costs affect concentration in an important way, however
as shown by Sutton (1991, 1999), this conclusion may not hold in markets characterized by
differentiated products and where firms spend a lot of money on advertising and research and
development expenditures. Thus, he showed that in case of endogenous sunk costs like
advertising expenditures or research & development expenditures, conclusions may be very
different.
In particular, Sutton gave a very important and different result which is that as opposed to the
case with exogenous sunk costs, an increase in size of the market will reduce concentration only
up to a certain point beyond which concentration will remain constant. This happens because in
markets with differentiated products, when size of the market increases, it raises industry profits
which induces entry and therefore leads to a fall in concentration but at the same time increase in
the size of the market induces firms to invest more in research and development to improve the
quality of their products that raises the sunk costs which reduces entry and causes concentration
to increase. Thus, this latter effect prevents concentration to fall below a certain level as the size
BUSINESS ECONOMICS
PAPER NO. 6: INDUSTRIAL ECONOMICS
MODULE NO. 9: BARRIERS TO ENTRY AND MARKET STRUCTURE
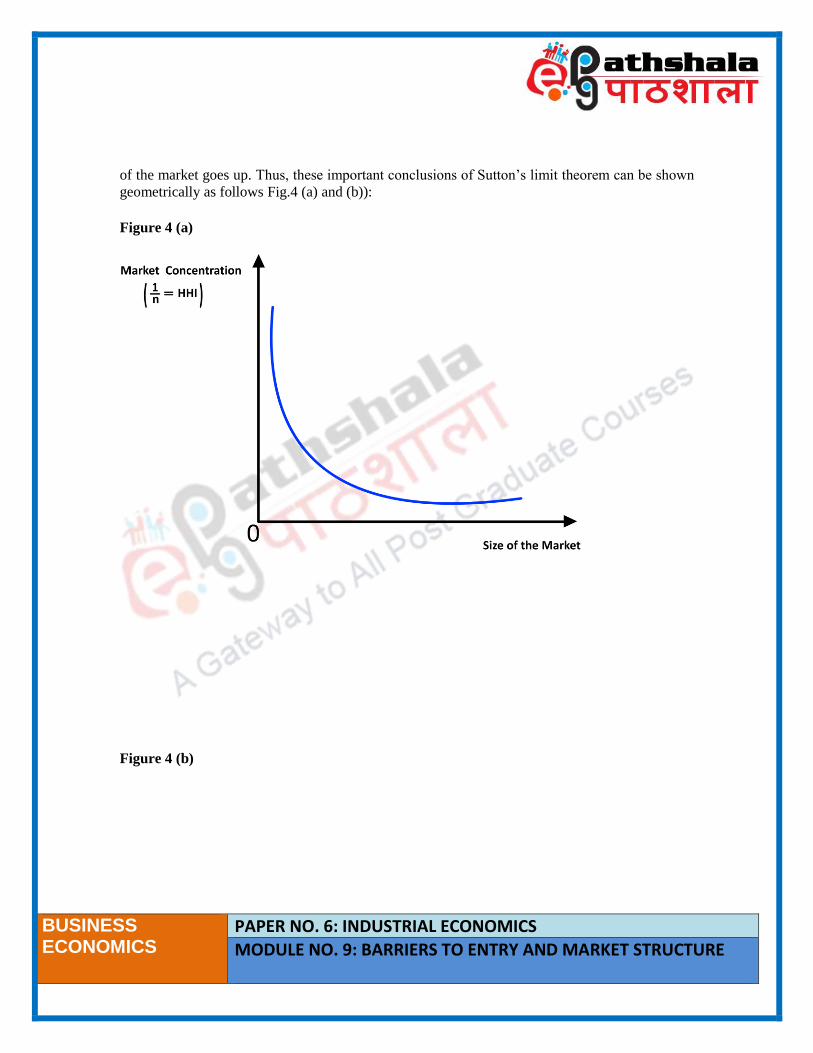
of the market goes up. Thus, these important conclusions of Sutton’s limit theorem can be shown
geometrically as follows Fig.4 (a) and (b)):
Figure 4 (a)
Figure 4 (b)
BUSINESS ECONOMICS
PAPER NO. 6: INDUSTRIAL ECONOMICS
MODULE NO. 9: BARRIERS TO ENTRY AND MARKET STRUCTURE
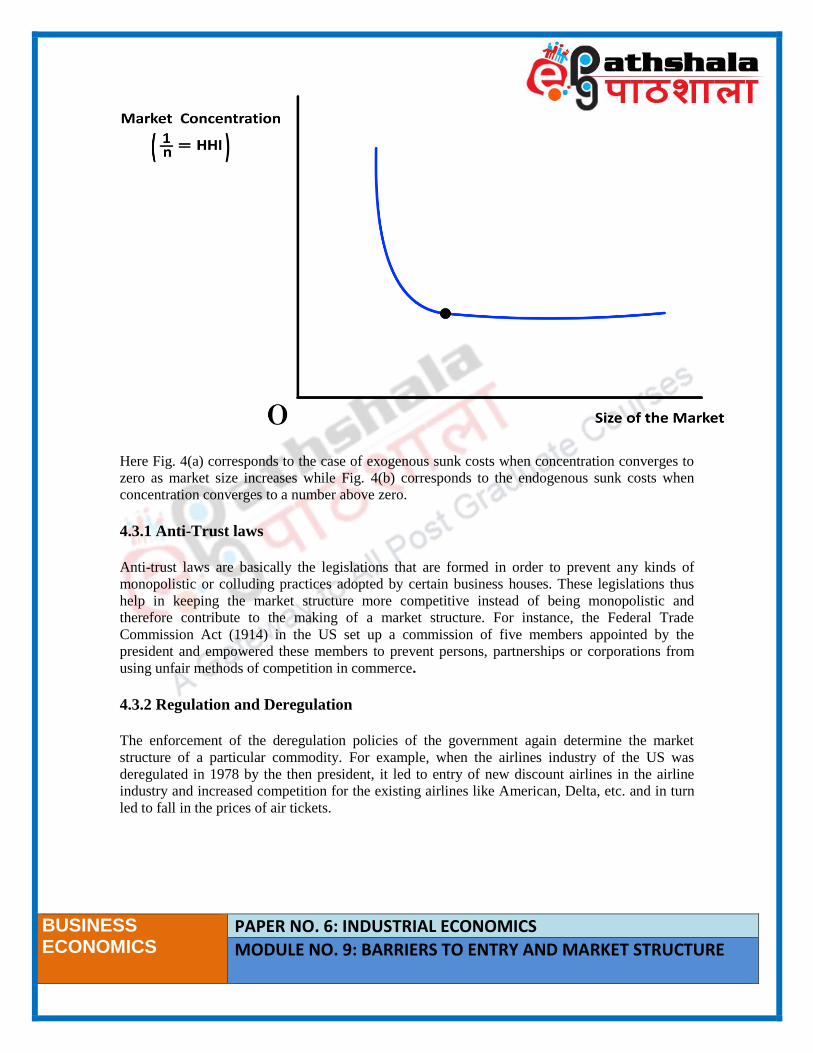
Here Fig. 4(a) corresponds to the case of exogenous sunk costs when concentration converges to
zero as market size increases while Fig. 4(b) corresponds to the endogenous sunk costs when
concentration converges to a number above zero.
4.3.1 Anti-Trust laws
Anti-trust laws are basically the legislations that are formed in order to prevent any kinds of
monopolistic or colluding practices adopted by certain business houses. These legislations thus
help in keeping the market structure more competitive instead of being monopolistic and
therefore contribute to the making of a market structure. For instance, the Federal Trade
Commission Act (1914) in the US set up a commission of five members appointed by the
president and empowered these members to prevent persons, partnerships or corporations from
using unfair methods of competition in commerce.
4.3.2 Regulation and Deregulation
The enforcement of the deregulation policies of the government again determine the market
structure of a particular commodity. For example, when the airlines industry of the US was
deregulated in 1978 by the then president, it led to entry of new discount airlines in the airline
industry and increased competition for the existing airlines like American, Delta, etc. and in turn
led to fall in the prices of air tickets.

BUSINESS ECONOMICS
PAPER NO. 6: INDUSTRIAL ECONOMICS
MODULE NO. 9: BARRIERS TO ENTRY AND MARKET STRUCTURE
4. Summary
Market structure may be defined as the number and distribution of firms in a market for a
commodity.
There are mainly four types of market structures viz. perfect competition, monopoly,
monopolistic competition and oligopoly.
While monopoly, oligopoly and monopolistic competition are found in reality, perfect
competition is used as useful reference or benchmark.
Industry concentration is a very important indicator of market structure and various
measures are used to measure it like concentration curve, concentration ratio and
Herfindahl-Hirschman Index.
All types of barriers viz. natural, strategic and legal contribute in different ways to the
industry concentration and hence determine the market structure.
While in the presence of exogenous sunk costs like license fees, an increase in market
size leads to a continuous fall in concentration, in the presence of endogenous sunk costs
like advertising expenditure, concentration falls only up to a certain point on the other
hand.